

Recenzja komputera Beelink GTI13 Ultra mini PC: Alternatywa dla Mac Mini z procesorem Intel Core i9
Pełen funkcji.
Za 600 USD, GTI13 Ultra to niesamowity zwrot z inwestycji, ponieważ jest standardowo wyposażony w 32 GB pamięci RAM, 1 TB SSD, procesor Intel 13. generacji, zintegrowany mikrofon, głośniki i wiele więcej, czego brakuje większości mini PC w tym przedziale cenowym.Allen Ngo, 👁 Allen Ngo (tłumaczenie DeepL / Ninh Duy) Opublikowany 🇺🇸 🇫🇷 ...
Werdykt - doskonałe funkcje i jakość wykonania w tej cenie
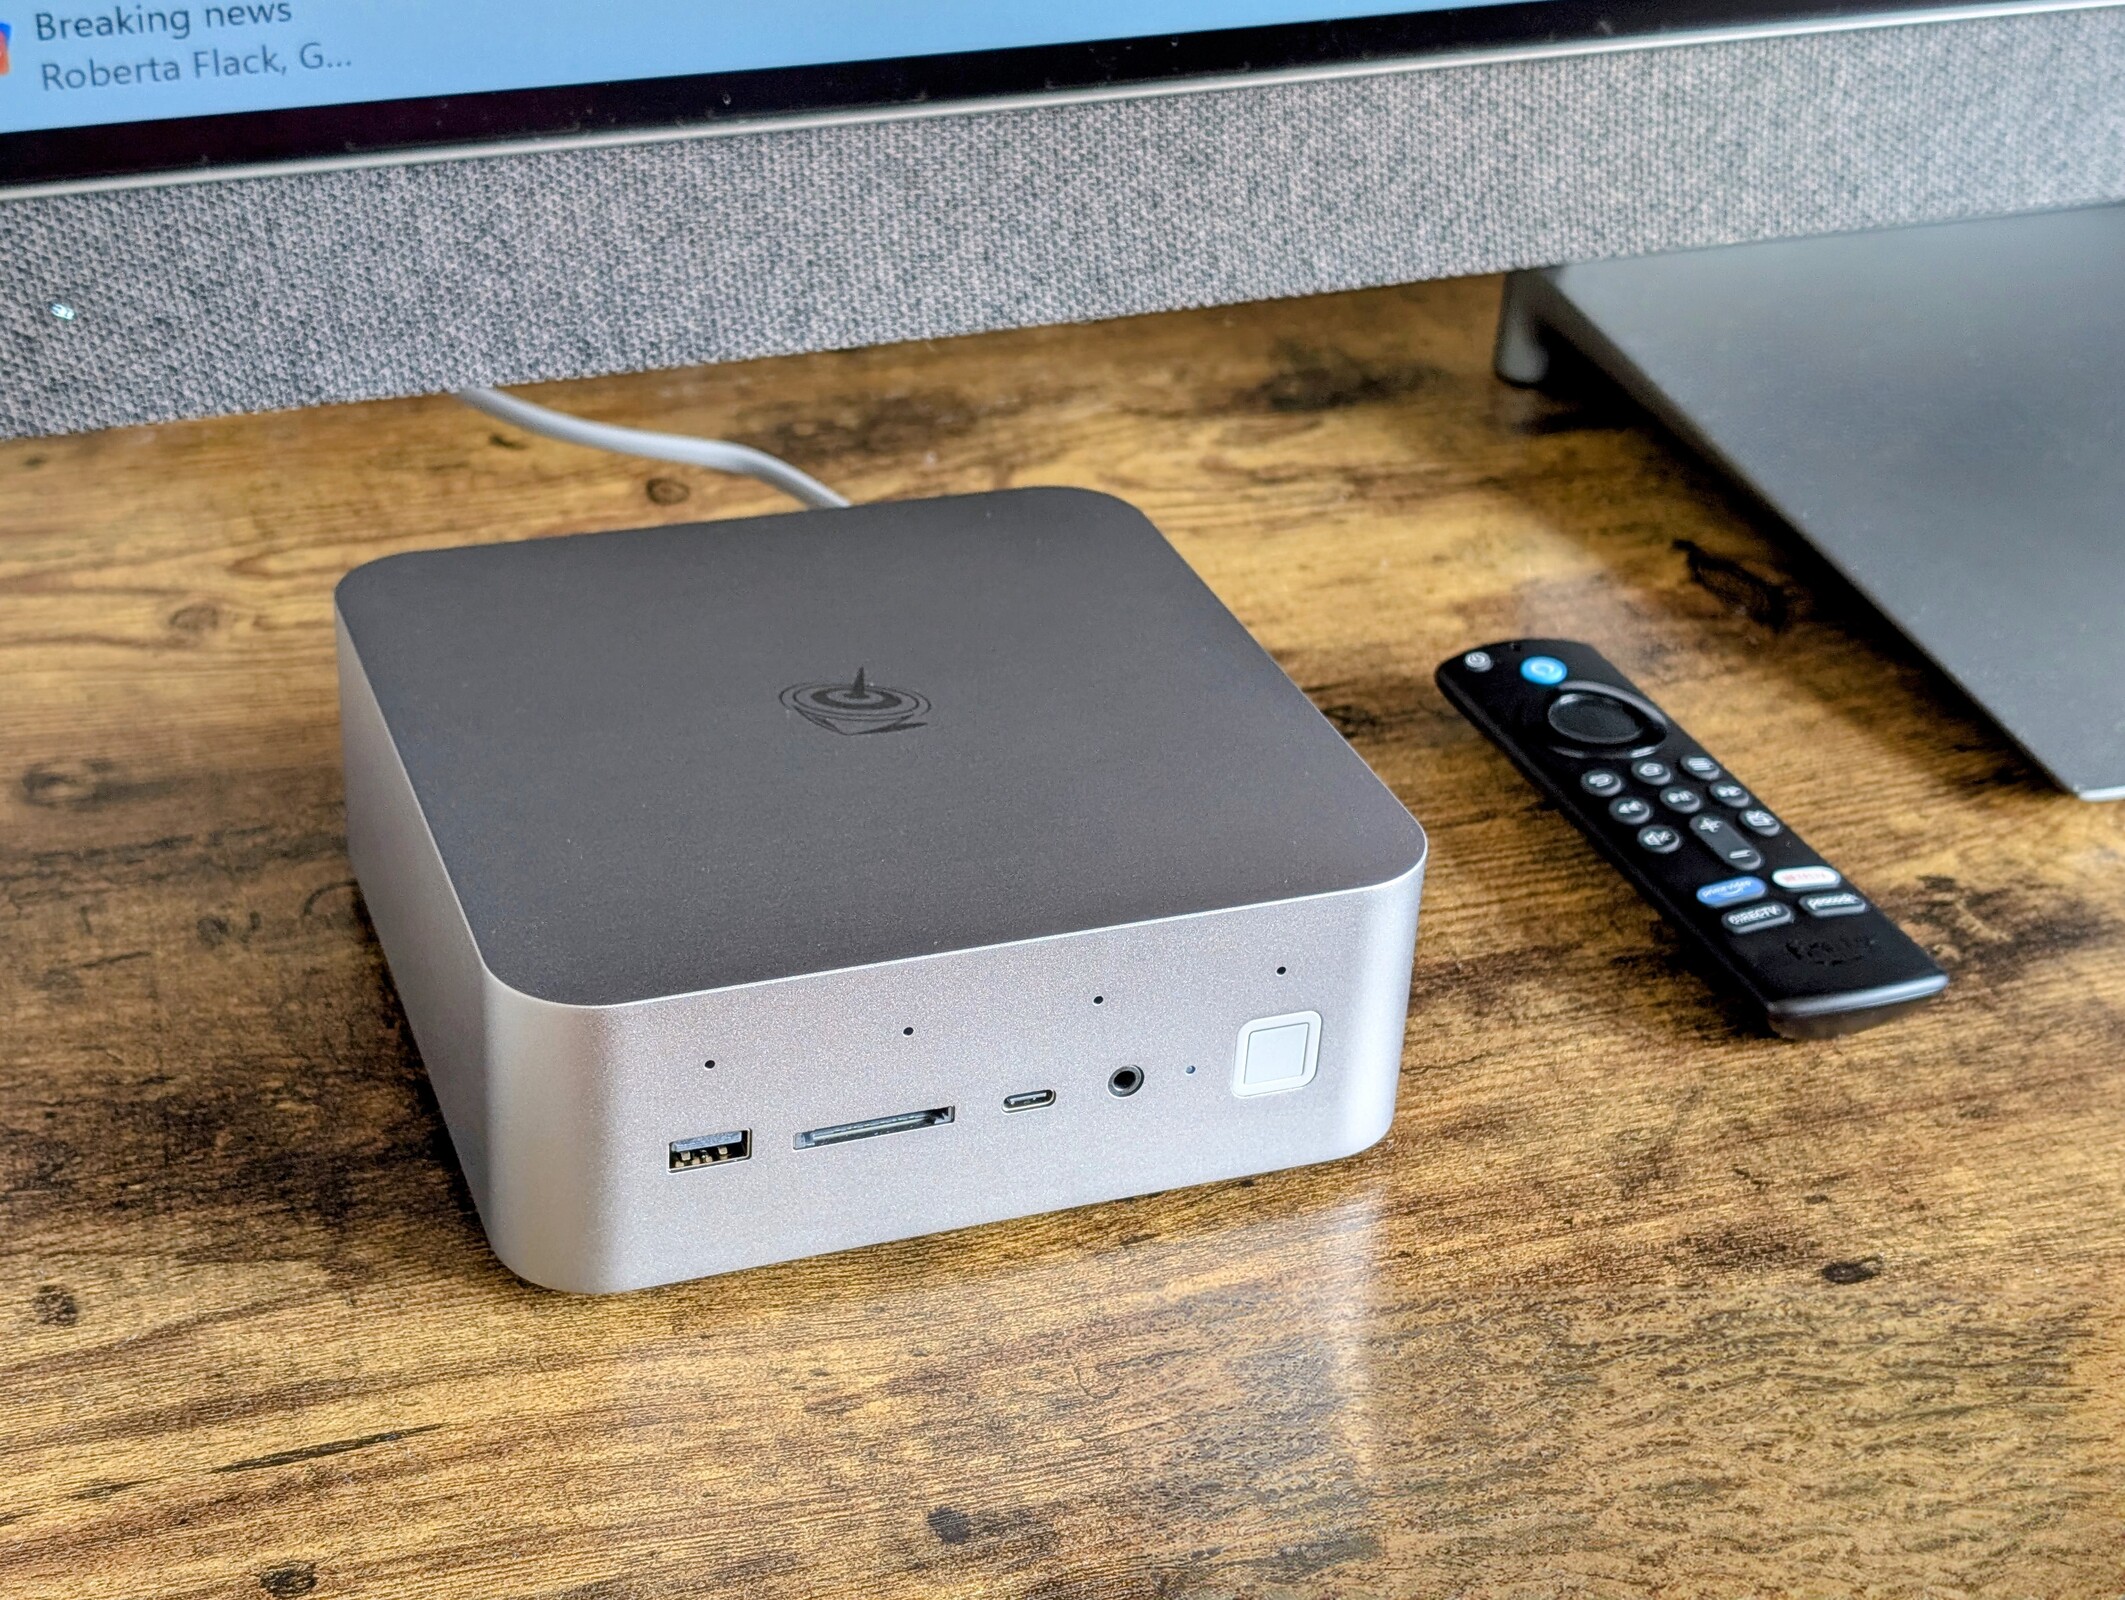
GTI13 Ultra jest bardzo atrakcyjny, zwłaszcza po niedawnym przeprojektowaniu. Jest on wyposażony w wiele funkcji, których nie można znaleźć w innych mini PC w podobnej cenie, w tym zintegrowane głośniki, zintegrowany zasilacz, zintegrowany mikrofon i wsparcie dla eGPU poprzez bezpośrednie złącze PCIe x8. Wygląd inspirowany Apple jest również prawdopodobnie bardziej profesjonalny niż w dużej mierze plastikowe konstrukcje innych mini PC, takich jak NucBox K11.
Proszę pamiętać o kilku istotnych zastrzeżeniach. Po pierwsze, procesor Core i9-13900HK jest tylko nieznacznie szybszy od zeszłorocznego Core i9-12900HK w modelu GTI12 Ultra w najlepszym przypadku. Użytkownicy z ograniczonym budżetem mogą zatem rozważyć zeszłoroczny model, ponieważ wpływ na wydajność będzie minimalny. Po drugie, wydajność zintegrowanej grafiki jest słaba jak na dzisiejsze standardy, ponieważ nawet tańsze opcje AMD ze średniej półki, takie jak Beelink GTR7 mogą biegać okrążenia wokół Iris Xe 96 EUs. Ze względu na słaby zintegrowany procesor graficzny Intela, z pewnością będą Państwo chcieli wykorzystać opcjonalną stację dokującą EX Docking Station do wszelkich poważnych prac graficznych. Mimo to, pochwalamy przystępną cenę początkową 600 USD, biorąc pod uwagę dołączoną pamięć RAM, dysk SSD, system operacyjny Windows 11 Pro i inne pożądane wbudowane funkcje.
Za
Przeciw
Cena i dostępność
Amazon wysyła obecnie GTI13 Ultra z 32 GB pamięci RAM i 1 TB SSD w cenie 600 USD. Alternatywnie, użytkownicy mogą zakupić bezpośrednio od producenta w tej samej cenie.
Potencjalni konkurenci w porównaniu
Obraz | Model / recenzja | Cena | Waga | Wysokość | Ekran |
|---|---|---|---|---|---|
1. 79.9% 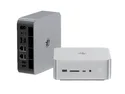 | Beelink GTI13 Ultra Intel Core i9-13900HK ⎘ Intel Iris Xe Graphics G7 96EUs ⎘ 32 GB Pamięć, 1024 GB SSD | Amazon: $599.00 Cena katalogowa: 600 USD | 1.3 kg | 55.8 mm | x |
2. 77.1%  | Beelink SER9 AMD Ryzen AI 9 HX 370 ⎘ AMD Radeon 890M ⎘ 32 GB Pamięć, 1024 GB SSD | Amazon: $949.00 Cena katalogowa: 1000 USD | 814 g | 44.7 mm | x |
3. 86.3% v7 (old)  | Beelink GTR7 7840HS AMD Ryzen 7 7840HS ⎘ AMD Radeon 780M ⎘ 32 GB Pamięć, 1024 GB SSD | Cena katalogowa: 790 USD | 890 g | 48.8 mm | x |
4. 72% 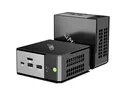 | GMK EVO-X1 AMD Ryzen AI 9 HX 370 ⎘ AMD Radeon 890M ⎘ 32 GB Pamięć, 1024 GB SSD | Amazon: $1,049.99 Cena katalogowa: 900 USD | 595 g | 63.2 mm | x |
5. 77.2% 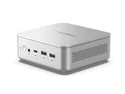 | Minisforum EliteMini AI370 AMD Ryzen AI 9 HX 370 ⎘ AMD Radeon 890M ⎘ 32 GB Pamięć, 1024 GB SSD | Amazon: 1. $289.90 MINISFORUM EliteMini TH50 Mi... 2. $44.99 PowerHOOD 19V AC/DC Adapter ... Cena katalogowa: 1499 EUR | 472 g | 46.9 mm | x |
6. 67.3%  | GMK NucBox K9 Intel Core Ultra 5 125H ⎘ Intel Arc 7-Core iGPU ⎘ 32 GB Pamięć, 1024 GB SSD | Amazon: $639.99 Cena katalogowa: 560 USD | 528 g | 47 mm | x |
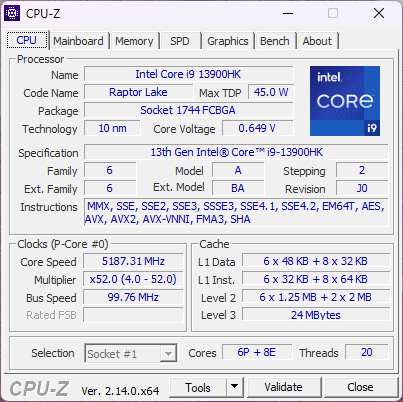
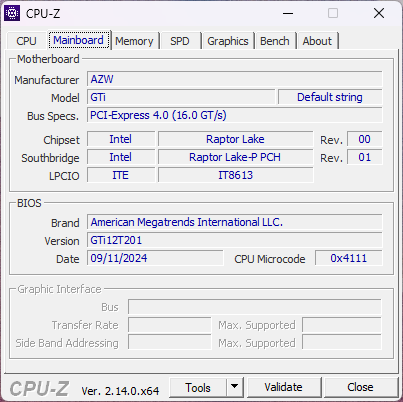
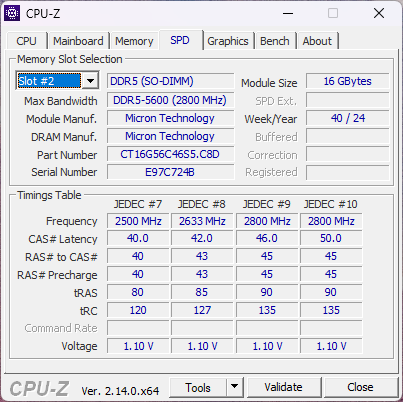
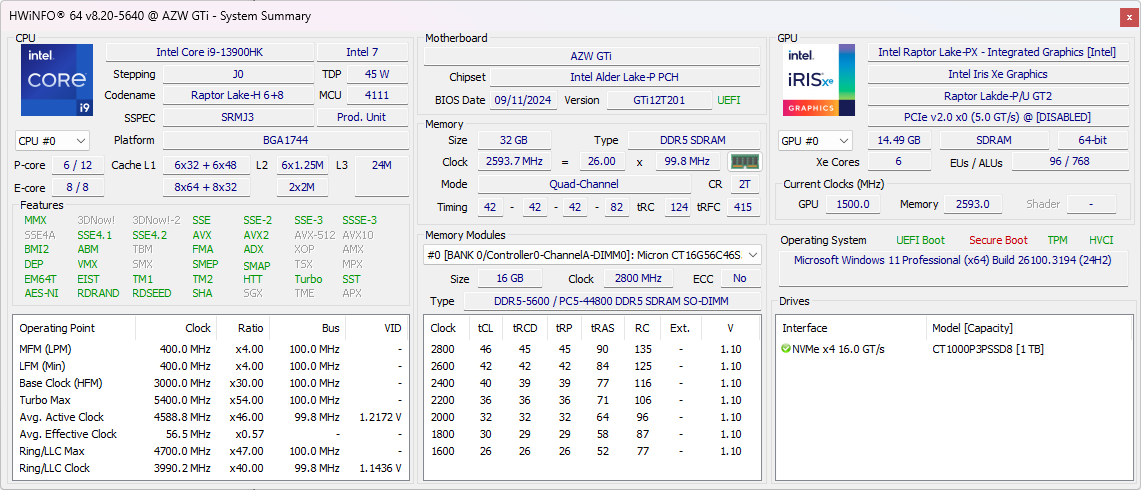
GTI13 Ultra zastępuje procesor 12. generacji Alder Lake Core i9-12900HK z GTI12 Ultra procesorem 13. generacji Raptor Lake Core i9-13900HK. Konstrukcja obudowy i funkcje są poza tym identyczne, więc jedyną istotną różnicą między tymi dwoma modelami jest zaktualizowany procesor. Zalecamy zapoznanie się z naszą recenzją GTI12 Ultra, aby dowiedzieć się więcej o fizycznych cechach systemu.
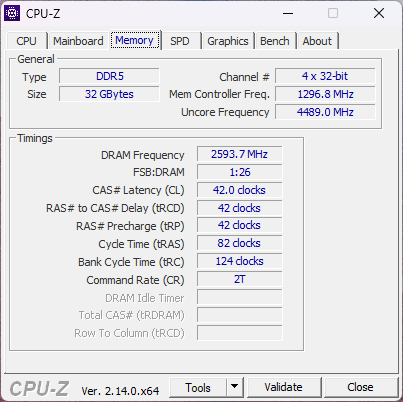
Nasza jednostka testowa to podstawowa jednostka SKU z 32 GB pamięci RAM i 1 TB SSD za około 600 USD. Wszystkie konfiguracje są dostępne w kolorze srebrnym lub szarym z tym samym procesorem Core i9. Nie ma do wyboru jednostek SKU typu barebone.
GTI14 Ultra jest również obecnie dostępny w wersji z procesorem Intel 1. generacji (lub nieformalnie 14. generacji) Meteor Lake Core Ultra 9 185H.
Alternatywy dla GTI13 Ultra obejmują inne wysokowydajne minikomputery, takie jak Minisforum EliteMini AI370, GMK EVO-X1 lub Asus ROG NUC 14. Seria GTI Ultra wyróżnia się pełnowymiarowym interfejsem PCIe x8 do obsługi zewnętrznych kart graficznych za pośrednictwem stacji dokującej EX.
Więcej recenzji Beelink:
Specyfikacje
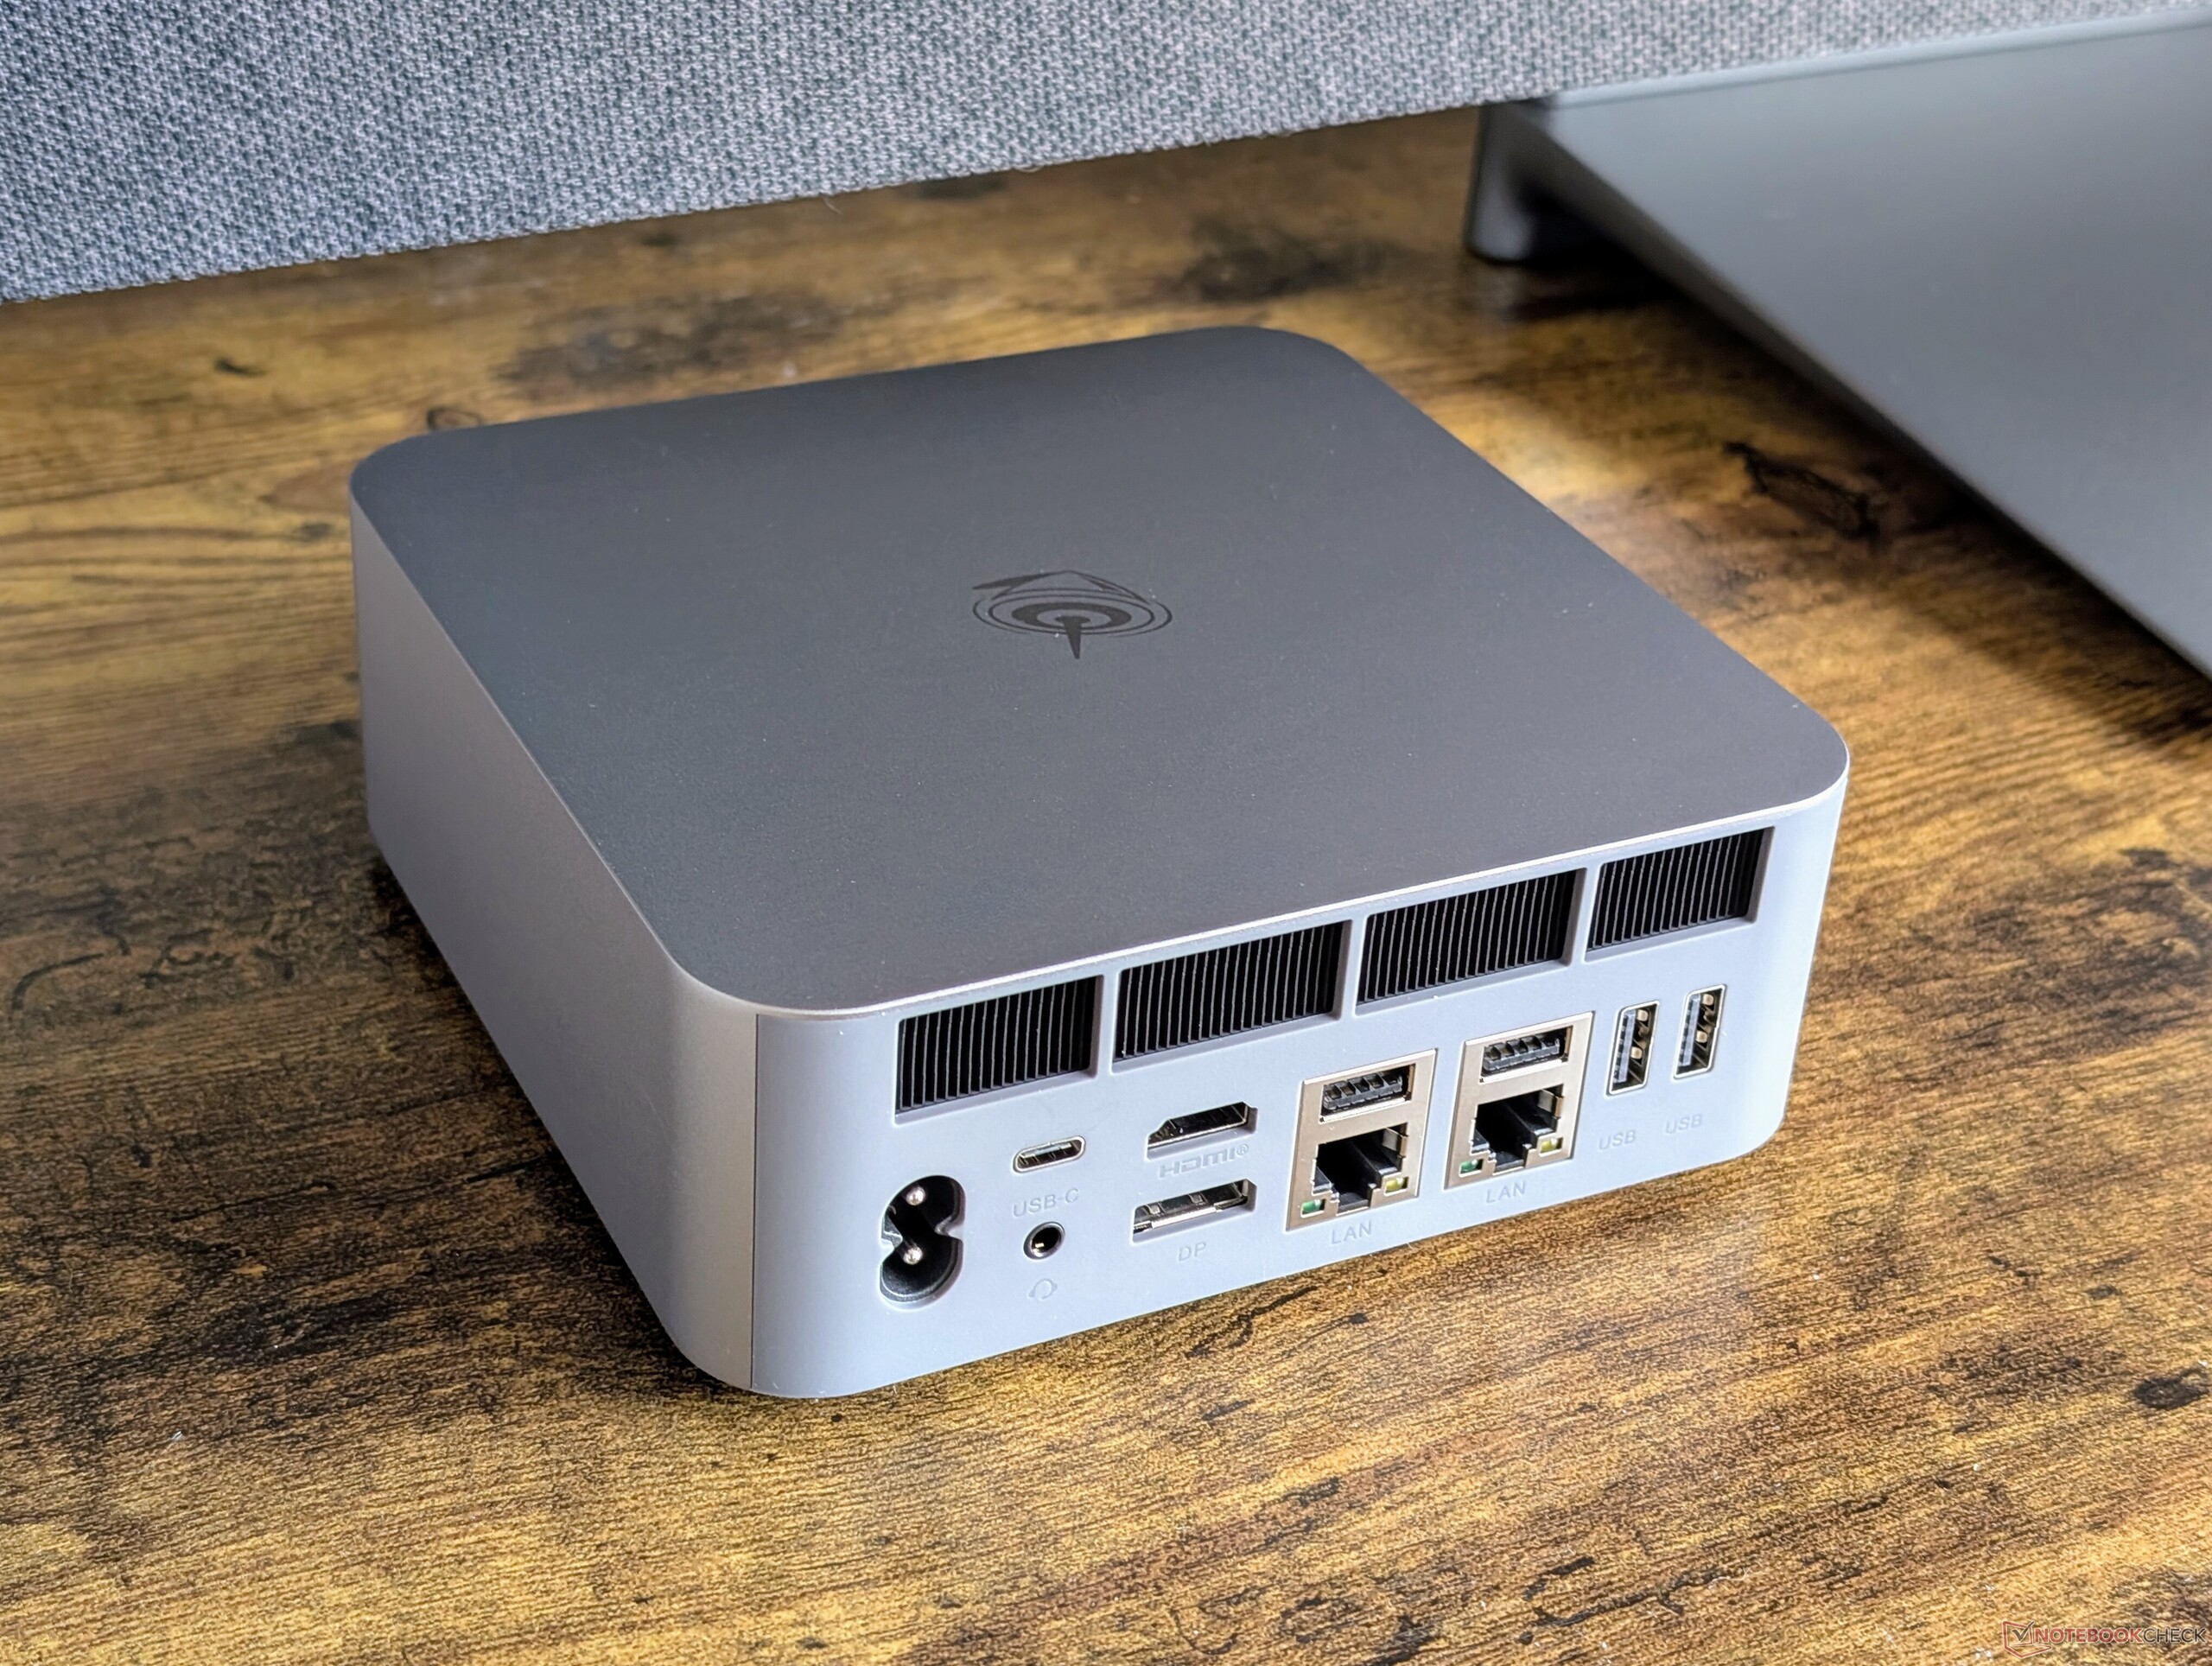
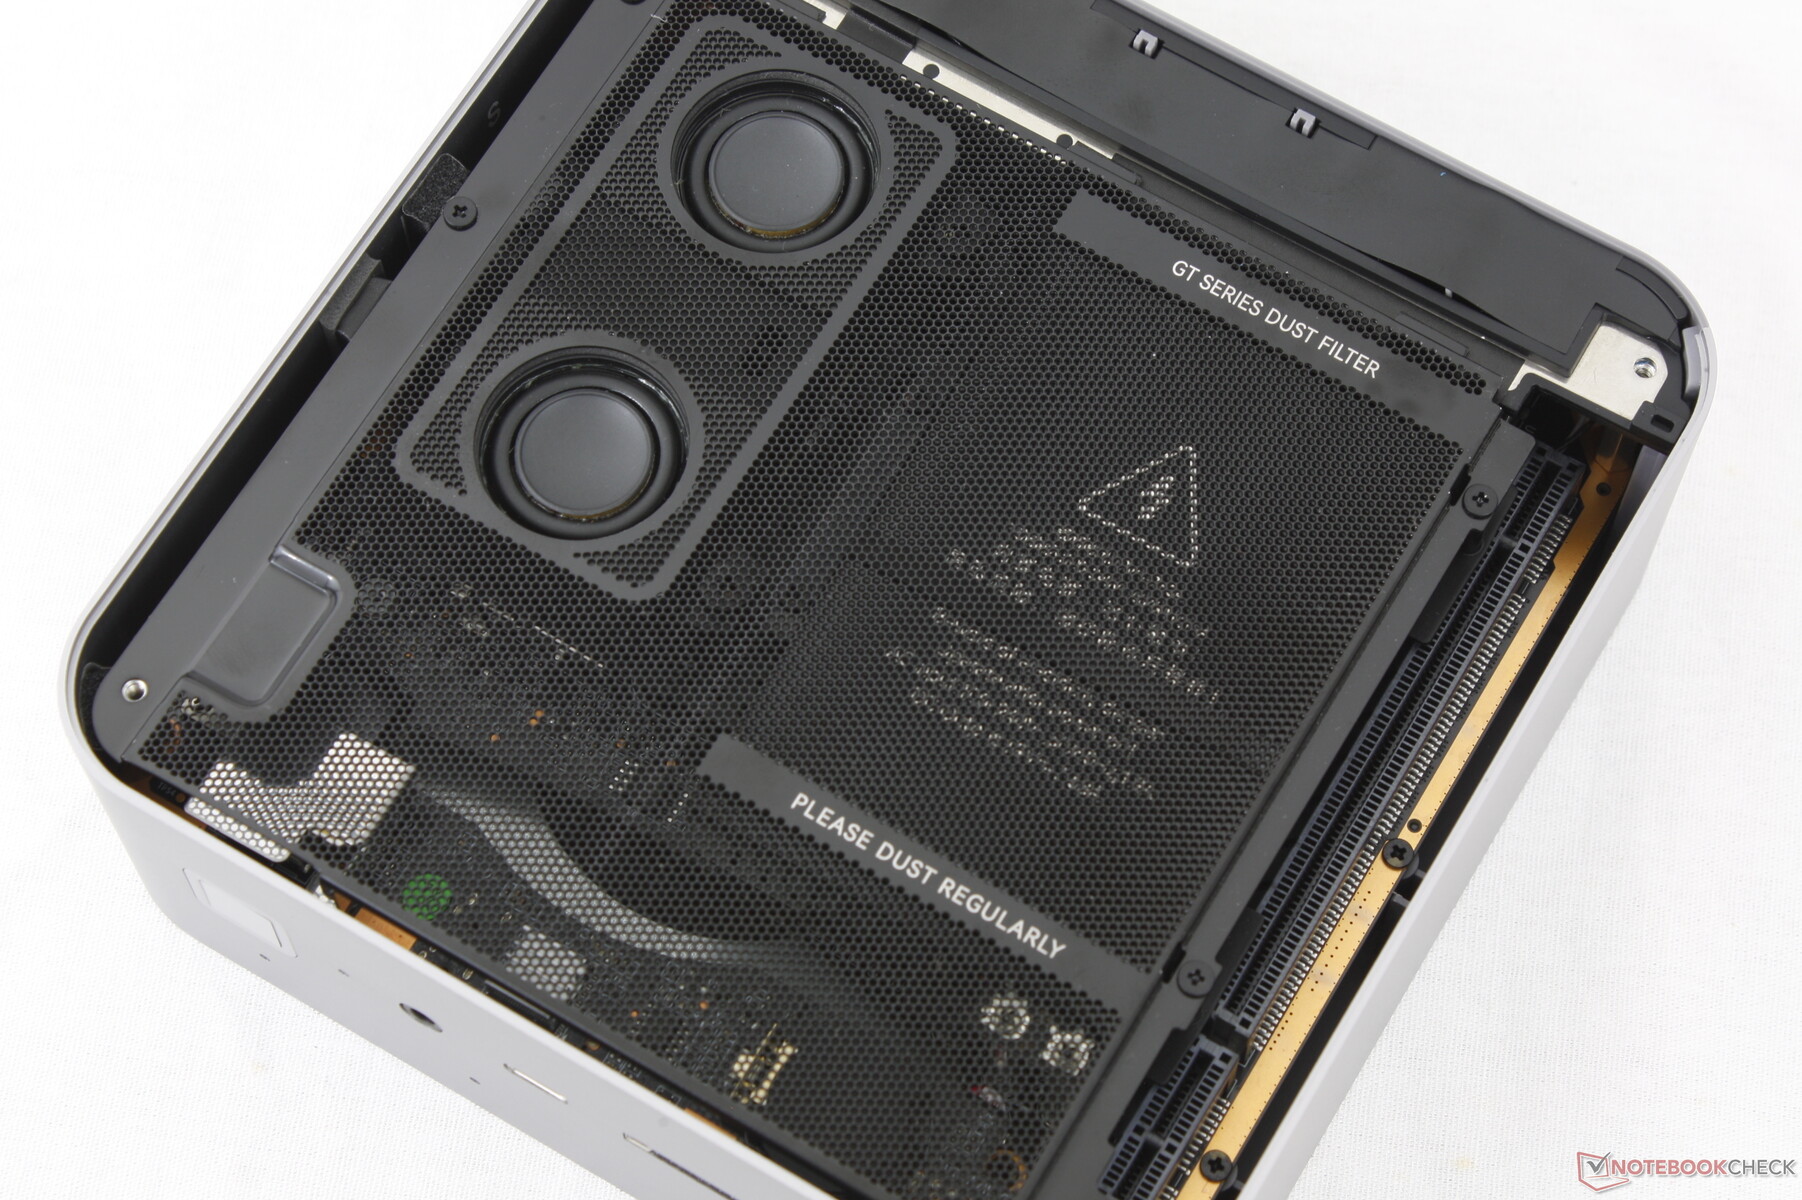
Obudowa - solidna i gęsto upakowana
Unikalne cechy konstrukcji obejmują zintegrowany zasilacz o mocy 145 W, wbudowane głośniki stereo, zintegrowany mikrofon oraz pełnowymiarowe gniazdo rozszerzeń PCIe x8 na spodzie urządzenia do podłączenia do stacji dokującej EX, o której pisaliśmy tutaj. Ta ostatnia została w tym roku nieznacznie zmodernizowana, aby obsługiwać większe karty graficzne z 3 lub 3 gniazdami. Podłączenie eGPU w ten sposób omija ograniczenia przepustowości zarówno Thunderbolt 4, jak i Oculink, zapewniając poziom wydajności bliższy standardowej konfiguracji GPU dla komputerów stacjonarnych.
Czytnik kart SD
| SD Card Reader | |
| average JPG Copy Test (av. of 3 runs) | |
| Beelink GTI13 Ultra (Toshiba Exceria Pro SDXC 64 GB UHS-II) | |
| maximum AS SSD Seq Read Test (1GB) | |
| Beelink GTI13 Ultra (Toshiba Exceria Pro SDXC 64 GB UHS-II) | |
Komunikacja
| Networking | |
| iperf3 transmit AXE11000 | |
| Beelink GTR7 7840HS | |
| GMK EVO-X1 | |
| GMK NucBox K9 | |
| Beelink GTI13 Ultra | |
| Minisforum EliteMini AI370 | |
| Beelink SER9 | |
| iperf3 receive AXE11000 | |
| Beelink GTR7 7840HS | |
| GMK EVO-X1 | |
| Minisforum EliteMini AI370 | |
| Beelink GTI13 Ultra | |
| Beelink SER9 | |
| GMK NucBox K9 | |
| iperf3 transmit AXE11000 6GHz | |
| Minisforum EliteMini AI370 | |
| iperf3 receive AXE11000 6GHz | |
| Minisforum EliteMini AI370 | |
Konserwacja
Ponieważ system zawiera głośniki i zasilacz, elementy te muszą zostać najpierw usunięte, aby uzyskać dostęp do rozszerzalnej pamięci RAM 2x SODIMM i komponentów SSD 2x M.2 2280. Serwisowanie jest zatem bardziej skomplikowane niż w przypadku większości innych mini PC.
Zrównoważony rozwój
Beelink nie reklamuje żadnych środków zrównoważonego rozwoju podjętych podczas produkcji. Samo opakowanie składa się głównie z kartonu i papieru z minimalną ilością plastikowego opakowania.
Akcesoria i gwarancja
W pudełku detalicznym nie ma żadnych dodatków poza dokumentacją, kablem HDMI i kablem zasilającym.
Standardowa roczna ograniczona gwarancja producenta ma zastosowanie w przypadku zakupu w USA.
Wydajność
Warunki testowania
Przed uruchomieniem poniższych testów porównawczych ustawiliśmy system Windows w tryb wydajności.
Procesor
Raptor Lake Core i9-13900HK oferuje tylko minimalne korzyści w zakresie wydajności w porównaniu z Alder Lake Core i9-12900HK jaki można znaleźć w zeszłorocznym GTI12 Ultra.
Cinebench R15 Multi Loop
Cinebench R23: Multi Core | Single Core
Cinebench R20: CPU (Multi Core) | CPU (Single Core)
Cinebench R15: CPU Multi 64Bit | CPU Single 64Bit
Blender: v2.79 BMW27 CPU
7-Zip 18.03: 7z b 4 | 7z b 4 -mmt1
Geekbench 6.4: Multi-Core | Single-Core
Geekbench 5.5: Multi-Core | Single-Core
HWBOT x265 Benchmark v2.2: 4k Preset
LibreOffice : 20 Documents To PDF
R Benchmark 2.5: Overall mean
| CPU Performance Rating | |
| Lenovo ThinkCentre Neo Ultra | |
| Minisforum AtomMan G7 Ti | |
| Beelink SER9 | |
| Beelink GTI13 Ultra | |
| Asus ROG NUC 14-90AS0051 | |
| BOSGAME M2 | |
| Beelink GTI12 Ultra EX Docking Station | |
| Przeciętny Intel Core i9-13900HK | |
| Beelink GTR7 7840HS -2! | |
| Minisforum Venus Series NAB9 | |
| GMK NucBox K9 -1! | |
| Khadas Mind 2 | |
| GMK NucBox K2 | |
| Cinebench R20 / CPU (Multi Core) | |
| Lenovo ThinkCentre Neo Ultra | |
| Minisforum AtomMan G7 Ti | |
| Beelink SER9 | |
| Asus ROG NUC 14-90AS0051 | |
| Beelink GTR7 7840HS | |
| BOSGAME M2 | |
| Beelink GTI12 Ultra EX Docking Station | |
| Przeciętny Intel Core i9-13900HK (4968 - 7542, n=3) | |
| Beelink GTI13 Ultra | |
| Minisforum Venus Series NAB9 | |
| Khadas Mind 2 | |
| GMK NucBox K9 | |
| GMK NucBox K2 | |
| Cinebench R20 / CPU (Single Core) | |
| Lenovo ThinkCentre Neo Ultra | |
| Beelink GTI13 Ultra | |
| Beelink SER9 | |
| Minisforum AtomMan G7 Ti | |
| Przeciętny Intel Core i9-13900HK (666 - 798, n=3) | |
| Minisforum Venus Series NAB9 | |
| Beelink GTI12 Ultra EX Docking Station | |
| Beelink GTR7 7840HS | |
| Asus ROG NUC 14-90AS0051 | |
| BOSGAME M2 | |
| GMK NucBox K9 | |
| Khadas Mind 2 | |
| GMK NucBox K2 | |
| Cinebench R15 / CPU Multi 64Bit | |
| Minisforum AtomMan G7 Ti | |
| Lenovo ThinkCentre Neo Ultra | |
| Beelink SER9 | |
| Asus ROG NUC 14-90AS0051 | |
| Beelink GTR7 7840HS | |
| BOSGAME M2 | |
| Przeciętny Intel Core i9-13900HK (2004 - 2950, n=3) | |
| Beelink GTI12 Ultra EX Docking Station | |
| Beelink GTI13 Ultra | |
| Khadas Mind 2 | |
| Minisforum Venus Series NAB9 | |
| GMK NucBox K2 | |
| GMK NucBox K9 | |
| Cinebench R15 / CPU Single 64Bit | |
| Beelink SER9 | |
| Lenovo ThinkCentre Neo Ultra | |
| Beelink GTI13 Ultra | |
| Minisforum AtomMan G7 Ti | |
| Beelink GTR7 7840HS | |
| Przeciętny Intel Core i9-13900HK (247 - 296, n=3) | |
| Beelink GTI12 Ultra EX Docking Station | |
| Minisforum Venus Series NAB9 | |
| Asus ROG NUC 14-90AS0051 | |
| BOSGAME M2 | |
| GMK NucBox K9 | |
| GMK NucBox K2 | |
| Khadas Mind 2 | |
| Geekbench 6.4 / Multi-Core | |
| Minisforum AtomMan G7 Ti | |
| Beelink SER9 | |
| Lenovo ThinkCentre Neo Ultra | |
| BOSGAME M2 | |
| Beelink GTI13 Ultra | |
| Asus ROG NUC 14-90AS0051 | |
| Beelink GTI12 Ultra EX Docking Station | |
| Khadas Mind 2 | |
| GMK NucBox K9 | |
| Przeciętny Intel Core i9-13900HK (9646 - 13309, n=3) | |
| Minisforum Venus Series NAB9 | |
| GMK NucBox K2 | |
| Geekbench 6.4 / Single-Core | |
| Minisforum AtomMan G7 Ti | |
| Beelink GTI13 Ultra | |
| Lenovo ThinkCentre Neo Ultra | |
| Beelink SER9 | |
| BOSGAME M2 | |
| Beelink GTI12 Ultra EX Docking Station | |
| Minisforum Venus Series NAB9 | |
| Przeciętny Intel Core i9-13900HK (2263 - 2883, n=3) | |
| Asus ROG NUC 14-90AS0051 | |
| GMK NucBox K9 | |
| Khadas Mind 2 | |
| GMK NucBox K2 | |
| HWBOT x265 Benchmark v2.2 / 4k Preset | |
| Lenovo ThinkCentre Neo Ultra | |
| Beelink SER9 | |
| Minisforum AtomMan G7 Ti | |
| Asus ROG NUC 14-90AS0051 | |
| BOSGAME M2 | |
| Beelink GTI13 Ultra | |
| Przeciętny Intel Core i9-13900HK (14.2 - 21.9, n=3) | |
| Beelink GTI12 Ultra EX Docking Station | |
| Minisforum Venus Series NAB9 | |
| Khadas Mind 2 | |
| GMK NucBox K2 | |
| GMK NucBox K9 | |
| Beelink GTR7 7840HS | |
| LibreOffice / 20 Documents To PDF | |
| Khadas Mind 2 | |
| Asus ROG NUC 14-90AS0051 | |
| Beelink SER9 | |
| Minisforum AtomMan G7 Ti | |
| GMK NucBox K2 | |
| Przeciętny Intel Core i9-13900HK (37.3 - 55.2, n=3) | |
| GMK NucBox K9 | |
| BOSGAME M2 | |
| Beelink GTI12 Ultra EX Docking Station | |
| Beelink GTR7 7840HS | |
| Beelink GTI13 Ultra | |
| Minisforum Venus Series NAB9 | |
| Lenovo ThinkCentre Neo Ultra | |
| R Benchmark 2.5 / Overall mean | |
| Khadas Mind 2 | |
| GMK NucBox K2 | |
| GMK NucBox K9 | |
| Asus ROG NUC 14-90AS0051 | |
| Beelink GTI12 Ultra EX Docking Station | |
| Przeciętny Intel Core i9-13900HK (0.4119 - 0.4799, n=3) | |
| Minisforum Venus Series NAB9 | |
| BOSGAME M2 | |
| Beelink GTR7 7840HS | |
| Beelink GTI13 Ultra | |
| Beelink SER9 | |
| Minisforum AtomMan G7 Ti | |
| Lenovo ThinkCentre Neo Ultra | |
Cinebench R23: Multi Core | Single Core
Cinebench R20: CPU (Multi Core) | CPU (Single Core)
Cinebench R15: CPU Multi 64Bit | CPU Single 64Bit
Blender: v2.79 BMW27 CPU
7-Zip 18.03: 7z b 4 | 7z b 4 -mmt1
Geekbench 6.4: Multi-Core | Single-Core
Geekbench 5.5: Multi-Core | Single-Core
HWBOT x265 Benchmark v2.2: 4k Preset
LibreOffice : 20 Documents To PDF
R Benchmark 2.5: Overall mean
* ... im mniej tym lepiej
AIDA64: FP32 Ray-Trace | FPU Julia | CPU SHA3 | CPU Queen | FPU SinJulia | FPU Mandel | CPU AES | CPU ZLib | FP64 Ray-Trace | CPU PhotoWorxx
| Performance Rating | |
| Beelink SER9 | |
| Minisforum EliteMini AI370 | |
| Beelink GTR7 7840HS | |
| GMK EVO-X1 | |
| Beelink GTI13 Ultra | |
| Przeciętny Intel Core i9-13900HK | |
| GMK NucBox K9 | |
| AIDA64 / FP32 Ray-Trace | |
| Beelink SER9 | |
| Minisforum EliteMini AI370 | |
| GMK EVO-X1 | |
| Beelink GTR7 7840HS | |
| Przeciętny Intel Core i9-13900HK (12351 - 18326, n=3) | |
| Beelink GTI13 Ultra | |
| GMK NucBox K9 | |
| AIDA64 / FPU Julia | |
| Beelink SER9 | |
| Minisforum EliteMini AI370 | |
| GMK EVO-X1 | |
| Beelink GTR7 7840HS | |
| Beelink GTI13 Ultra | |
| Przeciętny Intel Core i9-13900HK (61409 - 92925, n=3) | |
| GMK NucBox K9 | |
| AIDA64 / CPU SHA3 | |
| Beelink SER9 | |
| Minisforum EliteMini AI370 | |
| GMK EVO-X1 | |
| Beelink GTR7 7840HS | |
| Przeciętny Intel Core i9-13900HK (2923 - 4190, n=3) | |
| Beelink GTI13 Ultra | |
| GMK NucBox K9 | |
| AIDA64 / CPU Queen | |
| Beelink GTR7 7840HS | |
| Beelink GTI13 Ultra | |
| Minisforum EliteMini AI370 | |
| Beelink SER9 | |
| Przeciętny Intel Core i9-13900HK (75615 - 118166, n=3) | |
| GMK NucBox K9 | |
| GMK EVO-X1 | |
| AIDA64 / FPU SinJulia | |
| Beelink SER9 | |
| GMK EVO-X1 | |
| Minisforum EliteMini AI370 | |
| Beelink GTR7 7840HS | |
| Beelink GTI13 Ultra | |
| Przeciętny Intel Core i9-13900HK (7427 - 11249, n=3) | |
| GMK NucBox K9 | |
| AIDA64 / FPU Mandel | |
| Beelink SER9 | |
| Minisforum EliteMini AI370 | |
| GMK EVO-X1 | |
| Beelink GTR7 7840HS | |
| Beelink GTI13 Ultra | |
| Przeciętny Intel Core i9-13900HK (30549 - 45616, n=3) | |
| GMK NucBox K9 | |
| AIDA64 / CPU AES | |
| Beelink GTR7 7840HS | |
| GMK NucBox K9 | |
| Przeciętny Intel Core i9-13900HK (70330 - 100891, n=3) | |
| Beelink SER9 | |
| Minisforum EliteMini AI370 | |
| GMK EVO-X1 | |
| Beelink GTI13 Ultra | |
| AIDA64 / CPU ZLib | |
| Beelink SER9 | |
| Minisforum EliteMini AI370 | |
| GMK EVO-X1 | |
| Beelink GTR7 7840HS | |
| Beelink GTI13 Ultra | |
| Przeciętny Intel Core i9-13900HK (797 - 1249, n=3) | |
| GMK NucBox K9 | |
| AIDA64 / FP64 Ray-Trace | |
| Beelink SER9 | |
| Minisforum EliteMini AI370 | |
| GMK EVO-X1 | |
| Beelink GTR7 7840HS | |
| Przeciętny Intel Core i9-13900HK (6839 - 10018, n=3) | |
| Beelink GTI13 Ultra | |
| GMK NucBox K9 | |
| AIDA64 / CPU PhotoWorxx | |
| Minisforum EliteMini AI370 | |
| GMK EVO-X1 | |
| Beelink SER9 | |
| GMK NucBox K9 | |
| Beelink GTI13 Ultra | |
| Przeciętny Intel Core i9-13900HK (28439 - 49539, n=3) | |
| Beelink GTR7 7840HS | |
Test warunków skrajnych
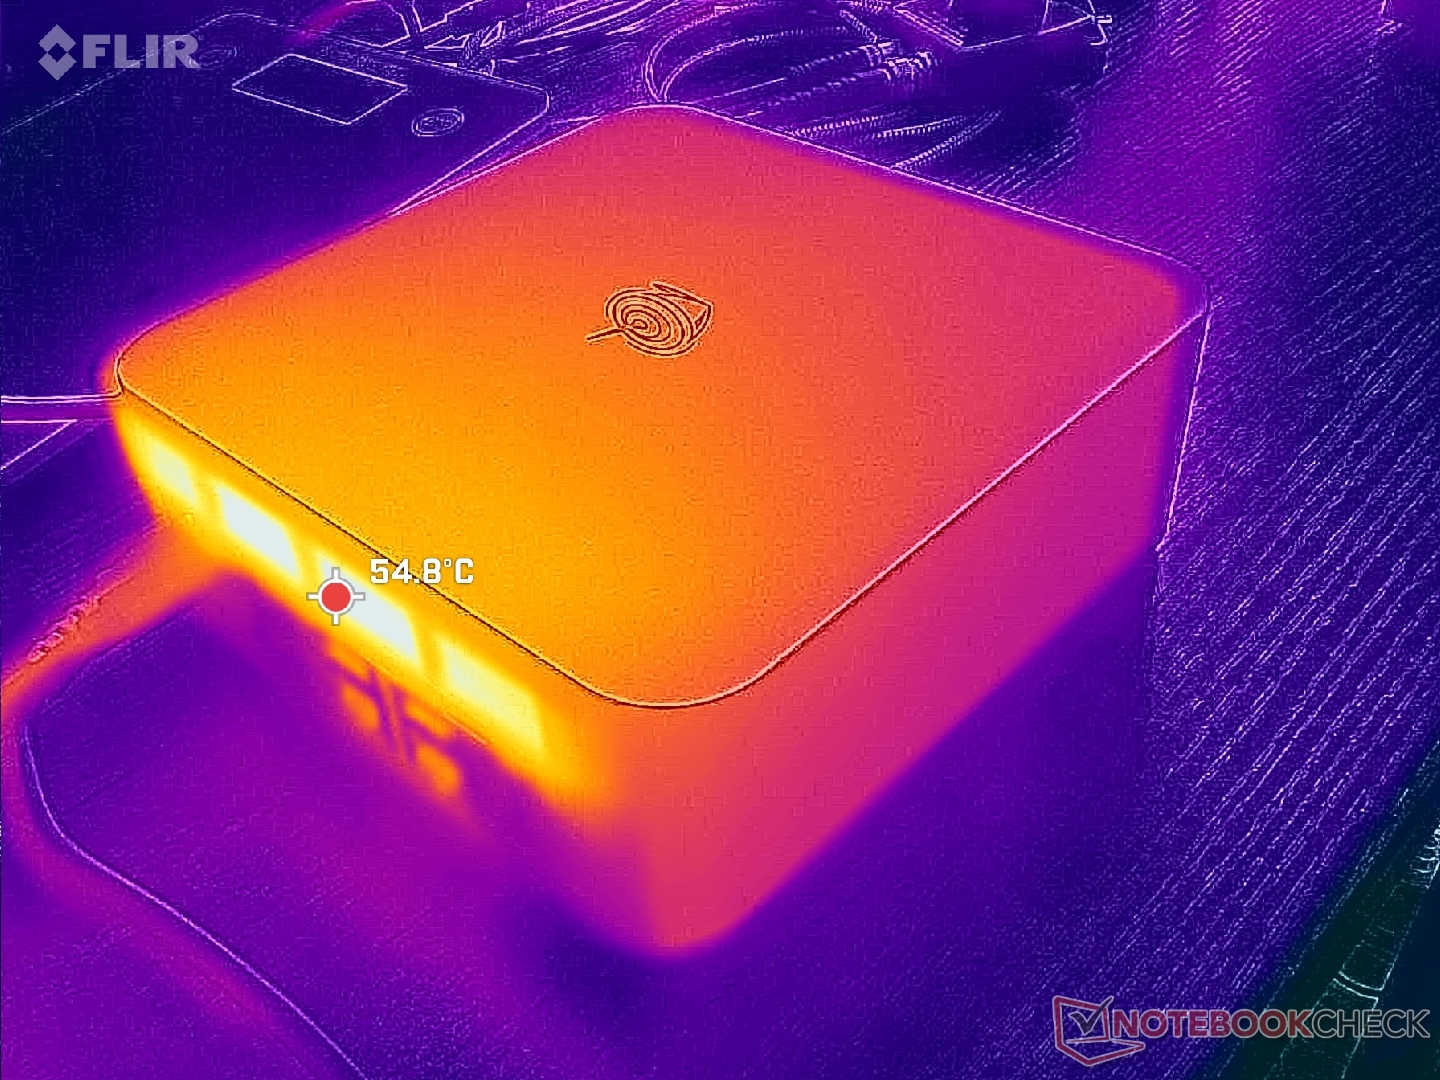
Temperatura rdzenia stabilizuje się na poziomie do 77 C podczas uruchamiania wymagających obciążeń, takich jak gry, w porównaniu do 68 C na szybszych procesorach AMD SER9.
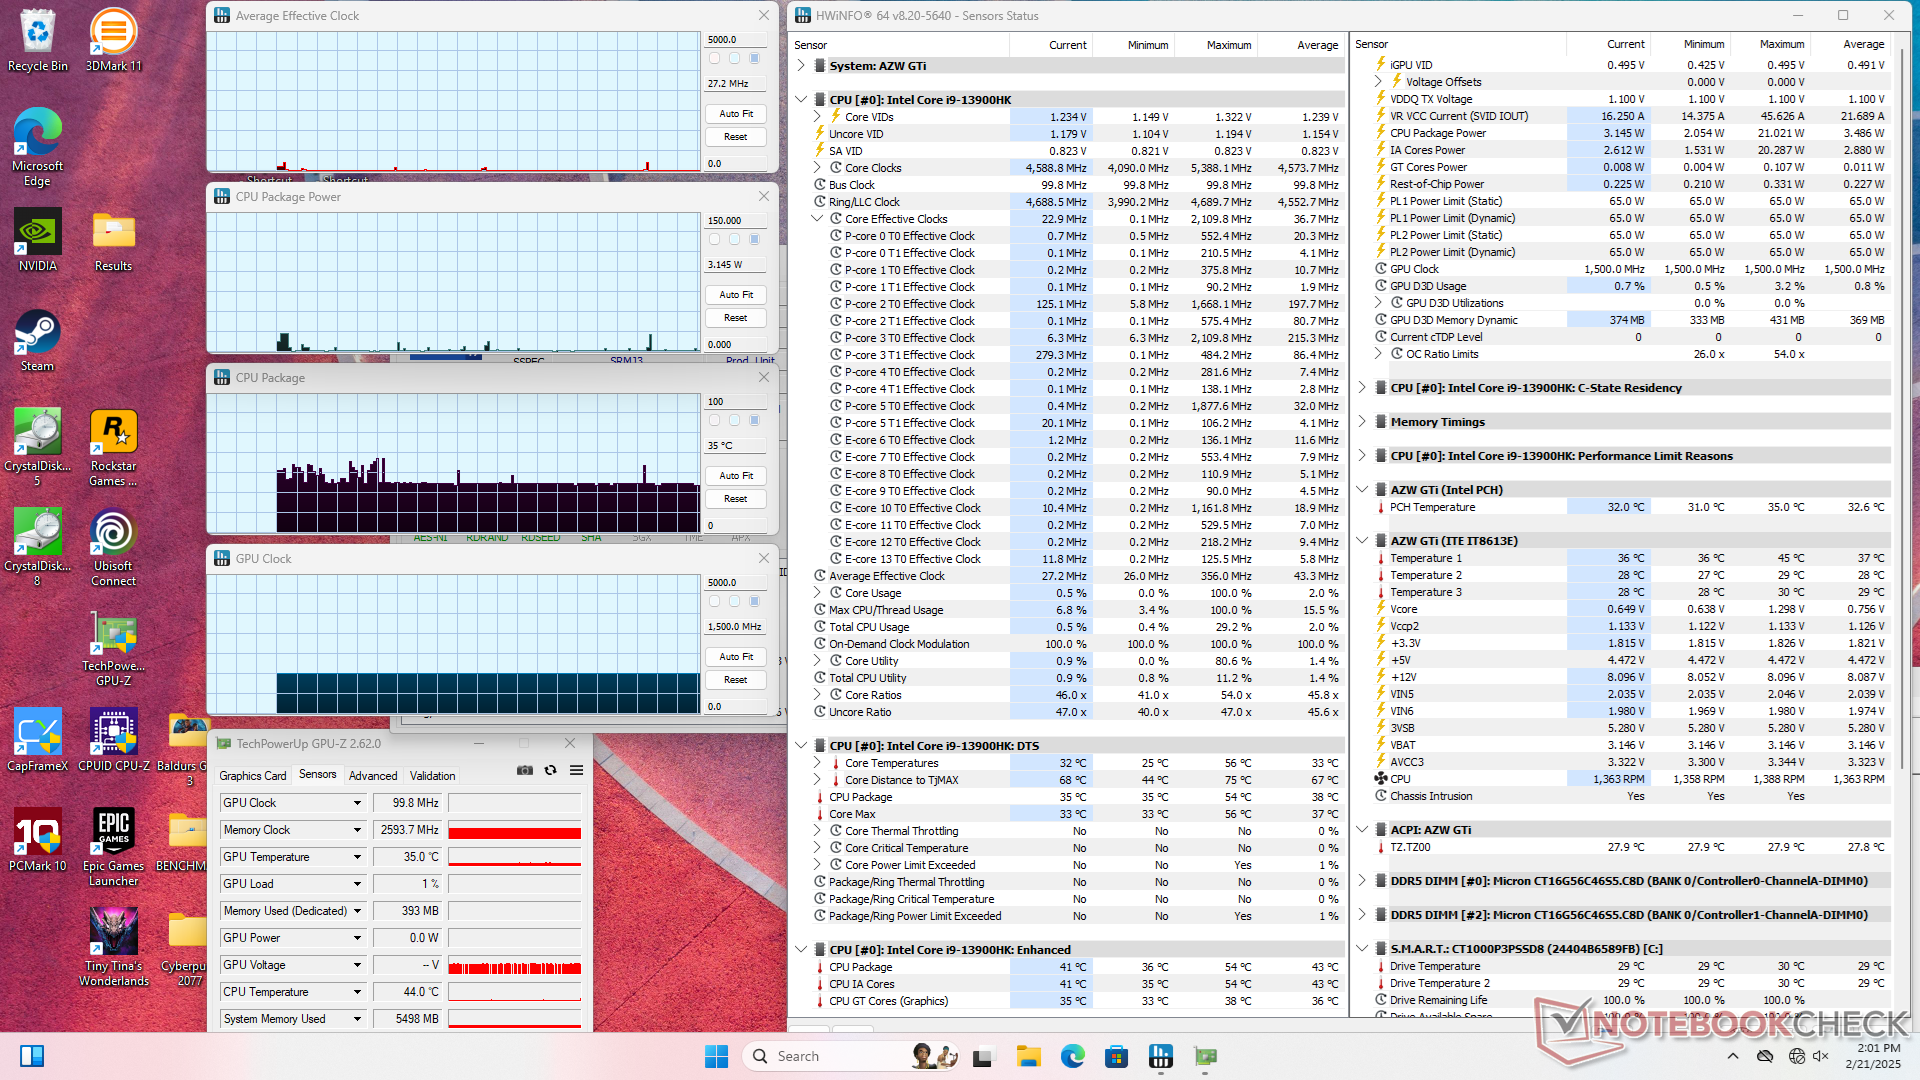

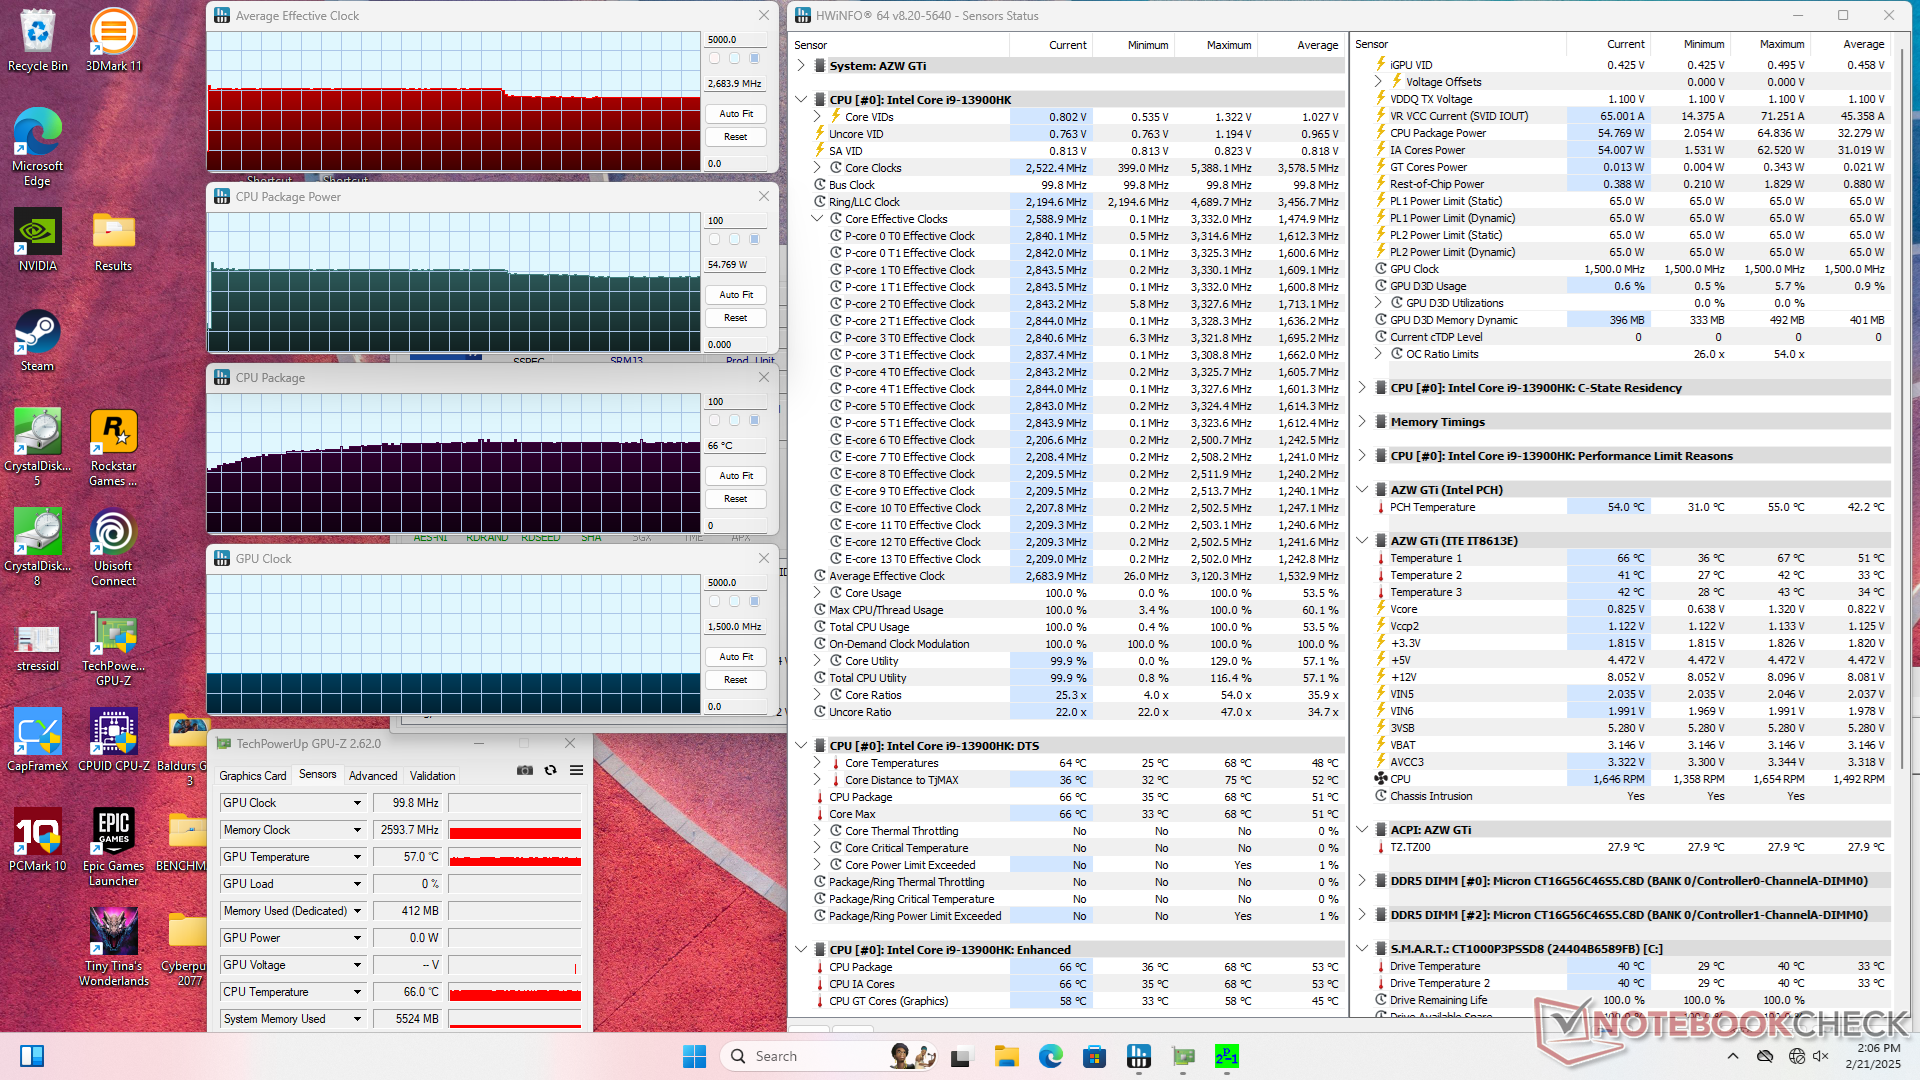
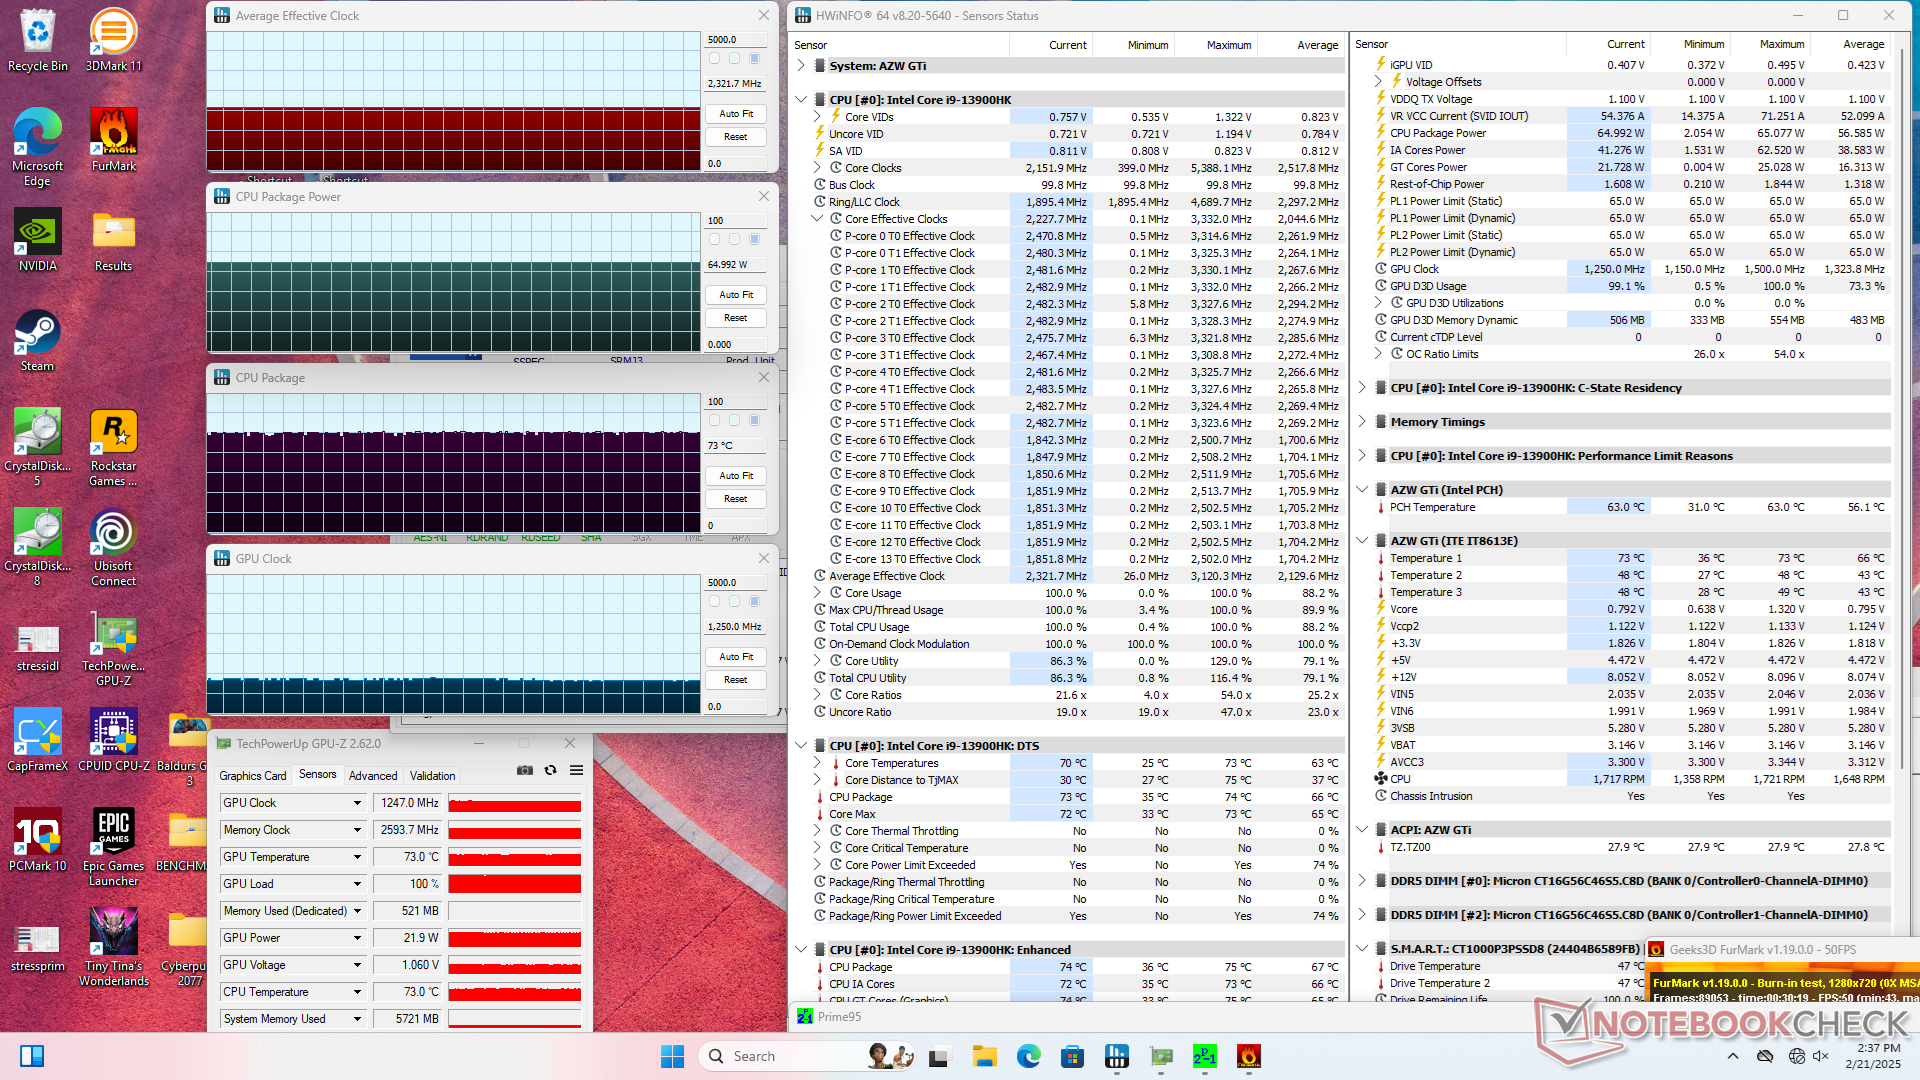
| Średnie taktowanie CPU (GHz) | Taktowanie GPU (MHz) | Średnia temperatura CPU (°C) | |
| System bezczynności | -- | -- | 35 |
| Prime95 Stress | 2.7 | -- | 66 |
| Prime95 + FurMark Stress | 2.3 | 1250 | 73 |
| Cyberpunk 2077 Stress | 0.6 | 1500 | 77 |
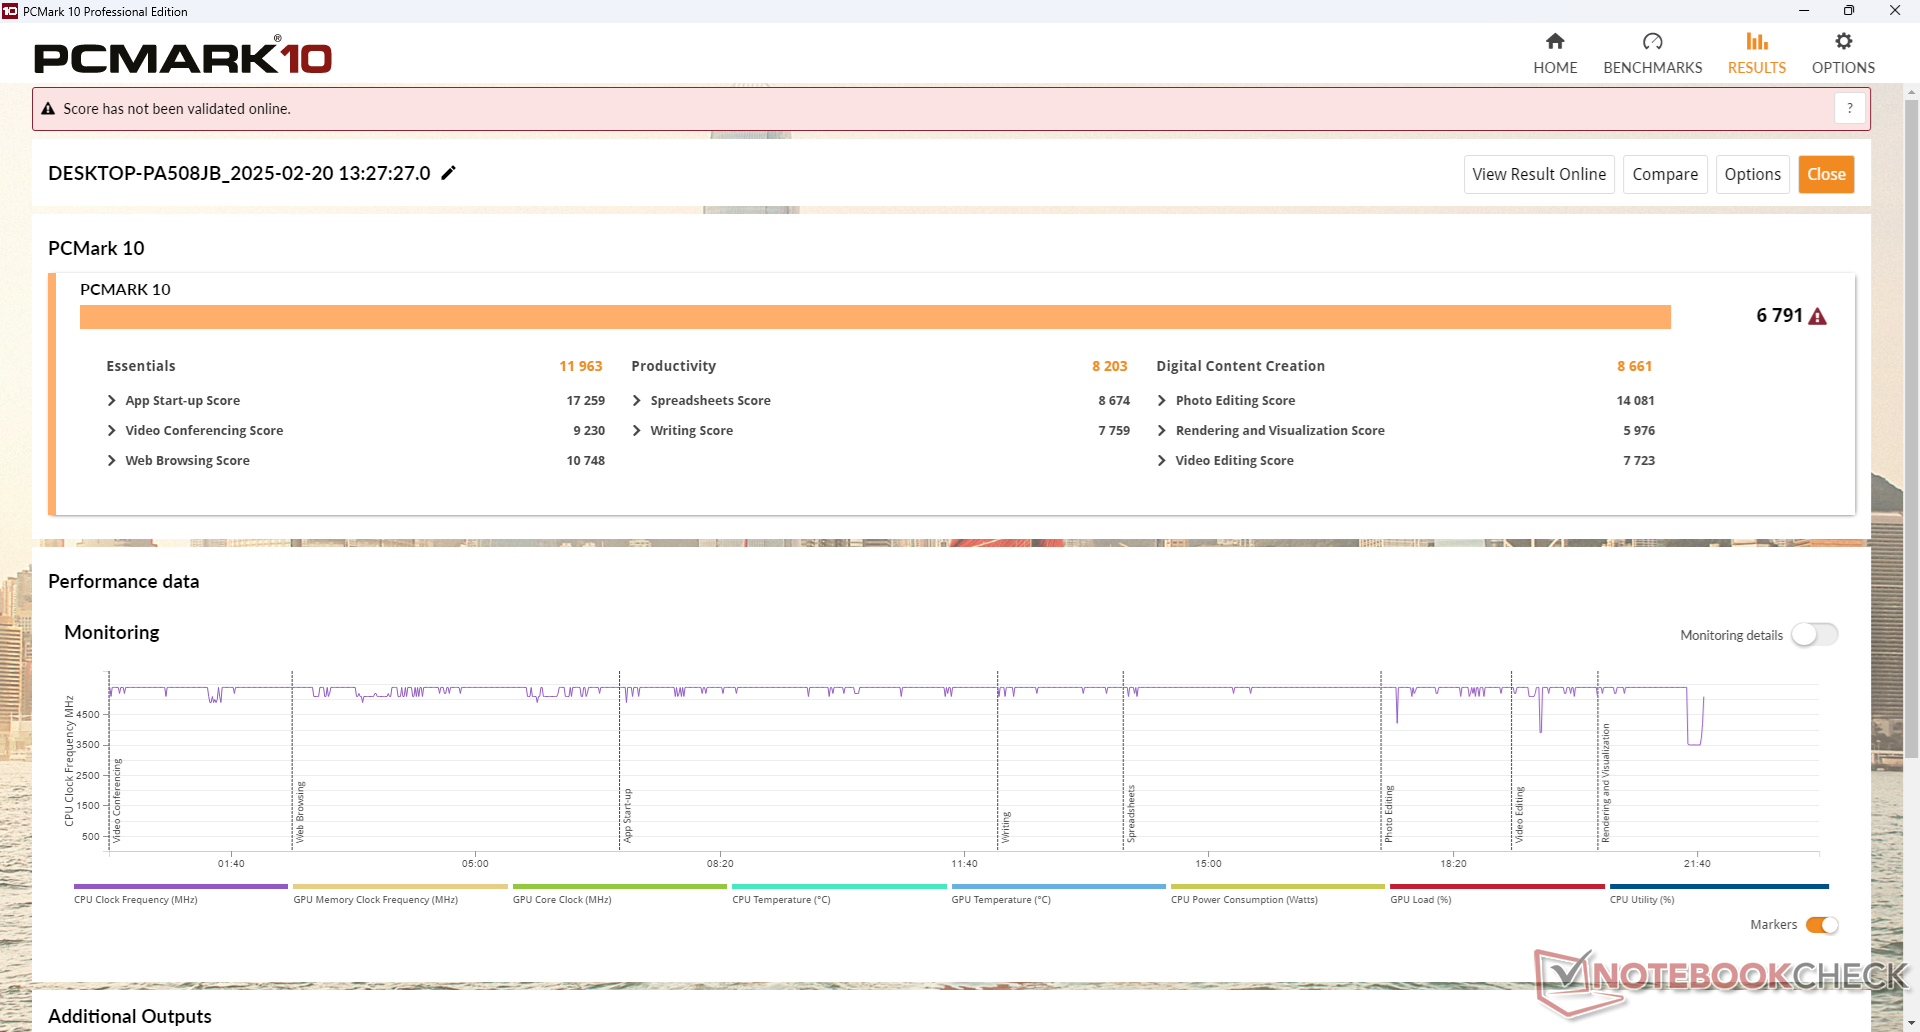
Wydajność systemu
CrossMark: Overall | Productivity | Creativity | Responsiveness
WebXPRT 3: Overall
WebXPRT 4: Overall
Mozilla Kraken 1.1: Total
| PCMark 10 / Score | |
| Beelink SER9 | |
| Beelink GTR7 7840HS | |
| GMK EVO-X1 | |
| Minisforum EliteMini AI370 | |
| Beelink GTI13 Ultra | |
| GMK NucBox K9 | |
| Przeciętny Intel Core i9-13900HK, Intel Iris Xe Graphics G7 96EUs (5730 - 6791, n=2) | |
| PCMark 10 / Essentials | |
| Beelink GTI13 Ultra | |
| Beelink GTR7 7840HS | |
| GMK EVO-X1 | |
| Przeciętny Intel Core i9-13900HK, Intel Iris Xe Graphics G7 96EUs (9629 - 11963, n=2) | |
| GMK NucBox K9 | |
| Beelink SER9 | |
| Minisforum EliteMini AI370 | |
| PCMark 10 / Productivity | |
| Beelink GTR7 7840HS | |
| Beelink SER9 | |
| Minisforum EliteMini AI370 | |
| GMK EVO-X1 | |
| Beelink GTI13 Ultra | |
| Przeciętny Intel Core i9-13900HK, Intel Iris Xe Graphics G7 96EUs (7426 - 8203, n=2) | |
| GMK NucBox K9 | |
| PCMark 10 / Digital Content Creation | |
| Beelink SER9 | |
| Minisforum EliteMini AI370 | |
| GMK EVO-X1 | |
| Beelink GTR7 7840HS | |
| GMK NucBox K9 | |
| Beelink GTI13 Ultra | |
| Przeciętny Intel Core i9-13900HK, Intel Iris Xe Graphics G7 96EUs (7142 - 8661, n=2) | |
| CrossMark / Overall | |
| Beelink GTI13 Ultra | |
| Przeciętny Intel Core i9-13900HK, Intel Iris Xe Graphics G7 96EUs (1788 - 2099, n=2) | |
| Minisforum EliteMini AI370 | |
| Beelink SER9 | |
| GMK EVO-X1 | |
| GMK NucBox K9 | |
| Beelink GTR7 7840HS | |
| CrossMark / Productivity | |
| Beelink GTI13 Ultra | |
| Przeciętny Intel Core i9-13900HK, Intel Iris Xe Graphics G7 96EUs (1783 - 2012, n=2) | |
| Minisforum EliteMini AI370 | |
| GMK EVO-X1 | |
| GMK NucBox K9 | |
| Beelink SER9 | |
| Beelink GTR7 7840HS | |
| CrossMark / Creativity | |
| Beelink GTI13 Ultra | |
| Minisforum EliteMini AI370 | |
| Przeciętny Intel Core i9-13900HK, Intel Iris Xe Graphics G7 96EUs (1737 - 2192, n=2) | |
| Beelink SER9 | |
| GMK EVO-X1 | |
| GMK NucBox K9 | |
| Beelink GTR7 7840HS | |
| CrossMark / Responsiveness | |
| Beelink GTI13 Ultra | |
| Przeciętny Intel Core i9-13900HK, Intel Iris Xe Graphics G7 96EUs (1964 - 2097, n=2) | |
| Beelink GTR7 7840HS | |
| GMK EVO-X1 | |
| GMK NucBox K9 | |
| Beelink SER9 | |
| Minisforum EliteMini AI370 | |
| WebXPRT 3 / Overall | |
| Beelink GTI13 Ultra | |
| Beelink GTR7 7840HS | |
| GMK EVO-X1 | |
| Przeciętny Intel Core i9-13900HK, Intel Iris Xe Graphics G7 96EUs (268 - 353, n=2) | |
| Beelink SER9 | |
| Minisforum EliteMini AI370 | |
| GMK NucBox K9 | |
| WebXPRT 4 / Overall | |
| Beelink GTI13 Ultra | |
| Beelink GTR7 7840HS | |
| GMK EVO-X1 | |
| Przeciętny Intel Core i9-13900HK, Intel Iris Xe Graphics G7 96EUs (231 - 298, n=2) | |
| GMK NucBox K9 | |
| Beelink SER9 | |
| Minisforum EliteMini AI370 | |
| Mozilla Kraken 1.1 / Total | |
| GMK NucBox K9 | |
| Przeciętny Intel Core i9-13900HK, Intel Iris Xe Graphics G7 96EUs (461 - 551, n=2) | |
| Minisforum EliteMini AI370 | |
| Beelink GTR7 7840HS | |
| Beelink GTI13 Ultra | |
| Beelink SER9 | |
| GMK EVO-X1 | |
* ... im mniej tym lepiej
| PCMark 10 Score | 6791 pkt. | |
Pomoc | ||
| AIDA64 / Memory Copy | |
| Beelink SER9 | |
| GMK EVO-X1 | |
| Minisforum EliteMini AI370 | |
| Beelink GTI13 Ultra | |
| Beelink GTR7 7840HS | |
| GMK NucBox K9 | |
| Przeciętny Intel Core i9-13900HK (45935 - 74460, n=3) | |
| AIDA64 / Memory Read | |
| GMK EVO-X1 | |
| Minisforum EliteMini AI370 | |
| Beelink SER9 | |
| Beelink GTI13 Ultra | |
| GMK NucBox K9 | |
| Przeciętny Intel Core i9-13900HK (45323 - 74896, n=3) | |
| Beelink GTR7 7840HS | |
| AIDA64 / Memory Write | |
| GMK EVO-X1 | |
| Beelink SER9 | |
| Minisforum EliteMini AI370 | |
| Beelink GTR7 7840HS | |
| Beelink GTI13 Ultra | |
| GMK NucBox K9 | |
| Przeciętny Intel Core i9-13900HK (47347 - 85917, n=3) | |
| AIDA64 / Memory Latency | |
| GMK NucBox K9 | |
| Beelink SER9 | |
| GMK EVO-X1 | |
| Minisforum EliteMini AI370 | |
| Przeciętny Intel Core i9-13900HK (83 - 101, n=3) | |
| Beelink GTR7 7840HS | |
| Beelink GTI13 Ultra | |
* ... im mniej tym lepiej
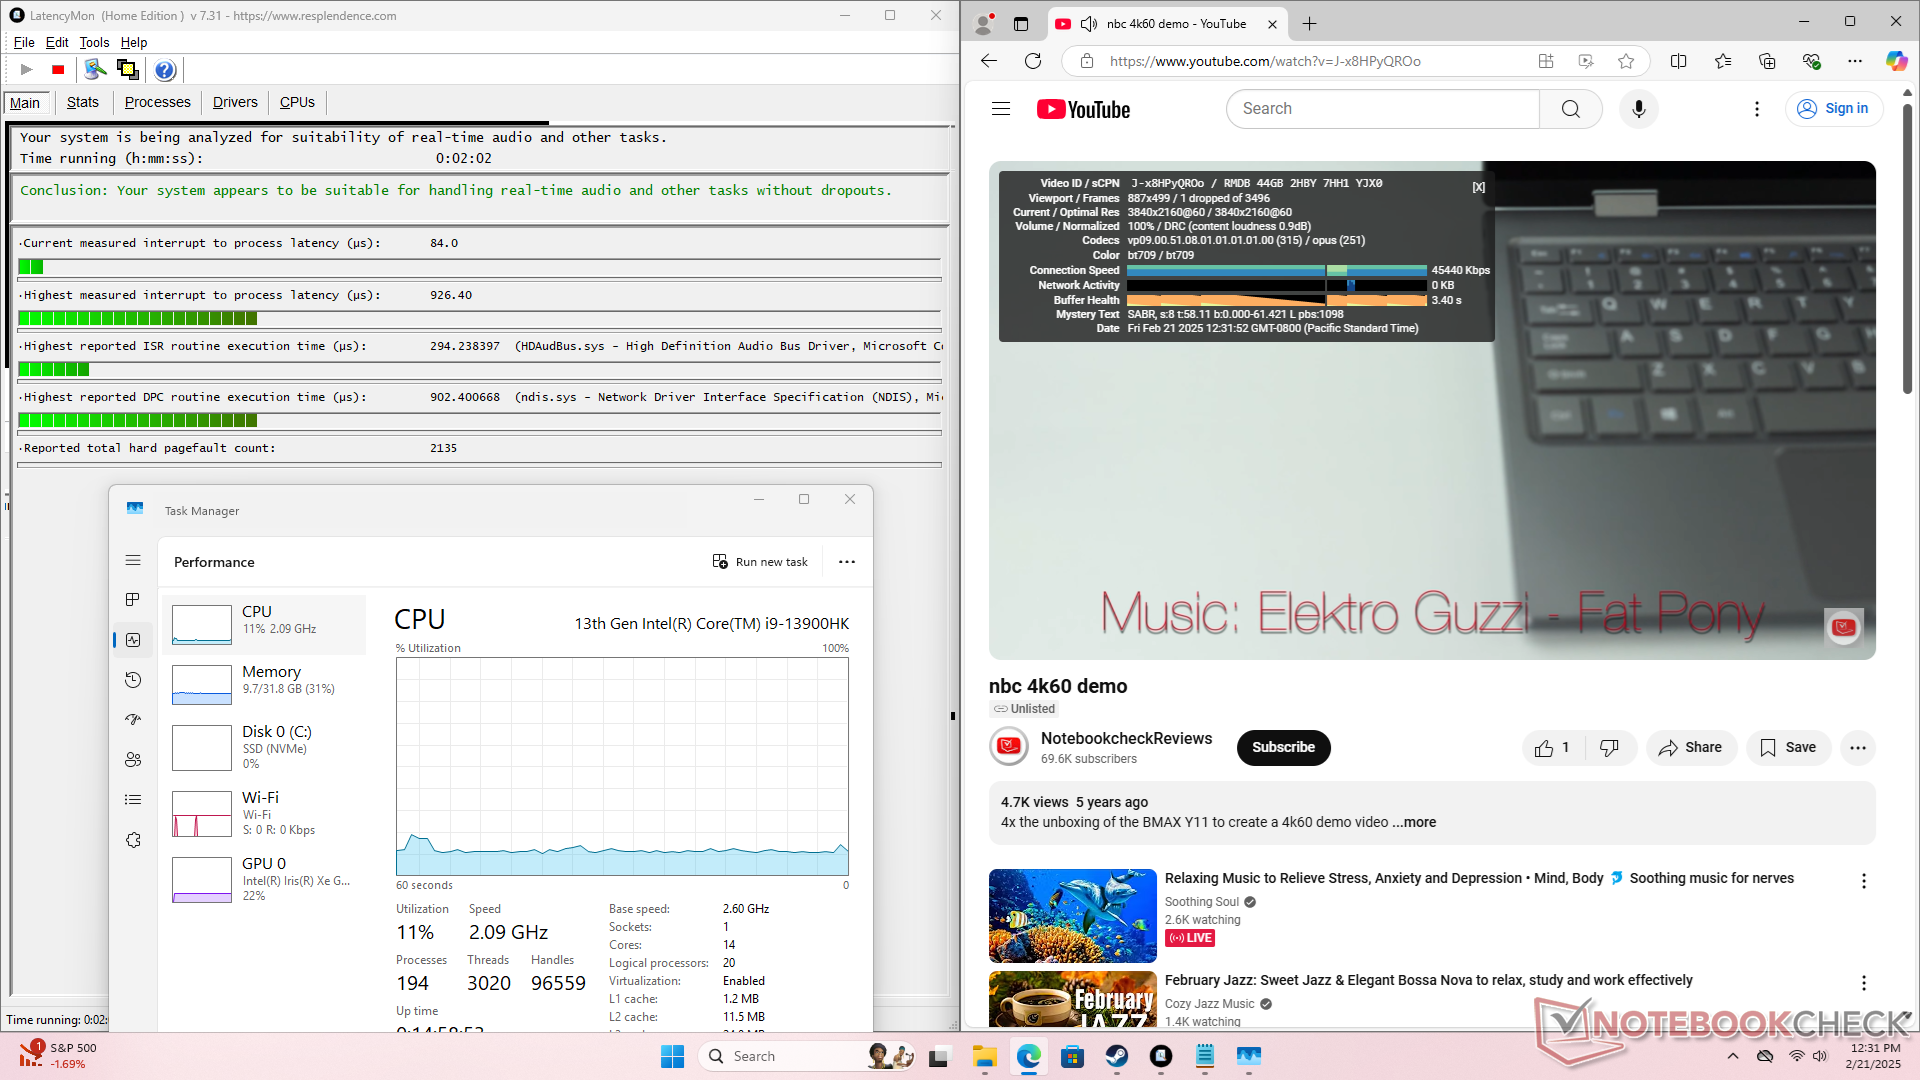
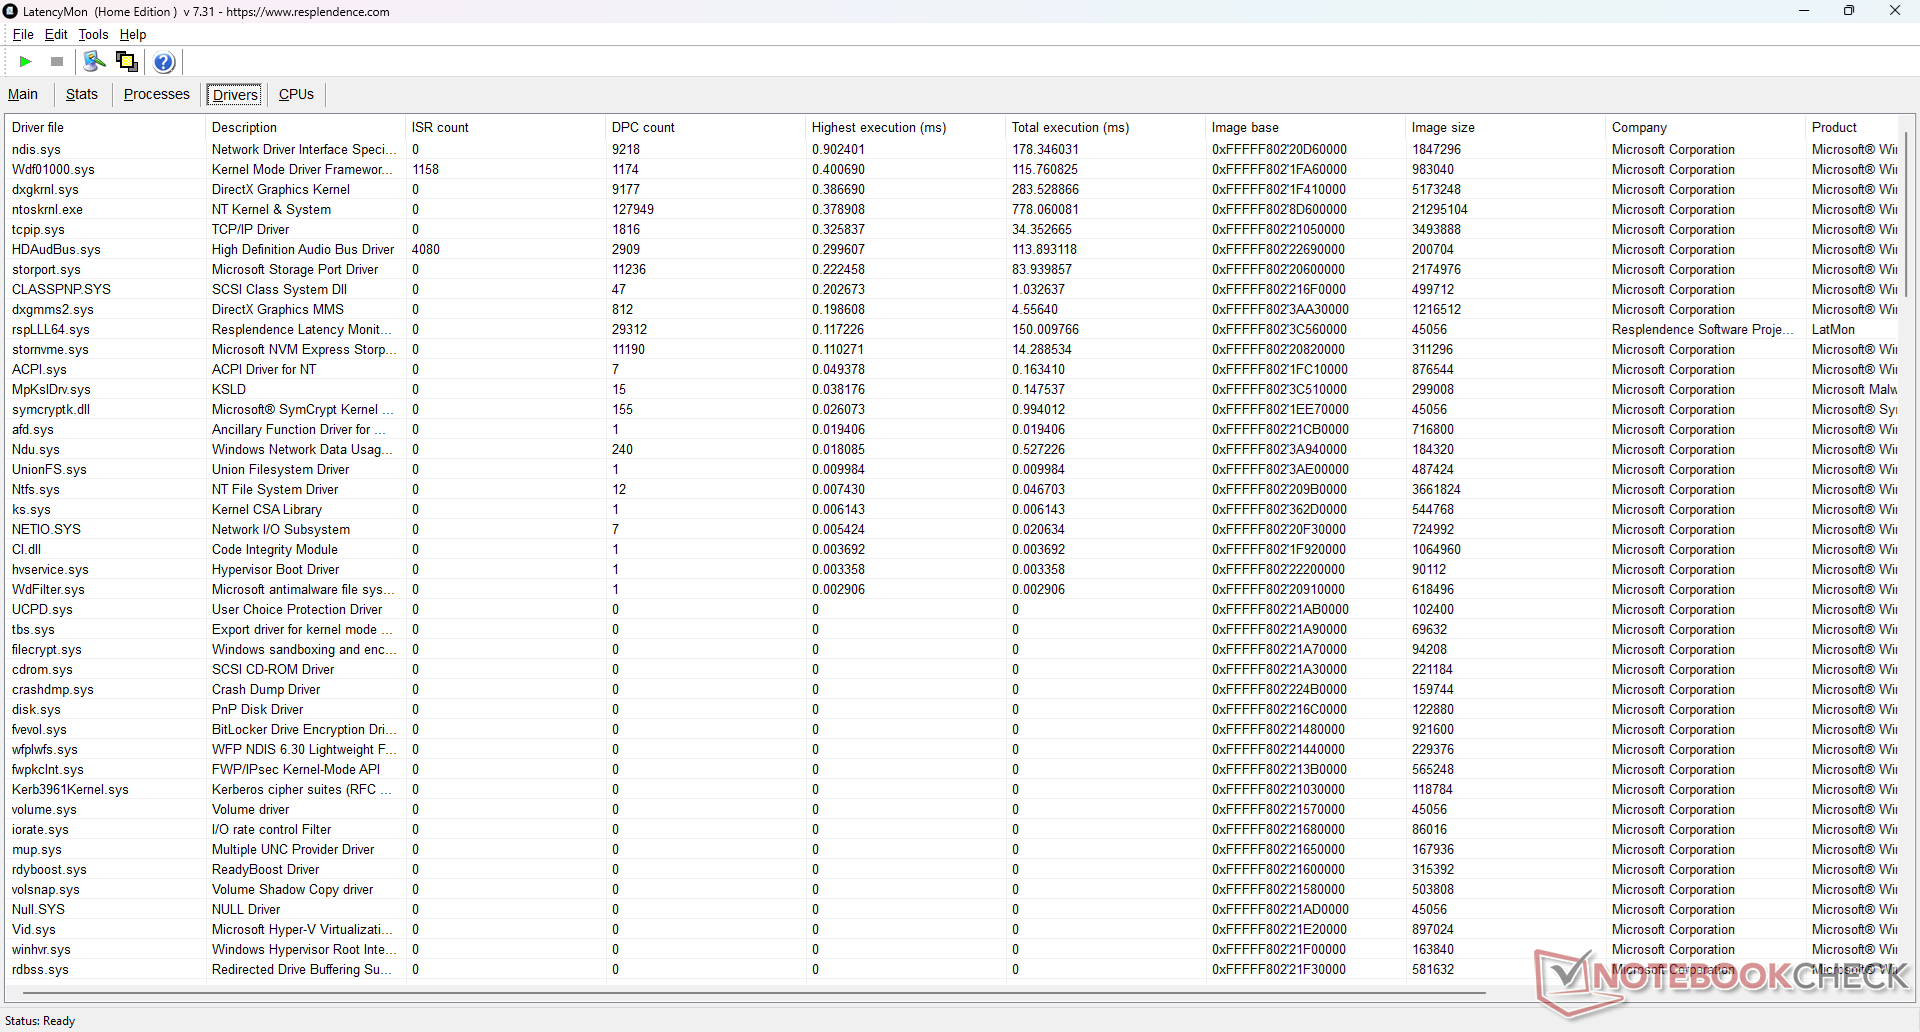
Opóźnienie DPC
LatencyMon nie wykazuje większych problemów z DPC podczas otwierania wielu kart przeglądarki na naszej stronie głównej. odtwarzanie wideo 4K60 jest idealne, z zaledwie jedną spadającą klatką zarejestrowaną na początku testu.
| DPC Latencies / LatencyMon - interrupt to process latency (max), Web, Youtube, Prime95 | |
| GMK NucBox K9 | |
| Minisforum EliteMini AI370 | |
| Beelink GTI13 Ultra | |
| GMK EVO-X1 | |
| Beelink GTR7 7840HS | |
* ... im mniej tym lepiej
Urządzenia pamięci masowej
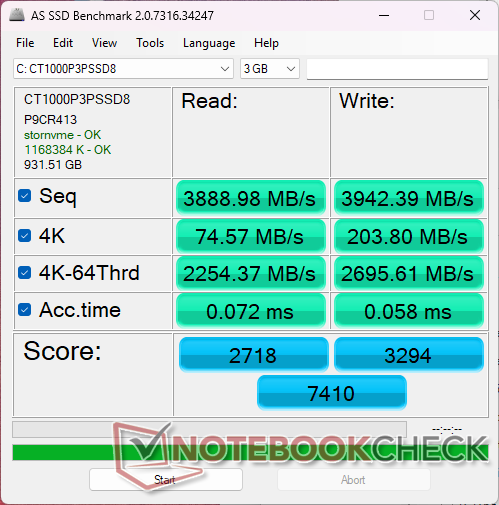
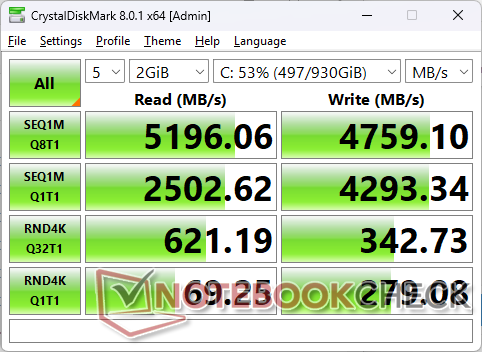

| Drive Performance Rating - Percent | |
| Beelink GTI13 Ultra | |
| GMK NucBox K9 | |
| Beelink GTR7 7840HS | |
| Minisforum EliteMini AI370 | |
| Beelink SER9 | |
| GMK EVO-X1 | |
* ... im mniej tym lepiej
Disk Throttling: DiskSpd Read Loop, Queue Depth 8
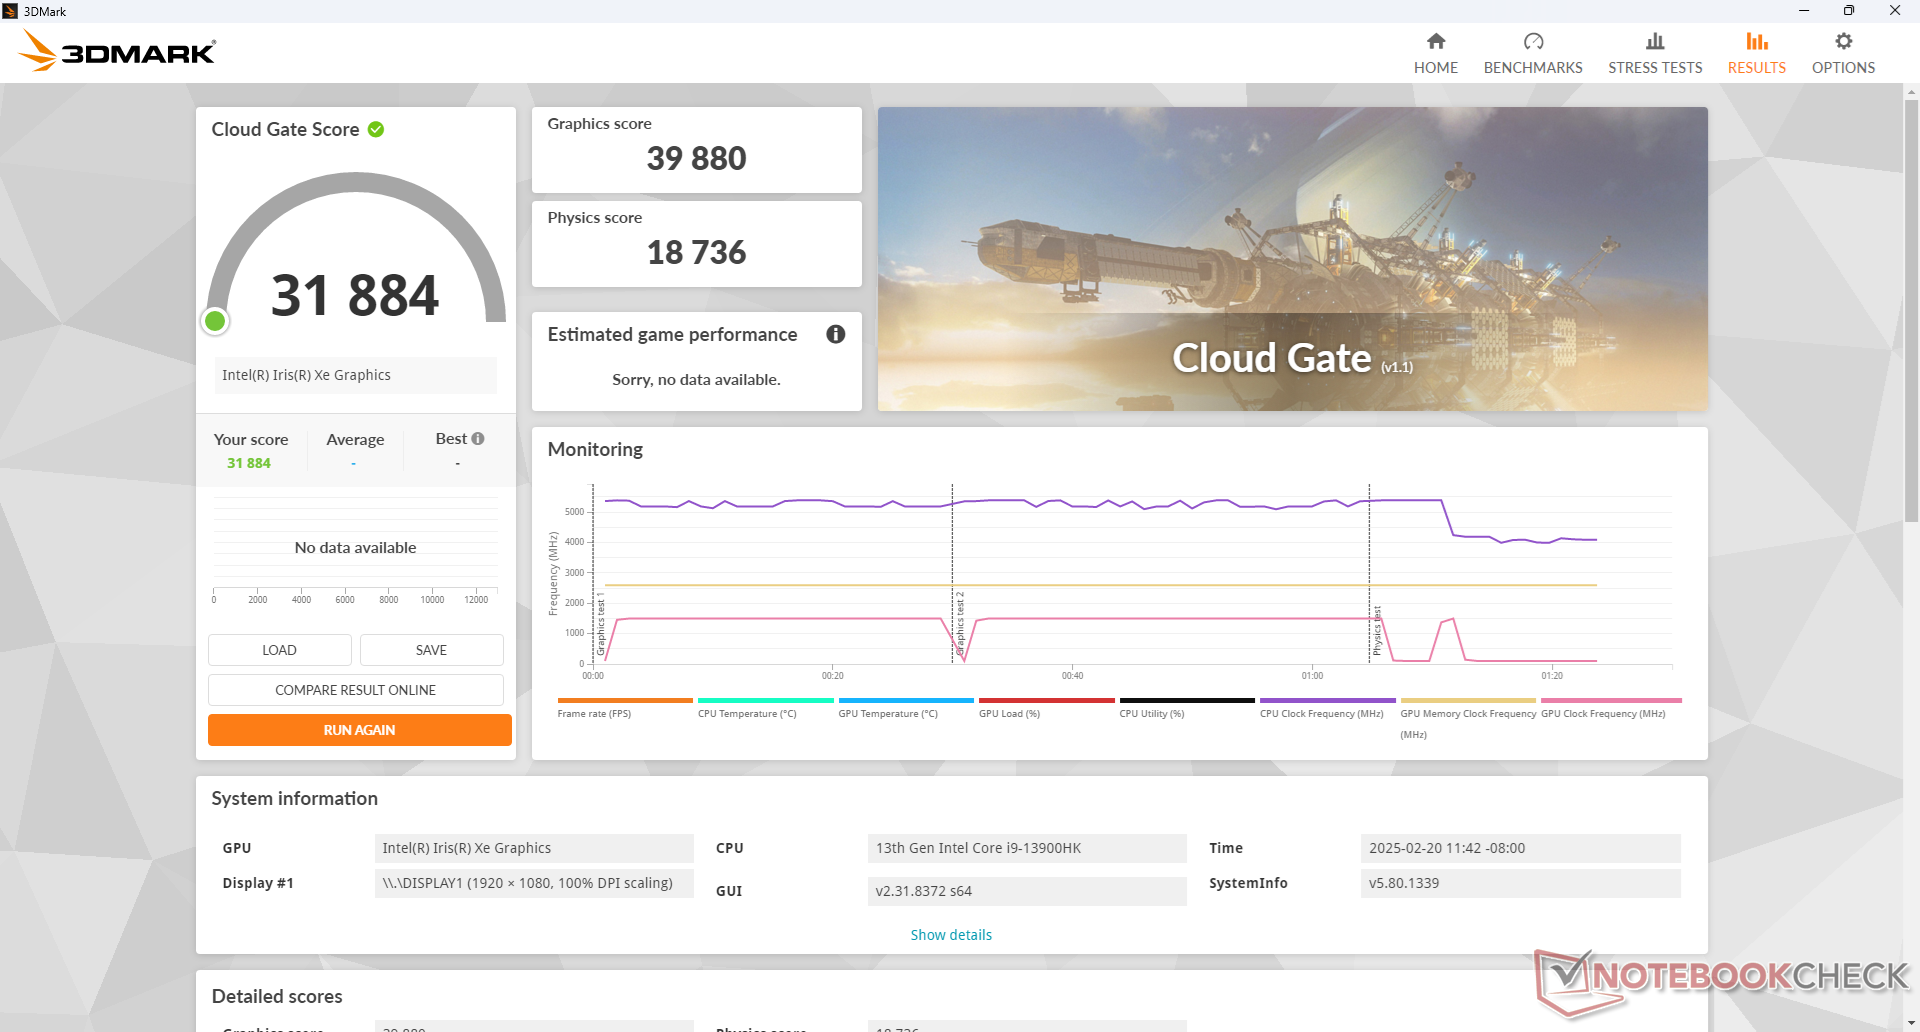
Wydajność GPU
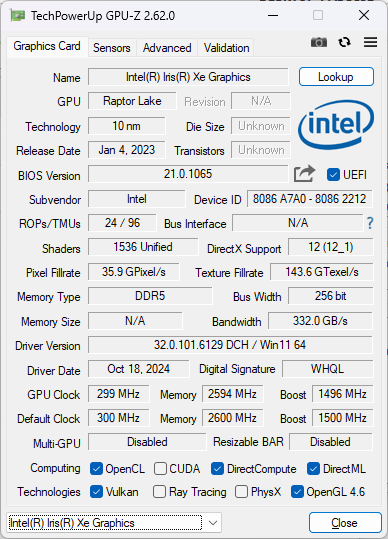
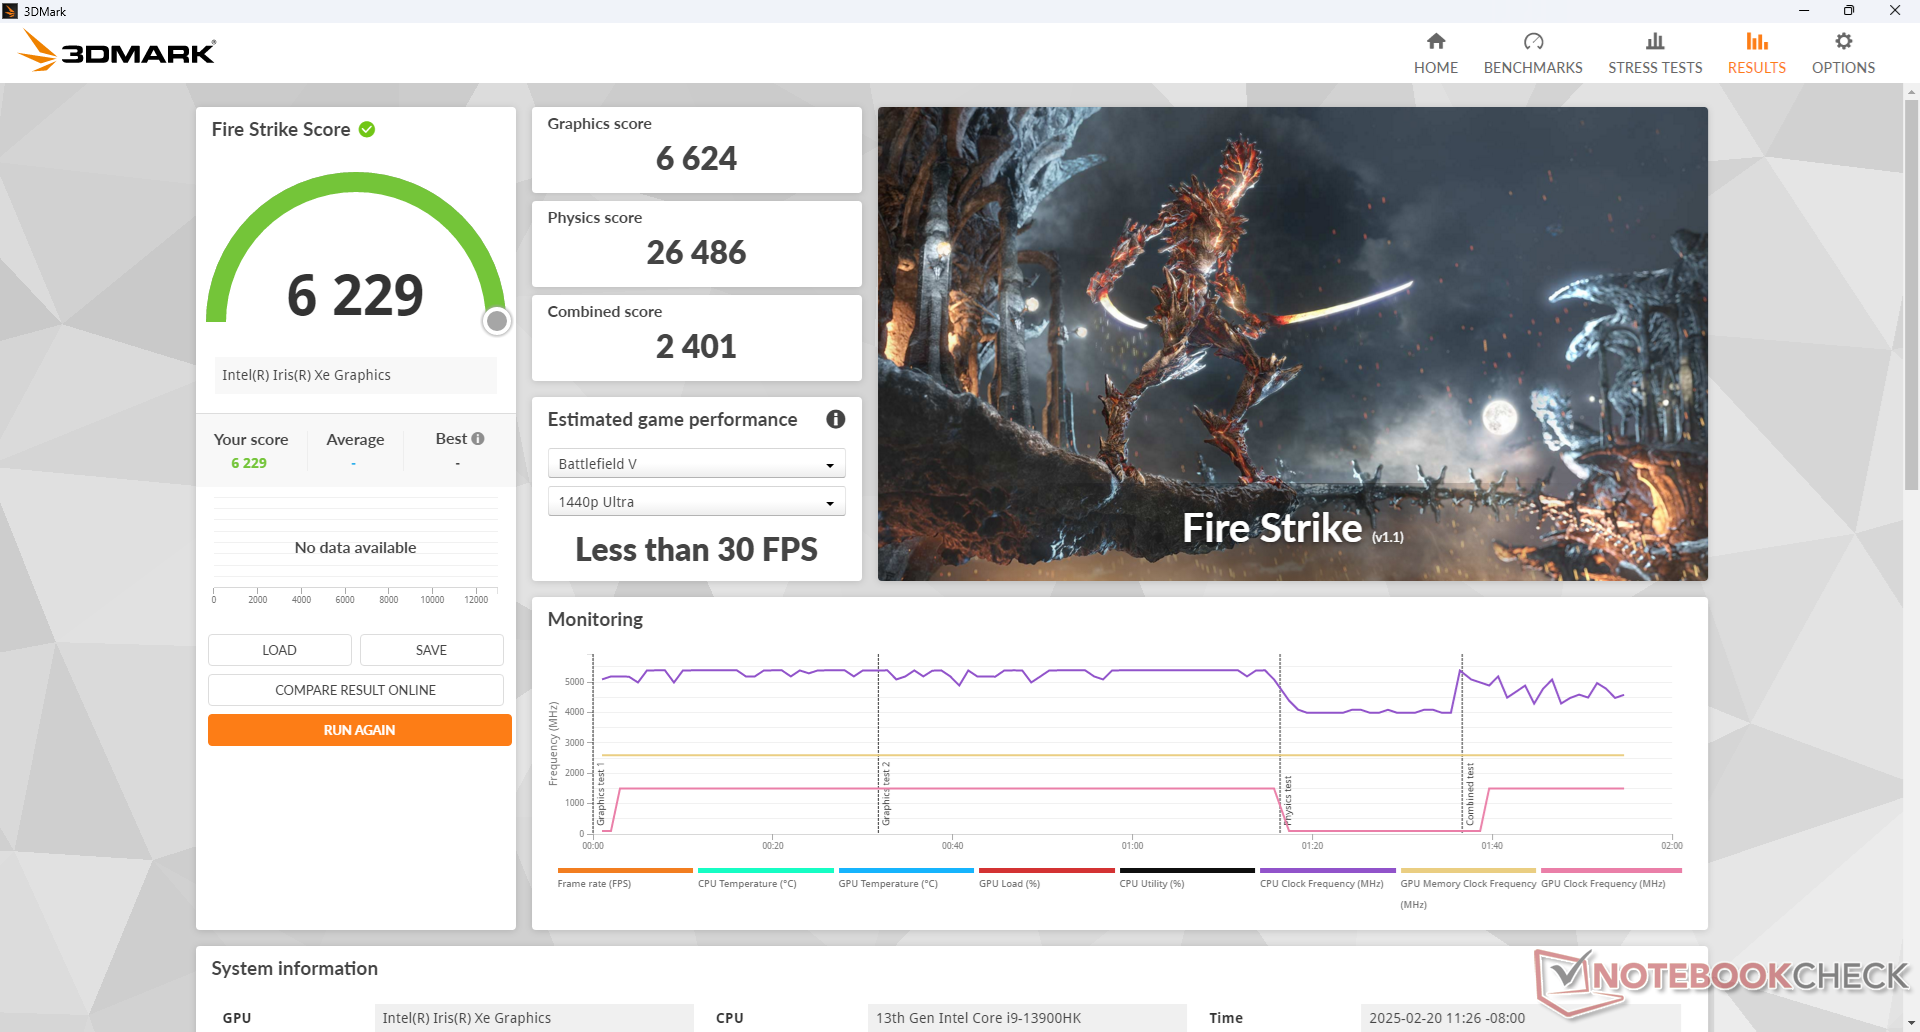
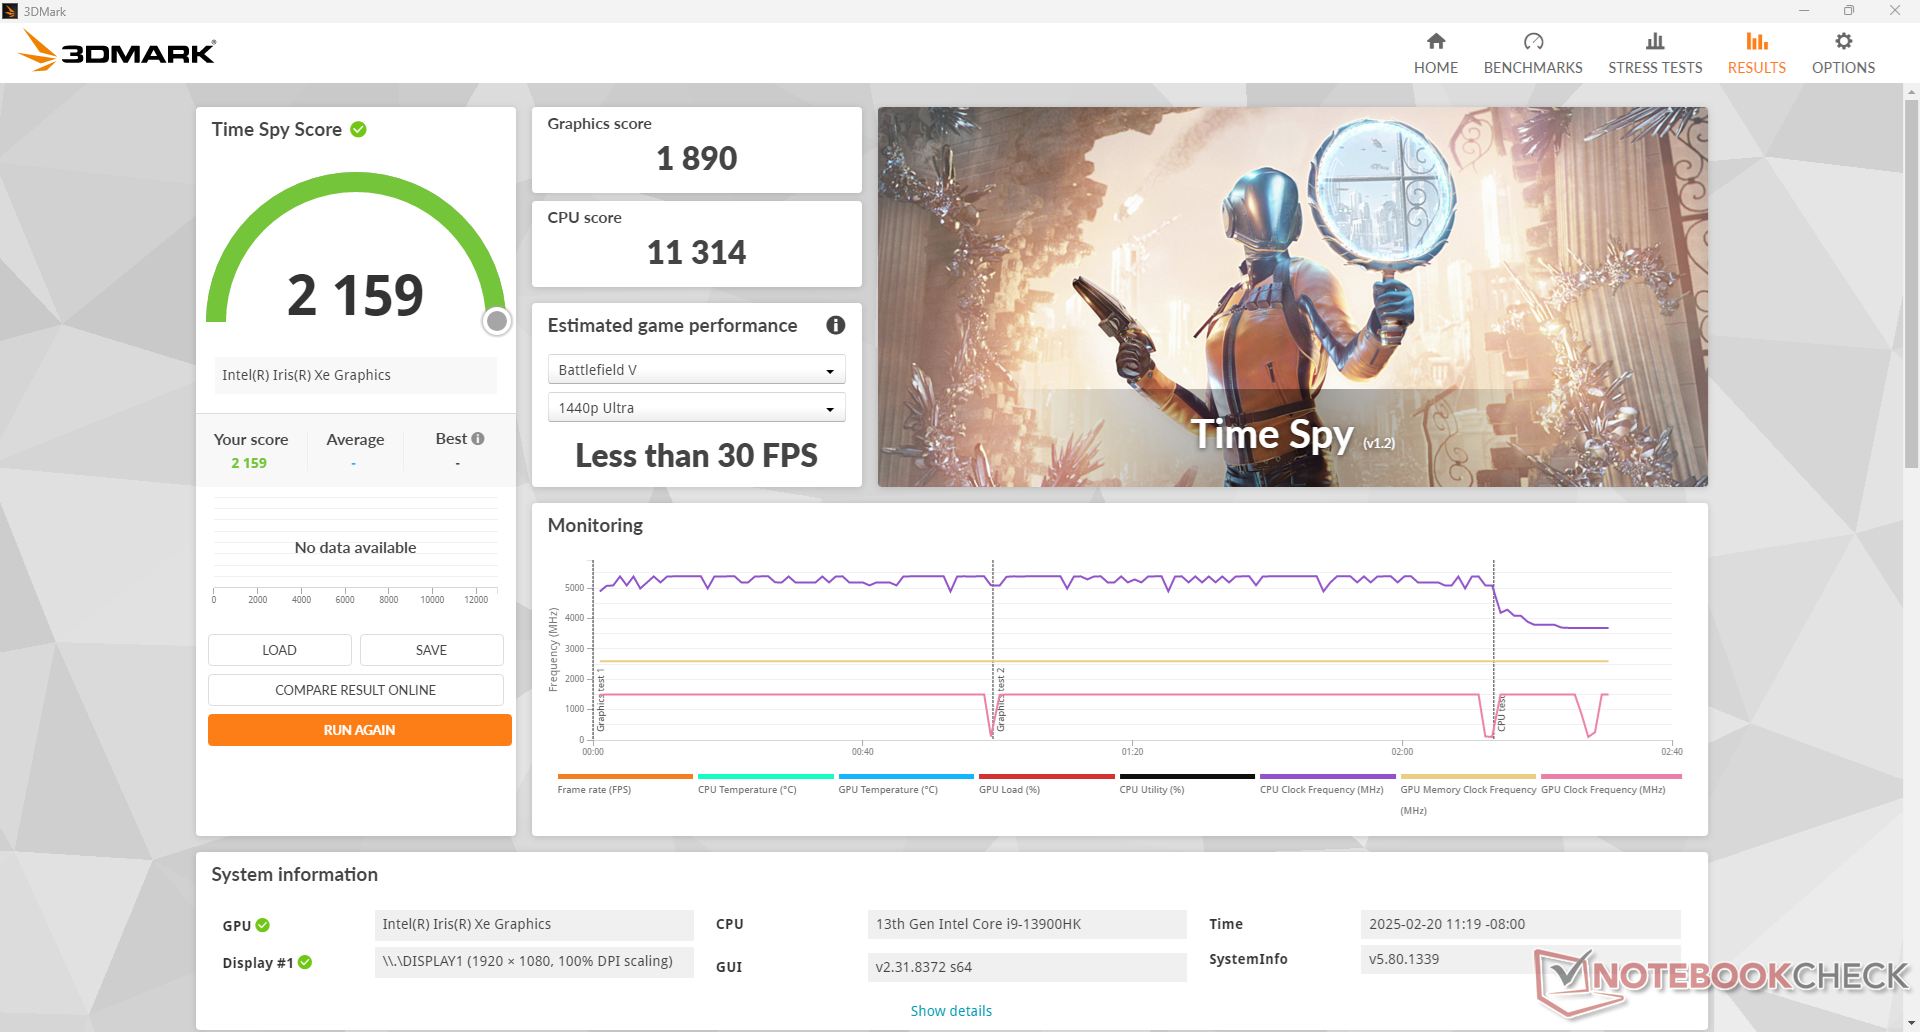
Starzejąca się Iris Xe Graphics G7 96EUs jest teraz dwie do trzech generacji za najnowszym Radeonem 890M lub Intel Arc 140 co przekłada się na nawet o 50 procent niższą wydajność. Wymagające tytuły, takie jak Cyberpunk 2077 , mają problemy z działaniem na tym mini PC niezależnie od ustawień.
X-Plane 11.11 nie uruchamia się bez względu na ustawienia.

| 3DMark 11 Performance | 8451 pkt. | |
| 3DMark Cloud Gate Standard Score | 31884 pkt. | |
| 3DMark Fire Strike Score | 6229 pkt. | |
| 3DMark Time Spy Score | 2159 pkt. | |
Pomoc | ||
| Blender | |
| v3.3 Classroom HIP/AMD | |
| GMK NucBox K2 | |
| v3.3 Classroom OPTIX/RTX | |
| Beelink GTI12 Ultra EX Docking Station | |
| Asus ROG NUC 14-90AS0051 | |
| v3.3 Classroom CUDA | |
| Beelink GTI12 Ultra EX Docking Station | |
| v3.3 Classroom CPU | |
| Przeciętny Intel Iris Xe Graphics G7 96EUs (336 - 1259, n=104) | |
| Beelink GTR7 7840HS | |
| Khadas Mind 2 | |
| GMK NucBox K2 | |
| GMK NucBox K9 | |
| Minisforum Venus Series NAB9 | |
| Beelink GTI13 Ultra | |
| Beelink GTI12 Ultra EX Docking Station | |
| BOSGAME M2 | |
| Asus ROG NUC 14-90AS0051 | |
| Beelink SER9 | |
| v3.3 Classroom oneAPI/Intel | |
| GMK NucBox K9 | |
| Asus ROG NUC 14-90AS0051 | |
| Khadas Mind 2 | |
* ... im mniej tym lepiej
Cyberpunk 2077 ultra FPS Chart
| low | med. | high | ultra | |
|---|---|---|---|---|
| GTA V (2015) | 164.6 | 152.7 | 30.9 | 12.5 |
| Dota 2 Reborn (2015) | 124.3 | 99.4 | 84.8 | 77.4 |
| Final Fantasy XV Benchmark (2018) | 56.1 | 31.1 | 21.2 | |
| Far Cry 5 (2018) | 74 | 38 | 35 | 33 |
| Strange Brigade (2018) | 112.9 | 50.2 | 39.2 | 31.4 |
| Tiny Tina's Wonderlands (2022) | 37.2 | 29.3 | 18.2 | 14.1 |
| F1 22 (2022) | 56.9 | 51.7 | 37 | 28.2 |
| Baldur's Gate 3 (2023) | 29.3 | 18.2 | 14.1 | |
| Cyberpunk 2077 2.2 Phantom Liberty (2023) | 22.2 | 17.6 | 14.8 | 12.9 |
Emisje
Hałas systemowy
Hałas wentylatorów jest z pewnością cichszy niż w przypadku wielu innych mini PC, szczególnie tych napędzanych procesorami AMD. Jednak te same alternatywy AMD są również znacznie szybsze, jeśli chodzi o wydajność graficzną, co pokazują nasze wykresy porównawcze powyżej.

Hałas
| luz |
| 26.5 / 26.7 / 28.5 dB |
| obciążenie |
| 30.6 / 30.8 dB |
 | ||
30 dB cichy 40 dB(A) słyszalny 50 dB(A) irytujący |
||
min: | ||
| Beelink GTI13 Ultra Iris Xe G7 96EUs, i9-13900HK, Crucial P5 Plus 1TB CT1000P5PSSD8 | Beelink SER9 Radeon 890M, Ryzen AI 9 HX 370, Crucial P3 Plus CT1000P3PSSD8 | Beelink GTR7 7840HS Radeon 780M, R7 7840HS, Crucial P3 Plus CT1000P3PSSD8 | GMK EVO-X1 Radeon 890M, Ryzen AI 9 HX 370, Crucial P3 Plus CT1000P3PSSD8 | Minisforum EliteMini AI370 Radeon 890M, Ryzen AI 9 HX 370, Crucial P3 Plus CT1000P3PSSD8 | GMK NucBox K9 Arc 7-Core, Ultra 5 125H, MasonSemi 1TB MC7000 | |
|---|---|---|---|---|---|---|
| Noise | -3% | -12% | -22% | -20% | -26% | |
| wyłączone / środowisko * | 23.4 | 23.2 1% | 25.6 -9% | 23.3 -0% | 24.8 -6% | 23 2% |
| Idle Minimum * | 26.5 | 26.6 -0% | 28.1 -6% | 27.8 -5% | 25 6% | 29.8 -12% |
| Idle Average * | 26.7 | 26.8 -0% | 28.1 -5% | 30.3 -13% | 25.1 6% | 35.7 -34% |
| Idle Maximum * | 28.5 | 26.8 6% | 28.1 1% | 30.4 -7% | 29.1 -2% | 35.7 -25% |
| Load Average * | 30.6 | 33.4 -9% | 34.9 -14% | 44.6 -46% | 47 -54% | 41.9 -37% |
| Cyberpunk 2077 ultra * | 32.5 | 34.6 -6% | 44.2 -36% | 44 -35% | 43.8 -35% | |
| Load Maximum * | 30.8 | 33.8 -10% | 42.4 -38% | 46.1 -50% | 47.1 -53% | 44 -43% |
| Witcher 3 ultra * | 36.4 |
* ... im mniej tym lepiej
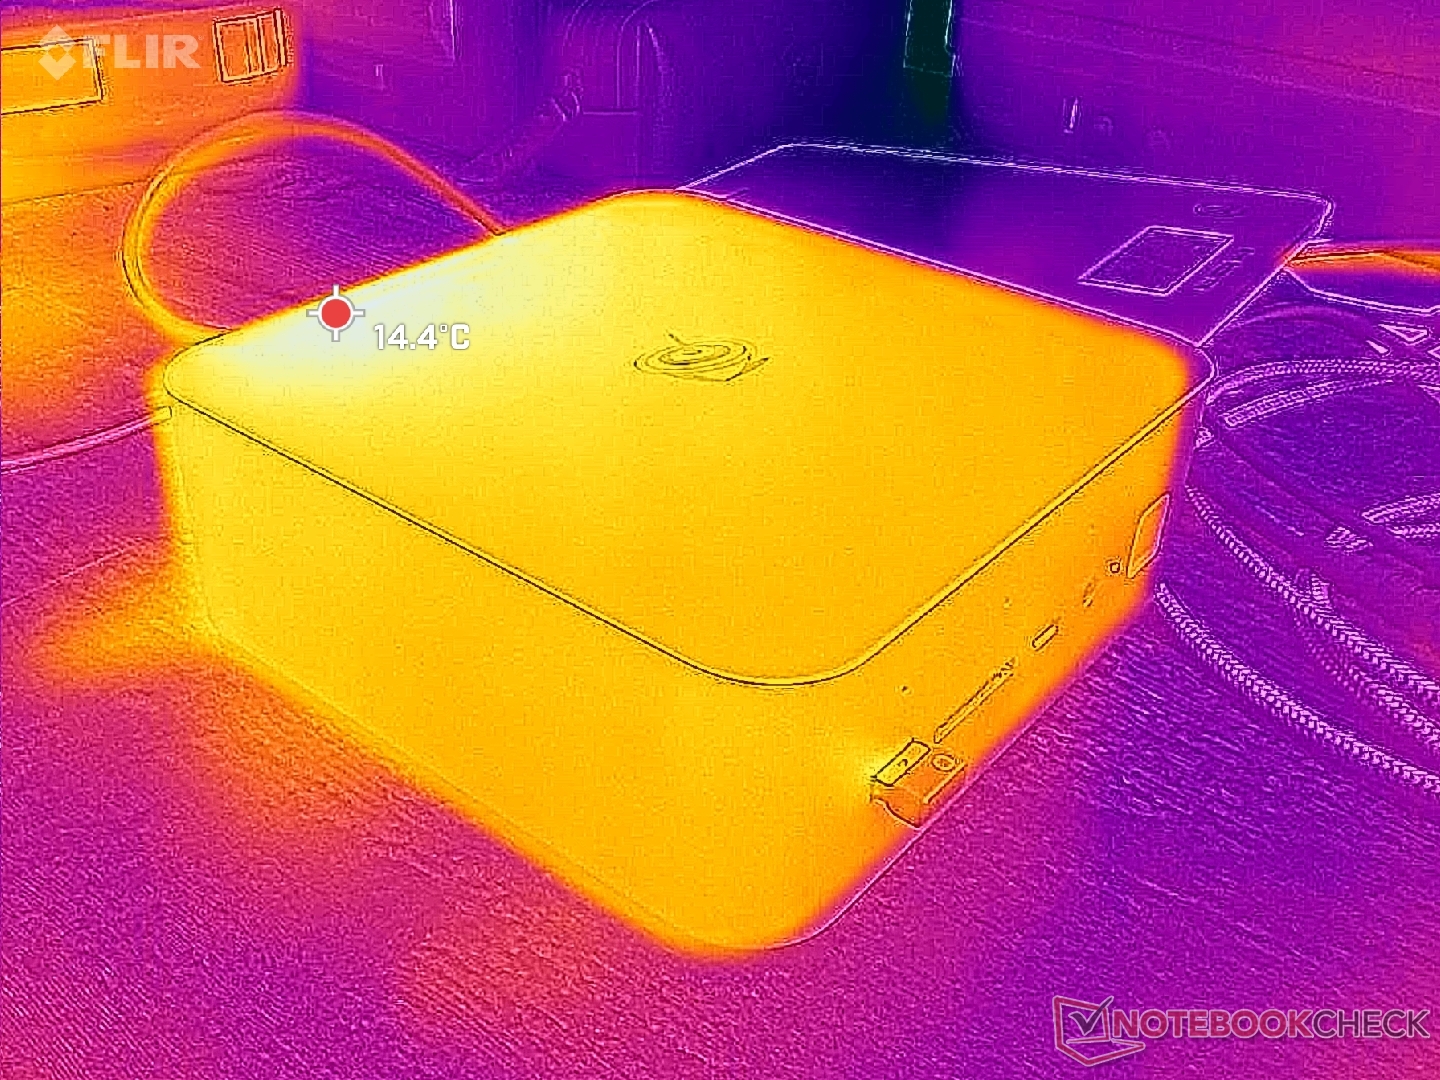
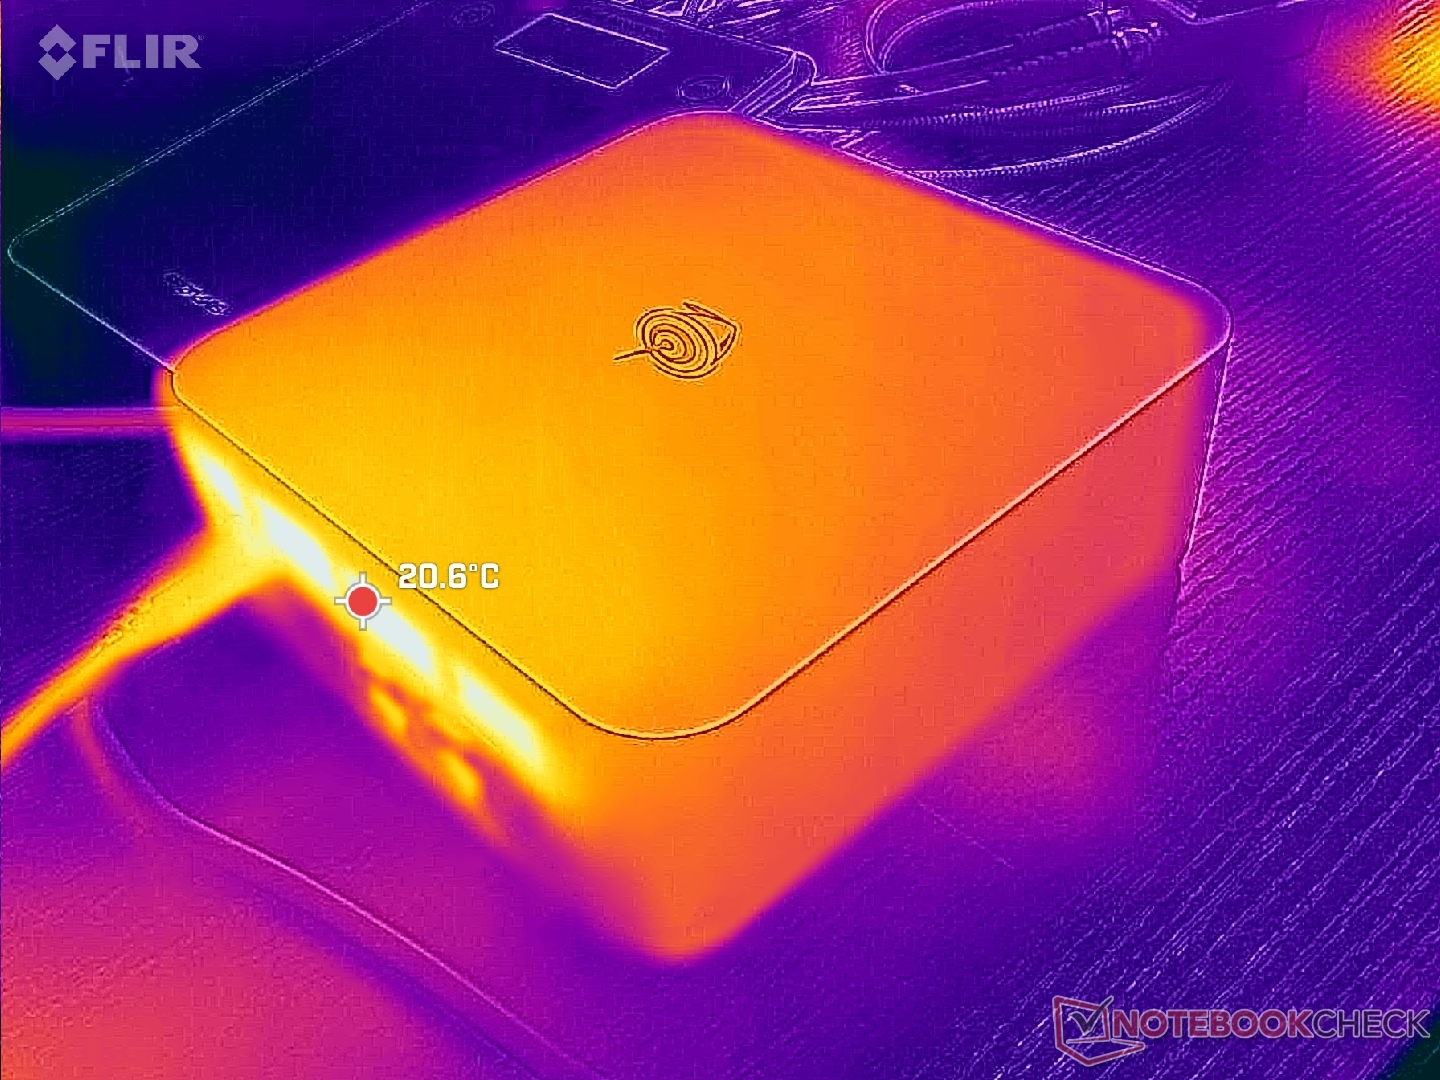
Temperatura

Głośniki
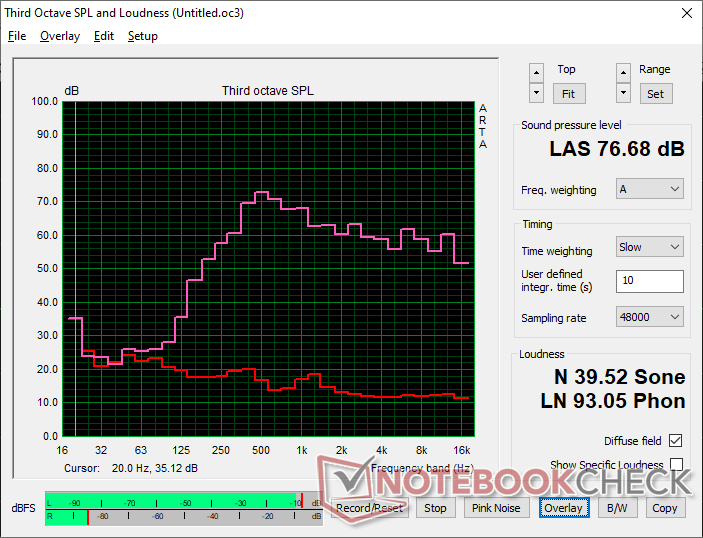
Beelink GTI13 Ultra analiza dźwięku
(±) | głośność głośnika jest średnia, ale dobra (76.7 dB)
Bas 100 - 315 Hz
(±) | zredukowany bas - średnio 13.4% niższy od mediany
(±) | liniowość basu jest średnia (12.6% delta do poprzedniej częstotliwości)
Średnie 400 - 2000 Hz
(±) | wyższe średnie - średnio 6.7% wyższe niż mediana
(±) | liniowość środka jest średnia (7.2% delta do poprzedniej częstotliwości)
Wysokie 2–16 kHz
(+) | zrównoważone maksima - tylko 2.5% od mediany
(±) | liniowość wysokich wartości jest średnia (7.1% delta do poprzedniej częstotliwości)
Ogólnie 100 - 16.000 Hz
(±) | liniowość ogólnego dźwięku jest średnia (17.2% różnicy w stosunku do mediany)
W porównaniu do tej samej klasy
» 21% wszystkich testowanych urządzeń w tej klasie było lepszych, 11% podobnych, 68% gorszych
» Najlepszy miał deltę 13%, średnia wynosiła ###średnia###%, najgorsza wynosiła 64%
W porównaniu do wszystkich testowanych urządzeń
» 29% wszystkich testowanych urządzeń było lepszych, 8% podobnych, 63% gorszych
» Najlepszy miał deltę 4%, średnia wynosiła ###średnia###%, najgorsza wynosiła 134%
Apple MacBook Pro 16 2021 M1 Pro analiza dźwięku
(+) | głośniki mogą odtwarzać stosunkowo głośno (84.7 dB)
Bas 100 - 315 Hz
(+) | dobry bas - tylko 3.8% od mediany
(+) | bas jest liniowy (5.2% delta do poprzedniej częstotliwości)
Średnie 400 - 2000 Hz
(+) | zbalansowane środki średnie - tylko 1.3% od mediany
(+) | średnie są liniowe (2.1% delta do poprzedniej częstotliwości)
Wysokie 2–16 kHz
(+) | zrównoważone maksima - tylko 1.9% od mediany
(+) | wzloty są liniowe (2.7% delta do poprzedniej częstotliwości)
Ogólnie 100 - 16.000 Hz
(+) | ogólny dźwięk jest liniowy (4.6% różnicy w stosunku do mediany)
W porównaniu do tej samej klasy
» 0% wszystkich testowanych urządzeń w tej klasie było lepszych, 0% podobnych, 100% gorszych
» Najlepszy miał deltę 5%, średnia wynosiła ###średnia###%, najgorsza wynosiła 45%
W porównaniu do wszystkich testowanych urządzeń
» 0% wszystkich testowanych urządzeń było lepszych, 0% podobnych, 100% gorszych
» Najlepszy miał deltę 4%, średnia wynosiła ###średnia###%, najgorsza wynosiła 134%
Zarządzanie energią
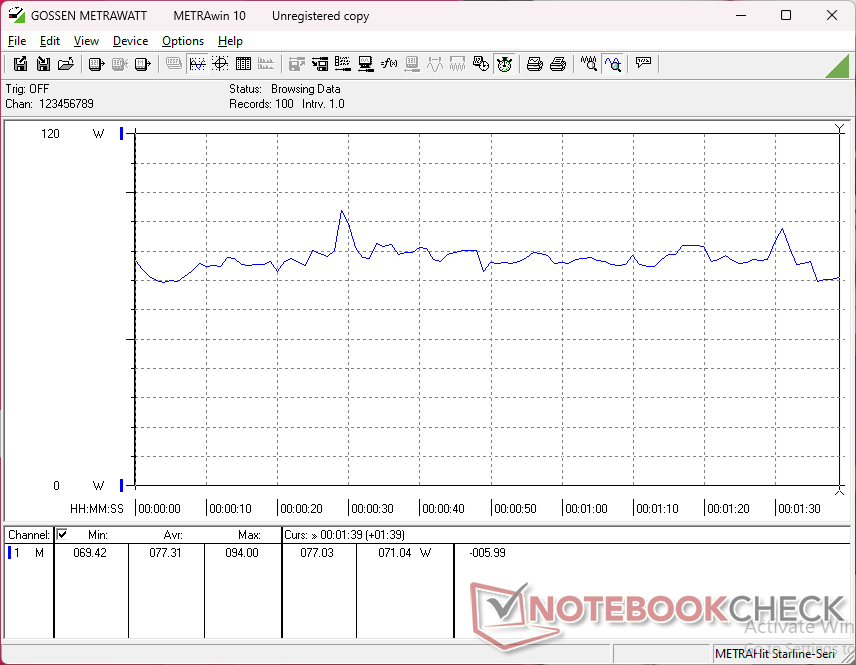
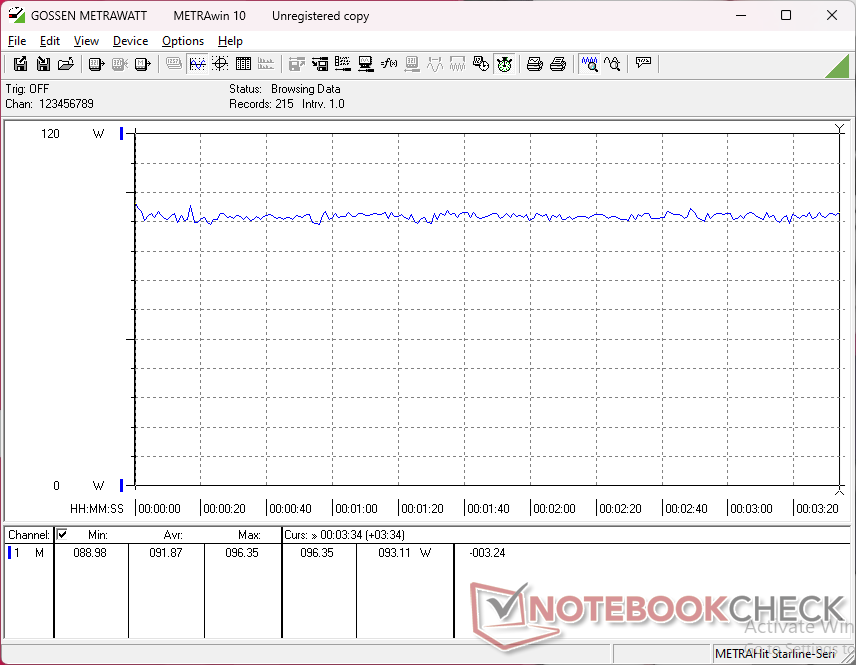
Zużycie energii
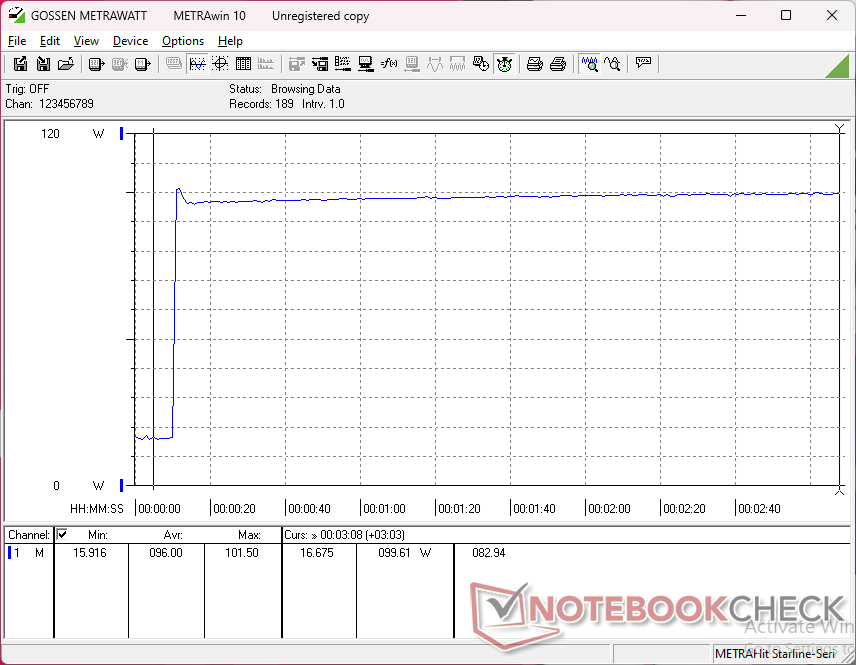
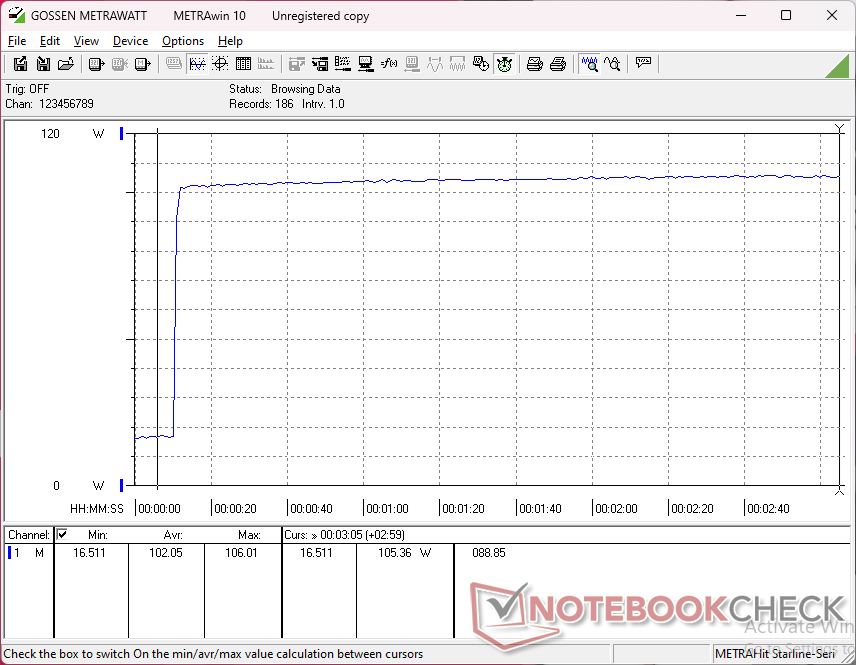
Nasz system Intela jest ogólnie bardziej wymagający niż konkurencyjne alternatywy AMD, pomimo wolniejszego procesora i wydajności graficznej, co przekłada się na niższą wydajność w przeliczeniu na wat. Proszę zauważyć, że GTI13 Ultra wymaga zewnętrznego zasilacza, w przeciwieństwie do większości mini PC.
| wyłączony / stan wstrzymania | |
| luz | |
| obciążenie |
|
Legenda:
min: | |
| Beelink GTI13 Ultra i9-13900HK, Iris Xe G7 96EUs, Crucial P5 Plus 1TB CT1000P5PSSD8, , x, | Beelink SER9 Ryzen AI 9 HX 370, Radeon 890M, Crucial P3 Plus CT1000P3PSSD8, , x, | Beelink GTR7 7840HS R7 7840HS, Radeon 780M, Crucial P3 Plus CT1000P3PSSD8, , x, | GMK EVO-X1 Ryzen AI 9 HX 370, Radeon 890M, Crucial P3 Plus CT1000P3PSSD8, , x, | Minisforum EliteMini AI370 Ryzen AI 9 HX 370, Radeon 890M, Crucial P3 Plus CT1000P3PSSD8, , x, | GMK NucBox K9 Ultra 5 125H, Arc 7-Core, MasonSemi 1TB MC7000, , x, | |
|---|---|---|---|---|---|---|
| Power Consumption | 40% | 37% | 42% | 43% | 33% | |
| Idle Minimum * | 15.7 | 5.7 64% | 5.5 65% | 5.4 66% | 3.4 78% | 10.9 31% |
| Idle Average * | 16.5 | 5.9 64% | 5.8 65% | 5.8 65% | 4.9 70% | 11 33% |
| Idle Maximum * | 16.5 | 6 64% | 7.7 53% | 5.8 65% | 7.4 55% | 11.4 31% |
| Load Average * | 77.3 | 68.7 11% | 70.6 9% | 72.1 7% | 70.7 9% | 52.8 32% |
| Cyberpunk 2077 ultra external monitor * | 91.9 | 78.2 15% | 72.5 21% | 69.6 24% | 57.1 38% | |
| Load Maximum * | 106 | 82 23% | 111.8 -5% | 76.1 28% | 82.6 22% | 72.2 32% |
| Witcher 3 ultra * | 79.8 |
* ... im mniej tym lepiej
Power Consumption Cyberpunk / Stress Test
Power Consumption external Monitor
Ocena Notebookcheck
Beelink GTI13 Ultra
- 26/02/2025 v8
Allen Ngo
 Total Sustainability Score:
 Przezroczystość
Wyboru urządzeń do recenzji dokonuje nasza redakcja. Próbka testowa została udostępniona autorowi jako pożyczka od producenta lub sprzedawcy detalicznego na potrzeby tej recenzji. Pożyczkodawca nie miał wpływu na tę recenzję, producent nie otrzymał też kopii tej recenzji przed publikacją. Nie było obowiązku publikowania tej recenzji. Nigdy nie przyjmujemy rekompensaty ani płatności w zamian za nasze recenzje. Jako niezależna firma medialna, Notebookcheck nie podlega władzy producentów, sprzedawców detalicznych ani wydawców.
Tak testuje Notebookcheck
Każdego roku Notebookcheck niezależnie sprawdza setki laptopów i smartfonów, stosując standardowe procedury, aby zapewnić porównywalność wszystkich wyników. Od około 20 lat stale rozwijamy nasze metody badawcze, ustanawiając przy tym standardy branżowe. W naszych laboratoriach testowych doświadczeni technicy i redaktorzy korzystają z wysokiej jakości sprzętu pomiarowego. Testy te obejmują wieloetapowy proces walidacji. Nasz kompleksowy system ocen opiera się na setkach uzasadnionych pomiarów i benchmarków, co pozwala zachować obiektywizm.
