Notebookcheck Logo

Recenzja mini PC Beelink GTI12 Ultra EX Docking Station: Bardziej przystępny niż oczekiwano
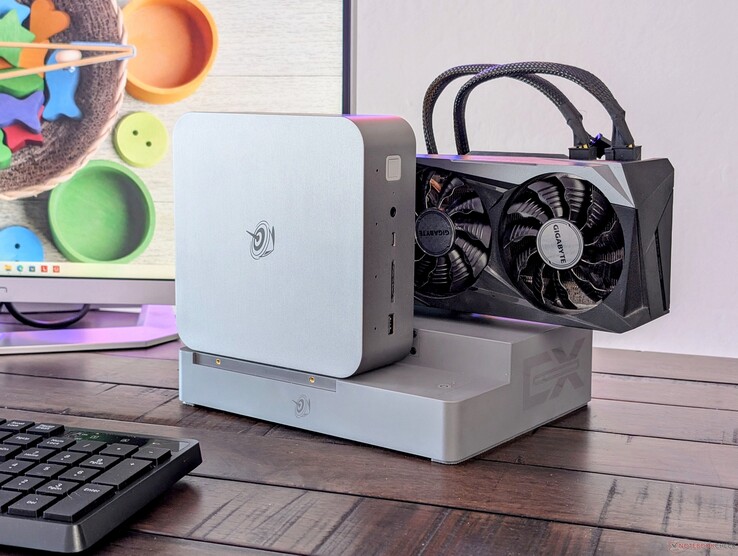
Gotowy do gier mini PC i eGPU za mniej niż 1000 USD.

Stacje dokujące Mini PC eGPU jeszcze kilka lat temu były zarówno rzadkie, jak i drogie, ale stacja dokująca Beelink EX jest jedną z najtańszych opcji do tej pory, bez konieczności poświęcania funkcji lub jakości po drodze.
Alder Lake Mini PC Gaming Geforce
Stacja dokująca Beelink GTI12 Ultra EX

Głównym zarzutem wobec mini PC Beelink do tej pory jest to, że wszystkie są wyposażone tylko w zintegrowaną grafikę. Chociaż najnowsza seria GTI Ultra nie rozwiązuje tego problemu bezpośrednio, to jednak jest to pierwszy krok Beelink w kierunku oficjalnego wsparcia dla eGPU za pośrednictwem stacji dokującej EX, która ma być atrakcyjna dla zaawansowanych użytkowników lub graczy.

Nasza jednostka testowa to GTI12 Ultra wyposażony w Core i9-12900H, 1 TB SSD i 32 GB DDR5-5600 RAM za około 740 USD w połączeniu ze stacją dokującą EX. Nowsze procesory Meteor Lake są dostępne pod nazwą GTI14 Ultra, która wizualnie jest identyczna z GTI12 Ultra.

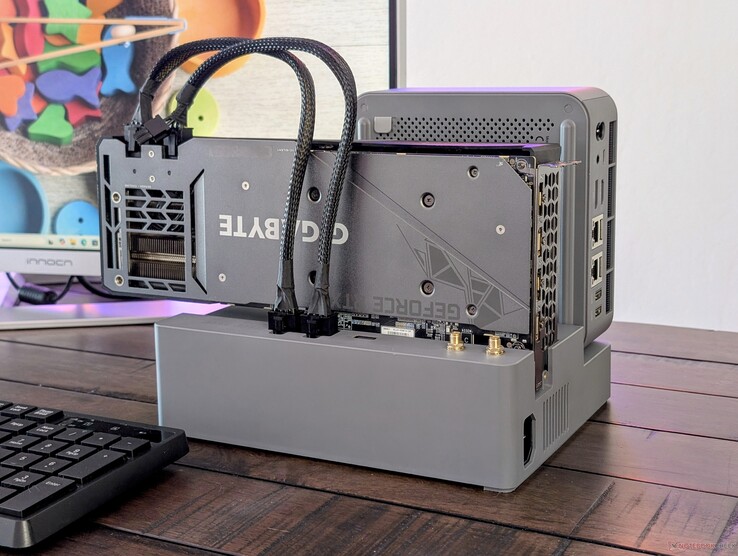
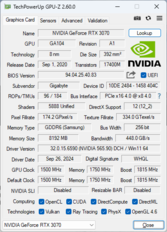
Do testów stacji dokującej EX Docking Station nabyliśmy osobisty procesor graficzny Gigabyte GeForce RTX 3070, ale sama stacja dokująca może obsługiwać procesory graficzne do RTX 4090 przy maksymalnej mocy 600 W.

Więcej recenzji Beelink:

Beelink GTI12 Ultra EX Docking Station
Procesor
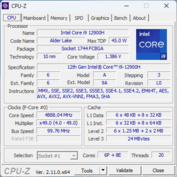
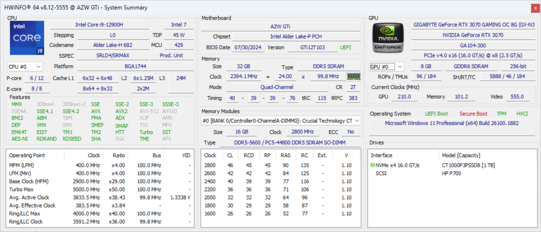
Intel Core i9-12900H 14 x 1.8 - 5 GHz, 70 W PL2 / Short Burst, 60 W PL1 / Sustained, Alder Lake-H
Karta grafiki
NVIDIA GeForce RTX 3070 - 8 GB VRAM, rdzeń: 1815 MHz, pamięć: 1750 MHz, 270 W TDP, GDDR6, 565.90
Pamięć
32 GB 
, Crucial, DDR5-5600, Dual-Channel, 40-39-39-76
Chipset
Intel Alder Lake-P PCH
Dysk twardy
Crucial P3 Plus CT1000P3PSSD8, 1024 GB 
Karta dźwiękowa
Intel Alder Lake-P PCH - cAVS (Audio, Voice, Speech)
Złącza
1 USB 2.0, 6 USB 3.1 Gen2, 1 USB 4.0 40 Gbps, 1 Thunderbolt, USB-C Power Delivery (PD), 1 HDMI, 2 DisplayPort, gniazda audio: 2x 3.5 mm headset, czytnik kart: SD, 1 czytnik linii papilarnych, PCIe4 x8
Łączność
Intel Ethernet Controller I226-V (10/2500MBit/s), Intel Wi-Fi 6 AX200 (a/b/g/n = Wi-Fi 4/ac = Wi-Fi 5/ax = Wi-Fi 6/), Bluetooth 5.2
Gabaryty
wysokość x szerokość x głębokość (mm): 55.8 x 158 x 158
System operacyjny
Microsoft Windows 11 Pro
Inne
głośniki: Stereo, 12 miesiące(y) gwarancji
Waga
1.316 kg, zasilacz: 0 g
Cena
740 USD
Note: The manufacturer may use components from different suppliers including display panels, drives or memory sticks with similar specifications.


Potencjalni konkurenci w porównaniu

Rating
Version
Date
Model
Weight
Height
Size
Resolution
Price
76.5 %v8
10/2024
Beelink GTI12 Ultra EX Docking Station
i9-12900H, NVIDIA GeForce RTX 3070
1.3 kg55.8 mmx
76.7 %v8
10/2024
Minisforum MS-A1
Ryzen 7 8700G, Radeon 780M
1.7 kg48 mmx
67.3 %v8
09/2024
GMK NucBox K9
Ultra 5 125H, Arc 7-Core
528 g47 mmx
74.7 %v8
08/2024
Asus NUC 14 Pro
Ultra 5 125H, Arc 7-Core
525 g37 mmx
78.4 %v8
08/2024
Geekom AX8 Pro
R9 8945H, Radeon 780M
548 g37 mmx
86 %v8
08/2024
Asus ROG NUC 14-90AS0051
Ultra 9 185H, NVIDIA GeForce RTX 4070 Laptop GPU
2.6 kg50 mmx

Sprawa

GTI12 Ultra jest zasadniczo powiększonym SER8 wykorzystując te same metalowe materiały obudowy, plastikowy spód i gładkie matowe wykończenie. Wewnętrznie jednak oba modele znacznie się różnią, ponieważ GTI12 Ultra integruje 145 W zasilacz zamiast polegać na zewnętrznym zasilaczu. Zintegrowano w nim również dwa głośniki, dzięki czemu jest to jeden z niewielu mini PC ze zintegrowanym dźwiękiem i zasilaczem.
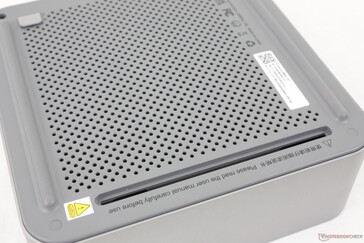
Kolejną unikalną cechą jest gniazdo PCI x8 na spodzie urządzenia do podłączenia do stacji dokującej EX, jak pokazano na poniższym obrazku. Doceniamy fakt, że złącze nie jest zastrzeżone, jak w przypadku Asus ROG XG Mobile.
Urządzenie jest znacznie większe i cięższe niż większość innych mini PC ze zintegrowaną grafiką ze względu na unikalne cechy wspomniane powyżej.

Mini PCStacja dokująca EXMini PC + stacja dokująca EX
1316 g1419 g2735 g


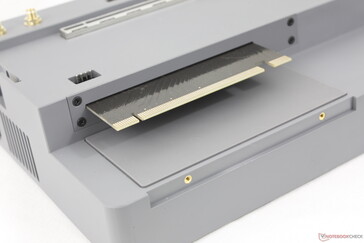
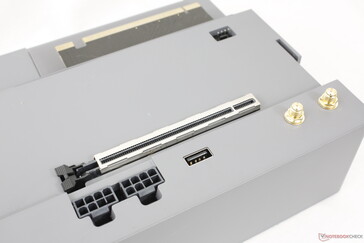
Stacja dokująca EX Docking jest zasadniczo pionem PCIe, ponieważ nie wykorzystuje żadnych zastrzeżonych portów
Zdejmowaną płytkę można wkręcić w dwa złote gwinty, aby lepiej przymocować mini PC do stacji dokującej
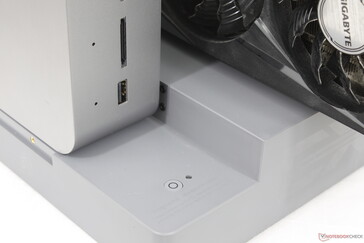
Stacja dokująca posiada oddzielny przycisk zasilania i kabel zasilający
Stacja dokująca zapewnia tylko jeden dodatkowy port USB-A pomimo swoich dużych rozmiarów
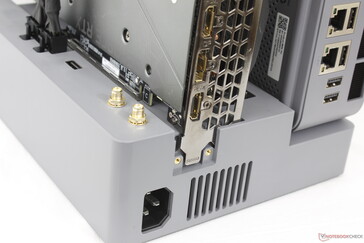
Dwa 8-pinowe złącza z możliwością podłączenia anteny Wi-Fi (sprzedawane oddzielnie)
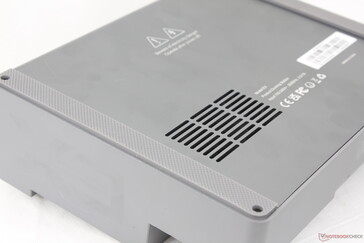
Spód stacji dokującej jest zabezpieczony tylko czterema śrubami krzyżakowymi, co ułatwia serwisowanie
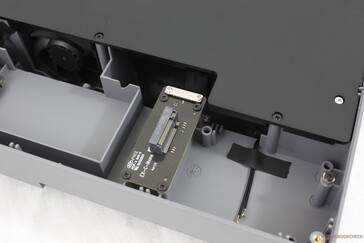
Użytkownicy mogą zainstalować dysk SSD M.2 lub moduł Wi-Fi wewnątrz stacji dokującej, ale nie oba jednocześnie
Spód GTI12 Ultra mini PC pokazujący gniazdo PCIe do podłączenia do stacji dokującej

Porównanie rozmiarów

270 mm 180 mm 50 mm 2.6 kg189.5 mm 186 mm 48 mm 1.7 kg158 mm 158 mm 55.8 mm 1.3 kg128 mm 126 mm 47 mm 528 g117 mm 112 mm 37 mm 525 g117 mm 112 mm 37 mm 548 g297 mm 210 mm 1 mm 5.7 g

Łączność

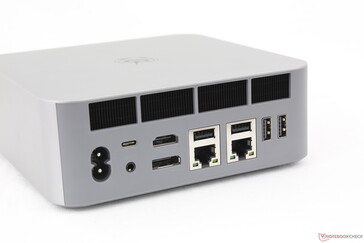
Opcje portów są większe niż w SER8 i wielu innych mini PC w rozmiarze NUC, ponieważ GTI12 Ultra jest tak duży. Model ten posiada czytnik kart SD oraz dodatkowe porty USB-A i RJ-45.

Nie ma blokady Kensington.

Przód: USB-A 3.0 (10 Gb/s), czytnik SD, USB-C (10 Gb/s), zestaw słuchawkowy 3,5 mm, przycisk zasilania z odciskiem palca, poczwórny układ mikrofonów
Tył: Zasilanie AC (bez zewnętrznego zasilacza), USB-C Thunderbolt 4 z DisplayPort + Power Delivery, zestaw słuchawkowy 3,5 mm, HDMI (4K@60), DisplayPort 1.4 (4K@144), 2x RJ-45 (2,5 Gb/s), 4x USB-A 3.0 (10 Gb/s)

Czytnik kart SD

SD Card Reader
average JPG Copy Test (av. of 3 runs)
Asus ROG NUC 14-90AS0051
Intel Core Ultra 9 185H (AV Pro SD microSD 128 GB V60)
88.75 MB/s +323%
Beelink GTI12 Ultra EX Docking Station
Intel Core i9-12900H (Toshiba Exceria Pro SDXC 64 GB UHS-II)
21 MB/s
maximum AS SSD Seq Read Test (1GB)
Asus ROG NUC 14-90AS0051
Intel Core Ultra 9 185H (AV Pro SD microSD 128 GB V60)
91.05 MB/s +338%
Beelink GTI12 Ultra EX Docking Station
Intel Core i9-12900H (Toshiba Exceria Pro SDXC 64 GB UHS-II)
20.8 MB/s

Komunikacja

Wi-Fi 6E i Wi-Fi 7 nie są obsługiwane, aby zaoszczędzić na kosztach.

Networking
iperf3 transmit AXE11000
Asus NUC 14 Pro
Intel Wi-Fi 6E AX211
1331 (1187min - 1442max) MBit/s +24%
Beelink GTI12 Ultra EX Docking Station
Intel Wi-Fi 6 AX200
1075 (555min - 1239max) MBit/s
Asus ROG NUC 14-90AS0051
Killer Wi-Fi 6E AX1690i 160MHz
966 (943min - 999max) MBit/s -10%
Geekom AX8 Pro
MediaTek Wi-Fi 6E MT7922 160MHz Wireless LAN Card
966 (921min - 1008max) MBit/s -10%
Minisforum MS-A1
Intel Wi-Fi 6E AX210
855 (438min - 894max) MBit/s -20%
GMK NucBox K9
Intel Wi-Fi 6 AX201
823 (607min - 901max) MBit/s -23%
iperf3 receive AXE11000
Asus NUC 14 Pro
Intel Wi-Fi 6E AX211
1379 (1016min - 1613max) MBit/s +10%
Beelink GTI12 Ultra EX Docking Station
Intel Wi-Fi 6 AX200
1251 (617min - 1359max) MBit/s
Geekom AX8 Pro
MediaTek Wi-Fi 6E MT7922 160MHz Wireless LAN Card
979 (962min - 989max) MBit/s -22%
Asus ROG NUC 14-90AS0051
Killer Wi-Fi 6E AX1690i 160MHz
947 (855min - 967max) MBit/s -24%
Minisforum MS-A1
Intel Wi-Fi 6E AX210
941 (873min - 964max) MBit/s -25%
GMK NucBox K9
Intel Wi-Fi 6 AX201
764 (635min - 829max) MBit/s -39%
iperf3 transmit AXE11000 6GHz
Geekom AX8 Pro
MediaTek Wi-Fi 6E MT7922 160MHz Wireless LAN Card
1800 (1737min - 1904max) MBit/s
Asus ROG NUC 14-90AS0051
Killer Wi-Fi 6E AX1690i 160MHz
1729 (1634min - 1767max) MBit/s
Minisforum MS-A1
Intel Wi-Fi 6E AX210
1597 (1554min - 1657max) MBit/s
Asus NUC 14 Pro
Intel Wi-Fi 6E AX211
1379 (1299min - 1425max) MBit/s
iperf3 receive AXE11000 6GHz
Minisforum MS-A1
Intel Wi-Fi 6E AX210
1749 (1702min - 1767max) MBit/s
Asus ROG NUC 14-90AS0051
Killer Wi-Fi 6E AX1690i 160MHz
1736 (1706min - 1748max) MBit/s
Asus NUC 14 Pro
Intel Wi-Fi 6E AX211
1729 (1594min - 1755max) MBit/s
Geekom AX8 Pro
MediaTek Wi-Fi 6E MT7922 160MHz Wireless LAN Card
1657 (1619min - 1670max) MBit/s
05010015020025030035040045050055060065070075080085090095010001050110011501200125013001350Tooltip
Beelink GTI12 Ultra EX Docking Station; iperf3 receive AXE11000; iperf 3.1.3: Ø1230 (617-1359)
Beelink GTI12 Ultra EX Docking Station; iperf3 transmit AXE11000; iperf 3.1.3: Ø1056 (555-1239)

Konserwacja

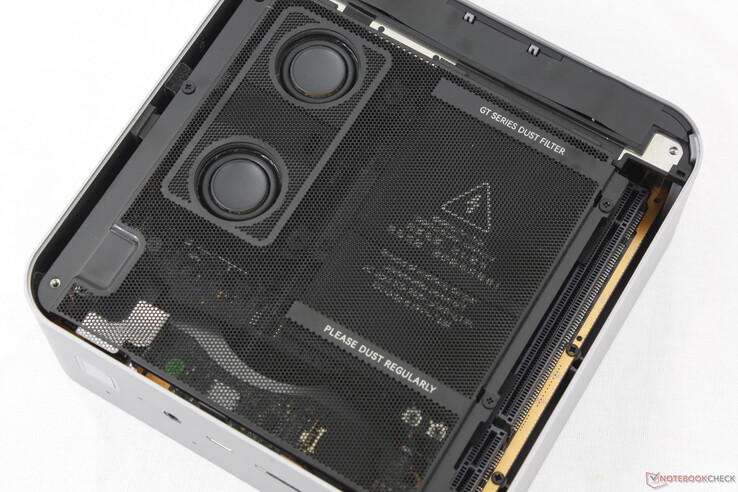
GTI12 Ultra jest znacznie trudniejszy w serwisowaniu w porównaniu do swojego mniejszego rodzeństwa, ponieważ posiada więcej zintegrowanych części, których nie ma w innych modelach. Głośniki, filtr przeciwkurzowy i zintegrowany zasilacz znajdują się na płycie głównej, a każdy z nich ma śruby o różnych rozmiarach, co jeszcze bardziej utrudnia serwisowanie.

Otwarcie dolnego panelu ujawnia głośniki, filtr przeciwkurzowy i zintegrowany zasilacz, które należy wyjąć osobno, aby uzyskać dostęp do 2x SODIMM i 2x M.2 PCIe4 2280 SSD slotów

Zrównoważony rozwój

Beelink nie reklamuje żadnych środków zrównoważonego rozwoju podjętych w celu wyprodukowania GTI12. Opakowanie składa się głównie z papieru z dodatkiem folii LDPE i plastiku.

Akcesoria i gwarancja

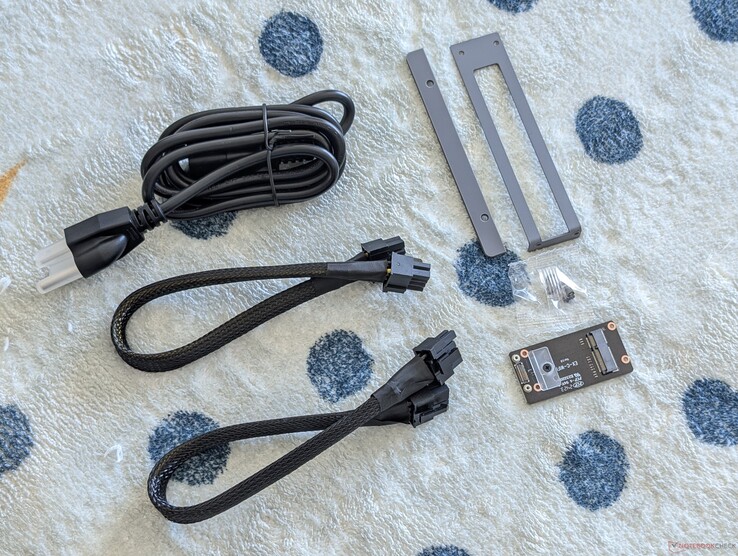
Stacja dokująca EX zawiera dwa 6+2-pinowe kable zasilające i dwie małe płytki do mocowania GPU i mini PC na stacji dokującej. Gniazdo Wi-Fi M.2 i antena są opcjonalne dla tych, którzy chcą zainstalować moduł WLAN w stacji dokującej zamiast wewnątrz mini PC. Praktycznie wszystkie mini PC są wyposażone w zintegrowany WLAN, więc ta konkretna funkcja stacji dokującej może zostać zignorowana przez większość użytkowników.

Akcesoria do stacji dokującej EX

Wydajność


Warunki testowania

Przed uruchomieniem poniższych testów porównawczych ustawiliśmy system Windows w tryb wydajności.

Procesor

Procesor Core i9-12900H jest dwie do trzech generacji za obecną serią Raptor Lake-R i wyniki testów porównawczych to odzwierciedlają. Nowszy Core i9-14900HXzapewnia na przykład niemal dwukrotnie wyższą wydajność wielowątkową niż nasza jednostka Beelink. Nawet tańsze mini PC, takie jak Beelink SER7 mogą zaoferować niemal identyczną wydajność procesora.

Nowsze opcje procesorów Meteor Lake Core Ultra są dostępne dla tego modelu o nazwie GTI14.

Cinebench R15 Multi Loop

02605207801040130015601820208023402600286031203380364039004160442046804940Tooltip
Beelink GTI12 Ultra EX Docking Station Intel Core i9-12900H: Ø2400 (2262.06-2414.15)
Asus ROG NUC 14-90AS0051 Intel Core Ultra 9 185H: Ø2897 (2858.16-2939.02)
Minisforum G7 PT AMD Ryzen 9 7945HX: Ø4926 (4863.22-5192.11)
Acemagic M2A Intel Core i9-12900H: Ø1833 (1798.4-2157.61)
Acemagic Tank03 Intel Core i9-12900H: Ø1779 (1736.94-2045.09)
Asus TUF Gaming A14 FA401WV-WB94 AMD Ryzen AI 9 HX 370: Ø3426 (3408.61-3447.98)
Lenovo IdeaPad Pro 5 16IMH G9 RTX 4050 Intel Core Ultra 9 185H: Ø2769 (2700.88-2896.24)
Lenovo Legion 9 16IRX9, RTX 4090 Intel Core i9-14900HX: Ø4648 (4505.52-4878.64)
CPU Performance Rating: Percent
Cinebench R23: Multi Core | Single Core
Cinebench R20: CPU (Multi Core) | CPU (Single Core)
Cinebench R15: CPU Multi 64Bit | CPU Single 64Bit
Blender: v2.79 BMW27 CPU
7-Zip 18.03: 7z b 4 | 7z b 4 -mmt1
Geekbench 6.3: Multi-Core | Single-Core
Geekbench 5.5: Multi-Core | Single-Core
HWBOT x265 Benchmark v2.2: 4k Preset
LibreOffice : 20 Documents To PDF
R Benchmark 2.5: Overall mean
CPU Performance Rating
Minisforum G7 PT
AMD Ryzen 9 7945HX
85.9 pt
Lenovo Legion 9 16IRX9, RTX 4090
Intel Core i9-14900HX
77.3 pt
Asus TUF Gaming A14 FA401WV-WB94
AMD Ryzen AI 9 HX 370
71.3 pt
Lenovo IdeaPad Pro 5 16IMH G9 RTX 4050
Intel Core Ultra 9 185H
65.7 pt
Beelink SER8
AMD Ryzen 7 8845HS
63.3 pt
Beelink SER7
AMD Ryzen 7 7840HS
62.7 pt
Asus ROG NUC 14-90AS0051
Intel Core Ultra 9 185H
62.3 pt
Beelink GTI12 Ultra EX Docking Station
Intel Core i9-12900H
61.3 pt
Lenovo IdeaCentre Mini 01IRH8
Intel Core i7-13700H
58 pt
Acemagic M2A
Intel Core i9-12900H
57.3 pt
Average Intel Core i9-12900H
 
57.1 pt
Maingear ML-16 MK2
Intel Core Ultra 7 155H
55.7 pt
Acemagic Tank03
Intel Core i9-12900H
53.7 pt
Geekom XT13 Pro
Intel Core i9-13900H
53 pt
MSI GeForce RTX 3070 Ventus 3X -8!
AMD Ryzen 9 5900X
46.1 pt
Beelink SER6 Pro -2!
AMD Ryzen 7 6800H
45.1 pt
Cinebench R23 / Multi Core
Lenovo Legion 9 16IRX9, RTX 4090
Intel Core i9-14900HX
31889 Points +96%
Minisforum G7 PT
AMD Ryzen 9 7945HX
30799 Points +89%
Asus TUF Gaming A14 FA401WV-WB94
AMD Ryzen AI 9 HX 370
23456 (23201.9min - 23456.3max) Points +44%
Lenovo IdeaPad Pro 5 16IMH G9 RTX 4050
Intel Core Ultra 9 185H
19496 (18014.8min - 19496.3max) Points +20%
Asus ROG NUC 14-90AS0051
Intel Core Ultra 9 185H
19249 Points +18%
Maingear ML-16 MK2
Intel Core Ultra 7 155H
17231 (12872.9min - 17231.1max) Points +6%
Beelink SER8
AMD Ryzen 7 8845HS
16661 (16363.9min - 16661max) Points +2%
Beelink GTI12 Ultra EX Docking Station
Intel Core i9-12900H
16270 (15738.9min - 16269.6max) Points
Beelink SER7
AMD Ryzen 7 7840HS
16105 (15785.6min - 16105.2max) Points -1%
Average Intel Core i9-12900H
  (7359 - 19648, n=28)
15133 Points -7%
Lenovo IdeaCentre Mini 01IRH8
Intel Core i7-13700H
14465 (9293.64min - 14465.4max) Points -11%
Acemagic M2A
Intel Core i9-12900H
13899 Points -15%
Acemagic Tank03
Intel Core i9-12900H
13561 Points -17%
Geekom XT13 Pro
Intel Core i9-13900H
11997 Points -26%
Beelink SER6 Pro
AMD Ryzen 7 6800H
11481 (10813.7min - 11481.3max) Points -29%
Cinebench R23 / Single Core
Asus TUF Gaming A14 FA401WV-WB94
AMD Ryzen AI 9 HX 370
1979 Points +3%
Minisforum G7 PT
AMD Ryzen 9 7945HX
1957 Points +1%
Beelink GTI12 Ultra EX Docking Station
Intel Core i9-12900H
1930 Points
Acemagic M2A
Intel Core i9-12900H
1907 Points -1%
Lenovo IdeaCentre Mini 01IRH8
Intel Core i7-13700H
1898 Points -2%
Lenovo IdeaPad Pro 5 16IMH G9 RTX 4050
Intel Core Ultra 9 185H
1887 Points -2%
Average Intel Core i9-12900H
  (1634 - 1930, n=28)
1829 Points -5%
Asus ROG NUC 14-90AS0051
Intel Core Ultra 9 185H
1825 Points -5%
Beelink SER8
AMD Ryzen 7 8845HS
1783 Points -8%
Acemagic Tank03
Intel Core i9-12900H
1781 Points -8%
Beelink SER7
AMD Ryzen 7 7840HS
1774 Points -8%
Lenovo Legion 9 16IRX9, RTX 4090
Intel Core i9-14900HX
1720 Points -11%
Geekom XT13 Pro
Intel Core i9-13900H
1719 Points -11%
Maingear ML-16 MK2
Intel Core Ultra 7 155H
1650 Points -15%
Beelink SER6 Pro
AMD Ryzen 7 6800H
1506 Points -22%
Cinebench R20 / CPU (Multi Core)
Minisforum G7 PT
AMD Ryzen 9 7945HX
12210 Points +95%
Lenovo Legion 9 16IRX9, RTX 4090
Intel Core i9-14900HX
11960 Points +91%
Asus TUF Gaming A14 FA401WV-WB94
AMD Ryzen AI 9 HX 370
9151 Points +46%
Asus ROG NUC 14-90AS0051
Intel Core Ultra 9 185H
7513 Points +20%
Lenovo IdeaPad Pro 5 16IMH G9 RTX 4050
Intel Core Ultra 9 185H
7431 Points +19%
Maingear ML-16 MK2
Intel Core Ultra 7 155H
6789 Points +8%
Beelink SER8
AMD Ryzen 7 8845HS
6431 Points +3%
Beelink SER7
AMD Ryzen 7 7840HS
6344 Points +1%
Beelink GTI12 Ultra EX Docking Station
Intel Core i9-12900H
6267 Points
Lenovo IdeaCentre Mini 01IRH8
Intel Core i7-13700H
5800 Points -7%
Average Intel Core i9-12900H
  (2681 - 7471, n=28)
5717 Points -9%
Acemagic M2A
Intel Core i9-12900H
5472 Points -13%
Acemagic Tank03
Intel Core i9-12900H
5154 Points -18%
Geekom XT13 Pro
Intel Core i9-13900H
4935 Points -21%
Beelink SER6 Pro
AMD Ryzen 7 6800H
4460 Points -29%
Cinebench R20 / CPU (Single Core)
Asus TUF Gaming A14 FA401WV-WB94
AMD Ryzen AI 9 HX 370
782 Points +11%
Minisforum G7 PT
AMD Ryzen 9 7945HX
754 Points +7%
Acemagic M2A
Intel Core i9-12900H
735 Points +4%
Lenovo IdeaPad Pro 5 16IMH G9 RTX 4050
Intel Core Ultra 9 185H
729 Points +3%
Lenovo IdeaCentre Mini 01IRH8
Intel Core i7-13700H
721 Points +2%
Beelink GTI12 Ultra EX Docking Station
Intel Core i9-12900H
707 Points
Average Intel Core i9-12900H
  (624 - 738, n=28)
706 Points 0%
Asus ROG NUC 14-90AS0051
Intel Core Ultra 9 185H
699 Points -1%
Beelink SER7
AMD Ryzen 7 7840HS
698 Points -1%
Beelink SER8
AMD Ryzen 7 8845HS
698 Points -1%
Acemagic Tank03
Intel Core i9-12900H
686 Points -3%
Lenovo Legion 9 16IRX9, RTX 4090
Intel Core i9-14900HX
657 Points -7%
Geekom XT13 Pro
Intel Core i9-13900H
649 Points -8%
Maingear ML-16 MK2
Intel Core Ultra 7 155H
634 Points -10%
Beelink SER6 Pro
AMD Ryzen 7 6800H
584 Points -17%
Cinebench R15 / CPU Multi 64Bit
Minisforum G7 PT
AMD Ryzen 9 7945HX
4998 Points +107%
Lenovo Legion 9 16IRX9, RTX 4090
Intel Core i9-14900HX
4879 (4505.52min - 4878.64max) Points +102%
Asus TUF Gaming A14 FA401WV-WB94
AMD Ryzen AI 9 HX 370
3448 (3408.61min - 3447.98max) Points +43%
Asus ROG NUC 14-90AS0051
Intel Core Ultra 9 185H
2948 Points +22%
Lenovo IdeaPad Pro 5 16IMH G9 RTX 4050
Intel Core Ultra 9 185H
2896 (2700.88min - 2896.24max) Points +20%
Maingear ML-16 MK2
Intel Core Ultra 7 155H
2705 (1976.58min - 2705.26max) Points +12%
Beelink SER8
AMD Ryzen 7 8845HS
2627 (2586.82min - 2626.57max) Points +9%
Beelink SER7
AMD Ryzen 7 7840HS
2565 (2511.62min - 2564.76max) Points +6%
Average Intel Core i9-12900H
  (1395 - 3077, n=28)
2454 Points +2%
Geekom XT13 Pro
Intel Core i9-13900H
2448 Points +1%
Beelink GTI12 Ultra EX Docking Station
Intel Core i9-12900H
2414 (2262.06min - 2414.15max) Points
Lenovo IdeaCentre Mini 01IRH8
Intel Core i7-13700H
2240 (1862.02min - 2240.14max) Points -7%
Acemagic Tank03
Intel Core i9-12900H
2154 Points -11%
Acemagic M2A
Intel Core i9-12900H
2136 Points -12%
Beelink SER6 Pro
AMD Ryzen 7 6800H
1931 (1821.83min - 1930.5max) Points -20%
Cinebench R15 / CPU Single 64Bit
Minisforum G7 PT
AMD Ryzen 9 7945HX
309 Points +13%
Asus TUF Gaming A14 FA401WV-WB94
AMD Ryzen AI 9 HX 370
301 Points +10%
Beelink SER7
AMD Ryzen 7 7840HS
283 Points +4%
Beelink SER8
AMD Ryzen 7 8845HS
283 Points +4%
Lenovo IdeaPad Pro 5 16IMH G9 RTX 4050
Intel Core Ultra 9 185H
276 Points +1%
Beelink GTI12 Ultra EX Docking Station
Intel Core i9-12900H
273 Points
Acemagic M2A
Intel Core i9-12900H
266 Points -3%
Asus ROG NUC 14-90AS0051
Intel Core Ultra 9 185H
263 Points -4%
Average Intel Core i9-12900H
  (235 - 277, n=29)
262 Points -4%
Lenovo IdeaCentre Mini 01IRH8
Intel Core i7-13700H
260 Points -5%
Acemagic Tank03
Intel Core i9-12900H
251 Points -8%
Lenovo Legion 9 16IRX9, RTX 4090
Intel Core i9-14900HX
247 Points -10%
Geekom XT13 Pro
Intel Core i9-13900H
245 Points -10%
Beelink SER6 Pro
AMD Ryzen 7 6800H
242 Points -11%
Maingear ML-16 MK2
Intel Core Ultra 7 155H
242 Points -11%
Blender / v2.79 BMW27 CPU
Beelink SER6 Pro
AMD Ryzen 7 6800H
268 Seconds * -37%
Geekom XT13 Pro
Intel Core i9-13900H
261 Seconds * -34%
Acemagic M2A
Intel Core i9-12900H
254 Seconds * -30%
Acemagic Tank03
Intel Core i9-12900H
253 Seconds * -30%
Average Intel Core i9-12900H
  (160 - 451, n=28)
231 Seconds * -18%
Maingear ML-16 MK2
Intel Core Ultra 7 155H
226 Seconds * -16%
Lenovo IdeaCentre Mini 01IRH8
Intel Core i7-13700H
216 Seconds * -11%
Beelink SER7
AMD Ryzen 7 7840HS
196 Seconds * -1%
Beelink GTI12 Ultra EX Docking Station
Intel Core i9-12900H
195 Seconds *
Beelink SER8
AMD Ryzen 7 8845HS
191 Seconds * +2%
Lenovo IdeaPad Pro 5 16IMH G9 RTX 4050
Intel Core Ultra 9 185H
170 Seconds * +13%
Asus ROG NUC 14-90AS0051
Intel Core Ultra 9 185H
165 Seconds * +15%
MSI GeForce RTX 3070 Ventus 3X
AMD Ryzen 9 5900X
155.9 Seconds * +20%
Asus TUF Gaming A14 FA401WV-WB94
AMD Ryzen AI 9 HX 370
143 Seconds * +27%
Lenovo Legion 9 16IRX9, RTX 4090
Intel Core i9-14900HX
106 Seconds * +46%
Minisforum G7 PT
AMD Ryzen 9 7945HX
99 Seconds * +49%
7-Zip 18.03 / 7z b 4
Minisforum G7 PT
AMD Ryzen 9 7945HX
131378 MIPS +100%
Lenovo Legion 9 16IRX9, RTX 4090
Intel Core i9-14900HX
125676 MIPS +92%
MSI GeForce RTX 3070 Ventus 3X
AMD Ryzen 9 5900X
83552 MIPS +27%
Asus TUF Gaming A14 FA401WV-WB94
AMD Ryzen AI 9 HX 370
80277 MIPS +22%
Lenovo IdeaPad Pro 5 16IMH G9 RTX 4050
Intel Core Ultra 9 185H
74343 MIPS +13%
Asus ROG NUC 14-90AS0051
Intel Core Ultra 9 185H
72894 MIPS +11%
Beelink SER8
AMD Ryzen 7 8845HS
70937 MIPS +8%
Beelink SER7
AMD Ryzen 7 7840HS
69882 MIPS +7%
Beelink GTI12 Ultra EX Docking Station
Intel Core i9-12900H
65594 MIPS
Maingear ML-16 MK2
Intel Core Ultra 7 155H
64182 MIPS -2%
Average Intel Core i9-12900H
  (34684 - 76677, n=28)
60849 MIPS -7%
Geekom XT13 Pro
Intel Core i9-13900H
56068 MIPS -15%
Beelink SER6 Pro
AMD Ryzen 7 6800H
55963 MIPS -15%
Acemagic Tank03
Intel Core i9-12900H
55613 MIPS -15%
Lenovo IdeaCentre Mini 01IRH8
Intel Core i7-13700H
54733 MIPS -17%
Acemagic M2A
Intel Core i9-12900H
52663 MIPS -20%
7-Zip 18.03 / 7z b 4 -mmt1
Minisforum G7 PT
AMD Ryzen 9 7945HX
7609 MIPS +32%
Beelink SER7
AMD Ryzen 7 7840HS
6734 MIPS +17%
Beelink SER8
AMD Ryzen 7 8845HS
6714 MIPS +16%
MSI GeForce RTX 3070 Ventus 3X
AMD Ryzen 9 5900X
6349 MIPS +10%
Asus TUF Gaming A14 FA401WV-WB94
AMD Ryzen AI 9 HX 370
6106 MIPS +6%
Acemagic M2A
Intel Core i9-12900H
6076 MIPS +5%
Lenovo IdeaCentre Mini 01IRH8
Intel Core i7-13700H
6014 MIPS +4%
Average Intel Core i9-12900H
  (5302 - 6289, n=28)
5843 MIPS +1%
Geekom XT13 Pro
Intel Core i9-13900H
5828 MIPS +1%
Beelink GTI12 Ultra EX Docking Station
Intel Core i9-12900H
5774 MIPS
Beelink SER6 Pro
AMD Ryzen 7 6800H
5768 MIPS 0%
Lenovo IdeaPad Pro 5 16IMH G9 RTX 4050
Intel Core Ultra 9 185H
5724 MIPS -1%
Acemagic Tank03
Intel Core i9-12900H
5582 MIPS -3%
Lenovo Legion 9 16IRX9, RTX 4090
Intel Core i9-14900HX
5452 MIPS -6%
Asus ROG NUC 14-90AS0051
Intel Core Ultra 9 185H
5333 MIPS -8%
Maingear ML-16 MK2
Intel Core Ultra 7 155H
5047 MIPS -13%
Geekbench 6.3 / Multi-Core
Lenovo Legion 9 16IRX9, RTX 4090
Intel Core i9-14900HX
17499 Points +38%
Minisforum G7 PT
AMD Ryzen 9 7945HX
16765 Points +33%
Asus TUF Gaming A14 FA401WV-WB94
AMD Ryzen AI 9 HX 370
13799 Points +9%
Lenovo IdeaPad Pro 5 16IMH G9 RTX 4050
Intel Core Ultra 9 185H
13613 Points +8%
Beelink SER8
AMD Ryzen 7 8845HS
13362 Points +6%
Asus ROG NUC 14-90AS0051
Intel Core Ultra 9 185H
13232 Points +5%
Beelink SER7
AMD Ryzen 7 7840HS
12694 Points 0%
Beelink GTI12 Ultra EX Docking Station
Intel Core i9-12900H
12649 Points
Acemagic M2A
Intel Core i9-12900H
12044 Points -5%
Maingear ML-16 MK2
Intel Core Ultra 7 155H
11941 Points -6%
Geekom XT13 Pro
Intel Core i9-13900H
11541 Points -9%
Acemagic Tank03
Intel Core i9-12900H
11247 Points -11%
Average Intel Core i9-12900H
  (9258 - 12649, n=9)
10604 Points -16%
Lenovo IdeaCentre Mini 01IRH8
Intel Core i7-13700H
10362 Points -18%
Geekbench 6.3 / Single-Core
Minisforum G7 PT
AMD Ryzen 9 7945HX
2880 Points +9%
Asus TUF Gaming A14 FA401WV-WB94
AMD Ryzen AI 9 HX 370
2846 Points +7%
Beelink SER8
AMD Ryzen 7 8845HS
2694 Points +2%
Beelink SER7
AMD Ryzen 7 7840HS
2657 Points 0%
Beelink GTI12 Ultra EX Docking Station
Intel Core i9-12900H
2652 Points
Lenovo IdeaCentre Mini 01IRH8
Intel Core i7-13700H
2600 Points -2%
Acemagic M2A
Intel Core i9-12900H
2582 Points -3%
Lenovo IdeaPad Pro 5 16IMH G9 RTX 4050
Intel Core Ultra 9 185H
2568 Points -3%
Asus ROG NUC 14-90AS0051
Intel Core Ultra 9 185H
2485 Points -6%
Lenovo Legion 9 16IRX9, RTX 4090
Intel Core i9-14900HX
2419 Points -9%
Geekom XT13 Pro
Intel Core i9-13900H
2415 Points -9%
Average Intel Core i9-12900H
  (1893 - 2652, n=9)
2375 Points -10%
Acemagic Tank03
Intel Core i9-12900H
2273 Points -14%
Maingear ML-16 MK2
Intel Core Ultra 7 155H
2238 Points -16%
Geekbench 5.5 / Multi-Core
Lenovo Legion 9 16IRX9, RTX 4090
Intel Core i9-14900HX
21642 Points +77%
Minisforum G7 PT
AMD Ryzen 9 7945HX
19836 Points +62%
Asus TUF Gaming A14 FA401WV-WB94
AMD Ryzen AI 9 HX 370
14068 Points +15%
Lenovo IdeaPad Pro 5 16IMH G9 RTX 4050
Intel Core Ultra 9 185H
13496 Points +10%
Asus ROG NUC 14-90AS0051
Intel Core Ultra 9 185H
13339 Points +9%
Beelink GTI12 Ultra EX Docking Station
Intel Core i9-12900H
12237 Points
Maingear ML-16 MK2
Intel Core Ultra 7 155H
12228 Points 0%
Beelink SER8
AMD Ryzen 7 8845HS
12196 Points 0%
Average Intel Core i9-12900H
  (8519 - 14376, n=31)
11913 Points -3%
Geekom XT13 Pro
Intel Core i9-13900H
11536 Points -6%
Beelink SER7
AMD Ryzen 7 7840HS
11423 Points -7%
Acemagic M2A
Intel Core i9-12900H
11406 Points -7%
Acemagic Tank03
Intel Core i9-12900H
11155 Points -9%
Lenovo IdeaCentre Mini 01IRH8
Intel Core i7-13700H
10361 Points -15%
MSI GeForce RTX 3070 Ventus 3X
AMD Ryzen 9 5900X
9960 Points -19%
Beelink SER6 Pro
AMD Ryzen 7 6800H
9218 Points -25%
Geekbench 5.5 / Single-Core
Minisforum G7 PT
AMD Ryzen 9 7945HX
2147 Points +13%
Asus TUF Gaming A14 FA401WV-WB94
AMD Ryzen AI 9 HX 370
2030 Points +7%
Beelink SER8
AMD Ryzen 7 8845HS
2004 Points +6%
Beelink SER7
AMD Ryzen 7 7840HS
1983 Points +5%
Beelink GTI12 Ultra EX Docking Station
Intel Core i9-12900H
1897 Points
Lenovo IdeaPad Pro 5 16IMH G9 RTX 4050
Intel Core Ultra 9 185H
1881 Points -1%
Asus ROG NUC 14-90AS0051
Intel Core Ultra 9 185H
1858 Points -2%
Lenovo IdeaCentre Mini 01IRH8
Intel Core i7-13700H
1842 Points -3%
Acemagic M2A
Intel Core i9-12900H
1842 Points -3%
Average Intel Core i9-12900H
  (1631 - 1897, n=31)
1800 Points -5%
Lenovo Legion 9 16IRX9, RTX 4090
Intel Core i9-14900HX
1729 Points -9%
Geekom XT13 Pro
Intel Core i9-13900H
1708 Points -10%
Acemagic Tank03
Intel Core i9-12900H
1692 Points -11%
Maingear ML-16 MK2
Intel Core Ultra 7 155H
1637 Points -14%
Beelink SER6 Pro
AMD Ryzen 7 6800H
1554 Points -18%
MSI GeForce RTX 3070 Ventus 3X
AMD Ryzen 9 5900X
1485 Points -22%
HWBOT x265 Benchmark v2.2 / 4k Preset
Minisforum G7 PT
AMD Ryzen 9 7945HX
34.6 fps +94%
Lenovo Legion 9 16IRX9, RTX 4090
Intel Core i9-14900HX
30.7 fps +72%
Asus TUF Gaming A14 FA401WV-WB94
AMD Ryzen AI 9 HX 370
26 fps +46%
Lenovo IdeaPad Pro 5 16IMH G9 RTX 4050
Intel Core Ultra 9 185H
22.2 fps +25%
Asus ROG NUC 14-90AS0051
Intel Core Ultra 9 185H
21.8 fps +22%
MSI GeForce RTX 3070 Ventus 3X
AMD Ryzen 9 5900X
21.4 fps +20%
Beelink SER8
AMD Ryzen 7 8845HS
21.1 fps +19%
Beelink SER7
AMD Ryzen 7 7840HS
20.4 fps +15%
Maingear ML-16 MK2
Intel Core Ultra 7 155H
17.9 fps +1%
Beelink GTI12 Ultra EX Docking Station
Intel Core i9-12900H
17.8 fps
Lenovo IdeaCentre Mini 01IRH8
Intel Core i7-13700H
17.6 fps -1%
Average Intel Core i9-12900H
  (8.05 - 22.5, n=28)
17.1 fps -4%
Beelink SER6 Pro
AMD Ryzen 7 6800H
15 fps -16%
Acemagic M2A
Intel Core i9-12900H
15 fps -16%
Acemagic Tank03
Intel Core i9-12900H
14.8 fps -17%
Geekom XT13 Pro
Intel Core i9-13900H
14.7 fps -17%
LibreOffice / 20 Documents To PDF
Asus ROG NUC 14-90AS0051
Intel Core Ultra 9 185H
56.2 s * -39%
MSI GeForce RTX 3070 Ventus 3X
AMD Ryzen 9 5900X
54.6 s * -35%
Lenovo Legion 9 16IRX9, RTX 4090
Intel Core i9-14900HX
53.6 s * -32%
Asus TUF Gaming A14 FA401WV-WB94
AMD Ryzen AI 9 HX 370
51.7 s * -28%
Minisforum G7 PT
AMD Ryzen 9 7945HX
49.7 s * -23%
Beelink SER6 Pro
AMD Ryzen 7 6800H
48.8 s * -20%
Geekom XT13 Pro
Intel Core i9-13900H
46.8 s * -16%
Beelink SER8
AMD Ryzen 7 8845HS
46.1 s * -14%
Maingear ML-16 MK2
Intel Core Ultra 7 155H
43.1 s * -6%
Average Intel Core i9-12900H
  (36.8 - 59.8, n=28)
42.4 s * -5%
Beelink GTI12 Ultra EX Docking Station
Intel Core i9-12900H
40.5 s *
Acemagic M2A
Intel Core i9-12900H
40 s * +1%
Beelink SER7
AMD Ryzen 7 7840HS
39.7 s * +2%
Lenovo IdeaPad Pro 5 16IMH G9 RTX 4050
Intel Core Ultra 9 185H
39 s * +4%
Lenovo IdeaCentre Mini 01IRH8
Intel Core i7-13700H
37.6 s * +7%
Acemagic Tank03
Intel Core i9-12900H
36.8 s * +9%
R Benchmark 2.5 / Overall mean
MSI GeForce RTX 3070 Ventus 3X
AMD Ryzen 9 5900X
0.507 sec * -14%
Acemagic Tank03
Intel Core i9-12900H
0.506 sec * -14%
Maingear ML-16 MK2
Intel Core Ultra 7 155H
0.505 sec * -14%
Beelink SER6 Pro
AMD Ryzen 7 6800H
0.4989 sec * -12%
Lenovo Legion 9 16IRX9, RTX 4090
Intel Core i9-14900HX
0.4859 sec * -9%
Geekom XT13 Pro
Intel Core i9-13900H
0.4693 sec * -6%
Average Intel Core i9-12900H
  (0.4218 - 0.506, n=28)
0.454 sec * -2%
Lenovo IdeaCentre Mini 01IRH8
Intel Core i7-13700H
0.4512 sec * -1%
Asus ROG NUC 14-90AS0051
Intel Core Ultra 9 185H
0.4489 sec * -1%
Beelink GTI12 Ultra EX Docking Station
Intel Core i9-12900H
0.4447 sec *
Beelink SER7
AMD Ryzen 7 7840HS
0.4446 sec * -0%
Lenovo IdeaPad Pro 5 16IMH G9 RTX 4050
Intel Core Ultra 9 185H
0.4411 sec * +1%
Acemagic M2A
Intel Core i9-12900H
0.4347 sec * +2%
Beelink SER8
AMD Ryzen 7 8845HS
0.4336 sec * +2%
Asus TUF Gaming A14 FA401WV-WB94
AMD Ryzen AI 9 HX 370
0.419 sec * +6%
Minisforum G7 PT
AMD Ryzen 9 7945HX
0.406 sec * +9%
CPU Performance Rating: Percent
Cinebench R23: Multi Core | Single Core
Cinebench R20: CPU (Multi Core) | CPU (Single Core)
Cinebench R15: CPU Multi 64Bit | CPU Single 64Bit
Blender: v2.79 BMW27 CPU
7-Zip 18.03: 7z b 4 | 7z b 4 -mmt1
Geekbench 6.3: Multi-Core | Single-Core
Geekbench 5.5: Multi-Core | Single-Core
HWBOT x265 Benchmark v2.2: 4k Preset
LibreOffice : 20 Documents To PDF
R Benchmark 2.5: Overall mean

* ... im mniej tym lepiej

Cinebench R15 CPU Multi 64Bit
2414 Points
Cinebench R15 OpenGL 64Bit
258 fps
Cinebench R15 Ref. Match 64Bit
99.6 %
Cinebench R15 CPU Single 64Bit
273 Points
Cinebench R20 CPU (Multi Core)
6267 Points
Cinebench R20 CPU (Single Core)
707 Points
Cinebench R23 Multi Core
16270 Points
Cinebench R23 Single Core
1930 Points
Cinebench 2024 CPU Multi Core
920 Points
Cinebench 2024 CPU Single Core
112 Points
Pomoc
Performance Rating
Minisforum MS-A1
AMD Ryzen 7 8700G, Radeon 780M
97.2 pt
Geekom AX8 Pro
AMD Ryzen 9 8945H, Radeon 780M
90.1 pt
Asus ROG NUC 14-90AS0051
Intel Core Ultra 9 185H, NVIDIA GeForce RTX 4070 Laptop GPU
76.6 pt
Beelink GTI12 Ultra EX Docking Station
Intel Core i9-12900H, NVIDIA GeForce RTX 3070
66.8 pt
Asus NUC 14 Pro
Intel Core Ultra 5 125H, Arc 7-Core
60.4 pt
Average Intel Core i9-12900H
 
57.8 pt
GMK NucBox K9
Intel Core Ultra 5 125H, Arc 7-Core
57.2 pt
AIDA64 / FP32 Ray-Trace
Minisforum MS-A1
AMD Ryzen 7 8700G, Radeon 780M
27384 KRay/s +76%
Geekom AX8 Pro
AMD Ryzen 9 8945H, Radeon 780M
24531 KRay/s +58%
Asus ROG NUC 14-90AS0051
Intel Core Ultra 9 185H, NVIDIA GeForce RTX 4070 Laptop GPU
17631 KRay/s +13%
Beelink GTI12 Ultra EX Docking Station
Intel Core i9-12900H, NVIDIA GeForce RTX 3070
15555 KRay/s
Asus NUC 14 Pro
Intel Core Ultra 5 125H, Arc 7-Core
13347 KRay/s -14%
Average Intel Core i9-12900H
  (4074 - 18289, n=28)
11191 KRay/s -28%
GMK NucBox K9
Intel Core Ultra 5 125H, Arc 7-Core
10755 KRay/s -31%
AIDA64 / FPU Julia
Minisforum MS-A1
AMD Ryzen 7 8700G, Radeon 780M
116071 Points +49%
Geekom AX8 Pro
AMD Ryzen 9 8945H, Radeon 780M
106518 Points +36%
Asus ROG NUC 14-90AS0051
Intel Core Ultra 9 185H, NVIDIA GeForce RTX 4070 Laptop GPU
93160 Points +19%
Beelink GTI12 Ultra EX Docking Station
Intel Core i9-12900H, NVIDIA GeForce RTX 3070
78136 Points
Asus NUC 14 Pro
Intel Core Ultra 5 125H, Arc 7-Core
68551 Points -12%
GMK NucBox K9
Intel Core Ultra 5 125H, Arc 7-Core
58422 Points -25%
Average Intel Core i9-12900H
  (22307 - 93236, n=28)
55458 Points -29%
AIDA64 / CPU SHA3
Minisforum MS-A1
AMD Ryzen 7 8700G, Radeon 780M
5092 MB/s +45%
Geekom AX8 Pro
AMD Ryzen 9 8945H, Radeon 780M
4684 MB/s +34%
Asus ROG NUC 14-90AS0051
Intel Core Ultra 9 185H, NVIDIA GeForce RTX 4070 Laptop GPU
4307 MB/s +23%
Beelink GTI12 Ultra EX Docking Station
Intel Core i9-12900H, NVIDIA GeForce RTX 3070
3507 MB/s
Asus NUC 14 Pro
Intel Core Ultra 5 125H, Arc 7-Core
3323 MB/s -5%
Average Intel Core i9-12900H
  (1378 - 4215, n=28)
3048 MB/s -13%
GMK NucBox K9
Intel Core Ultra 5 125H, Arc 7-Core
2922 MB/s -17%
AIDA64 / CPU Queen
Minisforum MS-A1
AMD Ryzen 7 8700G, Radeon 780M
120159 Points +21%
Geekom AX8 Pro
AMD Ryzen 9 8945H, Radeon 780M
114586 Points +15%
Average Intel Core i9-12900H
  (78172 - 111241, n=28)
100462 Points +1%
Beelink GTI12 Ultra EX Docking Station
Intel Core i9-12900H, NVIDIA GeForce RTX 3070
99243 Points
Asus ROG NUC 14-90AS0051
Intel Core Ultra 9 185H, NVIDIA GeForce RTX 4070 Laptop GPU
94584 Points -5%
Asus NUC 14 Pro
Intel Core Ultra 5 125H, Arc 7-Core
79866 Points -20%
GMK NucBox K9
Intel Core Ultra 5 125H, Arc 7-Core
78797 Points -21%
AIDA64 / FPU SinJulia
Minisforum MS-A1
AMD Ryzen 7 8700G, Radeon 780M
15698 Points +58%
Geekom AX8 Pro
AMD Ryzen 9 8945H, Radeon 780M
14631 Points +47%
Asus ROG NUC 14-90AS0051
Intel Core Ultra 9 185H, NVIDIA GeForce RTX 4070 Laptop GPU
11284 Points +14%
Beelink GTI12 Ultra EX Docking Station
Intel Core i9-12900H, NVIDIA GeForce RTX 3070
9934 Points
Average Intel Core i9-12900H
  (5709 - 10410, n=28)
9016 Points -9%
Asus NUC 14 Pro
Intel Core Ultra 5 125H, Arc 7-Core
7851 Points -21%
GMK NucBox K9
Intel Core Ultra 5 125H, Arc 7-Core
7780 Points -22%
AIDA64 / FPU Mandel
Minisforum MS-A1
AMD Ryzen 7 8700G, Radeon 780M
62263 Points +61%
Geekom AX8 Pro
AMD Ryzen 9 8945H, Radeon 780M
56505 Points +46%
Asus ROG NUC 14-90AS0051
Intel Core Ultra 9 185H, NVIDIA GeForce RTX 4070 Laptop GPU
46028 Points +19%
Beelink GTI12 Ultra EX Docking Station
Intel Core i9-12900H, NVIDIA GeForce RTX 3070
38712 Points
Asus NUC 14 Pro
Intel Core Ultra 5 125H, Arc 7-Core
34225 Points -12%
Average Intel Core i9-12900H
  (11257 - 45581, n=28)
28667 Points -26%
GMK NucBox K9
Intel Core Ultra 5 125H, Arc 7-Core
27972 Points -28%
AIDA64 / CPU AES
Minisforum MS-A1
AMD Ryzen 7 8700G, Radeon 780M
176002 MB/s +154%
Geekom AX8 Pro
AMD Ryzen 9 8945H, Radeon 780M
163032 MB/s +135%
GMK NucBox K9
Intel Core Ultra 5 125H, Arc 7-Core
108402 MB/s +56%
Asus ROG NUC 14-90AS0051
Intel Core Ultra 9 185H, NVIDIA GeForce RTX 4070 Laptop GPU
90629 MB/s +31%
Average Intel Core i9-12900H
  (31935 - 151546, n=28)
85711 MB/s +24%
Beelink GTI12 Ultra EX Docking Station
Intel Core i9-12900H, NVIDIA GeForce RTX 3070
69299 MB/s
Asus NUC 14 Pro
Intel Core Ultra 5 125H, Arc 7-Core
64107 MB/s -7%
AIDA64 / CPU ZLib
Asus ROG NUC 14-90AS0051
Intel Core Ultra 9 185H, NVIDIA GeForce RTX 4070 Laptop GPU
1266 MB/s +22%
Minisforum MS-A1
AMD Ryzen 7 8700G, Radeon 780M
1097 MB/s +6%
Beelink GTI12 Ultra EX Docking Station
Intel Core i9-12900H, NVIDIA GeForce RTX 3070
1039 MB/s
Geekom AX8 Pro
AMD Ryzen 9 8945H, Radeon 780M
976 MB/s -6%
Asus NUC 14 Pro
Intel Core Ultra 5 125H, Arc 7-Core
969 MB/s -7%
Average Intel Core i9-12900H
  (449 - 1193, n=28)
932 MB/s -10%
GMK NucBox K9
Intel Core Ultra 5 125H, Arc 7-Core
844 MB/s -19%
AIDA64 / FP64 Ray-Trace
Minisforum MS-A1
AMD Ryzen 7 8700G, Radeon 780M
14519 KRay/s +72%
Geekom AX8 Pro
AMD Ryzen 9 8945H, Radeon 780M
13609 KRay/s +61%
Asus ROG NUC 14-90AS0051
Intel Core Ultra 9 185H, NVIDIA GeForce RTX 4070 Laptop GPU
9591 KRay/s +14%
Beelink GTI12 Ultra EX Docking Station
Intel Core i9-12900H, NVIDIA GeForce RTX 3070
8449 KRay/s
Asus NUC 14 Pro
Intel Core Ultra 5 125H, Arc 7-Core
6786 KRay/s -20%
Average Intel Core i9-12900H
  (2235 - 10511, n=28)
6205 KRay/s -27%
GMK NucBox K9
Intel Core Ultra 5 125H, Arc 7-Core
5657 KRay/s -33%
AIDA64 / CPU PhotoWorxx
Asus NUC 14 Pro
Intel Core Ultra 5 125H, Arc 7-Core
47377 MPixel/s +15%
GMK NucBox K9
Intel Core Ultra 5 125H, Arc 7-Core
46296 MPixel/s +12%
Asus ROG NUC 14-90AS0051
Intel Core Ultra 9 185H, NVIDIA GeForce RTX 4070 Laptop GPU
44809 MPixel/s +9%
Beelink GTI12 Ultra EX Docking Station
Intel Core i9-12900H, NVIDIA GeForce RTX 3070
41182 MPixel/s
Minisforum MS-A1
AMD Ryzen 7 8700G, Radeon 780M
40404 MPixel/s -2%
Geekom AX8 Pro
AMD Ryzen 9 8945H, Radeon 780M
40114 MPixel/s -3%
Average Intel Core i9-12900H
  (20960 - 48269, n=29)
36660 MPixel/s -11%

Wydajność systemu

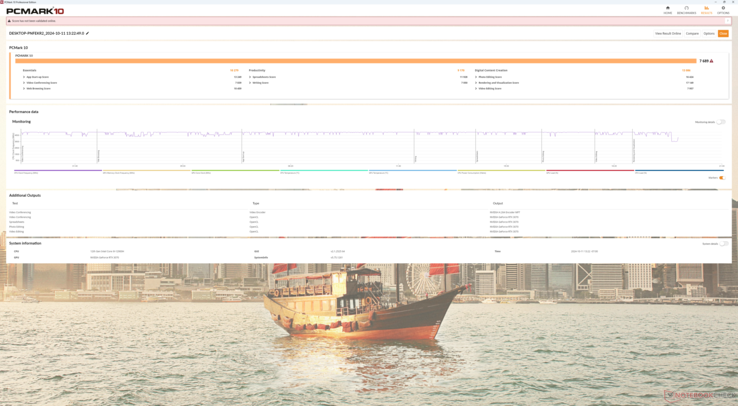
Wyniki PCMark są porównywalne do laptopów i innych mini PC z dyskretną grafiką, w tym Asus ROG NUC 14. Nasz wynik wydajności jest jednak stosunkowo niski, prawdopodobnie ze względu na starszy procesor Intel 12. generacji.

PCMark 10 Standard
PCMark 10 Standard
PCMark 10 / Score
Minisforum G7 PT
Radeon RX 7600M XT, R9 7945HX, Kingston OM8PGP41024Q-A0
8930 Points +16%
Lenovo Legion 9 16IRX9, RTX 4090
NVIDIA GeForce RTX 4090 Laptop GPU, i9-14900HX, Micron 3400 2TB MTFDKBA2T0TFH
8239 Points +7%
Asus ROG NUC 14-90AS0051
NVIDIA GeForce RTX 4070 Laptop GPU, Ultra 9 185H, Samsung PM9A1a MZVL21T0HDLU
7761 Points +1%
Acemagic M2A
GeForce RTX 3080 Laptop GPU, i9-12900H, Rayson RS1D0TSSD710 1024 GB PCIe 4.0 NVMe
7730 Points +1%
Maingear ML-16 MK2
NVIDIA GeForce RTX 4070 Laptop GPU, Ultra 7 155H
7704 Points 0%
Beelink GTI12 Ultra EX Docking Station
NVIDIA GeForce RTX 3070, i9-12900H, Crucial P3 Plus CT1000P3PSSD8
7689 Points
Asus TUF Gaming A14 FA401WV-WB94
NVIDIA GeForce RTX 4060 Laptop GPU, Ryzen AI 9 HX 370, WD PC SN560 SDDPNQE-1T00
7645 Points -1%
Lenovo IdeaPad Pro 5 16IMH G9 RTX 4050
NVIDIA GeForce RTX 4050 Laptop GPU, Ultra 9 185H, Samsung PM9C1a MZAL81T0HDLB
7431 Points -3%
Acemagic Tank03
GeForce RTX 3080 Laptop GPU, i9-12900H, BiWin CE480V6D10H-1TB
7326 Points -5%
MSI GeForce RTX 3070 Ventus 3X
NVIDIA GeForce RTX 3070, R9 5900X, Intel Optane 905P 480GB 2.5
7172 Points -7%
PCMark 10 / Essentials
Minisforum G7 PT
Radeon RX 7600M XT, R9 7945HX, Kingston OM8PGP41024Q-A0
11915 Points +16%
Lenovo Legion 9 16IRX9, RTX 4090
NVIDIA GeForce RTX 4090 Laptop GPU, i9-14900HX, Micron 3400 2TB MTFDKBA2T0TFH
11007 Points +7%
Lenovo IdeaPad Pro 5 16IMH G9 RTX 4050
NVIDIA GeForce RTX 4050 Laptop GPU, Ultra 9 185H, Samsung PM9C1a MZAL81T0HDLB
10807 Points +5%
Acemagic M2A
GeForce RTX 3080 Laptop GPU, i9-12900H, Rayson RS1D0TSSD710 1024 GB PCIe 4.0 NVMe
10344 Points +1%
Beelink GTI12 Ultra EX Docking Station
NVIDIA GeForce RTX 3070, i9-12900H, Crucial P3 Plus CT1000P3PSSD8
10279 Points
Maingear ML-16 MK2
NVIDIA GeForce RTX 4070 Laptop GPU, Ultra 7 155H
10274 Points 0%
Asus TUF Gaming A14 FA401WV-WB94
NVIDIA GeForce RTX 4060 Laptop GPU, Ryzen AI 9 HX 370, WD PC SN560 SDDPNQE-1T00
10236 Points 0%
Asus ROG NUC 14-90AS0051
NVIDIA GeForce RTX 4070 Laptop GPU, Ultra 9 185H, Samsung PM9A1a MZVL21T0HDLU
10192 Points -1%
Acemagic Tank03
GeForce RTX 3080 Laptop GPU, i9-12900H, BiWin CE480V6D10H-1TB
10130 Points -1%
MSI GeForce RTX 3070 Ventus 3X
NVIDIA GeForce RTX 3070, R9 5900X, Intel Optane 905P 480GB 2.5
9303 Points -9%
PCMark 10 / Productivity
Acemagic M2A
GeForce RTX 3080 Laptop GPU, i9-12900H, Rayson RS1D0TSSD710 1024 GB PCIe 4.0 NVMe
11014 Points +20%
Acemagic Tank03
GeForce RTX 3080 Laptop GPU, i9-12900H, BiWin CE480V6D10H-1TB
10430 Points +14%
Minisforum G7 PT
Radeon RX 7600M XT, R9 7945HX, Kingston OM8PGP41024Q-A0
10227 Points +12%
Lenovo Legion 9 16IRX9, RTX 4090
NVIDIA GeForce RTX 4090 Laptop GPU, i9-14900HX, Micron 3400 2TB MTFDKBA2T0TFH
10202 Points +11%
Asus TUF Gaming A14 FA401WV-WB94
NVIDIA GeForce RTX 4060 Laptop GPU, Ryzen AI 9 HX 370, WD PC SN560 SDDPNQE-1T00
9925 Points +8%
Lenovo IdeaPad Pro 5 16IMH G9 RTX 4050
NVIDIA GeForce RTX 4050 Laptop GPU, Ultra 9 185H, Samsung PM9C1a MZAL81T0HDLB
9717 Points +6%
Maingear ML-16 MK2
NVIDIA GeForce RTX 4070 Laptop GPU, Ultra 7 155H
9518 Points +4%
Asus ROG NUC 14-90AS0051
NVIDIA GeForce RTX 4070 Laptop GPU, Ultra 9 185H, Samsung PM9A1a MZVL21T0HDLU
9435 Points +3%
Beelink GTI12 Ultra EX Docking Station
NVIDIA GeForce RTX 3070, i9-12900H, Crucial P3 Plus CT1000P3PSSD8
9170 Points
MSI GeForce RTX 3070 Ventus 3X
NVIDIA GeForce RTX 3070, R9 5900X, Intel Optane 905P 480GB 2.5
8795 Points -4%
PCMark 10 / Digital Content Creation
Minisforum G7 PT
Radeon RX 7600M XT, R9 7945HX, Kingston OM8PGP41024Q-A0
15858 Points +21%
Lenovo Legion 9 16IRX9, RTX 4090
NVIDIA GeForce RTX 4090 Laptop GPU, i9-14900HX, Micron 3400 2TB MTFDKBA2T0TFH
13516 Points +3%
Asus TUF Gaming A14 FA401WV-WB94
NVIDIA GeForce RTX 4060 Laptop GPU, Ryzen AI 9 HX 370, WD PC SN560 SDDPNQE-1T00
13395 Points +2%
Asus ROG NUC 14-90AS0051
NVIDIA GeForce RTX 4070 Laptop GPU, Ultra 9 185H, Samsung PM9A1a MZVL21T0HDLU
13194 Points +1%
Beelink GTI12 Ultra EX Docking Station
NVIDIA GeForce RTX 3070, i9-12900H, Crucial P3 Plus CT1000P3PSSD8
13086 Points
Maingear ML-16 MK2
NVIDIA GeForce RTX 4070 Laptop GPU, Ultra 7 155H
12692 Points -3%
MSI GeForce RTX 3070 Ventus 3X
NVIDIA GeForce RTX 3070, R9 5900X, Intel Optane 905P 480GB 2.5
12239 Points -6%
Acemagic M2A
GeForce RTX 3080 Laptop GPU, i9-12900H, Rayson RS1D0TSSD710 1024 GB PCIe 4.0 NVMe
11004 Points -16%
Lenovo IdeaPad Pro 5 16IMH G9 RTX 4050
NVIDIA GeForce RTX 4050 Laptop GPU, Ultra 9 185H, Samsung PM9C1a MZAL81T0HDLB
10607 Points -19%
Acemagic Tank03
GeForce RTX 3080 Laptop GPU, i9-12900H, BiWin CE480V6D10H-1TB
10100 Points -23%
CrossMark / Overall
Minisforum G7 PT
Radeon RX 7600M XT, R9 7945HX, Kingston OM8PGP41024Q-A0
2102 Points +9%
Lenovo Legion 9 16IRX9, RTX 4090
NVIDIA GeForce RTX 4090 Laptop GPU, i9-14900HX, Micron 3400 2TB MTFDKBA2T0TFH
1939 Points +1%
Beelink GTI12 Ultra EX Docking Station
NVIDIA GeForce RTX 3070, i9-12900H, Crucial P3 Plus CT1000P3PSSD8
1922 Points
Lenovo IdeaPad Pro 5 16IMH G9 RTX 4050
NVIDIA GeForce RTX 4050 Laptop GPU, Ultra 9 185H, Samsung PM9C1a MZAL81T0HDLB
1790 Points -7%
Acemagic M2A
GeForce RTX 3080 Laptop GPU, i9-12900H, Rayson RS1D0TSSD710 1024 GB PCIe 4.0 NVMe
1785 Points -7%
Asus TUF Gaming A14 FA401WV-WB94
NVIDIA GeForce RTX 4060 Laptop GPU, Ryzen AI 9 HX 370, WD PC SN560 SDDPNQE-1T00
1710 Points -11%
Maingear ML-16 MK2
NVIDIA GeForce RTX 4070 Laptop GPU, Ultra 7 155H
1687 Points -12%
Asus ROG NUC 14-90AS0051
NVIDIA GeForce RTX 4070 Laptop GPU, Ultra 9 185H, Samsung PM9A1a MZVL21T0HDLU
1663 Points -13%
Acemagic Tank03
GeForce RTX 3080 Laptop GPU, i9-12900H, BiWin CE480V6D10H-1TB
1567 Points -18%
CrossMark / Productivity
Minisforum G7 PT
Radeon RX 7600M XT, R9 7945HX, Kingston OM8PGP41024Q-A0
1938 Points +5%
Beelink GTI12 Ultra EX Docking Station
NVIDIA GeForce RTX 3070, i9-12900H, Crucial P3 Plus CT1000P3PSSD8
1852 Points
Lenovo Legion 9 16IRX9, RTX 4090
NVIDIA GeForce RTX 4090 Laptop GPU, i9-14900HX, Micron 3400 2TB MTFDKBA2T0TFH
1755 Points -5%
Acemagic M2A
GeForce RTX 3080 Laptop GPU, i9-12900H, Rayson RS1D0TSSD710 1024 GB PCIe 4.0 NVMe
1728 Points -7%
Lenovo IdeaPad Pro 5 16IMH G9 RTX 4050
NVIDIA GeForce RTX 4050 Laptop GPU, Ultra 9 185H, Samsung PM9C1a MZAL81T0HDLB
1700 Points -8%
Maingear ML-16 MK2
NVIDIA GeForce RTX 4070 Laptop GPU, Ultra 7 155H
1589 Points -14%
Asus TUF Gaming A14 FA401WV-WB94
NVIDIA GeForce RTX 4060 Laptop GPU, Ryzen AI 9 HX 370, WD PC SN560 SDDPNQE-1T00
1574 Points -15%
Asus ROG NUC 14-90AS0051
NVIDIA GeForce RTX 4070 Laptop GPU, Ultra 9 185H, Samsung PM9A1a MZVL21T0HDLU
1573 Points -15%
Acemagic Tank03
GeForce RTX 3080 Laptop GPU, i9-12900H, BiWin CE480V6D10H-1TB
1483 Points -20%
CrossMark / Creativity
Minisforum G7 PT
Radeon RX 7600M XT, R9 7945HX, Kingston OM8PGP41024Q-A0
2428 Points +23%
Lenovo Legion 9 16IRX9, RTX 4090
NVIDIA GeForce RTX 4090 Laptop GPU, i9-14900HX, Micron 3400 2TB MTFDKBA2T0TFH
2207 Points +12%
Asus TUF Gaming A14 FA401WV-WB94
NVIDIA GeForce RTX 4060 Laptop GPU, Ryzen AI 9 HX 370, WD PC SN560 SDDPNQE-1T00
2077 Points +5%
Lenovo IdeaPad Pro 5 16IMH G9 RTX 4050
NVIDIA GeForce RTX 4050 Laptop GPU, Ultra 9 185H, Samsung PM9C1a MZAL81T0HDLB
2038 Points +3%
Beelink GTI12 Ultra EX Docking Station
NVIDIA GeForce RTX 3070, i9-12900H, Crucial P3 Plus CT1000P3PSSD8
1979 Points
Acemagic M2A
GeForce RTX 3080 Laptop GPU, i9-12900H, Rayson RS1D0TSSD710 1024 GB PCIe 4.0 NVMe
1931 Points -2%
Asus ROG NUC 14-90AS0051
NVIDIA GeForce RTX 4070 Laptop GPU, Ultra 9 185H, Samsung PM9A1a MZVL21T0HDLU
1872 Points -5%
Maingear ML-16 MK2
NVIDIA GeForce RTX 4070 Laptop GPU, Ultra 7 155H
1860 Points -6%
Acemagic Tank03
GeForce RTX 3080 Laptop GPU, i9-12900H, BiWin CE480V6D10H-1TB
1692 Points -15%
CrossMark / Responsiveness
Beelink GTI12 Ultra EX Docking Station
NVIDIA GeForce RTX 3070, i9-12900H, Crucial P3 Plus CT1000P3PSSD8
1969 Points
Lenovo Legion 9 16IRX9, RTX 4090
NVIDIA GeForce RTX 4090 Laptop GPU, i9-14900HX, Micron 3400 2TB MTFDKBA2T0TFH
1769 Points -10%
Minisforum G7 PT
Radeon RX 7600M XT, R9 7945HX, Kingston OM8PGP41024Q-A0
1739 Points -12%
Acemagic M2A
GeForce RTX 3080 Laptop GPU, i9-12900H, Rayson RS1D0TSSD710 1024 GB PCIe 4.0 NVMe
1556 Points -21%
Maingear ML-16 MK2
NVIDIA GeForce RTX 4070 Laptop GPU, Ultra 7 155H
1507 Points -23%
Acemagic Tank03
GeForce RTX 3080 Laptop GPU, i9-12900H, BiWin CE480V6D10H-1TB
1469 Points -25%
Lenovo IdeaPad Pro 5 16IMH G9 RTX 4050
NVIDIA GeForce RTX 4050 Laptop GPU, Ultra 9 185H, Samsung PM9C1a MZAL81T0HDLB
1419 Points -28%
Asus ROG NUC 14-90AS0051
NVIDIA GeForce RTX 4070 Laptop GPU, Ultra 9 185H, Samsung PM9A1a MZVL21T0HDLU
1380 Points -30%
Asus TUF Gaming A14 FA401WV-WB94
NVIDIA GeForce RTX 4060 Laptop GPU, Ryzen AI 9 HX 370, WD PC SN560 SDDPNQE-1T00
1226 Points -38%
WebXPRT 3 / Overall
Minisforum G7 PT
Radeon RX 7600M XT, R9 7945HX, Kingston OM8PGP41024Q-A0
345 Points +17%
Lenovo IdeaPad Pro 5 16IMH G9 RTX 4050
NVIDIA GeForce RTX 4050 Laptop GPU, Ultra 9 185H, Samsung PM9C1a MZAL81T0HDLB
301 Points +2%
Beelink GTI12 Ultra EX Docking Station
NVIDIA GeForce RTX 3070, i9-12900H, Crucial P3 Plus CT1000P3PSSD8
294 Points
Acemagic M2A
GeForce RTX 3080 Laptop GPU, i9-12900H, Rayson RS1D0TSSD710 1024 GB PCIe 4.0 NVMe
293 Points 0%
Asus TUF Gaming A14 FA401WV-WB94
NVIDIA GeForce RTX 4060 Laptop GPU, Ryzen AI 9 HX 370, WD PC SN560 SDDPNQE-1T00
288 Points -2%
Acemagic Tank03
GeForce RTX 3080 Laptop GPU, i9-12900H, BiWin CE480V6D10H-1TB
283 Points -4%
Lenovo Legion 9 16IRX9, RTX 4090
NVIDIA GeForce RTX 4090 Laptop GPU, i9-14900HX, Micron 3400 2TB MTFDKBA2T0TFH
279 Points -5%
Maingear ML-16 MK2
NVIDIA GeForce RTX 4070 Laptop GPU, Ultra 7 155H
264 Points -10%
MSI GeForce RTX 3070 Ventus 3X
NVIDIA GeForce RTX 3070, R9 5900X, Intel Optane 905P 480GB 2.5
242 Points -18%
Asus ROG NUC 14-90AS0051
NVIDIA GeForce RTX 4070 Laptop GPU, Ultra 9 185H, Samsung PM9A1a MZVL21T0HDLU
240 Points -18%
WebXPRT 4 / Overall
Minisforum G7 PT
Radeon RX 7600M XT, R9 7945HX, Kingston OM8PGP41024Q-A0
293 Points +9%
Acemagic M2A
GeForce RTX 3080 Laptop GPU, i9-12900H, Rayson RS1D0TSSD710 1024 GB PCIe 4.0 NVMe
272 Points +1%
Lenovo IdeaPad Pro 5 16IMH G9 RTX 4050
NVIDIA GeForce RTX 4050 Laptop GPU, Ultra 9 185H, Samsung PM9C1a MZAL81T0HDLB
271 Points 0%
Beelink GTI12 Ultra EX Docking Station
NVIDIA GeForce RTX 3070, i9-12900H, Crucial P3 Plus CT1000P3PSSD8
270 Points
Asus TUF Gaming A14 FA401WV-WB94
NVIDIA GeForce RTX 4060 Laptop GPU, Ryzen AI 9 HX 370, WD PC SN560 SDDPNQE-1T00
252 Points -7%
Asus ROG NUC 14-90AS0051
NVIDIA GeForce RTX 4070 Laptop GPU, Ultra 9 185H, Samsung PM9A1a MZVL21T0HDLU
248 Points -8%
Maingear ML-16 MK2
NVIDIA GeForce RTX 4070 Laptop GPU, Ultra 7 155H
247 Points -9%
Lenovo Legion 9 16IRX9, RTX 4090
NVIDIA GeForce RTX 4090 Laptop GPU, i9-14900HX, Micron 3400 2TB MTFDKBA2T0TFH
246 Points -9%
Acemagic Tank03
GeForce RTX 3080 Laptop GPU, i9-12900H, BiWin CE480V6D10H-1TB
242 Points -10%
Mozilla Kraken 1.1 / Total
MSI GeForce RTX 3070 Ventus 3X
NVIDIA GeForce RTX 3070, R9 5900X, Intel Optane 905P 480GB 2.5
643 ms * -26%
Acemagic Tank03
GeForce RTX 3080 Laptop GPU, i9-12900H, BiWin CE480V6D10H-1TB
608 ms * -19%
Maingear ML-16 MK2
NVIDIA GeForce RTX 4070 Laptop GPU, Ultra 7 155H
568 ms * -12%
Lenovo Legion 9 16IRX9, RTX 4090
NVIDIA GeForce RTX 4090 Laptop GPU, i9-14900HX, Micron 3400 2TB MTFDKBA2T0TFH
535 ms * -5%
Asus ROG NUC 14-90AS0051
NVIDIA GeForce RTX 4070 Laptop GPU, Ultra 9 185H, Samsung PM9A1a MZVL21T0HDLU
526 ms * -3%
Beelink GTI12 Ultra EX Docking Station
NVIDIA GeForce RTX 3070, i9-12900H, Crucial P3 Plus CT1000P3PSSD8
509 ms *
Lenovo IdeaPad Pro 5 16IMH G9 RTX 4050
NVIDIA GeForce RTX 4050 Laptop GPU, Ultra 9 185H, Samsung PM9C1a MZAL81T0HDLB
498 ms * +2%
Acemagic M2A
GeForce RTX 3080 Laptop GPU, i9-12900H, Rayson RS1D0TSSD710 1024 GB PCIe 4.0 NVMe
496 ms * +3%
Minisforum G7 PT
Radeon RX 7600M XT, R9 7945HX, Kingston OM8PGP41024Q-A0
456 ms * +10%
Asus TUF Gaming A14 FA401WV-WB94
NVIDIA GeForce RTX 4060 Laptop GPU, Ryzen AI 9 HX 370, WD PC SN560 SDDPNQE-1T00
450 ms * +12%

* ... im mniej tym lepiej

PCMark 10 Score
7689 pkt.
Pomoc
AIDA64 / Memory Copy
Asus ROG NUC 14-90AS0051
Intel Core Ultra 9 185H, NVIDIA GeForce RTX 4070 Laptop GPU
71360 MB/s +14%
Asus NUC 14 Pro
Intel Core Ultra 5 125H, Arc 7-Core
69264 MB/s +10%
Geekom AX8 Pro
AMD Ryzen 9 8945H, Radeon 780M
68924 MB/s +10%
GMK NucBox K9
Intel Core Ultra 5 125H, Arc 7-Core
67482 MB/s +8%
Minisforum MS-A1
AMD Ryzen 7 8700G, Radeon 780M
64990 MB/s +4%
Beelink GTI12 Ultra EX Docking Station
Intel Core i9-12900H, NVIDIA GeForce RTX 3070
62703 MB/s
Average Intel Core i9-12900H
  (34438 - 74264, n=28)
58945 MB/s -6%
AIDA64 / Memory Read
Asus NUC 14 Pro
Intel Core Ultra 5 125H, Arc 7-Core
74415 MB/s +13%
Asus ROG NUC 14-90AS0051
Intel Core Ultra 9 185H, NVIDIA GeForce RTX 4070 Laptop GPU
73604 MB/s +11%
GMK NucBox K9
Intel Core Ultra 5 125H, Arc 7-Core
70520 MB/s +7%
Beelink GTI12 Ultra EX Docking Station
Intel Core i9-12900H, NVIDIA GeForce RTX 3070
66047 MB/s
Average Intel Core i9-12900H
  (36365 - 74642, n=28)
61718 MB/s -7%
Geekom AX8 Pro
AMD Ryzen 9 8945H, Radeon 780M
61624 MB/s -7%
Minisforum MS-A1
AMD Ryzen 7 8700G, Radeon 780M
61504 MB/s -7%
AIDA64 / Memory Write
Geekom AX8 Pro
AMD Ryzen 9 8945H, Radeon 780M
87138 MB/s +32%
Minisforum MS-A1
AMD Ryzen 7 8700G, Radeon 780M
79329 MB/s +20%
Asus NUC 14 Pro
Intel Core Ultra 5 125H, Arc 7-Core
72443 MB/s +10%
GMK NucBox K9
Intel Core Ultra 5 125H, Arc 7-Core
71218 MB/s +8%
Asus ROG NUC 14-90AS0051
Intel Core Ultra 9 185H, NVIDIA GeForce RTX 4070 Laptop GPU
69862 MB/s +6%
Beelink GTI12 Ultra EX Docking Station
Intel Core i9-12900H, NVIDIA GeForce RTX 3070
66097 MB/s
Average Intel Core i9-12900H
  (32276 - 67858, n=28)
59318 MB/s -10%
AIDA64 / Memory Latency
Asus ROG NUC 14-90AS0051
Intel Core Ultra 9 185H, NVIDIA GeForce RTX 4070 Laptop GPU
170 ns * -90%
GMK NucBox K9
Intel Core Ultra 5 125H, Arc 7-Core
140.2 ns * -57%
Asus NUC 14 Pro
Intel Core Ultra 5 125H, Arc 7-Core
127.3 ns * -43%
Geekom AX8 Pro
AMD Ryzen 9 8945H, Radeon 780M
91.4 ns * -2%
Beelink GTI12 Ultra EX Docking Station
Intel Core i9-12900H, NVIDIA GeForce RTX 3070
89.3 ns *
Minisforum MS-A1
AMD Ryzen 7 8700G, Radeon 780M
88.5 ns * +1%
Average Intel Core i9-12900H
  (74.7 - 118.1, n=27)
85.7 ns * +4%

* ... im mniej tym lepiej

Opóźnienie DPC

odtwarzanie wideo 4k60

odtwarzanie wideo 4K przy 60 FPS jest prawie idealne. Co dziwne, zawsze występuje kilka pominiętych klatek natychmiast po naciśnięciu przycisku odtwarzania, czego zwykle nie doświadczamy na innych komputerach. W przeciwnym razie nie ma żadnych pominiętych klatek w pozostałej części testowego wideo.

LatencyMon jest niekompatybilny z obecną wersją systemu.

Urządzenia pamięci masowej

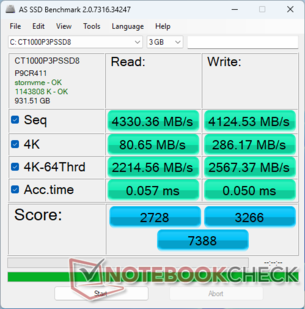
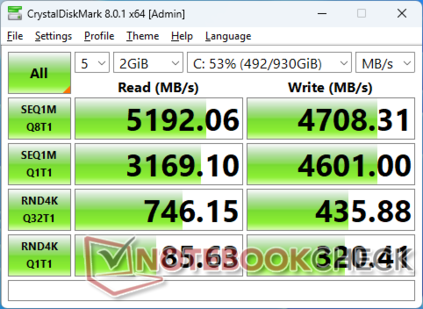
Nasze urządzenie jest wyposażone w dysk 1 TB Crucial P3 Plus SSD. Maksymalne prędkości transferu sięgają 5200 MB/s, po czym spadają do 4800 MB/s po kilku minutach obciążenia. Dla porównania, szybszy dysk Samsung PM9A1a w Asusie NUC 14 osiąga 6700 MB/s.

AS SSD
AS SSD
CDM 8
CDM 8
Crucial P3 Plus CT1000P3PSSD8
CDM 5/6 Read Seq Q32T1: 5091 MB/s
CDM 5/6 Write Seq Q32T1: 4699 MB/s
CDM 5/6 Read 4K Q32T1: 745.1 MB/s
CDM 5/6 Write 4K Q32T1: 427.3 MB/s
CDM 5 Read Seq: 3176 MB/s
CDM 5 Write Seq: 4613 MB/s
CDM 5/6 Read 4K: 85.15 MB/s
CDM 5/6 Write 4K: 311.5 MB/s
Drive Performance Rating - Percent
Beelink GTI12 Ultra EX Docking Station
Crucial P3 Plus CT1000P3PSSD8
81.1 pt
GMK NucBox K9
MasonSemi 1TB MC7000
77.7 pt
Minisforum MS-A1
Kingston OM8PGP41024Q-A0
77.4 pt
Geekom AX8 Pro
Acer N7000
63.2 pt
Asus ROG NUC 14-90AS0051
Samsung PM9A1a MZVL21T0HDLU
60.4 pt
Asus NUC 14 Pro
Kingston KC3000 2048G SKC3000D2048G
58.5 pt
DiskSpd
seq read
Geekom AX8 Pro
Acer N7000
3921 (3897.31min - 3920.75max) MB/s +27%
GMK NucBox K9
MasonSemi 1TB MC7000
3783 (3597.81min - 3782.84max) MB/s +22%
Asus NUC 14 Pro
Kingston KC3000 2048G SKC3000D2048G
3706 (3594.04min - 3706.37max) MB/s +20%
Beelink GTI12 Ultra EX Docking Station
Crucial P3 Plus CT1000P3PSSD8
3092 (3065.78min - 3092.25max) MB/s
Asus ROG NUC 14-90AS0051
Samsung PM9A1a MZVL21T0HDLU
3028 (3010.25min - 3027.87max) MB/s -2%
Minisforum MS-A1
Kingston OM8PGP41024Q-A0
2596 (2580.13min - 2596.06max) MB/s -16%
seq write
GMK NucBox K9
MasonSemi 1TB MC7000
5556 (1352.45min - 5556.19max) MB/s +23%
Beelink GTI12 Ultra EX Docking Station
Crucial P3 Plus CT1000P3PSSD8
4499 (4456.97min - 4498.62max) MB/s
Minisforum MS-A1
Kingston OM8PGP41024Q-A0
3913 (3872.62min - 3912.8max) MB/s -13%
Geekom AX8 Pro
Acer N7000
3791 (3695.18min - 3790.57max) MB/s -16%
Asus ROG NUC 14-90AS0051
Samsung PM9A1a MZVL21T0HDLU
3433 (3398.64min - 3432.62max) MB/s -24%
Asus NUC 14 Pro
Kingston KC3000 2048G SKC3000D2048G
2928 (1958.53min - 2927.62max) MB/s -35%
seq q8 t1 read
Asus NUC 14 Pro
Kingston KC3000 2048G SKC3000D2048G
7110 (6058.21min - 7110.02max) MB/s +38%
GMK NucBox K9
MasonSemi 1TB MC7000
7066 (6607.49min - 7066.35max) MB/s +37%
Geekom AX8 Pro
Acer N7000
7012 (5624.01min - 7012.25max) MB/s +36%
Asus ROG NUC 14-90AS0051
Samsung PM9A1a MZVL21T0HDLU
6023 (4949.03min - 6022.72max) MB/s +17%
Beelink GTI12 Ultra EX Docking Station
Crucial P3 Plus CT1000P3PSSD8
5164 (4719.64min - 5163.61max) MB/s
Minisforum MS-A1
Kingston OM8PGP41024Q-A0
4819 (3762.53min - 4819.05max) MB/s -7%
seq q8 t1 write
GMK NucBox K9
MasonSemi 1TB MC7000
6647 (1260.59min - 6647.13max) MB/s +41%
Geekom AX8 Pro
Acer N7000
5685 (5389.6min - 5684.54max) MB/s +21%
Asus ROG NUC 14-90AS0051
Samsung PM9A1a MZVL21T0HDLU
5047 (4973.7min - 5046.77max) MB/s +7%
Asus NUC 14 Pro
Kingston KC3000 2048G SKC3000D2048G
4712 (3064.99min - 4711.88max) MB/s 0%
Beelink GTI12 Ultra EX Docking Station
Crucial P3 Plus CT1000P3PSSD8
4705 (4693.69min - 4704.99max) MB/s
Minisforum MS-A1
Kingston OM8PGP41024Q-A0
3927 (3923.26min - 3927.45max) MB/s -17%
4k q1 t1 read
Beelink GTI12 Ultra EX Docking Station
Crucial P3 Plus CT1000P3PSSD8
82.5 (81.89min - 82.53max) MB/s
GMK NucBox K9
MasonSemi 1TB MC7000
79.5 (78.92min - 79.5max) MB/s -4%
Minisforum MS-A1
Kingston OM8PGP41024Q-A0
63.3 (62.78min - 63.25max) MB/s -23%
Geekom AX8 Pro
Acer N7000
62.2 (61.55min - 62.23max) MB/s -25%
Asus ROG NUC 14-90AS0051
Samsung PM9A1a MZVL21T0HDLU
57.3 (55.83min - 57.3max) MB/s -31%
Asus NUC 14 Pro
Kingston KC3000 2048G SKC3000D2048G
53.4 (49.89min - 53.35max) MB/s -35%
4k q1 t1 write
Beelink GTI12 Ultra EX Docking Station
Crucial P3 Plus CT1000P3PSSD8
343 (339.81min - 342.66max) MB/s
Minisforum MS-A1
Kingston OM8PGP41024Q-A0
206 (204.82min - 206.03max) MB/s -40%
GMK NucBox K9
MasonSemi 1TB MC7000
205 (173.87min - 205.2max) MB/s -40%
Geekom AX8 Pro
Acer N7000
187 (185.73min - 187.04max) MB/s -45%
Asus ROG NUC 14-90AS0051
Samsung PM9A1a MZVL21T0HDLU
132.2 (131.33min - 132.22max) MB/s -61%
Asus NUC 14 Pro
Kingston KC3000 2048G SKC3000D2048G
83.1 (75.3min - 83.11max) MB/s -76%
4k q32 t16 read
Beelink GTI12 Ultra EX Docking Station
Crucial P3 Plus CT1000P3PSSD8
3140 (3129.38min - 3139.65max) MB/s
Minisforum MS-A1
Kingston OM8PGP41024Q-A0
2980 (2975.03min - 2979.83max) MB/s -5%
GMK NucBox K9
MasonSemi 1TB MC7000
2243 (1941.91min - 2243.48max) MB/s -29%
Geekom AX8 Pro
Acer N7000
1644 (1568.76min - 1643.51max) MB/s -48%
Asus ROG NUC 14-90AS0051
Samsung PM9A1a MZVL21T0HDLU
875 (847.6min - 875.38max) MB/s -72%
Asus NUC 14 Pro
Kingston KC3000 2048G SKC3000D2048G
731 (660.89min - 731.29max) MB/s -77%
4k q32 t16 write
Minisforum MS-A1
Kingston OM8PGP41024Q-A0
3784 (3750.18min - 3783.56max) MB/s +31%
GMK NucBox K9
MasonSemi 1TB MC7000
3232 (3002.64min - 3232.41max) MB/s +12%
Beelink GTI12 Ultra EX Docking Station
Crucial P3 Plus CT1000P3PSSD8
2888 (2858.16min - 2887.52max) MB/s
Geekom AX8 Pro
Acer N7000
647 (598.22min - 647.4max) MB/s -78%
Asus ROG NUC 14-90AS0051
Samsung PM9A1a MZVL21T0HDLU
423 (415.61min - 422.66max) MB/s -85%
Asus NUC 14 Pro
Kingston KC3000 2048G SKC3000D2048G
186.7 (155.05min - 186.74max) MB/s -94%
AS SSD
Score Total
Minisforum MS-A1
Kingston OM8PGP41024Q-A0
8405 Points +14%
GMK NucBox K9
MasonSemi 1TB MC7000
7509 Points +2%
Beelink GTI12 Ultra EX Docking Station
Crucial P3 Plus CT1000P3PSSD8
7388 Points
Geekom AX8 Pro
Acer N7000
5512 Points -25%
Asus ROG NUC 14-90AS0051
Samsung PM9A1a MZVL21T0HDLU
5387 Points -27%
Asus NUC 14 Pro
Kingston KC3000 2048G SKC3000D2048G
5131 Points -31%
Score Read
GMK NucBox K9
MasonSemi 1TB MC7000
3258 Points +19%
Minisforum MS-A1
Kingston OM8PGP41024Q-A0
2901 Points +6%
Beelink GTI12 Ultra EX Docking Station
Crucial P3 Plus CT1000P3PSSD8
2728 Points
Geekom AX8 Pro
Acer N7000
1793 Points -34%
Asus ROG NUC 14-90AS0051
Samsung PM9A1a MZVL21T0HDLU
1437 Points -47%
Asus NUC 14 Pro
Kingston KC3000 2048G SKC3000D2048G
1275 Points -53%
Score Write
Minisforum MS-A1
Kingston OM8PGP41024Q-A0
4040 Points +24%
Asus ROG NUC 14-90AS0051
Samsung PM9A1a MZVL21T0HDLU
3324 Points +2%
Asus NUC 14 Pro
Kingston KC3000 2048G SKC3000D2048G
3313 Points +1%
Beelink GTI12 Ultra EX Docking Station
Crucial P3 Plus CT1000P3PSSD8
3266 Points
Geekom AX8 Pro
Acer N7000
2896 Points -11%
GMK NucBox K9
MasonSemi 1TB MC7000
2593 Points -21%
Seq Read
GMK NucBox K9
MasonSemi 1TB MC7000
5766.47 MB/s +33%
Asus ROG NUC 14-90AS0051
Samsung PM9A1a MZVL21T0HDLU
5245 MB/s +21%
Asus NUC 14 Pro
Kingston KC3000 2048G SKC3000D2048G
5158 MB/s +19%
Geekom AX8 Pro
Acer N7000
4902 MB/s +13%
Beelink GTI12 Ultra EX Docking Station
Crucial P3 Plus CT1000P3PSSD8
4330.36 MB/s
Minisforum MS-A1
Kingston OM8PGP41024Q-A0
4159 MB/s -4%
Seq Write
GMK NucBox K9
MasonSemi 1TB MC7000
5653.88 MB/s +37%
Beelink GTI12 Ultra EX Docking Station
Crucial P3 Plus CT1000P3PSSD8
4124.53 MB/s
Minisforum MS-A1
Kingston OM8PGP41024Q-A0
3688 MB/s -11%
Geekom AX8 Pro
Acer N7000
2835 MB/s -31%
Asus ROG NUC 14-90AS0051
Samsung PM9A1a MZVL21T0HDLU
2696 MB/s -35%
Asus NUC 14 Pro
Kingston KC3000 2048G SKC3000D2048G
2646 MB/s -36%
4K Read
Beelink GTI12 Ultra EX Docking Station
Crucial P3 Plus CT1000P3PSSD8
80.65 MB/s
Minisforum MS-A1
Kingston OM8PGP41024Q-A0
75.7 MB/s -6%
Asus ROG NUC 14-90AS0051
Samsung PM9A1a MZVL21T0HDLU
70.6 MB/s -12%
GMK NucBox K9
MasonSemi 1TB MC7000
67.66 MB/s -16%
Asus NUC 14 Pro
Kingston KC3000 2048G SKC3000D2048G
63.6 MB/s -21%
Geekom AX8 Pro
Acer N7000
59.1 MB/s -27%
4K Write
Beelink GTI12 Ultra EX Docking Station
Crucial P3 Plus CT1000P3PSSD8
286.17 MB/s
Geekom AX8 Pro
Acer N7000
181.4 MB/s -37%
Minisforum MS-A1
Kingston OM8PGP41024Q-A0
178.8 MB/s -38%
Asus ROG NUC 14-90AS0051
Samsung PM9A1a MZVL21T0HDLU
178.6 MB/s -38%
Asus NUC 14 Pro
Kingston KC3000 2048G SKC3000D2048G
169.5 MB/s -41%
GMK NucBox K9
MasonSemi 1TB MC7000
148.58 MB/s -48%
4K-64 Read
GMK NucBox K9
MasonSemi 1TB MC7000
2614.06 MB/s +18%
Minisforum MS-A1
Kingston OM8PGP41024Q-A0
2409 MB/s +9%
Beelink GTI12 Ultra EX Docking Station
Crucial P3 Plus CT1000P3PSSD8
2214.56 MB/s
Geekom AX8 Pro
Acer N7000
1244 MB/s -44%
Asus ROG NUC 14-90AS0051
Samsung PM9A1a MZVL21T0HDLU
842 MB/s -62%
Asus NUC 14 Pro
Kingston KC3000 2048G SKC3000D2048G
695 MB/s -69%
4K-64 Write
Minisforum MS-A1
Kingston OM8PGP41024Q-A0
3492 MB/s +36%
Asus NUC 14 Pro
Kingston KC3000 2048G SKC3000D2048G
2878 MB/s +12%
Asus ROG NUC 14-90AS0051
Samsung PM9A1a MZVL21T0HDLU
2876 MB/s +12%
Beelink GTI12 Ultra EX Docking Station
Crucial P3 Plus CT1000P3PSSD8
2567.37 MB/s
Geekom AX8 Pro
Acer N7000
2431 MB/s -5%
GMK NucBox K9
MasonSemi 1TB MC7000
1879.53 MB/s -27%
Access Time Read
Geekom AX8 Pro
Acer N7000
0.079 ms * -39%
Minisforum MS-A1
Kingston OM8PGP41024Q-A0
0.066 ms * -16%
Asus ROG NUC 14-90AS0051
Samsung PM9A1a MZVL21T0HDLU
0.064 ms * -12%
GMK NucBox K9
MasonSemi 1TB MC7000
0.06 ms * -5%
Beelink GTI12 Ultra EX Docking Station
Crucial P3 Plus CT1000P3PSSD8
0.057 ms *
Asus NUC 14 Pro
Kingston KC3000 2048G SKC3000D2048G
0.053 ms * +7%
Access Time Write
GMK NucBox K9
MasonSemi 1TB MC7000
0.195 ms * -290%
Geekom AX8 Pro
Acer N7000
0.064 ms * -28%
Beelink GTI12 Ultra EX Docking Station
Crucial P3 Plus CT1000P3PSSD8
0.05 ms *
Asus NUC 14 Pro
Kingston KC3000 2048G SKC3000D2048G
0.043 ms * +14%
Minisforum MS-A1
Kingston OM8PGP41024Q-A0
0.032 ms * +36%
Asus ROG NUC 14-90AS0051
Samsung PM9A1a MZVL21T0HDLU
0.023 ms * +54%

* ... im mniej tym lepiej

Disk Throttling: DiskSpd Read Loop, Queue Depth 8

034068010201360170020402380272030603400374040804420476051005440578061206460Tooltip
Beelink GTI12 Ultra EX Docking Station Crucial P3 Plus CT1000P3PSSD8; diskspd 2.0.17 f: Ø4958 (4279.7-5189.4)
Asus ROG NUC 14-90AS0051 Samsung PM9A1a MZVL21T0HDLU; diskspd 2.0.17 f: Ø6673 (5894.88-6717.19)

Wydajność GPU

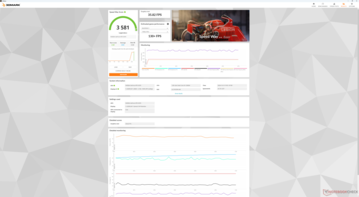
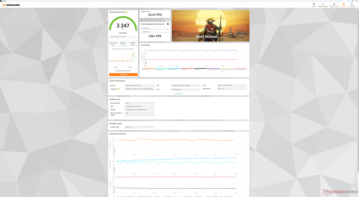
The GeForce RTX 3070 została gruntownie przetestowana, więc jej wydajność nie stanowi niespodzianki. Zamiast tego interesują nas wszelkie deficyty wydajności, które nasz zadokowany RTX 3070 może mieć w porównaniu z "właściwym" komputerem stacjonarnym z RTX 3070. W tym przypadku wydajność jest zasadniczo taka sama jak w przypadku naszego referencyjnego komputera stacjonarnego z RTX 3070, a nawet nieco szybsza o kilka punktów procentowych, aby nie wykazać namacalnych strat wydajności. Oczywiście wyniki mogą się różnić w przypadku instalacji znacznie szybszych układów GPU, takich jak RTX 4090, gdzie interfejs PCIe x8 może stać się bardziej ograniczającym czynnikiem.

3DMark 11
3DMark 11
Fire Strike
Fire Strike
Time Spy
Time Spy
Speed Way
Speed Way
Steel Nomad
Steel Nomad
 
3DMark Performance Rating - Percent
Lenovo Legion 9 16IRX9, RTX 4090 -2!
NVIDIA GeForce RTX 4090 Laptop GPU, Intel Core i9-14900HX
100 pt
Beelink GTI12 Ultra EX Docking Station
NVIDIA GeForce RTX 3070, Intel Core i9-12900H
81.6 pt
Average NVIDIA GeForce RTX 3070
 
75.8 pt
Asus ROG NUC 14-90AS0051
NVIDIA GeForce RTX 4070 Laptop GPU, Intel Core Ultra 9 185H
68.7 pt
MSI GeForce RTX 3070 Ventus 3X -2!
NVIDIA GeForce RTX 3070, AMD Ryzen 9 5900X
66.7 pt
Maingear ML-16 MK2
NVIDIA GeForce RTX 4070 Laptop GPU, Intel Core Ultra 7 155H
62.4 pt
Minisforum G7 PT
AMD Radeon RX 7600M XT, AMD Ryzen 9 7945HX
61.8 pt
Asus TUF Gaming A14 FA401WV-WB94
NVIDIA GeForce RTX 4060 Laptop GPU, AMD Ryzen AI 9 HX 370
60.7 pt
Acemagic M2A
NVIDIA GeForce RTX 3080 Laptop GPU, Intel Core i9-12900H
59.3 pt
Acemagic Tank03 -1!
NVIDIA GeForce RTX 3080 Laptop GPU, Intel Core i9-12900H
56.9 pt
Lenovo IdeaPad Pro 5 16IMH G9 RTX 4050
NVIDIA GeForce RTX 4050 Laptop GPU, Intel Core Ultra 9 185H
50.5 pt
3DMark 11 - 1280x720 Performance GPU
Lenovo Legion 9 16IRX9, RTX 4090
NVIDIA GeForce RTX 4090 Laptop GPU, Intel Core i9-14900HX
64341 Points +34%
Beelink GTI12 Ultra EX Docking Station
NVIDIA GeForce RTX 3070, Intel Core i9-12900H
47892 Points
Minisforum G7 PT
AMD Radeon RX 7600M XT, AMD Ryzen 9 7945HX
44060 Points -8%
MSI GeForce RTX 3070 Ventus 3X
NVIDIA GeForce RTX 3070, AMD Ryzen 9 5900X
43005 Points -10%
Average NVIDIA GeForce RTX 3070
  (26812 - 47892, n=10)
41541 Points -13%
Asus ROG NUC 14-90AS0051
NVIDIA GeForce RTX 4070 Laptop GPU, Intel Core Ultra 9 185H
40144 Points -16%
Maingear ML-16 MK2
NVIDIA GeForce RTX 4070 Laptop GPU, Intel Core Ultra 7 155H
37263 Points -22%
Asus TUF Gaming A14 FA401WV-WB94
NVIDIA GeForce RTX 4060 Laptop GPU, AMD Ryzen AI 9 HX 370
36372 Points -24%
Acemagic Tank03
NVIDIA GeForce RTX 3080 Laptop GPU, Intel Core i9-12900H
35614 Points -26%
Acemagic M2A
NVIDIA GeForce RTX 3080 Laptop GPU, Intel Core i9-12900H
34924 Points -27%
Lenovo IdeaPad Pro 5 16IMH G9 RTX 4050
NVIDIA GeForce RTX 4050 Laptop GPU, Intel Core Ultra 9 185H
30309 Points -37%
3DMark
1920x1080 Fire Strike Graphics
Lenovo Legion 9 16IRX9, RTX 4090
NVIDIA GeForce RTX 4090 Laptop GPU, Intel Core i9-14900HX
43518 Points +28%
Beelink GTI12 Ultra EX Docking Station
NVIDIA GeForce RTX 3070, Intel Core i9-12900H
34047 Points
MSI GeForce RTX 3070 Ventus 3X
NVIDIA GeForce RTX 3070, AMD Ryzen 9 5900X
31020 Points -9%
Minisforum G7 PT
AMD Radeon RX 7600M XT, AMD Ryzen 9 7945HX
30684 Points -10%
Average NVIDIA GeForce RTX 3070
  (20357 - 34047, n=8)
29587 Points -13%
Asus ROG NUC 14-90AS0051
NVIDIA GeForce RTX 4070 Laptop GPU, Intel Core Ultra 9 185H
29264 Points -14%
Maingear ML-16 MK2
NVIDIA GeForce RTX 4070 Laptop GPU, Intel Core Ultra 7 155H
28464 Points -16%
Asus TUF Gaming A14 FA401WV-WB94
NVIDIA GeForce RTX 4060 Laptop GPU, AMD Ryzen AI 9 HX 370
26679 Points -22%
Acemagic Tank03
NVIDIA GeForce RTX 3080 Laptop GPU, Intel Core i9-12900H
25733 Points -24%
Acemagic M2A
NVIDIA GeForce RTX 3080 Laptop GPU, Intel Core i9-12900H
25433 Points -25%
Lenovo IdeaPad Pro 5 16IMH G9 RTX 4050
NVIDIA GeForce RTX 4050 Laptop GPU, Intel Core Ultra 9 185H
23210 Points -32%
2560x1440 Time Spy Graphics
Lenovo Legion 9 16IRX9, RTX 4090
NVIDIA GeForce RTX 4090 Laptop GPU, Intel Core i9-14900HX
20416 Points +46%
Beelink GTI12 Ultra EX Docking Station
NVIDIA GeForce RTX 3070, Intel Core i9-12900H
13961 Points
MSI GeForce RTX 3070 Ventus 3X
NVIDIA GeForce RTX 3070, AMD Ryzen 9 5900X
13111 Points -6%
Average NVIDIA GeForce RTX 3070
  (11043 - 13961, n=8)
12784 Points -8%
Asus ROG NUC 14-90AS0051
NVIDIA GeForce RTX 4070 Laptop GPU, Intel Core Ultra 9 185H
12040 Points -14%
Minisforum G7 PT
AMD Radeon RX 7600M XT, AMD Ryzen 9 7945HX
10777 Points -23%
Maingear ML-16 MK2
NVIDIA GeForce RTX 4070 Laptop GPU, Intel Core Ultra 7 155H
10691 Points -23%
Asus TUF Gaming A14 FA401WV-WB94
NVIDIA GeForce RTX 4060 Laptop GPU, AMD Ryzen AI 9 HX 370
10397 Points -26%
Acemagic Tank03
NVIDIA GeForce RTX 3080 Laptop GPU, Intel Core i9-12900H
10112 Points -28%
Acemagic M2A
NVIDIA GeForce RTX 3080 Laptop GPU, Intel Core i9-12900H
10108 Points -28%
Lenovo IdeaPad Pro 5 16IMH G9 RTX 4050
NVIDIA GeForce RTX 4050 Laptop GPU, Intel Core Ultra 9 185H
8574 Points -39%
2560x1440 Time Spy Score
Lenovo Legion 9 16IRX9, RTX 4090
NVIDIA GeForce RTX 4090 Laptop GPU, Intel Core i9-14900HX
20099 Points +46%
Beelink GTI12 Ultra EX Docking Station
NVIDIA GeForce RTX 3070, Intel Core i9-12900H
13722 Points
MSI GeForce RTX 3070 Ventus 3X
NVIDIA GeForce RTX 3070, AMD Ryzen 9 5900X
12937 Points -6%
Asus ROG NUC 14-90AS0051
NVIDIA GeForce RTX 4070 Laptop GPU, Intel Core Ultra 9 185H
11963 Points -13%
Average NVIDIA GeForce RTX 3070
  (8113 - 13722, n=8)
11944 Points -13%
Minisforum G7 PT
AMD Radeon RX 7600M XT, AMD Ryzen 9 7945HX
11041 Points -20%
Maingear ML-16 MK2
NVIDIA GeForce RTX 4070 Laptop GPU, Intel Core Ultra 7 155H
10759 Points -22%
Asus TUF Gaming A14 FA401WV-WB94
NVIDIA GeForce RTX 4060 Laptop GPU, AMD Ryzen AI 9 HX 370
10451 Points -24%
Acemagic M2A
NVIDIA GeForce RTX 3080 Laptop GPU, Intel Core i9-12900H
10307 Points -25%
Acemagic Tank03
NVIDIA GeForce RTX 3080 Laptop GPU, Intel Core i9-12900H
10231 Points -25%
Lenovo IdeaPad Pro 5 16IMH G9 RTX 4050
NVIDIA GeForce RTX 4050 Laptop GPU, Intel Core Ultra 9 185H
8963 Points -35%
2560x1440 Speed Way Score
Beelink GTI12 Ultra EX Docking Station
NVIDIA GeForce RTX 3070, Intel Core i9-12900H
3581 Points
Average NVIDIA GeForce RTX 3070
  ()
3581 Points 0%
Asus ROG NUC 14-90AS0051
NVIDIA GeForce RTX 4070 Laptop GPU, Intel Core Ultra 9 185H
2959 Points -17%
Maingear ML-16 MK2
NVIDIA GeForce RTX 4070 Laptop GPU, Intel Core Ultra 7 155H
2620 Points -27%
Asus TUF Gaming A14 FA401WV-WB94
NVIDIA GeForce RTX 4060 Laptop GPU, AMD Ryzen AI 9 HX 370
2611 Points -27%
Acemagic M2A
NVIDIA GeForce RTX 3080 Laptop GPU, Intel Core i9-12900H
2514 Points -30%
Acemagic Tank03
NVIDIA GeForce RTX 3080 Laptop GPU, Intel Core i9-12900H
2495 Points -30%
Lenovo IdeaPad Pro 5 16IMH G9 RTX 4050
NVIDIA GeForce RTX 4050 Laptop GPU, Intel Core Ultra 9 185H
2078 Points -42%
Minisforum G7 PT
AMD Radeon RX 7600M XT, AMD Ryzen 9 7945HX
1975 Points -45%
Steel Nomad Score
Beelink GTI12 Ultra EX Docking Station
NVIDIA GeForce RTX 3070, Intel Core i9-12900H
3247 Points
Average NVIDIA GeForce RTX 3070
  ()
3247 Points 0%
Asus ROG NUC 14-90AS0051
NVIDIA GeForce RTX 4070 Laptop GPU, Intel Core Ultra 9 185H
2651 Points -18%
Acemagic M2A
NVIDIA GeForce RTX 3080 Laptop GPU, Intel Core i9-12900H
2337 Points -28%
Maingear ML-16 MK2
NVIDIA GeForce RTX 4070 Laptop GPU, Intel Core Ultra 7 155H
2329 Points -28%
Asus TUF Gaming A14 FA401WV-WB94
NVIDIA GeForce RTX 4060 Laptop GPU, AMD Ryzen AI 9 HX 370
2283 Points -30%
Minisforum G7 PT
AMD Radeon RX 7600M XT, AMD Ryzen 9 7945HX
2243 Points -31%
Lenovo IdeaPad Pro 5 16IMH G9 RTX 4050
NVIDIA GeForce RTX 4050 Laptop GPU, Intel Core Ultra 9 185H
1873 Points -42%
3DMark 11 Performance
37012 pkt.
3DMark Cloud Gate Standard Score
57634 pkt.
3DMark Fire Strike Score
27206 pkt.
3DMark Time Spy Score
13722 pkt.
3DMark Steel Nomad Score
3247 pkt.
Pomoc
Blender
v3.3 Classroom OPTIX/RTX
Lenovo IdeaPad Pro 5 16IMH G9 RTX 4050
NVIDIA GeForce RTX 4050 Laptop GPU, Intel Core Ultra 9 185H
26 Seconds * -13%
Acemagic M2A
NVIDIA GeForce RTX 3080 Laptop GPU, Intel Core i9-12900H
25 Seconds * -9%
Acemagic Tank03
NVIDIA GeForce RTX 3080 Laptop GPU, Intel Core i9-12900H
23 Seconds * -0%
Beelink GTI12 Ultra EX Docking Station
NVIDIA GeForce RTX 3070, Intel Core i9-12900H
23 Seconds *
Average NVIDIA GeForce RTX 3070
  ()
23 Seconds * -0%
Asus TUF Gaming A14 FA401WV-WB94
NVIDIA GeForce RTX 4060 Laptop GPU, AMD Ryzen AI 9 HX 370
22 Seconds * +4%
Asus ROG NUC 14-90AS0051
NVIDIA GeForce RTX 4070 Laptop GPU, Intel Core Ultra 9 185H
19 Seconds * +17%
Lenovo Legion 9 16IRX9, RTX 4090
NVIDIA GeForce RTX 4090 Laptop GPU, Intel Core i9-14900HX
13 Seconds * +43%
v3.3 Classroom CUDA
Lenovo IdeaPad Pro 5 16IMH G9 RTX 4050
NVIDIA GeForce RTX 4050 Laptop GPU, Intel Core Ultra 9 185H
47 Seconds * -31%
Acemagic M2A
NVIDIA GeForce RTX 3080 Laptop GPU, Intel Core i9-12900H
42 Seconds * -17%
Acemagic Tank03
NVIDIA GeForce RTX 3080 Laptop GPU, Intel Core i9-12900H
41 Seconds * -14%
Asus TUF Gaming A14 FA401WV-WB94
NVIDIA GeForce RTX 4060 Laptop GPU, AMD Ryzen AI 9 HX 370
40 Seconds * -11%
Beelink GTI12 Ultra EX Docking Station
NVIDIA GeForce RTX 3070, Intel Core i9-12900H
36 Seconds *
Average NVIDIA GeForce RTX 3070
  ()
36 Seconds * -0%
Lenovo Legion 9 16IRX9, RTX 4090
NVIDIA GeForce RTX 4090 Laptop GPU, Intel Core i9-14900HX
18 Seconds * +50%
v3.3 Classroom CPU
Acemagic M2A
NVIDIA GeForce RTX 3080 Laptop GPU, Intel Core i9-12900H
464 Seconds * -38%
Acemagic Tank03
NVIDIA GeForce RTX 3080 Laptop GPU, Intel Core i9-12900H
447 Seconds * -33%
Beelink GTI12 Ultra EX Docking Station
NVIDIA GeForce RTX 3070, Intel Core i9-12900H
336 Seconds *
Average NVIDIA GeForce RTX 3070
  ()
336 Seconds * -0%
Lenovo IdeaPad Pro 5 16IMH G9 RTX 4050
NVIDIA GeForce RTX 4050 Laptop GPU, Intel Core Ultra 9 185H
298 Seconds * +11%
Asus ROG NUC 14-90AS0051
NVIDIA GeForce RTX 4070 Laptop GPU, Intel Core Ultra 9 185H
280 Seconds * +17%
Asus TUF Gaming A14 FA401WV-WB94
NVIDIA GeForce RTX 4060 Laptop GPU, AMD Ryzen AI 9 HX 370
215 Seconds * +36%
Lenovo Legion 9 16IRX9, RTX 4090
NVIDIA GeForce RTX 4090 Laptop GPU, Intel Core i9-14900HX
193 Seconds * +43%
Minisforum G7 PT
AMD Radeon RX 7600M XT, AMD Ryzen 9 7945HX
160 Seconds * +52%
v3.3 Classroom oneAPI/Intel
Asus ROG NUC 14-90AS0051
NVIDIA GeForce RTX 4070 Laptop GPU, Intel Core Ultra 9 185H
234 Seconds *

* ... im mniej tym lepiej

Wydajność w grach

Pomimo tego, że jest to czteroletni (!) procesor graficzny, desktopowy GeForce RTX 3070 jest nadal potężny, zwłaszcza w porównaniu z laptopami do gier, w których koperty mocy są znacznie mniejsze. Nasz GTI12 Ultra i wybrane przez nas eGPU mogą z łatwością przewyższyć laptopy z GeForce RTX 4070, takie jak Maingear ML-16 MK2 aby być bardziej w zgodzie z mobilnym RTX 4080. Proszę zauważyć, że jest to wynik przed uwzględnieniem jakichkolwiek metod skalowania DLSS, więc mobilna seria RTX 40 może nadal potencjalnie działać lepiej, jeśli dany tytuł obsługuje DLSS 3.

Performance Rating - Percent
Lenovo Legion 9 16IRX9, RTX 4090 -1!
Intel Core i9-14900HX, NVIDIA GeForce RTX 4090 Laptop GPU
100 pt
Beelink GTI12 Ultra EX Docking Station
Intel Core i9-12900H, NVIDIA GeForce RTX 3070
82.1 pt
MSI GeForce RTX 3070 Ventus 3X -2!
AMD Ryzen 9 5900X, NVIDIA GeForce RTX 3070
74.4 pt
Acemagic M2A
Intel Core i9-12900H, NVIDIA GeForce RTX 3080 Laptop GPU
71.2 pt
Asus ROG NUC 14-90AS0051 -1!
Intel Core Ultra 9 185H, NVIDIA GeForce RTX 4070 Laptop GPU
71.1 pt
Minisforum G7 PT
AMD Ryzen 9 7945HX, AMD Radeon RX 7600M XT
69.9 pt
Acemagic Tank03
Intel Core i9-12900H, NVIDIA GeForce RTX 3080 Laptop GPU
69.7 pt
Asus TUF Gaming A14 FA401WV-WB94
AMD Ryzen AI 9 HX 370, NVIDIA GeForce RTX 4060 Laptop GPU
65.1 pt
Lenovo IdeaPad Pro 5 16IMH G9 RTX 4050
Intel Core Ultra 9 185H, NVIDIA GeForce RTX 4050 Laptop GPU
61 pt
Baldur's Gate 3 - 1920x1080 Ultra Preset
Beelink GTI12 Ultra EX Docking Station
Intel Core i9-12900H, NVIDIA GeForce RTX 3070
132.9 fps
Asus ROG NUC 14-90AS0051
Intel Core Ultra 9 185H, NVIDIA GeForce RTX 4070 Laptop GPU
105 (14min, 38P0.1, 71.4P1) fps -21%
Minisforum G7 PT
AMD Ryzen 9 7945HX, AMD Radeon RX 7600M XT
92.9 (59.8min, 61.3P0.1, 80.3P1) fps -30%
Acemagic M2A
Intel Core i9-12900H, NVIDIA GeForce RTX 3080 Laptop GPU
90.2 (59.5min, 71.5P0.1, 76.8P1) fps -32%
Asus TUF Gaming A14 FA401WV-WB94
AMD Ryzen AI 9 HX 370, NVIDIA GeForce RTX 4060 Laptop GPU
90.1 fps -32%
Acemagic Tank03
Intel Core i9-12900H, NVIDIA GeForce RTX 3080 Laptop GPU
88.4 (32.2min, 37.2P0.1, 70.6P1) fps -33%
Lenovo IdeaPad Pro 5 16IMH G9 RTX 4050
Intel Core Ultra 9 185H, NVIDIA GeForce RTX 4050 Laptop GPU
78.6 fps -41%
GTA V - 1920x1080 Highest Settings possible AA:4xMSAA + FX AF:16x
Lenovo Legion 9 16IRX9, RTX 4090
Intel Core i9-14900HX, NVIDIA GeForce RTX 4090 Laptop GPU
136.2 (0.938min, 111.1P1) fps +22%
Acemagic M2A
Intel Core i9-12900H, NVIDIA GeForce RTX 3080 Laptop GPU
114.6 (4.49min, 83.3P1) fps +3%
Beelink GTI12 Ultra EX Docking Station
Intel Core i9-12900H, NVIDIA GeForce RTX 3070
111.3 (4.01min, 71.4P1) fps
Acemagic Tank03
Intel Core i9-12900H, NVIDIA GeForce RTX 3080 Laptop GPU
111.1 (21.2min, 76.9P1) fps 0%
Asus TUF Gaming A14 FA401WV-WB94
AMD Ryzen AI 9 HX 370, NVIDIA GeForce RTX 4060 Laptop GPU
110.8 (3.47min, 71.4P1) fps 0%
MSI GeForce RTX 3070 Ventus 3X
AMD Ryzen 9 5900X, NVIDIA GeForce RTX 3070
108 (4.47min, 71.4P1) fps -3%
Asus ROG NUC 14-90AS0051
Intel Core Ultra 9 185H, NVIDIA GeForce RTX 4070 Laptop GPU
105.6 (5.88min, 71.4P1) fps -5%
Minisforum G7 PT
AMD Ryzen 9 7945HX, AMD Radeon RX 7600M XT
101.6 (8.59min, 66.7P1) fps -9%
Lenovo IdeaPad Pro 5 16IMH G9 RTX 4050
Intel Core Ultra 9 185H, NVIDIA GeForce RTX 4050 Laptop GPU
98.7 (4.28min, 66.7P1) fps -11%
Final Fantasy XV Benchmark - 1920x1080 High Quality
Lenovo Legion 9 16IRX9, RTX 4090
Intel Core i9-14900HX, NVIDIA GeForce RTX 4090 Laptop GPU
165.1 fps +19%
Beelink GTI12 Ultra EX Docking Station
Intel Core i9-12900H, NVIDIA GeForce RTX 3070
138.7 fps
MSI GeForce RTX 3070 Ventus 3X
AMD Ryzen 9 5900X, NVIDIA GeForce RTX 3070
122 fps -12%
Acemagic Tank03
Intel Core i9-12900H, NVIDIA GeForce RTX 3080 Laptop GPU
107.1 fps -23%
Acemagic M2A
Intel Core i9-12900H, NVIDIA GeForce RTX 3080 Laptop GPU
106.6 fps -23%
Asus TUF Gaming A14 FA401WV-WB94
AMD Ryzen AI 9 HX 370, NVIDIA GeForce RTX 4060 Laptop GPU
100.6 fps -27%
Minisforum G7 PT
AMD Ryzen 9 7945HX, AMD Radeon RX 7600M XT
99.8 fps -28%
Lenovo IdeaPad Pro 5 16IMH G9 RTX 4050
Intel Core Ultra 9 185H, NVIDIA GeForce RTX 4050 Laptop GPU
87.8 fps -37%
Strange Brigade - 1920x1080 ultra AA:ultra AF:16
Lenovo Legion 9 16IRX9, RTX 4090
Intel Core i9-14900HX, NVIDIA GeForce RTX 4090 Laptop GPU
369 (5min, 269P1) fps +51%
Beelink GTI12 Ultra EX Docking Station
Intel Core i9-12900H, NVIDIA GeForce RTX 3070
245 (132.6min, 183P1) fps
MSI GeForce RTX 3070 Ventus 3X
AMD Ryzen 9 5900X, NVIDIA GeForce RTX 3070
222 (106min, 167P1) fps -9%
Asus ROG NUC 14-90AS0051
Intel Core Ultra 9 185H, NVIDIA GeForce RTX 4070 Laptop GPU
207 (49.1min, 154.5P1) fps -16%
Asus TUF Gaming A14 FA401WV-WB94
AMD Ryzen AI 9 HX 370, NVIDIA GeForce RTX 4060 Laptop GPU
193.5 (45.4min, 142.5P1) fps -21%
Minisforum G7 PT
AMD Ryzen 9 7945HX, AMD Radeon RX 7600M XT
191.4 (106.1min, 138.9P1) fps -22%
Acemagic Tank03
Intel Core i9-12900H, NVIDIA GeForce RTX 3080 Laptop GPU
186.1 (120.7min, 141.6P1) fps -24%
Acemagic M2A
Intel Core i9-12900H, NVIDIA GeForce RTX 3080 Laptop GPU
184.6 (126.5min, 139.5P1) fps -25%
Lenovo IdeaPad Pro 5 16IMH G9 RTX 4050
Intel Core Ultra 9 185H, NVIDIA GeForce RTX 4050 Laptop GPU
149.4 (44.5min, 115.4P1) fps -39%
Dota 2 Reborn - 1920x1080 ultra (3/3) best looking
Lenovo Legion 9 16IRX9, RTX 4090
Intel Core i9-14900HX, NVIDIA GeForce RTX 4090 Laptop GPU
164.5 (136min) fps +10%
Minisforum G7 PT
AMD Ryzen 9 7945HX, AMD Radeon RX 7600M XT
158.1 (137.1min) fps +6%
Beelink GTI12 Ultra EX Docking Station
Intel Core i9-12900H, NVIDIA GeForce RTX 3070
149.3 (128.8min) fps
Acemagic M2A
Intel Core i9-12900H, NVIDIA GeForce RTX 3080 Laptop GPU
141.2 (123.4min) fps -5%
Acemagic Tank03
Intel Core i9-12900H, NVIDIA GeForce RTX 3080 Laptop GPU
138.7 (120.5min) fps -7%
Lenovo IdeaPad Pro 5 16IMH G9 RTX 4050
Intel Core Ultra 9 185H, NVIDIA GeForce RTX 4050 Laptop GPU
137.4 (115.6min) fps -8%
MSI GeForce RTX 3070 Ventus 3X
AMD Ryzen 9 5900X, NVIDIA GeForce RTX 3070
136.3 (108.9min) fps -9%
Asus TUF Gaming A14 FA401WV-WB94
AMD Ryzen AI 9 HX 370, NVIDIA GeForce RTX 4060 Laptop GPU
135 (117.6min) fps -10%
Asus ROG NUC 14-90AS0051
Intel Core Ultra 9 185H, NVIDIA GeForce RTX 4070 Laptop GPU
133.9 (116.1min) fps -10%
X-Plane 11.11 - 1920x1080 high (fps_test=3)
Lenovo Legion 9 16IRX9, RTX 4090
Intel Core i9-14900HX, NVIDIA GeForce RTX 4090 Laptop GPU
125.6 fps +40%
Acemagic M2A
Intel Core i9-12900H, NVIDIA GeForce RTX 3080 Laptop GPU
109.3 fps +22%
Acemagic Tank03
Intel Core i9-12900H, NVIDIA GeForce RTX 3080 Laptop GPU
102.3 fps +14%
MSI GeForce RTX 3070 Ventus 3X
AMD Ryzen 9 5900X, NVIDIA GeForce RTX 3070
95.4 fps +7%
Beelink GTI12 Ultra EX Docking Station
Intel Core i9-12900H, NVIDIA GeForce RTX 3070
89.5 fps
Minisforum G7 PT
AMD Ryzen 9 7945HX, AMD Radeon RX 7600M XT
89.2 fps 0%
Lenovo IdeaPad Pro 5 16IMH G9 RTX 4050
Intel Core Ultra 9 185H, NVIDIA GeForce RTX 4050 Laptop GPU
89 fps -1%
Asus ROG NUC 14-90AS0051
Intel Core Ultra 9 185H, NVIDIA GeForce RTX 4070 Laptop GPU
84.8 fps -5%
Asus TUF Gaming A14 FA401WV-WB94
AMD Ryzen AI 9 HX 370, NVIDIA GeForce RTX 4060 Laptop GPU
67.3 fps -25%
Cyberpunk 2077 2.1 Phantom Liberty - 1920x1080 Ultra Preset (FSR off)
Lenovo Legion 9 16IRX9, RTX 4090
Intel Core i9-14900HX, NVIDIA GeForce RTX 4090 Laptop GPU
127 (70.6min) fps +24%
Beelink GTI12 Ultra EX Docking Station
Intel Core i9-12900H, NVIDIA GeForce RTX 3070
102.2 (84.9min) fps
Minisforum G7 PT
AMD Ryzen 9 7945HX, AMD Radeon RX 7600M XT
83 (69.1min) fps -19%
Asus ROG NUC 14-90AS0051
Intel Core Ultra 9 185H, NVIDIA GeForce RTX 4070 Laptop GPU
82.5 (68.1min) fps -19%
Acemagic M2A
Intel Core i9-12900H, NVIDIA GeForce RTX 3080 Laptop GPU
74.8 (62.2min) fps -27%
Acemagic Tank03
Intel Core i9-12900H, NVIDIA GeForce RTX 3080 Laptop GPU
74.4 (42.8min) fps -27%
Asus TUF Gaming A14 FA401WV-WB94
AMD Ryzen AI 9 HX 370, NVIDIA GeForce RTX 4060 Laptop GPU
73.3 (60min) fps -28%
Lenovo IdeaPad Pro 5 16IMH G9 RTX 4050
Intel Core Ultra 9 185H, NVIDIA GeForce RTX 4050 Laptop GPU
59.8 (49.3min) fps -41%
Baldur's Gate 3
1920x1080 High Preset
Beelink GTI12 Ultra EX Docking Station
Intel Core i9-12900H, NVIDIA GeForce RTX 3070
137.1 fps
Average NVIDIA GeForce RTX 3070
  (121.6 - 137.1, n=2)
129.4 fps -6%
Maingear ML-16 MK2
Intel Core Ultra 7 155H, NVIDIA GeForce RTX 4070 Laptop GPU
108.2 fps -21%
Asus ROG NUC 14-90AS0051
Intel Core Ultra 9 185H, NVIDIA GeForce RTX 4070 Laptop GPU
107.8 (34.6min, 48.3P0.1, 71.3P1) fps -21%
Minisforum G7 PT
AMD Ryzen 9 7945HX, AMD Radeon RX 7600M XT
95.7 (61.3min, 62.5P0.1, 83.2P1) fps -30%
Acemagic M2A
Intel Core i9-12900H, NVIDIA GeForce RTX 3080 Laptop GPU
91.6 (71.6min, 76.5P0.1, 79.8P1) fps -33%
Asus TUF Gaming A14 FA401WV-WB94
AMD Ryzen AI 9 HX 370, NVIDIA GeForce RTX 4060 Laptop GPU
91 fps -34%
Acemagic Tank03
Intel Core i9-12900H, NVIDIA GeForce RTX 3080 Laptop GPU
90.2 (36.3min, 42.7P0.1, 74.5P1) fps -34%
Lenovo IdeaPad Pro 5 16IMH G9 RTX 4050
Intel Core Ultra 9 185H, NVIDIA GeForce RTX 4050 Laptop GPU
81.3 fps -41%
1920x1080 Ultra Preset
Beelink GTI12 Ultra EX Docking Station
Intel Core i9-12900H, NVIDIA GeForce RTX 3070
132.9 fps
Average NVIDIA GeForce RTX 3070
  (120.8 - 132.9, n=2)
126.9 fps -5%
Maingear ML-16 MK2
Intel Core Ultra 7 155H, NVIDIA GeForce RTX 4070 Laptop GPU
106.8 fps -20%
Asus ROG NUC 14-90AS0051
Intel Core Ultra 9 185H, NVIDIA GeForce RTX 4070 Laptop GPU
105 (14min, 38P0.1, 71.4P1) fps -21%
Minisforum G7 PT
AMD Ryzen 9 7945HX, AMD Radeon RX 7600M XT
92.9 (59.8min, 61.3P0.1, 80.3P1) fps -30%
Acemagic M2A
Intel Core i9-12900H, NVIDIA GeForce RTX 3080 Laptop GPU
90.2 (59.5min, 71.5P0.1, 76.8P1) fps -32%
Asus TUF Gaming A14 FA401WV-WB94
AMD Ryzen AI 9 HX 370, NVIDIA GeForce RTX 4060 Laptop GPU
90.1 fps -32%
Acemagic Tank03
Intel Core i9-12900H, NVIDIA GeForce RTX 3080 Laptop GPU
88.4 (32.2min, 37.2P0.1, 70.6P1) fps -33%
Lenovo IdeaPad Pro 5 16IMH G9 RTX 4050
Intel Core Ultra 9 185H, NVIDIA GeForce RTX 4050 Laptop GPU
78.6 fps -41%
2560x1440 Ultra Preset
Beelink GTI12 Ultra EX Docking Station
Intel Core i9-12900H, NVIDIA GeForce RTX 3070
93.5 fps
Average NVIDIA GeForce RTX 3070
  (82.3 - 93.5, n=2)
87.9 fps -6%
Asus ROG NUC 14-90AS0051
Intel Core Ultra 9 185H, NVIDIA GeForce RTX 4070 Laptop GPU
73.7 (7.13min, 33.4P0.1, 51.1P1) fps -21%
Maingear ML-16 MK2
Intel Core Ultra 7 155H, NVIDIA GeForce RTX 4070 Laptop GPU
70.6 fps -24%
Minisforum G7 PT
AMD Ryzen 9 7945HX, AMD Radeon RX 7600M XT
63.8 (46.2min, 46.7P0.1, 56.7P1) fps -32%
Acemagic M2A
Intel Core i9-12900H, NVIDIA GeForce RTX 3080 Laptop GPU
63 (42.8min, 46.3P0.1, 54.3P1) fps -33%
Asus TUF Gaming A14 FA401WV-WB94
AMD Ryzen AI 9 HX 370, NVIDIA GeForce RTX 4060 Laptop GPU
61.1 fps -35%
Acemagic Tank03
Intel Core i9-12900H, NVIDIA GeForce RTX 3080 Laptop GPU
59.7 (26.2min, 31.4P0.1, 46.7P1) fps -36%
3840x2160 Ultra Preset
Beelink GTI12 Ultra EX Docking Station
Intel Core i9-12900H, NVIDIA GeForce RTX 3070
49.7 fps
Average NVIDIA GeForce RTX 3070
  (44.6 - 49.7, n=2)
47.2 fps -5%
Asus ROG NUC 14-90AS0051
Intel Core Ultra 9 185H, NVIDIA GeForce RTX 4070 Laptop GPU
38.7 (13.6min, 19.7P0.1, 28.6P1) fps -22%
Acemagic M2A
Intel Core i9-12900H, NVIDIA GeForce RTX 3080 Laptop GPU
33.8 (27.1min, 27.8P0.1, 28.2P1) fps -32%
Minisforum G7 PT
AMD Ryzen 9 7945HX, AMD Radeon RX 7600M XT
32.2 (27.5min, 27.8P0.1, 28.4P1) fps -35%
Acemagic Tank03
Intel Core i9-12900H, NVIDIA GeForce RTX 3080 Laptop GPU
32 (25.4min, 26.5P0.1, 27.6P1) fps -36%
GTA V
1920x1080 High/On (Advanced Graphics Off) AA:2xMSAA + FX AF:8x
Minisforum G7 PT
AMD Ryzen 9 7945HX, AMD Radeon RX 7600M XT
184.9 (3.43min, 142.9P1) fps +5%
Lenovo Legion 9 16IRX9, RTX 4090
Intel Core i9-14900HX, NVIDIA GeForce RTX 4090 Laptop GPU
183.3 (2.24min, 125P1) fps +4%
Beelink GTI12 Ultra EX Docking Station
Intel Core i9-12900H, NVIDIA GeForce RTX 3070
176.5 (3.17min, 111.1P1) fps
Maingear ML-16 MK2
Intel Core Ultra 7 155H, NVIDIA GeForce RTX 4070 Laptop GPU
175 (2.95min, 111.1P1) fps -1%
Acemagic M2A
Intel Core i9-12900H, NVIDIA GeForce RTX 3080 Laptop GPU
174.7 (3.63min, 125P1) fps -1%
Acemagic Tank03
Intel Core i9-12900H, NVIDIA GeForce RTX 3080 Laptop GPU
172.2 (4.06min, 111.1P1) fps -2%
MSI GeForce RTX 3070 Ventus 3X
AMD Ryzen 9 5900X, NVIDIA GeForce RTX 3070
170 (3.14min, 100P1) fps -4%
Asus TUF Gaming A14 FA401WV-WB94
AMD Ryzen AI 9 HX 370, NVIDIA GeForce RTX 4060 Laptop GPU
168.6 (3.88min, 100P1) fps -4%
Average NVIDIA GeForce RTX 3070
  (157 - 177.7, n=5)
168.4 fps -5%
Asus ROG NUC 14-90AS0051
Intel Core Ultra 9 185H, NVIDIA GeForce RTX 4070 Laptop GPU
167 (3.83min, 100P1) fps -5%
Lenovo IdeaPad Pro 5 16IMH G9 RTX 4050
Intel Core Ultra 9 185H, NVIDIA GeForce RTX 4050 Laptop GPU
166.9 (3.32min, 111.1P1) fps -5%
1920x1080 Highest Settings possible AA:4xMSAA + FX AF:16x
Lenovo Legion 9 16IRX9, RTX 4090
Intel Core i9-14900HX, NVIDIA GeForce RTX 4090 Laptop GPU
136.2 (0.938min, 111.1P1) fps +22%
Maingear ML-16 MK2
Intel Core Ultra 7 155H, NVIDIA GeForce RTX 4070 Laptop GPU
115.1 (3.8min, 71.4P1) fps +3%
Acemagic M2A
Intel Core i9-12900H, NVIDIA GeForce RTX 3080 Laptop GPU
114.6 (4.49min, 83.3P1) fps +3%
Beelink GTI12 Ultra EX Docking Station
Intel Core i9-12900H, NVIDIA GeForce RTX 3070
111.3 (4.01min, 71.4P1) fps
Acemagic Tank03
Intel Core i9-12900H, NVIDIA GeForce RTX 3080 Laptop GPU
111.1 (21.2min, 76.9P1) fps 0%
Asus TUF Gaming A14 FA401WV-WB94
AMD Ryzen AI 9 HX 370, NVIDIA GeForce RTX 4060 Laptop GPU
110.8 (3.47min, 71.4P1) fps 0%
MSI GeForce RTX 3070 Ventus 3X
AMD Ryzen 9 5900X, NVIDIA GeForce RTX 3070
108 (4.47min, 71.4P1) fps -3%
Average NVIDIA GeForce RTX 3070
  (91.1 - 122.4, n=5)
105.7 fps -5%
Asus ROG NUC 14-90AS0051
Intel Core Ultra 9 185H, NVIDIA GeForce RTX 4070 Laptop GPU
105.6 (5.88min, 71.4P1) fps -5%
Minisforum G7 PT
AMD Ryzen 9 7945HX, AMD Radeon RX 7600M XT
101.6 (8.59min, 66.7P1) fps -9%
Lenovo IdeaPad Pro 5 16IMH G9 RTX 4050
Intel Core Ultra 9 185H, NVIDIA GeForce RTX 4050 Laptop GPU
98.7 (4.28min, 66.7P1) fps -11%
2560x1440 Highest Settings possible AA:4xMSAA + FX AF:16x
Lenovo Legion 9 16IRX9, RTX 4090
Intel Core i9-14900HX, NVIDIA GeForce RTX 4090 Laptop GPU
138.9 (0.96min, 100P1) fps +28%
Beelink GTI12 Ultra EX Docking Station
Intel Core i9-12900H, NVIDIA GeForce RTX 3070
108.8 (4.36min, 66.7P1) fps
Average NVIDIA GeForce RTX 3070
  (86.5 - 113.1, n=5)
99.7 fps -8%
MSI GeForce RTX 3070 Ventus 3X
AMD Ryzen 9 5900X, NVIDIA GeForce RTX 3070
98.3 (6.76min, 62.5P1) fps -10%
Acemagic M2A
Intel Core i9-12900H, NVIDIA GeForce RTX 3080 Laptop GPU
98.2 (17.3min, 66.7P1) fps -10%
Acemagic Tank03
Intel Core i9-12900H, NVIDIA GeForce RTX 3080 Laptop GPU
96.3 (19.4min, 66.7P1) fps -11%
Maingear ML-16 MK2
Intel Core Ultra 7 155H, NVIDIA GeForce RTX 4070 Laptop GPU
90.6 (4.99min, 55.6P1) fps -17%
Asus ROG NUC 14-90AS0051
Intel Core Ultra 9 185H, NVIDIA GeForce RTX 4070 Laptop GPU
88.3 (15.3min, 55.6P1) fps -19%
Asus TUF Gaming A14 FA401WV-WB94
AMD Ryzen AI 9 HX 370, NVIDIA GeForce RTX 4060 Laptop GPU
85.4 (4.49min, 55.6P1) fps -22%
Minisforum G7 PT
AMD Ryzen 9 7945HX, AMD Radeon RX 7600M XT
71.7 (11.5min, 50P1) fps -34%
3840x2160 High/On (Advanced Graphics Off) AA:FX AF:8x
Beelink GTI12 Ultra EX Docking Station
Intel Core i9-12900H, NVIDIA GeForce RTX 3070
129 (4.65min, 90.9P1) fps
Average NVIDIA GeForce RTX 3070
  (110 - 129, n=5)
118.8 fps -8%
MSI GeForce RTX 3070 Ventus 3X
AMD Ryzen 9 5900X, NVIDIA GeForce RTX 3070
117 (9.24min, 76.9P1) fps -9%
Acemagic Tank03
Intel Core i9-12900H, NVIDIA GeForce RTX 3080 Laptop GPU
98.2 (28.3min, 71.4P1) fps -24%
Acemagic M2A
Intel Core i9-12900H, NVIDIA GeForce RTX 3080 Laptop GPU
98 (28.9min, 66.7P1) fps -24%
Lenovo Legion 9 16IRX9, RTX 4090
Intel Core i9-14900HX, NVIDIA GeForce RTX 4090 Laptop GPU
95 (0.921min, 90.9P1) fps -26%
Asus ROG NUC 14-90AS0051
Intel Core Ultra 9 185H, NVIDIA GeForce RTX 4070 Laptop GPU
90.4 (8.8min, 62.5P1) fps -30%
Minisforum G7 PT
AMD Ryzen 9 7945HX, AMD Radeon RX 7600M XT
77 (13.3min, 55.6P1) fps -40%
3840x2160 Highest Settings possible AA:4xMSAA + FX AF:16x
Lenovo Legion 9 16IRX9, RTX 4090
Intel Core i9-14900HX, NVIDIA GeForce RTX 4090 Laptop GPU
82.7 (0.919min, 55.6P1) fps +27%
Beelink GTI12 Ultra EX Docking Station
Intel Core i9-12900H, NVIDIA GeForce RTX 3070
65.2 (4.21min, 45.5P1) fps
Average NVIDIA GeForce RTX 3070
  (57.3 - 65.2, n=5)
60.3 fps -8%
MSI GeForce RTX 3070 Ventus 3X
AMD Ryzen 9 5900X, NVIDIA GeForce RTX 3070
58.7 (4.61min, 40P1) fps -10%
Acemagic Tank03
Intel Core i9-12900H, NVIDIA GeForce RTX 3080 Laptop GPU
52.7 (10.7min, 38.5P1) fps -19%
Acemagic M2A
Intel Core i9-12900H, NVIDIA GeForce RTX 3080 Laptop GPU
52.3 (30.9min, 37P1) fps -20%
Asus ROG NUC 14-90AS0051
Intel Core Ultra 9 185H, NVIDIA GeForce RTX 4070 Laptop GPU
40.6 (4.57min, 27.8P1) fps -38%
Minisforum G7 PT
AMD Ryzen 9 7945HX, AMD Radeon RX 7600M XT
32.4 (1.948min, 23.8P1) fps -50%
Dota 2 Reborn
1920x1080 ultra (3/3) best looking
Lenovo Legion 9 16IRX9, RTX 4090
Intel Core i9-14900HX, NVIDIA GeForce RTX 4090 Laptop GPU
164.5 (136min) fps +10%
Minisforum G7 PT
AMD Ryzen 9 7945HX, AMD Radeon RX 7600M XT
158.1 (137.1min) fps +6%
Beelink GTI12 Ultra EX Docking Station
Intel Core i9-12900H, NVIDIA GeForce RTX 3070
149.3 (128.8min) fps
Acemagic M2A
Intel Core i9-12900H, NVIDIA GeForce RTX 3080 Laptop GPU
141.2 (123.4min) fps -5%
Maingear ML-16 MK2
Intel Core Ultra 7 155H, NVIDIA GeForce RTX 4070 Laptop GPU
139.2 (117.8min) fps -7%
Acemagic Tank03
Intel Core i9-12900H, NVIDIA GeForce RTX 3080 Laptop GPU
138.7 (120.5min) fps -7%
Lenovo IdeaPad Pro 5 16IMH G9 RTX 4050
Intel Core Ultra 9 185H, NVIDIA GeForce RTX 4050 Laptop GPU
137.4 (115.6min) fps -8%
MSI GeForce RTX 3070 Ventus 3X
AMD Ryzen 9 5900X, NVIDIA GeForce RTX 3070
136.3 (108.9min) fps -9%
Asus TUF Gaming A14 FA401WV-WB94
AMD Ryzen AI 9 HX 370, NVIDIA GeForce RTX 4060 Laptop GPU
135 (117.6min) fps -10%
Asus ROG NUC 14-90AS0051
Intel Core Ultra 9 185H, NVIDIA GeForce RTX 4070 Laptop GPU
133.9 (116.1min) fps -10%
Average NVIDIA GeForce RTX 3070
  (92.1 - 149.3, n=7)
123.5 fps -17%
3840x2160 ultra (3/3) best looking
Lenovo Legion 9 16IRX9, RTX 4090
Intel Core i9-14900HX, NVIDIA GeForce RTX 4090 Laptop GPU
160.8 (130.4min) fps +11%
Beelink GTI12 Ultra EX Docking Station
Intel Core i9-12900H, NVIDIA GeForce RTX 3070
144.3 (123min) fps
Asus ROG NUC 14-90AS0051
Intel Core Ultra 9 185H, NVIDIA GeForce RTX 4070 Laptop GPU
133.5 (106.1min) fps -7%
Average NVIDIA GeForce RTX 3070
  (122.7 - 144.3, n=5)
129.3 fps -10%
MSI GeForce RTX 3070 Ventus 3X
AMD Ryzen 9 5900X, NVIDIA GeForce RTX 3070
128.5 (102.9min) fps -11%
Acemagic M2A
Intel Core i9-12900H, NVIDIA GeForce RTX 3080 Laptop GPU
120.4 (104.7min) fps -17%
Acemagic Tank03
Intel Core i9-12900H, NVIDIA GeForce RTX 3080 Laptop GPU
117.1 (101.8min) fps -19%
Minisforum G7 PT
AMD Ryzen 9 7945HX, AMD Radeon RX 7600M XT
102.1 (91.9min) fps -29%
Final Fantasy XV Benchmark
1920x1080 High Quality
Lenovo Legion 9 16IRX9, RTX 4090
Intel Core i9-14900HX, NVIDIA GeForce RTX 4090 Laptop GPU
165.1 fps +19%
Beelink GTI12 Ultra EX Docking Station
Intel Core i9-12900H, NVIDIA GeForce RTX 3070
138.7 fps
Average NVIDIA GeForce RTX 3070
  (112 - 138.7, n=5)
123.5 fps -11%
MSI GeForce RTX 3070 Ventus 3X
AMD Ryzen 9 5900X, NVIDIA GeForce RTX 3070
122 fps -12%
Maingear ML-16 MK2
Intel Core Ultra 7 155H, NVIDIA GeForce RTX 4070 Laptop GPU
110.6 fps -20%
Acemagic Tank03
Intel Core i9-12900H, NVIDIA GeForce RTX 3080 Laptop GPU
107.1 fps -23%
Acemagic M2A
Intel Core i9-12900H, NVIDIA GeForce RTX 3080 Laptop GPU
106.6 fps -23%
Asus TUF Gaming A14 FA401WV-WB94
AMD Ryzen AI 9 HX 370, NVIDIA GeForce RTX 4060 Laptop GPU
100.6 fps -27%
Minisforum G7 PT
AMD Ryzen 9 7945HX, AMD Radeon RX 7600M XT
99.8 fps -28%
Lenovo IdeaPad Pro 5 16IMH G9 RTX 4050
Intel Core Ultra 9 185H, NVIDIA GeForce RTX 4050 Laptop GPU
87.8 fps -37%
2560x1440 High Quality
Lenovo Legion 9 16IRX9, RTX 4090
Intel Core i9-14900HX, NVIDIA GeForce RTX 4090 Laptop GPU
142 fps +35%
Beelink GTI12 Ultra EX Docking Station
Intel Core i9-12900H, NVIDIA GeForce RTX 3070
104.9 fps
Average NVIDIA GeForce RTX 3070
  (89.2 - 104.9, n=5)
96.3 fps -8%
MSI GeForce RTX 3070 Ventus 3X
AMD Ryzen 9 5900X, NVIDIA GeForce RTX 3070
94.1 fps -10%
Maingear ML-16 MK2
Intel Core Ultra 7 155H, NVIDIA GeForce RTX 4070 Laptop GPU
80 fps -24%
Acemagic Tank03
Intel Core i9-12900H, NVIDIA GeForce RTX 3080 Laptop GPU
79.7 fps -24%
Acemagic M2A
Intel Core i9-12900H, NVIDIA GeForce RTX 3080 Laptop GPU
79.2 fps -24%
Asus TUF Gaming A14 FA401WV-WB94
AMD Ryzen AI 9 HX 370, NVIDIA GeForce RTX 4060 Laptop GPU
74.5 fps -29%
Minisforum G7 PT
AMD Ryzen 9 7945HX, AMD Radeon RX 7600M XT
71.2 fps -32%
3840x2160 High Quality
Beelink GTI12 Ultra EX Docking Station
Intel Core i9-12900H, NVIDIA GeForce RTX 3070
61.5 fps
Average NVIDIA GeForce RTX 3070
  (54.8 - 61.5, n=5)
57.8 fps -6%
MSI GeForce RTX 3070 Ventus 3X
AMD Ryzen 9 5900X, NVIDIA GeForce RTX 3070
57.6 fps -6%
Acemagic M2A
Intel Core i9-12900H, NVIDIA GeForce RTX 3080 Laptop GPU
45.2 fps -27%
Acemagic Tank03
Intel Core i9-12900H, NVIDIA GeForce RTX 3080 Laptop GPU
45 fps -27%
Minisforum G7 PT
AMD Ryzen 9 7945HX, AMD Radeon RX 7600M XT
38.4 fps -38%
X-Plane 11.11
1920x1080 med (fps_test=2)
Lenovo Legion 9 16IRX9, RTX 4090
Intel Core i9-14900HX, NVIDIA GeForce RTX 4090 Laptop GPU
166.3 fps +57%
Acemagic M2A
Intel Core i9-12900H, NVIDIA GeForce RTX 3080 Laptop GPU
129.6 fps +22%
Acemagic Tank03
Intel Core i9-12900H, NVIDIA GeForce RTX 3080 Laptop GPU
128.9 fps +21%
Maingear ML-16 MK2
Intel Core Ultra 7 155H, NVIDIA GeForce RTX 4070 Laptop GPU
124.4 fps +17%
MSI GeForce RTX 3070 Ventus 3X
AMD Ryzen 9 5900X, NVIDIA GeForce RTX 3070
123 fps +16%
Lenovo IdeaPad Pro 5 16IMH G9 RTX 4050
Intel Core Ultra 9 185H, NVIDIA GeForce RTX 4050 Laptop GPU
114.1 fps +8%
Asus ROG NUC 14-90AS0051
Intel Core Ultra 9 185H, NVIDIA GeForce RTX 4070 Laptop GPU
112.6 fps +6%
Minisforum G7 PT
AMD Ryzen 9 7945HX, AMD Radeon RX 7600M XT
112.5 fps +6%
Average NVIDIA GeForce RTX 3070
  (55.4 - 137.4, n=7)
107.8 fps +2%
Beelink GTI12 Ultra EX Docking Station
Intel Core i9-12900H, NVIDIA GeForce RTX 3070
106.1 fps
Asus TUF Gaming A14 FA401WV-WB94
AMD Ryzen AI 9 HX 370, NVIDIA GeForce RTX 4060 Laptop GPU
81.8 fps -23%
1920x1080 high (fps_test=3)
Lenovo Legion 9 16IRX9, RTX 4090
Intel Core i9-14900HX, NVIDIA GeForce RTX 4090 Laptop GPU
125.6 fps +40%
Acemagic M2A
Intel Core i9-12900H, NVIDIA GeForce RTX 3080 Laptop GPU
109.3 fps +22%
Acemagic Tank03
Intel Core i9-12900H, NVIDIA GeForce RTX 3080 Laptop GPU
102.3 fps +14%
MSI GeForce RTX 3070 Ventus 3X
AMD Ryzen 9 5900X, NVIDIA GeForce RTX 3070
95.4 fps +7%
Maingear ML-16 MK2
Intel Core Ultra 7 155H, NVIDIA GeForce RTX 4070 Laptop GPU
89.8 fps 0%
Beelink GTI12 Ultra EX Docking Station
Intel Core i9-12900H, NVIDIA GeForce RTX 3070
89.5 fps
Minisforum G7 PT
AMD Ryzen 9 7945HX, AMD Radeon RX 7600M XT
89.2 fps 0%
Average NVIDIA GeForce RTX 3070
  (53.7 - 111.3, n=7)
89.2 fps 0%
Lenovo IdeaPad Pro 5 16IMH G9 RTX 4050
Intel Core Ultra 9 185H, NVIDIA GeForce RTX 4050 Laptop GPU
89 fps -1%
Asus ROG NUC 14-90AS0051
Intel Core Ultra 9 185H, NVIDIA GeForce RTX 4070 Laptop GPU
84.8 fps -5%
Asus TUF Gaming A14 FA401WV-WB94
AMD Ryzen AI 9 HX 370, NVIDIA GeForce RTX 4060 Laptop GPU
67.3 fps -25%
3840x2160 high (fps_test=3)
Lenovo Legion 9 16IRX9, RTX 4090
Intel Core i9-14900HX, NVIDIA GeForce RTX 4090 Laptop GPU
109.6 fps +38%
Acemagic M2A
Intel Core i9-12900H, NVIDIA GeForce RTX 3080 Laptop GPU
88.6 fps +12%
Acemagic Tank03
Intel Core i9-12900H, NVIDIA GeForce RTX 3080 Laptop GPU
88 fps +11%
Average NVIDIA GeForce RTX 3070
  (78.8 - 98.4, n=5)
84.4 fps +6%
MSI GeForce RTX 3070 Ventus 3X
AMD Ryzen 9 5900X, NVIDIA GeForce RTX 3070
84.3 fps +6%
Beelink GTI12 Ultra EX Docking Station
Intel Core i9-12900H, NVIDIA GeForce RTX 3070
79.4 fps
Asus ROG NUC 14-90AS0051
Intel Core Ultra 9 185H, NVIDIA GeForce RTX 4070 Laptop GPU
73 fps -8%
Minisforum G7 PT
AMD Ryzen 9 7945HX, AMD Radeon RX 7600M XT
58.4 fps -26%
Far Cry 5
1920x1080 High Preset AA:T
Lenovo Legion 9 16IRX9, RTX 4090
Intel Core i9-14900HX, NVIDIA GeForce RTX 4090 Laptop GPU
166 fps +12%
MSI GeForce RTX 3070 Ventus 3X
AMD Ryzen 9 5900X, NVIDIA GeForce RTX 3070
154 (124min) fps +4%
Minisforum G7 PT
AMD Ryzen 9 7945HX, AMD Radeon RX 7600M XT
151 (124min) fps +2%
Beelink GTI12 Ultra EX Docking Station
Intel Core i9-12900H, NVIDIA GeForce RTX 3070
148 (117min) fps
Average NVIDIA GeForce RTX 3070
  (126 - 154, n=5)
142.4 fps -4%
Acemagic M2A
Intel Core i9-12900H, NVIDIA GeForce RTX 3080 Laptop GPU
137 (111min) fps -7%
Acemagic Tank03
Intel Core i9-12900H, NVIDIA GeForce RTX 3080 Laptop GPU
135 (109min) fps -9%
Maingear ML-16 MK2
Intel Core Ultra 7 155H, NVIDIA GeForce RTX 4070 Laptop GPU
125 (95min) fps -16%
Asus ROG NUC 14-90AS0051
Intel Core Ultra 9 185H, NVIDIA GeForce RTX 4070 Laptop GPU
124 (95min) fps -16%
Asus TUF Gaming A14 FA401WV-WB94
AMD Ryzen AI 9 HX 370, NVIDIA GeForce RTX 4060 Laptop GPU
121 (91min) fps -18%
Lenovo IdeaPad Pro 5 16IMH G9 RTX 4050
Intel Core Ultra 9 185H, NVIDIA GeForce RTX 4050 Laptop GPU
120 (96min) fps -19%
1920x1080 Ultra Preset AA:T
Lenovo Legion 9 16IRX9, RTX 4090
Intel Core i9-14900HX, NVIDIA GeForce RTX 4090 Laptop GPU
155 fps +9%
MSI GeForce RTX 3070 Ventus 3X
AMD Ryzen 9 5900X, NVIDIA GeForce RTX 3070
143 (108min) fps +1%
Beelink GTI12 Ultra EX Docking Station
Intel Core i9-12900H, NVIDIA GeForce RTX 3070
142 (106min) fps
Minisforum G7 PT
AMD Ryzen 9 7945HX, AMD Radeon RX 7600M XT
140 (111min) fps -1%
Average NVIDIA GeForce RTX 3070
  (117 - 143, n=5)
134 fps -6%
Acemagic M2A
Intel Core i9-12900H, NVIDIA GeForce RTX 3080 Laptop GPU
129 (100min) fps -9%
Acemagic Tank03
Intel Core i9-12900H, NVIDIA GeForce RTX 3080 Laptop GPU
126 (97min) fps -11%
Asus ROG NUC 14-90AS0051
Intel Core Ultra 9 185H, NVIDIA GeForce RTX 4070 Laptop GPU
114 (88min) fps -20%
Asus TUF Gaming A14 FA401WV-WB94
AMD Ryzen AI 9 HX 370, NVIDIA GeForce RTX 4060 Laptop GPU
114 (78min) fps -20%
Maingear ML-16 MK2
Intel Core Ultra 7 155H, NVIDIA GeForce RTX 4070 Laptop GPU
114 (87min) fps -20%
Lenovo IdeaPad Pro 5 16IMH G9 RTX 4050
Intel Core Ultra 9 185H, NVIDIA GeForce RTX 4050 Laptop GPU
113 (86min) fps -20%
2560x1440 Ultra Preset AA:T
Lenovo Legion 9 16IRX9, RTX 4090
Intel Core i9-14900HX, NVIDIA GeForce RTX 4090 Laptop GPU
146 fps +12%
Beelink GTI12 Ultra EX Docking Station
Intel Core i9-12900H, NVIDIA GeForce RTX 3070
130 (110min) fps
MSI GeForce RTX 3070 Ventus 3X
AMD Ryzen 9 5900X, NVIDIA GeForce RTX 3070
125 (105min) fps -4%
Average NVIDIA GeForce RTX 3070
  (112 - 130, n=5)
121 fps -7%
Asus ROG NUC 14-90AS0051
Intel Core Ultra 9 185H, NVIDIA GeForce RTX 4070 Laptop GPU
111 (90min) fps -15%
Minisforum G7 PT
AMD Ryzen 9 7945HX, AMD Radeon RX 7600M XT
108 (94min) fps -17%
Acemagic Tank03
Intel Core i9-12900H, NVIDIA GeForce RTX 3080 Laptop GPU
104 (94min) fps -20%
Acemagic M2A
Intel Core i9-12900H, NVIDIA GeForce RTX 3080 Laptop GPU
104 (95min) fps -20%
Maingear ML-16 MK2
Intel Core Ultra 7 155H, NVIDIA GeForce RTX 4070 Laptop GPU
101 (82min) fps -22%
Asus TUF Gaming A14 FA401WV-WB94
AMD Ryzen AI 9 HX 370, NVIDIA GeForce RTX 4060 Laptop GPU
93 (77min) fps -28%
3840x2160 Ultra Preset AA:T
Lenovo Legion 9 16IRX9, RTX 4090
Intel Core i9-14900HX, NVIDIA GeForce RTX 4090 Laptop GPU
104 fps +39%
Beelink GTI12 Ultra EX Docking Station
Intel Core i9-12900H, NVIDIA GeForce RTX 3070
75 (68min) fps
Average NVIDIA GeForce RTX 3070
  (69 - 75, n=5)
71.2 fps -5%
MSI GeForce RTX 3070 Ventus 3X
AMD Ryzen 9 5900X, NVIDIA GeForce RTX 3070
70 (63min) fps -7%
Asus ROG NUC 14-90AS0051
Intel Core Ultra 9 185H, NVIDIA GeForce RTX 4070 Laptop GPU
59 (53min) fps -21%
Acemagic M2A
Intel Core i9-12900H, NVIDIA GeForce RTX 3080 Laptop GPU
55 (49min) fps -27%
Acemagic Tank03
Intel Core i9-12900H, NVIDIA GeForce RTX 3080 Laptop GPU
54 (49min) fps -28%
Minisforum G7 PT
AMD Ryzen 9 7945HX, AMD Radeon RX 7600M XT
54 (46min) fps -28%
Strange Brigade
1920x1080 high AA:high AF:8
Lenovo Legion 9 16IRX9, RTX 4090
Intel Core i9-14900HX, NVIDIA GeForce RTX 4090 Laptop GPU
387 (5min, 302P1) fps +38%
Beelink GTI12 Ultra EX Docking Station
Intel Core i9-12900H, NVIDIA GeForce RTX 3070
280 (147.8min, 207P1) fps
Average NVIDIA GeForce RTX 3070
  (251 - 280, n=5)
262 fps -6%
MSI GeForce RTX 3070 Ventus 3X
AMD Ryzen 9 5900X, NVIDIA GeForce RTX 3070
251 (118min, 188P1) fps -10%
Asus ROG NUC 14-90AS0051
Intel Core Ultra 9 185H, NVIDIA GeForce RTX 4070 Laptop GPU
244 (76.1min, 178.7P1) fps -13%
Maingear ML-16 MK2
Intel Core Ultra 7 155H, NVIDIA GeForce RTX 4070 Laptop GPU
224 (160.9min, 169.3P1) fps -20%
Minisforum G7 PT
AMD Ryzen 9 7945HX, AMD Radeon RX 7600M XT
222 (139.8min, 160.9P1) fps -21%
Asus TUF Gaming A14 FA401WV-WB94
AMD Ryzen AI 9 HX 370, NVIDIA GeForce RTX 4060 Laptop GPU
222 (103.9min, 154P1) fps -21%
Acemagic Tank03
Intel Core i9-12900H, NVIDIA GeForce RTX 3080 Laptop GPU
213 (87.7min, 159.3P1) fps -24%
Acemagic M2A
Intel Core i9-12900H, NVIDIA GeForce RTX 3080 Laptop GPU
212 (146.5min, 158.2P1) fps -24%
Lenovo IdeaPad Pro 5 16IMH G9 RTX 4050
Intel Core Ultra 9 185H, NVIDIA GeForce RTX 4050 Laptop GPU
172.9 (26.9min, 134.6P1) fps -38%
1920x1080 ultra AA:ultra AF:16
Lenovo Legion 9 16IRX9, RTX 4090
Intel Core i9-14900HX, NVIDIA GeForce RTX 4090 Laptop GPU
369 (5min, 269P1) fps +51%
Beelink GTI12 Ultra EX Docking Station
Intel Core i9-12900H, NVIDIA GeForce RTX 3070
245 (132.6min, 183P1) fps
Average NVIDIA GeForce RTX 3070
  (222 - 245, n=5)
229 fps -7%
MSI GeForce RTX 3070 Ventus 3X
AMD Ryzen 9 5900X, NVIDIA GeForce RTX 3070
222 (106min, 167P1) fps -9%
Asus ROG NUC 14-90AS0051
Intel Core Ultra 9 185H, NVIDIA GeForce RTX 4070 Laptop GPU
207 (49.1min, 154.5P1) fps -16%
Asus TUF Gaming A14 FA401WV-WB94
AMD Ryzen AI 9 HX 370, NVIDIA GeForce RTX 4060 Laptop GPU
193.5 (45.4min, 142.5P1) fps -21%
Maingear ML-16 MK2
Intel Core Ultra 7 155H, NVIDIA GeForce RTX 4070 Laptop GPU
192.8 (84.3min, 146.7P1) fps -21%
Minisforum G7 PT
AMD Ryzen 9 7945HX, AMD Radeon RX 7600M XT
191.4 (106.1min, 138.9P1) fps -22%
Acemagic Tank03
Intel Core i9-12900H, NVIDIA GeForce RTX 3080 Laptop GPU
186.1 (120.7min, 141.6P1) fps -24%
Acemagic M2A
Intel Core i9-12900H, NVIDIA GeForce RTX 3080 Laptop GPU
184.6 (126.5min, 139.5P1) fps -25%
Lenovo IdeaPad Pro 5 16IMH G9 RTX 4050
Intel Core Ultra 9 185H, NVIDIA GeForce RTX 4050 Laptop GPU
149.4 (44.5min, 115.4P1) fps -39%
2560x1440 ultra AA:ultra AF:16
Lenovo Legion 9 16IRX9, RTX 4090
Intel Core i9-14900HX, NVIDIA GeForce RTX 4090 Laptop GPU
290 (38.6min, 219P1) fps +60%
Beelink GTI12 Ultra EX Docking Station
Intel Core i9-12900H, NVIDIA GeForce RTX 3070
181.1 (118.2min, 146.2P1) fps
Average NVIDIA GeForce RTX 3070
  (165 - 181.1, n=5)
170.3 fps -6%
MSI GeForce RTX 3070 Ventus 3X
AMD Ryzen 9 5900X, NVIDIA GeForce RTX 3070
166 (92.5min, 133P1) fps -8%
Acemagic M2A
Intel Core i9-12900H, NVIDIA GeForce RTX 3080 Laptop GPU
137 (99.5min, 109.8P1) fps -24%
Acemagic Tank03
Intel Core i9-12900H, NVIDIA GeForce RTX 3080 Laptop GPU
136.7 (95.7min, 110.3P1) fps -25%
Asus ROG NUC 14-90AS0051
Intel Core Ultra 9 185H, NVIDIA GeForce RTX 4070 Laptop GPU
136.6 (16.1min, 113P1) fps -25%
Asus TUF Gaming A14 FA401WV-WB94
AMD Ryzen AI 9 HX 370, NVIDIA GeForce RTX 4060 Laptop GPU
130.3 (86.5min, 105.6P1) fps -28%
Maingear ML-16 MK2
Intel Core Ultra 7 155H, NVIDIA GeForce RTX 4070 Laptop GPU
127.9 (103.7min, 105.8P1) fps -29%
Minisforum G7 PT
AMD Ryzen 9 7945HX, AMD Radeon RX 7600M XT
124.4 (36.9min, 100.9P1) fps -31%
3840x2160 ultra AA:ultra AF:16
Beelink GTI12 Ultra EX Docking Station
Intel Core i9-12900H, NVIDIA GeForce RTX 3070
104.6 (24.7min, 91.4P1) fps
Average NVIDIA GeForce RTX 3070
  (96.8 - 104.6, n=5)
99 fps -5%
MSI GeForce RTX 3070 Ventus 3X
AMD Ryzen 9 5900X, NVIDIA GeForce RTX 3070
96.8 (66.9min, 82.6P1) fps -7%
Acemagic Tank03
Intel Core i9-12900H, NVIDIA GeForce RTX 3080 Laptop GPU
80.5 (62.2min, 68.8P1) fps -23%
Acemagic M2A
Intel Core i9-12900H, NVIDIA GeForce RTX 3080 Laptop GPU
80.5 (65.1min, 70.1P1) fps -23%
Asus ROG NUC 14-90AS0051
Intel Core Ultra 9 185H, NVIDIA GeForce RTX 4070 Laptop GPU
71.6 (16.2min, 61P1) fps -32%
Minisforum G7 PT
AMD Ryzen 9 7945HX, AMD Radeon RX 7600M XT
66.6 (28.8min, 58.4P1) fps -36%
Tiny Tina's Wonderlands
1920x1080 High Preset (DX12)
Beelink GTI12 Ultra EX Docking Station
Intel Core i9-12900H, NVIDIA GeForce RTX 3070
154.9 fps
Average NVIDIA GeForce RTX 3070
  (145.8 - 155, n=3)
151.9 fps -2%
Asus ROG NUC 14-90AS0051
Intel Core Ultra 9 185H, NVIDIA GeForce RTX 4070 Laptop GPU
132.6 fps -14%
Minisforum G7 PT
AMD Ryzen 9 7945HX, AMD Radeon RX 7600M XT
123 fps -21%
Maingear ML-16 MK2
Intel Core Ultra 7 155H, NVIDIA GeForce RTX 4070 Laptop GPU
119.4 fps -23%
Acemagic M2A
Intel Core i9-12900H, NVIDIA GeForce RTX 3080 Laptop GPU
114 fps -26%
Acemagic Tank03
Intel Core i9-12900H, NVIDIA GeForce RTX 3080 Laptop GPU
113.2 fps -27%
Asus TUF Gaming A14 FA401WV-WB94
AMD Ryzen AI 9 HX 370, NVIDIA GeForce RTX 4060 Laptop GPU
110.6 fps -29%
Lenovo IdeaPad Pro 5 16IMH G9 RTX 4050
Intel Core Ultra 9 185H, NVIDIA GeForce RTX 4050 Laptop GPU
96 fps -38%
1920x1080 Badass Preset (DX12)
Beelink GTI12 Ultra EX Docking Station
Intel Core i9-12900H, NVIDIA GeForce RTX 3070
122.6 fps
Average NVIDIA GeForce RTX 3070
  (113.9 - 122.6, n=3)
119.2 fps -3%
Asus ROG NUC 14-90AS0051
Intel Core Ultra 9 185H, NVIDIA GeForce RTX 4070 Laptop GPU
102.7 fps -16%
Minisforum G7 PT
AMD Ryzen 9 7945HX, AMD Radeon RX 7600M XT
94.5 fps -23%
Maingear ML-16 MK2
Intel Core Ultra 7 155H, NVIDIA GeForce RTX 4070 Laptop GPU
92.9 fps -24%
Acemagic M2A
Intel Core i9-12900H, NVIDIA GeForce RTX 3080 Laptop GPU
88.8 fps -28%
Acemagic Tank03
Intel Core i9-12900H, NVIDIA GeForce RTX 3080 Laptop GPU
88.3 fps -28%
Asus TUF Gaming A14 FA401WV-WB94
AMD Ryzen AI 9 HX 370, NVIDIA GeForce RTX 4060 Laptop GPU
86.1 fps -30%
Lenovo IdeaPad Pro 5 16IMH G9 RTX 4050
Intel Core Ultra 9 185H, NVIDIA GeForce RTX 4050 Laptop GPU
74 fps -40%
2560x1440 Badass Preset (DX12)
Beelink GTI12 Ultra EX Docking Station
Intel Core i9-12900H, NVIDIA GeForce RTX 3070
87.1 fps
Average NVIDIA GeForce RTX 3070
  (80.7 - 87.1, n=3)
84.3 fps -3%
Asus ROG NUC 14-90AS0051
Intel Core Ultra 9 185H, NVIDIA GeForce RTX 4070 Laptop GPU
71.2 fps -18%
Acemagic Tank03
Intel Core i9-12900H, NVIDIA GeForce RTX 3080 Laptop GPU
62.9 fps -28%
Maingear ML-16 MK2
Intel Core Ultra 7 155H, NVIDIA GeForce RTX 4070 Laptop GPU
62.7 fps -28%
Minisforum G7 PT
AMD Ryzen 9 7945HX, AMD Radeon RX 7600M XT
62.6 fps -28%
Acemagic M2A
Intel Core i9-12900H, NVIDIA GeForce RTX 3080 Laptop GPU
62.5 fps -28%
Asus TUF Gaming A14 FA401WV-WB94
AMD Ryzen AI 9 HX 370, NVIDIA GeForce RTX 4060 Laptop GPU
58.9 fps -32%
3840x2160 Badass Preset (DX12)
Beelink GTI12 Ultra EX Docking Station
Intel Core i9-12900H, NVIDIA GeForce RTX 3070
48.9 fps
Average NVIDIA GeForce RTX 3070
  (44.4 - 48.9, n=3)
46.6 fps -5%
Acemagic Tank03
Intel Core i9-12900H, NVIDIA GeForce RTX 3080 Laptop GPU
34 fps -30%
Acemagic M2A
Intel Core i9-12900H, NVIDIA GeForce RTX 3080 Laptop GPU
33.8 fps -31%
Asus ROG NUC 14-90AS0051
Intel Core Ultra 9 185H, NVIDIA GeForce RTX 4070 Laptop GPU
33.8 fps -31%
Minisforum G7 PT
AMD Ryzen 9 7945HX, AMD Radeon RX 7600M XT
23 fps -53%
F1 22
1920x1080 High Preset AA:T AF:16x
Beelink GTI12 Ultra EX Docking Station
Intel Core i9-12900H, NVIDIA GeForce RTX 3070
264 (208min, 155P1) fps
Average NVIDIA GeForce RTX 3070
  (228 - 264, n=2)
246 fps -7%
Minisforum G7 PT
AMD Ryzen 9 7945HX, AMD Radeon RX 7600M XT
231 (186min, 157P1) fps -12%
Maingear ML-16 MK2
Intel Core Ultra 7 155H, NVIDIA GeForce RTX 4070 Laptop GPU
206 (165min, 130P1) fps -22%
Asus ROG NUC 14-90AS0051
Intel Core Ultra 9 185H, NVIDIA GeForce RTX 4070 Laptop GPU
196.3 (147min, 107P1) fps -26%
Acemagic M2A
Intel Core i9-12900H, NVIDIA GeForce RTX 3080 Laptop GPU
195.5 (162min, 122P1) fps -26%
Acemagic Tank03
Intel Core i9-12900H, NVIDIA GeForce RTX 3080 Laptop GPU
195.4 (166min, 117P1) fps -26%
Asus TUF Gaming A14 FA401WV-WB94
AMD Ryzen AI 9 HX 370, NVIDIA GeForce RTX 4060 Laptop GPU
172.8 (138min, 98P1) fps -35%
Lenovo IdeaPad Pro 5 16IMH G9 RTX 4050
Intel Core Ultra 9 185H, NVIDIA GeForce RTX 4050 Laptop GPU
156.6 (137min, 97P1) fps -41%
1920x1080 Ultra High Preset AA:T AF:16x
Beelink GTI12 Ultra EX Docking Station
Intel Core i9-12900H, NVIDIA GeForce RTX 3070
91.8 (78min, 72P1) fps
Average NVIDIA GeForce RTX 3070
  (81 - 91.8, n=2)
86.4 fps -6%
Asus ROG NUC 14-90AS0051
Intel Core Ultra 9 185H, NVIDIA GeForce RTX 4070 Laptop GPU
77.6 (62min, 58P1) fps -15%
Maingear ML-16 MK2
Intel Core Ultra 7 155H, NVIDIA GeForce RTX 4070 Laptop GPU
69.2 (59min, 58P1) fps -25%
Acemagic Tank03
Intel Core i9-12900H, NVIDIA GeForce RTX 3080 Laptop GPU
65.2 (56min, 53P1) fps -29%
Asus TUF Gaming A14 FA401WV-WB94
AMD Ryzen AI 9 HX 370, NVIDIA GeForce RTX 4060 Laptop GPU
64.6 (50min, 45P1) fps -30%
Acemagic M2A
Intel Core i9-12900H, NVIDIA GeForce RTX 3080 Laptop GPU
64.1 (55min, 52P1) fps -30%
Minisforum G7 PT
AMD Ryzen 9 7945HX, AMD Radeon RX 7600M XT
54.5 (39min, 40P1) fps -41%
Lenovo IdeaPad Pro 5 16IMH G9 RTX 4050
Intel Core Ultra 9 185H, NVIDIA GeForce RTX 4050 Laptop GPU
54.1 (45min, 44P1) fps -41%
2560x1440 Ultra High Preset AA:T AF:16x
Beelink GTI12 Ultra EX Docking Station
Intel Core i9-12900H, NVIDIA GeForce RTX 3070
58.8 (49min, 49P1) fps
Average NVIDIA GeForce RTX 3070
  (52 - 58.8, n=2)
55.4 fps -6%
Asus ROG NUC 14-90AS0051
Intel Core Ultra 9 185H, NVIDIA GeForce RTX 4070 Laptop GPU
50.4 (43min, 42P1) fps -14%
Maingear ML-16 MK2
Intel Core Ultra 7 155H, NVIDIA GeForce RTX 4070 Laptop GPU
42.9 (36min, 35P1) fps -27%
Acemagic Tank03
Intel Core i9-12900H, NVIDIA GeForce RTX 3080 Laptop GPU
42 (36min, 33P1) fps -29%
Asus TUF Gaming A14 FA401WV-WB94
AMD Ryzen AI 9 HX 370, NVIDIA GeForce RTX 4060 Laptop GPU
42 (34min, 34P1) fps -29%
Acemagic M2A
Intel Core i9-12900H, NVIDIA GeForce RTX 3080 Laptop GPU
41.8 (36min, 33P1) fps -29%
Minisforum G7 PT
AMD Ryzen 9 7945HX, AMD Radeon RX 7600M XT
28.8 (16min, 16P1) fps -51%
3840x2160 Ultra High Preset AA:T AF:16x
Beelink GTI12 Ultra EX Docking Station
Intel Core i9-12900H, NVIDIA GeForce RTX 3070
28.8 (24min, 23P1) fps
Average NVIDIA GeForce RTX 3070
  (25 - 28.8, n=2)
26.9 fps -7%
Asus ROG NUC 14-90AS0051
Intel Core Ultra 9 185H, NVIDIA GeForce RTX 4070 Laptop GPU
25 (21min, 20P1) fps -13%
Acemagic Tank03
Intel Core i9-12900H, NVIDIA GeForce RTX 3080 Laptop GPU
20.1 (17min, 16P1) fps -30%
Acemagic M2A
Intel Core i9-12900H, NVIDIA GeForce RTX 3080 Laptop GPU
20 (17min, 16P1) fps -31%
Minisforum G7 PT
AMD Ryzen 9 7945HX, AMD Radeon RX 7600M XT
11.3 (8min, 9P1) fps -61%
Cyberpunk 2077 2.1 Phantom Liberty
1920x1080 High Preset (FSR off)
Average NVIDIA GeForce RTX 3070
  (115.3 - 119, n=2)
117.2 fps +2%
Beelink GTI12 Ultra EX Docking Station
Intel Core i9-12900H, NVIDIA GeForce RTX 3070
115.3 (97.2min) fps
Asus ROG NUC 14-90AS0051
Intel Core Ultra 9 185H, NVIDIA GeForce RTX 4070 Laptop GPU
94.3 (79.6min) fps -18%
Minisforum G7 PT
AMD Ryzen 9 7945HX, AMD Radeon RX 7600M XT
93.3 (79.1min) fps -19%
Maingear ML-16 MK2
Intel Core Ultra 7 155H, NVIDIA GeForce RTX 4070 Laptop GPU
88.1 (75min) fps -24%
Acemagic Tank03
Intel Core i9-12900H, NVIDIA GeForce RTX 3080 Laptop GPU
86.3 (42.4min) fps -25%
Acemagic M2A
Intel Core i9-12900H, NVIDIA GeForce RTX 3080 Laptop GPU
86 (72.9min) fps -25%
Asus TUF Gaming A14 FA401WV-WB94
AMD Ryzen AI 9 HX 370, NVIDIA GeForce RTX 4060 Laptop GPU
85.6 (72.6min) fps -26%
Lenovo IdeaPad Pro 5 16IMH G9 RTX 4050
Intel Core Ultra 9 185H, NVIDIA GeForce RTX 4050 Laptop GPU
69.4 (58.9min) fps -40%
1920x1080 Ultra Preset (FSR off)
Lenovo Legion 9 16IRX9, RTX 4090
Intel Core i9-14900HX, NVIDIA GeForce RTX 4090 Laptop GPU
127 (70.6min) fps +24%
Average NVIDIA GeForce RTX 3070
  (102.2 - 107, n=2)
104.6 fps +2%
Beelink GTI12 Ultra EX Docking Station
Intel Core i9-12900H, NVIDIA GeForce RTX 3070
102.2 (84.9min) fps
Minisforum G7 PT
AMD Ryzen 9 7945HX, AMD Radeon RX 7600M XT
83 (69.1min) fps -19%
Asus ROG NUC 14-90AS0051
Intel Core Ultra 9 185H, NVIDIA GeForce RTX 4070 Laptop GPU
82.5 (68.1min) fps -19%
Maingear ML-16 MK2
Intel Core Ultra 7 155H, NVIDIA GeForce RTX 4070 Laptop GPU
76.4 (63.2min) fps -25%
Acemagic M2A
Intel Core i9-12900H, NVIDIA GeForce RTX 3080 Laptop GPU
74.8 (62.2min) fps -27%
Acemagic Tank03
Intel Core i9-12900H, NVIDIA GeForce RTX 3080 Laptop GPU
74.4 (42.8min) fps -27%
Asus TUF Gaming A14 FA401WV-WB94
AMD Ryzen AI 9 HX 370, NVIDIA GeForce RTX 4060 Laptop GPU
73.3 (60min) fps -28%
Lenovo IdeaPad Pro 5 16IMH G9 RTX 4050
Intel Core Ultra 9 185H, NVIDIA GeForce RTX 4050 Laptop GPU
59.8 (49.3min) fps -41%
2560x1440 Ultra Preset (FSR off)
Lenovo Legion 9 16IRX9, RTX 4090
Intel Core i9-14900HX, NVIDIA GeForce RTX 4090 Laptop GPU
86 (70.4min) fps +31%
Average NVIDIA GeForce RTX 3070
  (65.7 - 71, n=2)
68.4 fps +4%
Beelink GTI12 Ultra EX Docking Station
Intel Core i9-12900H, NVIDIA GeForce RTX 3070
65.7 (56min) fps
Minisforum G7 PT
AMD Ryzen 9 7945HX, AMD Radeon RX 7600M XT
51.3 (44.3min) fps -22%
Asus ROG NUC 14-90AS0051
Intel Core Ultra 9 185H, NVIDIA GeForce RTX 4070 Laptop GPU
49.1 (40.7min) fps -25%
Acemagic M2A
Intel Core i9-12900H, NVIDIA GeForce RTX 3080 Laptop GPU
46.6 (39.7min) fps -29%
Acemagic Tank03
Intel Core i9-12900H, NVIDIA GeForce RTX 3080 Laptop GPU
45.8 (33.4min) fps -30%
Maingear ML-16 MK2
Intel Core Ultra 7 155H, NVIDIA GeForce RTX 4070 Laptop GPU
44.3 (37.2min) fps -33%
Asus TUF Gaming A14 FA401WV-WB94
AMD Ryzen AI 9 HX 370, NVIDIA GeForce RTX 4060 Laptop GPU
43.6 (36.8min) fps -34%
3840x2160 Ultra Preset (FSR off)
Average NVIDIA GeForce RTX 3070
  (29.9 - 34.3, n=2)
32.1 fps +7%
Beelink GTI12 Ultra EX Docking Station
Intel Core i9-12900H, NVIDIA GeForce RTX 3070
29.9 (25min) fps
Asus ROG NUC 14-90AS0051
Intel Core Ultra 9 185H, NVIDIA GeForce RTX 4070 Laptop GPU
21.7 (19.1min) fps -27%
Minisforum G7 PT
AMD Ryzen 9 7945HX, AMD Radeon RX 7600M XT
21 (18.3min) fps -30%
Acemagic Tank03
Intel Core i9-12900H, NVIDIA GeForce RTX 3080 Laptop GPU
20.8 (16.1min) fps -30%
Acemagic M2A
Intel Core i9-12900H, NVIDIA GeForce RTX 3080 Laptop GPU
20.7 (18.3min) fps -31%

Cyberpunk 2077 ultra FPS Chart

05101520253035404550556065707580859095Tooltip
Beelink GTI12 Ultra EX Docking Station i9-12900H, NVIDIA GeForce RTX 3070: Ø94.2 (90.2-95.1)
lowmed.highultraQHD4K
GTA V (2015) 184.3 178.9 176.5 111.3 108.8 129
Dota 2 Reborn (2015) 175.9 162 158.5 149.3 144.3
Final Fantasy XV Benchmark (2018) 209 184.8 138.7 104.9 61.5
X-Plane 11.11 (2018) 118.2 106.1 89.5 79.4
Far Cry 5 (2018) 170 154 148 142 130 75
Strange Brigade (2018) 459 339 280 245 181.1 104.6
Tiny Tina's Wonderlands (2022) 268.9 216.7 154.9 122.6 87.1 48.9
F1 22 (2022) 282 277 264 91.8 58.8 28.8
Baldur's Gate 3 (2023) 174.5 152.6 137.1 132.9 93.5 49.7
Cyberpunk 2077 2.1 Phantom Liberty (2023) 148.5 133.9 115.3 102.2 65.7 29.9

Emisje

Hałas systemowy

Hałas wentylatora jest zawsze obecny, ponieważ wewnętrzny wentylator zasilacza w stacji dokującej EX jest zawsze aktywny, nawet jeśli wentylatory mini PC i GPU są nieaktywne. Poziomy hałasu są ogólnie głośniejsze niż w większości innych mini PC przy tej samej odległości nagrywania wynoszącej 15 cm, ale krzywa hałasu jest szersza i nie tak ostra jak to, do czego jesteśmy przyzwyczajeni. Niższe częstotliwości dB są mniej uciążliwe i bardziej tolerowane niż zwykle ostrzejsze i głośniejsze wentylatory laptopów do gier.

Profil hałasu wentylatora (Biały: Tło, Czerwony: System bezczynny, Niebieski: 3DMark 06, Pomarańczowy: Cyberpunk 2077, Zielony: Prime95+FurMark stress)

Hałas

luz
32.7 / 32.7 / 35.3 dB
obciążenie
36.8 / 52.9 dB
  red to green bar
 
 
30 dB
cichy
40 dB(A)
słyszalny
50 dB(A)
irytujący
 
min: dark, med: mid, max: light   Earthworks M23R, Arta (odległość 15 cm)   environment noise: 22.8 dB(A)
dB(A) 0102030405060708090Deep BassMiddle BassHigh BassLower RangeMidsHigher MidsLower HighsMid HighsUpper HighsSuper Highs2040.228.934.132.142.12539.525.129.721.441.13139.922.223.620.944.54043.120.820.117.443.45041.228.928.12843.7634122.221.617.844.98040.224.626.419.944.910038.125.427.219.841.312537.620.822.415.539.516039.922.32215.142.420040.421.723.513.441.525044.625.225.211.545.231543.625.224.91246.84004626.12411.447.150045.725.722.910.547.163044.73026.49.346.680038.927.724.19.242.2100038.725.220.78.941.6125037.427.723.49.440.9160039.127.822.99.642.8200038.327.119.69.942.525003523.315.310.439.2315028.920.515.710.733.340002616.912.711.130.1500023.915.312.211.426.76300201412.111.422.5800018.414.313.212.117.91000017.613.913.312.115.81250018.413.413.611.714.81600016.112.713.910.914SPL50.336.832.722.852.9N72.31.60.48.5median 38.1median 23.3median 22median 11.4median 41.3Delta9.15.15.11.58.3hearing rangehide median Fan NoiseBeelink GTI12 Ultra EX Docking Station
Beelink GTI12 Ultra EX Docking Station
NVIDIA GeForce RTX 3070, i9-12900H, Crucial P3 Plus CT1000P3PSSD8
Minisforum MS-A1
Radeon 780M, Ryzen 7 8700G, Kingston OM8PGP41024Q-A0
GMK NucBox K9
Arc 7-Core, Ultra 5 125H, MasonSemi 1TB MC7000
Asus NUC 14 Pro
Arc 7-Core, Ultra 5 125H, Kingston KC3000 2048G SKC3000D2048G
Geekom AX8 Pro
Radeon 780M, R9 8945H, Acer N7000
Asus ROG NUC 14-90AS0051
NVIDIA GeForce RTX 4070 Laptop GPU, Ultra 9 185H, Samsung PM9A1a MZVL21T0HDLU
Noise
1%
2%
9%
5%
15%
off / environment *
22.8
24.8
-9%
23
-1%
24
-5%
24.9
-9%
24.9
-9%
Idle Minimum *
32.7
33.9
-4%
29.8
9%
26
20%
24.9
24%
24.9
24%
Idle Average *
32.7
34
-4%
35.7
-9%
26.2
20%
24.9
24%
24.9
24%
Idle Maximum *
35.3
34
4%
35.7
-1%
26.2
26%
24.9
29%
24.9
29%
Load Average *
36.8
41.1
-12%
41.9
-14%
42.4
-15%
50.1
-36%
37.9
-3%
Cyberpunk 2077 ultra *
50.3
42.2
16%
43.8
13%
47.7
5%
50
1%
38.3
24%
Load Maximum *
52.9
46.2
13%
44
17%
47.8
10%
50.2
5%
44.2
16%

* ... im mniej tym lepiej

Temperatura

Górna powierzchnia mini PC może osiągnąć około 34 C podczas grania lub ponad 41 C, gdy procesor jest wykorzystywany w 100 procentach, aby być cieplejszym niż wiele innych mini PC. Dzieje się tak głównie dlatego, że urządzenie integruje cały zasilacz wewnątrz obudowy i nie zawiera kratek wentylacyjnych po bokach.

System bezczynny
System bezczynny
Cyberpunk 2077 - stres

Test warunków skrajnych

Procesor zwiększał taktowanie do 3,2 GHz i 69 W podczas inicjowania stresu Prime95. Po około jednej do dwóch minut spadał jednak do 2,9 GHz i 61 W, aby utrzymać rozsądną temperaturę rdzenia na poziomie 78 C. Maksymalny Turbo Boost nie jest niestety nieokreślony pomimo dużego rozmiaru obudowy, ale przynajmniej spadek wydajności jest stosunkowo niewielki.

Temperatura rdzenia ustabilizowałaby się na poziomie 83 C podczas grania, co jest wartością wyższą niż oczekiwana dla mini PC.

System bezczynny
System bezczynny
Cyberpunk 2077 - stres
Stres Prime95
Stres Prime95
Prime95+FurMark stres
Średnie taktowanieCPU (GHz) Taktowanie GPU (MHz) Średnia temperatura CPU (°C) Średnia temperatura GPU (°C)
System w stanie spoczynku -- -- 40 43
Prime95 Stress 2.9 -- 78 43
Prime95 + FurMark Stress 2.9 1725 85 78
Cyberpunk 2077 Stress 1.8 1950 83 73

Głośniki

Wewnętrzne głośniki nie są zbyt głośne ani imponujące, podobnie jak to, czego doświadczyliśmy na ostatnim Bosgame. Nadają się one bardziej do funkcji pomocniczych, takich jak konferencje lub małe pokoje, w których jakość dźwięku ma mniejsze znaczenie. Odpowiednie głośniki zewnętrzne są nadal zalecane do wszelkiego rodzaju odtwarzania multimediów.

Szum różowy przy maksymalnej głośności pokazuje słabą reprodukcję basów
dB(A) 0102030405060708090Deep BassMiddle BassHigh BassLower RangeMidsHigher MidsLower HighsMid HighsUpper HighsSuper Highs2034.134.134.12524.229.724.23124.223.624.24022.320.122.35026.428.126.46324.121.624.18023.226.423.210025.427.225.412533.822.433.816045.62245.620046.923.546.925051.625.251.631555.924.955.940065.42465.450072.322.972.363077.526.477.580073.224.173.2100070.520.770.5125068.423.468.4160064.722.964.7200059.319.659.3250063.115.363.1315060.315.760.3400059.512.759.5500061.612.261.6630060.912.160.9800062.313.262.31000055.813.355.81250055.913.655.91600054.513.954.5SPL79.932.779.9N441.644median 60.3median 22median 60.3Delta6.45.16.426.325.821.422.12624.925.127.622.532.523.448.72655.818.860.922.167.2267019.372.317.674.217.774.319.575.31571.711.871.311.27410.574.21072.710.17210.67210.97511.374.811.671.71269.71269.612.371.112.669.61270.111.269.824.784.70.666.6median 12median 71.73.42.2hearing rangehide median Pink NoiseBeelink GTI12 Ultra EX Docking StationApple MacBook Pro 16 2021 M1 Pro
Frequency diagram (checkboxes can be checked and unchecked to compare devices)
Beelink GTI12 Ultra EX Docking Station audio analysis

(±) | speaker loudness is average but good (79.9 dB)
Bass 100 - 315 Hz
(-) | nearly no bass - on average 17.1% lower than median
(±) | linearity of bass is average (14.3% delta to prev. frequency)
Mids 400 - 2000 Hz
(±) | higher mids - on average 8.9% higher than median
(±) | linearity of mids is average (13% delta to prev. frequency)
Highs 2 - 16 kHz
(+) | balanced highs - only 1.7% away from median
(+) | highs are linear (6.7% delta to prev. frequency)
Overall 100 - 16.000 Hz
(±) | linearity of overall sound is average (24.2% difference to median)
Compared to same class
» 50% of all tested devices in this class were better, 14% similar, 36% worse
» The best had a delta of 14%, average was 25%, worst was 40%
Compared to all devices tested
» 70% of all tested devices were better, 6% similar, 24% worse
» The best had a delta of 4%, average was 25%, worst was 134%

Apple MacBook Pro 16 2021 M1 Pro audio analysis

(+) | speakers can play relatively loud (84.7 dB)
Bass 100 - 315 Hz
(+) | good bass - only 3.8% away from median
(+) | bass is linear (5.2% delta to prev. frequency)
Mids 400 - 2000 Hz
(+) | balanced mids - only 1.3% away from median
(+) | mids are linear (2.1% delta to prev. frequency)
Highs 2 - 16 kHz
(+) | balanced highs - only 1.9% away from median
(+) | highs are linear (2.7% delta to prev. frequency)
Overall 100 - 16.000 Hz
(+) | overall sound is linear (4.6% difference to median)
Compared to same class
» 0% of all tested devices in this class were better, 0% similar, 100% worse
» The best had a delta of 5%, average was 18%, worst was 45%
Compared to all devices tested
» 0% of all tested devices were better, 0% similar, 100% worse
» The best had a delta of 4%, average was 25%, worst was 134%

Zarządzanie energią

Zużycie energii

GTI12 Ultra i stacja dokująca EX są znacznie bardziej wymagające niż inne mini PC, w tym Asus ROG NUC 14 i własne rozwiązanie dokujące RTX 4070. Praca na biegu jałowym na komputerze stacjonarnym już pobiera ponad dwa razy więcej energii niż większość laptopów, podczas gdy gry mogą wymagać ponad 380 W w porównaniu do 336 W w przypadku MSI Titan 18 HX który jest jednym z najszybszych obecnie dostępnych laptopów do gier.

Jak wspomniano powyżej, zarówno GTI12 Ultra, jak i stacja dokująca EX nie mają zewnętrznego zasilacza, w przeciwieństwie do większości innych mini PC i laptopów.

zużycie 3DMark 06
zużycie 3DMark 06
Cyberpunk 2077 1080p Ultra zużycie
Zużycie wzrosłoby do 143 W podczas inicjowania stresu Prime95
Prime95+FurMark stres zainicjowany w 10s mark
Pobór mocy
wyłączony / stan wstrzymaniadarklight 6 / 10.6 W
luzdarkmidlight 35.9 / 35.9 / 36 W
obciążenie midlight 119.5 / 422.9 W
 color bar
Legenda: min: dark, med: mid, max: light        Metrahit Energy
Beelink GTI12 Ultra EX Docking Station
i9-12900H, NVIDIA GeForce RTX 3070, Crucial P3 Plus CT1000P3PSSD8, , x,
Minisforum MS-A1
Ryzen 7 8700G, Radeon 780M, Kingston OM8PGP41024Q-A0, , x,
GMK NucBox K9
Ultra 5 125H, Arc 7-Core, MasonSemi 1TB MC7000, , x,
Asus NUC 14 Pro
Ultra 5 125H, Arc 7-Core, Kingston KC3000 2048G SKC3000D2048G, , x,
Geekom AX8 Pro
R9 8945H, Radeon 780M, Acer N7000, , x,
Asus ROG NUC 14-90AS0051
Ultra 9 185H, NVIDIA GeForce RTX 4070 Laptop GPU, Samsung PM9A1a MZVL21T0HDLU, , x,
Power Consumption
62%
72%
74%
60%
47%
Idle Minimum *
35.9
8.8
75%
10.9
70%
5.1
86%
14
61%
10.6
70%
Idle Average *
35.9
12.6
65%
11
69%
6.4
82%
15.9
56%
14.8
59%
Idle Maximum *
36
14
61%
11.4
68%
14.7
59%
19.5
46%
27.5
24%
Load Average *
119.5
93.2
22%
52.8
56%
55.5
54%
76.4
36%
84.6
29%
Cyberpunk 2077 ultra external monitor *
384
102.1
73%
57.1
85%
59.1
85%
54.3
86%
171.4
55%
Load Maximum *
422.9
105.4
75%
72.2
83%
103.3
76%
99.1
77%
244
42%

* ... im mniej tym lepiej

Power Consumption Cyberpunk / Stress Test

0255075100125150175200225250275300325350375400425Tooltip
Beelink GTI12 Ultra EX Docking Station i9-12900H, NVIDIA GeForce RTX 3070: Ø418 (404-428)
Asus ROG NUC 14-90AS0051 Ultra 9 185H, NVIDIA GeForce RTX 4070 Laptop GPU: Ø178.9 (139.7-244)

Power Consumption external Monitor

020406080100120140160180200220240260280300320340360380Tooltip
Beelink GTI12 Ultra EX Docking Station i9-12900H, NVIDIA GeForce RTX 3070; Prime95 V2810 Stress (external Monitor): Ø140.7 (135.3-143.4)
Asus ROG NUC 14-90AS0051 Ultra 9 185H, NVIDIA GeForce RTX 4070 Laptop GPU; Prime95 V2810 Stress (external Monitor): Ø124.6 (119.9-181.8)
Beelink GTI12 Ultra EX Docking Station i9-12900H, NVIDIA GeForce RTX 3070; Cinebench R15 Multi (external Monitor): Ø128.9 (127.6-131.6)
Asus ROG NUC 14-90AS0051 Ultra 9 185H, NVIDIA GeForce RTX 4070 Laptop GPU; Cinebench R15 Multi (external Monitor): Ø122.3 (118.5-148.6)
Beelink GTI12 Ultra EX Docking Station i9-12900H, NVIDIA GeForce RTX 3070; 1280x720 FurMark 1.19 GPU Stress Test (external Monitor): Ø350 (331-365)
Asus ROG NUC 14-90AS0051 Ultra 9 185H, NVIDIA GeForce RTX 4070 Laptop GPU; 1280x720 FurMark 1.19 GPU Stress Test (external Monitor): Ø165.5 (157.7-193.1)
Beelink GTI12 Ultra EX Docking Station i9-12900H, NVIDIA GeForce RTX 3070; Idle 1min (external Monitor): Ø36.3 (35.5-42.3)
Asus ROG NUC 14-90AS0051 Ultra 9 185H, NVIDIA GeForce RTX 4070 Laptop GPU; Idle 1min (external Monitor): Ø17.4 (14.8-27.5)
Beelink GTI12 Ultra EX Docking Station i9-12900H, NVIDIA GeForce RTX 3070; Cyberpunk 2077 FHD ultra no FSR - external Monitor: Ø384 (372-390)
Asus ROG NUC 14-90AS0051 Ultra 9 185H, NVIDIA GeForce RTX 4070 Laptop GPU; Cyberpunk 2077 FHD ultra no FSR - external Monitor: Ø171.4 (166.8-177.5)

Za

+ stacja dokująca zawiera dodatkową pamięć M.2, antenę WLAN i USB-A
+ zintegrowany zasilacz i głośniki; brak zewnętrznych zasilaczy
+ szybsza grafika niż w większości laptopów
+ wysoka jakość wykonania i wrażenie
+ przystępna cena początkowa

Przeciw

- Dysk SSD M.2 i WLAN nie mogą być zainstalowane jednocześnie w stacji dokującej
- wyższe niż przeciętne temperatury podczas grania
- Stacja dokująca EX kompatybilna tylko z serią GTI Ultra
- serwisowanie jest uciążliwe
- bardzo wolny czytnik SD

Werdykt - doskonała jakość wykonania w tej cenie

W recenzji: Stacja dokująca Beelink GTI12 Ultra EX

GTI12 Ultra zasługuje na swoją nazwę "Ultra" dzięki powiększonej obudowie i dodatkowym funkcjom w porównaniu do zwykłej serii Beelink GTI lub SER. W szczególności zintegrowany zasilacz jest czymś, co chcielibyśmy, aby stało się normą, ponieważ niektóre zasilacze mogą być prawie tak duże, jak same mini PC. Konstrukcja i jakość obudowy są również na najwyższym poziomie, podobnie jak w przypadku SER8.

Główna wada staje się oczywista, gdy trzeba serwisować urządzenie. Głośniki i zasilacz muszą zostać najpierw usunięte, aby uzyskać dostęp do gniazd M.2 SSD i RAM, więc proces ten jest bardziej niewygodny niż w przypadku większości innych mini PC. Urządzenie jest również cieplejsze niż byśmy chcieli, mimo że jest zauważalnie większe i cięższe niż inne w tej kategorii. Bardzo wolny zintegrowany czytnik SD jest również policzkiem dla twórców treści, zwłaszcza że model ten jest sprzedawany jako mini PC z wyższej półki.

Jeśli chodzi o stację dokującą EX, jest to solidna, choć nieelegancka konstrukcja z odsłoniętymi kablami zasilającymi i antenami, nawet jeśli zdecydują się Państwo nie korzystać z żadnej z funkcji WLAN stacji dokującej. Konstrukcja EX "na otwartym powietrzu" będzie przyciągać więcej widocznego kurzu i włosów w porównaniu do pudełkowego rozwiązania eGPU, takiego jak Aorus Gaming Box gdzie zwykle wbudowane są filtry wstępne. EX nie nadaje się również do eksponowania karty graficznej, ponieważ GPU musi być zainstalowany w kierunku mini PC, a nie z dala od niego.

GTI12 Ultra i stacja dokująca EX są zaskakująco przystępne cenowo, biorąc pod uwagę jakość wykonania i konkurencję.

Usunięcie rzadko używanej funkcji Wi-Fi w EX lub zastąpienie jej większą liczbą portów mogłoby potencjalnie jeszcze bardziej zmniejszyć rozmiar i cenę stacji dokującej.

Cena i dostępność

Beelink dostarcza obecnie gTI12 Ultra z 1 TB SSD, 32 GB RAM i stacją dokującą EX w pakiecie za jedyne 738 USD. Nowsze opcje procesorów Meteor Lake są dostępne za 200 USD więcej.

Beelink GTI12 Ultra EX Docking Station - 21/10/2024 v8
Allen Ngo

Wykonanie
87 / 98 → 89%
Komunikacja
69 / 81 → 85%
Waga
71%
Wydajność w grach
89 / 80 → 100%
Wydajność w programach użytkowych
87 / 92 → 94%
Hałas
60%
Głośniki
64%
Średnio
49%
77%
Mini PC - Ważona średnia
CO2 Emissions
No Data
Materials
0%
Packaging
50%
Power Use
28.4%
Repairability
40%
Software Updates
22.3%
Recycle Logo Total Sustainability Score: 23.5%

Transparency

The selection of devices to be reviewed is made by our editorial team. The test sample was provided to the author as a loan by the manufacturer or retailer for the purpose of this review. The lender had no influence on this review, nor did the manufacturer receive a copy of this review before publication. There was no obligation to publish this review. We never accept compensation or payment in return for our reviews. As an independent media company, Notebookcheck is not subjected to the authority of manufacturers, retailers or publishers.

This is how Notebookcheck is testing

Every year, Notebookcheck independently reviews hundreds of laptops and smartphones using standardized procedures to ensure that all results are comparable. We have continuously developed our test methods for around 20 years and set industry standards in the process. In our test labs, high-quality measuring equipment is utilized by experienced technicians and editors. These tests involve a multi-stage validation process. Our complex rating system is based on hundreds of well-founded measurements and benchmarks, which maintains objectivity. Further information on our test methods can be found here.

Price comparison

Please share our article, every link counts!
Mail Logo
> laptopy testy i recenzje notebooki > Laptopy > Recenzja mini PC Beelink GTI12 Ultra EX Docking Station: Bardziej przystępny niż oczekiwano
Allen Ngo, 2024-10-22 (Update: 2024-10-22)