

Recenzja laptopa Framework 13.5 Ryzen AI 9: Pomiń wersję Intela dla lepszej wydajności
Po prostu staje się coraz szybszy.
Framework wyciska jak najwięcej ze swojego starzejącego się projektu w imię zrównoważonego rozwoju. W większości przypadków działa lepiej niż oczekiwano pod względem surowej wydajności, ale wciąż jest kilka kluczowych funkcji, które chcielibyśmy zobaczyć.Allen Ngo (tłumaczenie DeepL / Ninh Duy) Opublikowany 🇺🇸 🇫🇷 ...
Werdykt - Znajomy, ale szybszy
Nowy Ryzen AI 9 HX 370 jest sporym ulepszeniem w stosunku do 2024 Core Ultra 7 lub Zen 4 Ryzen U . Wydajność wzrosła bez konieczności zwiększania koperty mocy lub powiększania rozwiązania chłodzącego, aby zachować kompatybilność części ze starszymi konfiguracjami Laptop 13.5.
Jeśli nie potrzebują Państwo takiej wydajności, to starsze konfiguracje Laptopa 13.5 nadal mogą zapewnić zasadniczo takie same wrażenia użytkownika za mniejszą cenę. Najwyższej klasy konfiguracje Framework stają się zauważalnie droższe, a nasza jednostka testowa w szczególności przekroczyła pułap 2000 USD. Wolniejsze i tańsze konfiguracje Core Ultra oferują dłuższy czas pracy na baterii wraz z czterema identycznymi portami USB-C 4.0, co stanowi dobry kompromis, jeśli surowa wydajność nie jest priorytetem.
Kilka aspektów pięcioletniego projektu Framework zaczyna pokazywać swój wiek. Kamera internetowa 2 MP, brak opcji kolorów OLED lub P3 i stosunkowo słabe głośniki pozostają w tyle za najnowszymi konkurencyjnymi modelami od Lenovo, HPlub Dell. Framework nie zaoferował jeszcze takich aktualizacji pomimo elastycznej filozofii projektowania serii Laptop 13.5.
Za
Przeciw
Cena i dostępność
Framework jest teraz wysyłka laptop 13.5 z opcją Ryzen AI 300 zaczyna się od 1330 USD. Nasza recenzowana jednostka kosztuje 2100 USD.
- $1,449.00HP 2024 OmniBook Ultra 14” 2.2K IPS Touchscreen Laptop 12-Core AMD Ryzen AI 9 HX 375 APU AMD Radeon Graphics 32GB LPDDR5 2TB SSD USB-C w/DP WiFi AX BT Webcam Backlit KB Fingerprint Windows 11 Home
- $1,449.00HP OmniBook Ultra 14 2024 Laptop, 12-Core AMD Ryzen AI 9 HX 375 APU, 14" 2.2K IPS Touchscreen Display, AMD Radeon Graphics, 32GB LPDDR5 2TB SSD, Backlit Keyboard, Fingerprint, Copilot+, Win11 Home
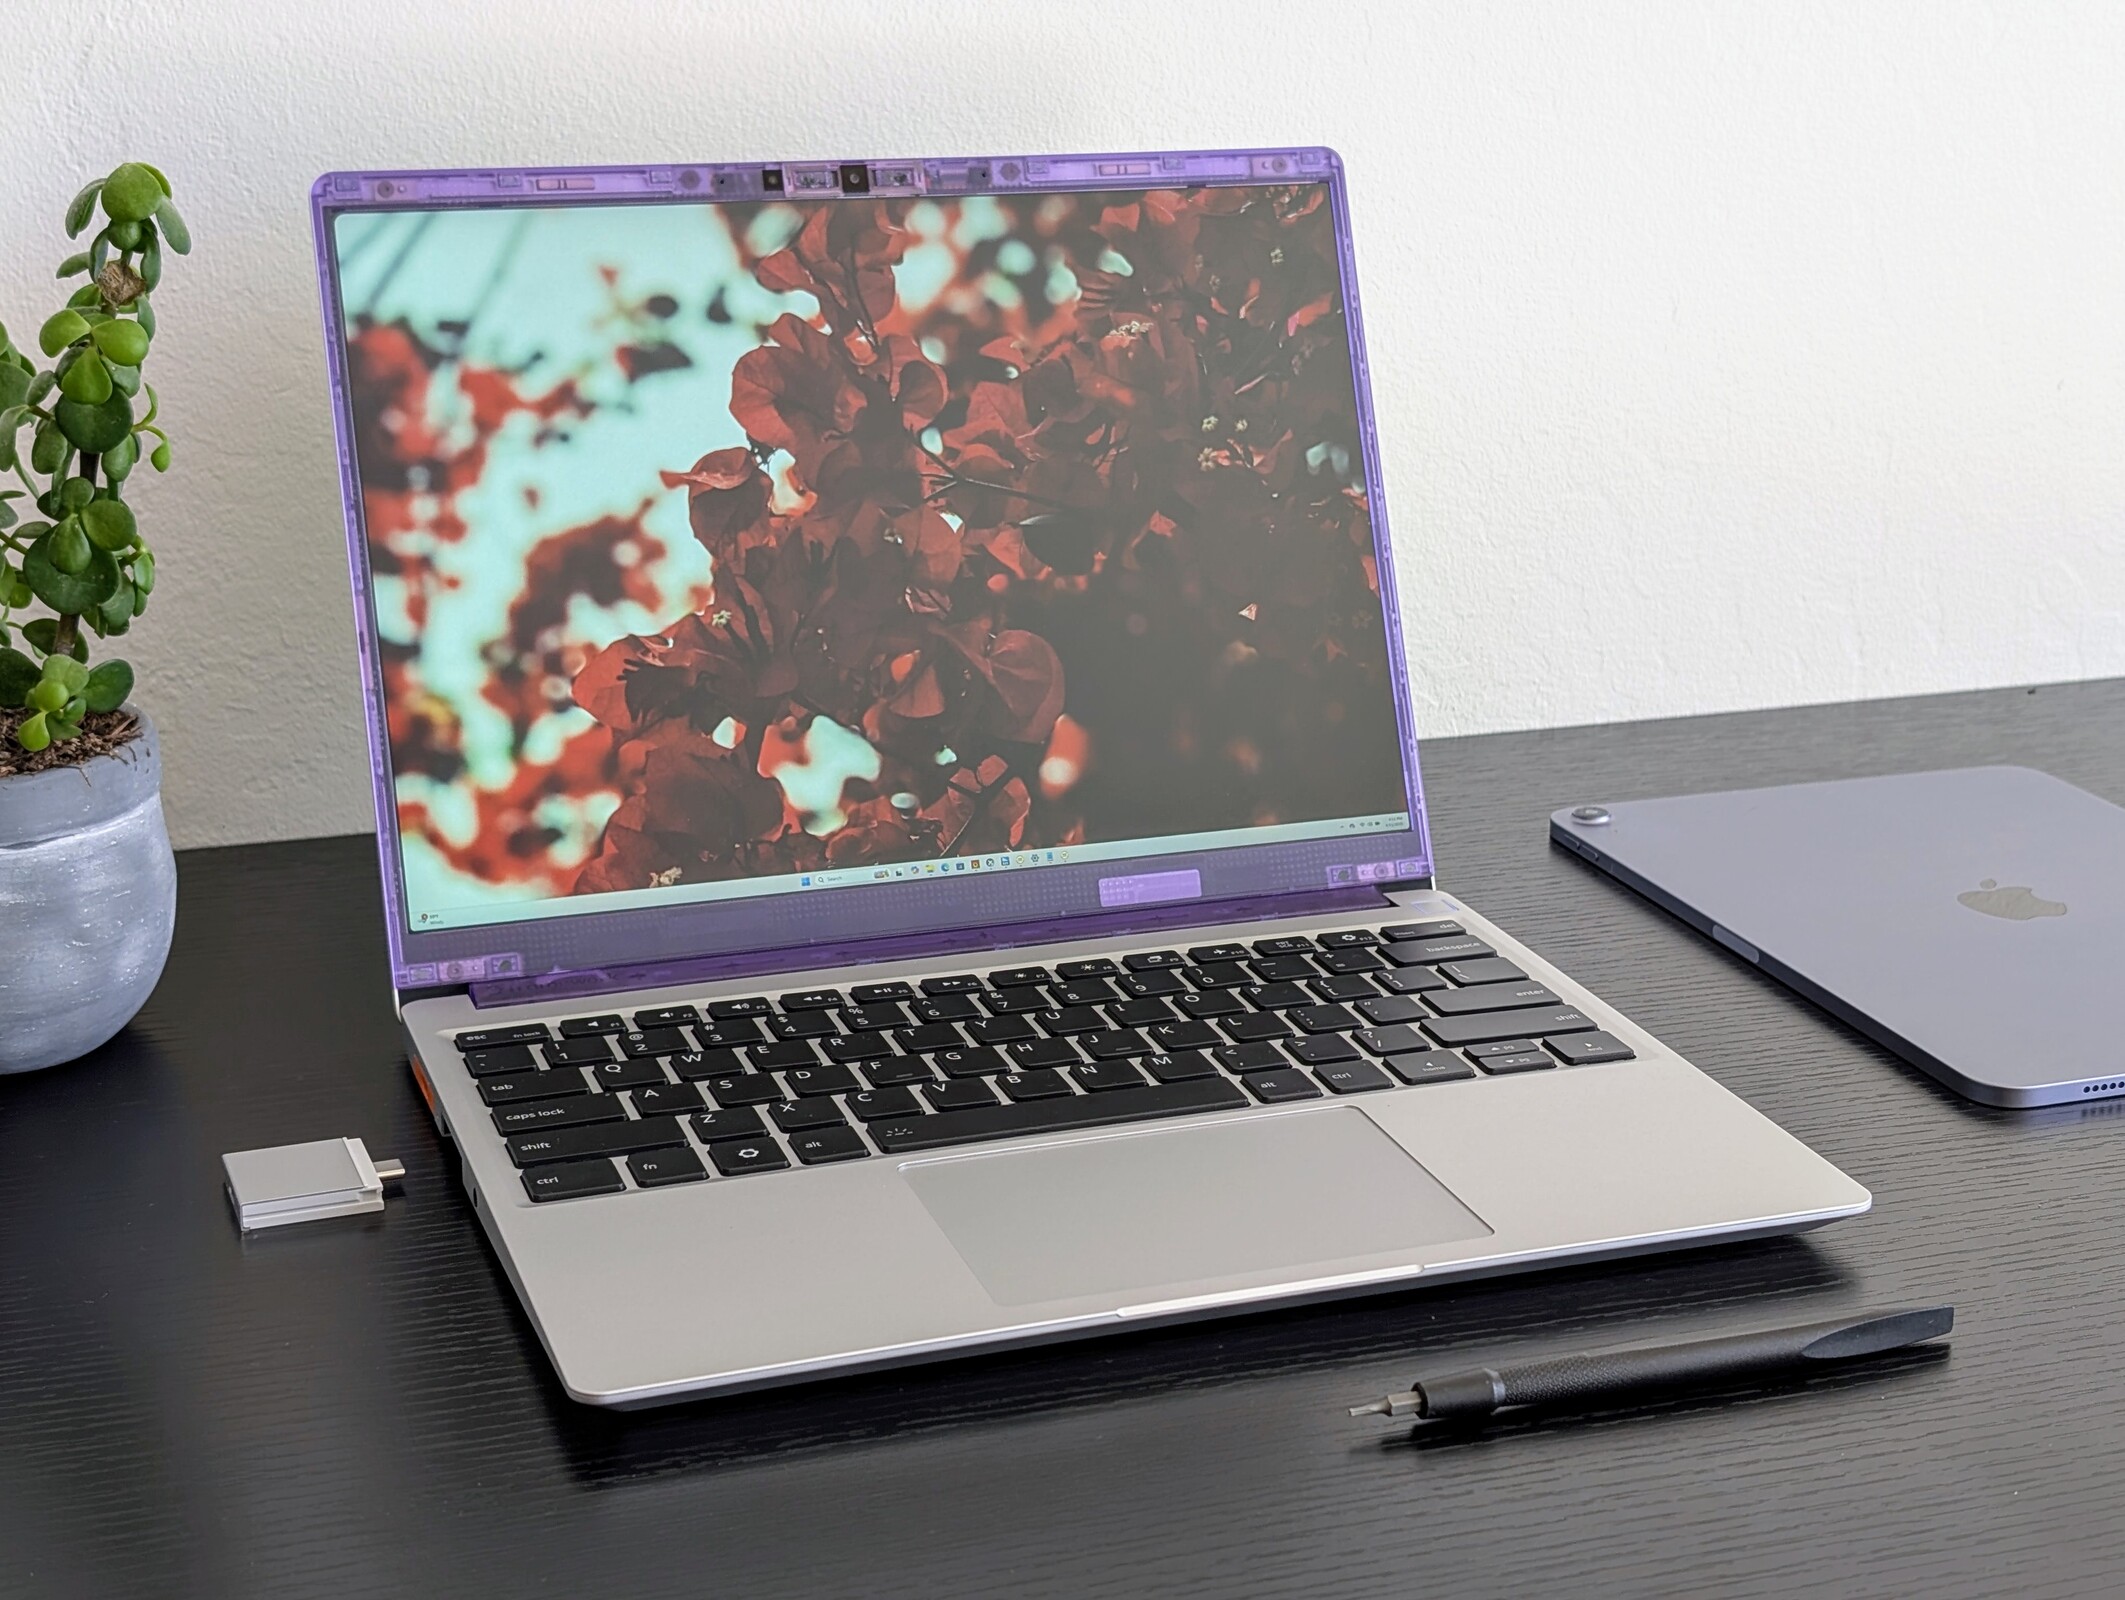
Framework zaktualizował w tym roku swoje laptopy 13.5 o procesory AMD Zen 5 z serii HX, które zastąpiły zeszłoroczne opcje Core Ultra 7 z serii Zen 4 U. Poza tym obudowa jest identyczna, dlatego zalecamy zapoznanie się z naszą recenzją oryginalnego modelu oryginalnego modelu aby dowiedzieć się więcej o fizycznych cechach systemu.
Nasza jednostka testowa to najwyższej klasy konfiguracja z procesorem Ryzen AI 9 HX 370 i wyświetlaczem IPS 2880 x 1920 120 Hz za ponad 2100 USD. Niższe konfiguracje zaczynają się od Ryzen AI 5 340 lub wyświetlacza 2256 x 1504 60 Hz.
Konkurentami Laptopa 13.5 są popularne flagowe subnotebooki prosumenckie lub biznesowe, takie jak Lenovo ThinkPad T14s, Dell Pro 13lub Seria HP EliteBook.
Więcej recenzji ram:
Specyfikacje
Przypadek
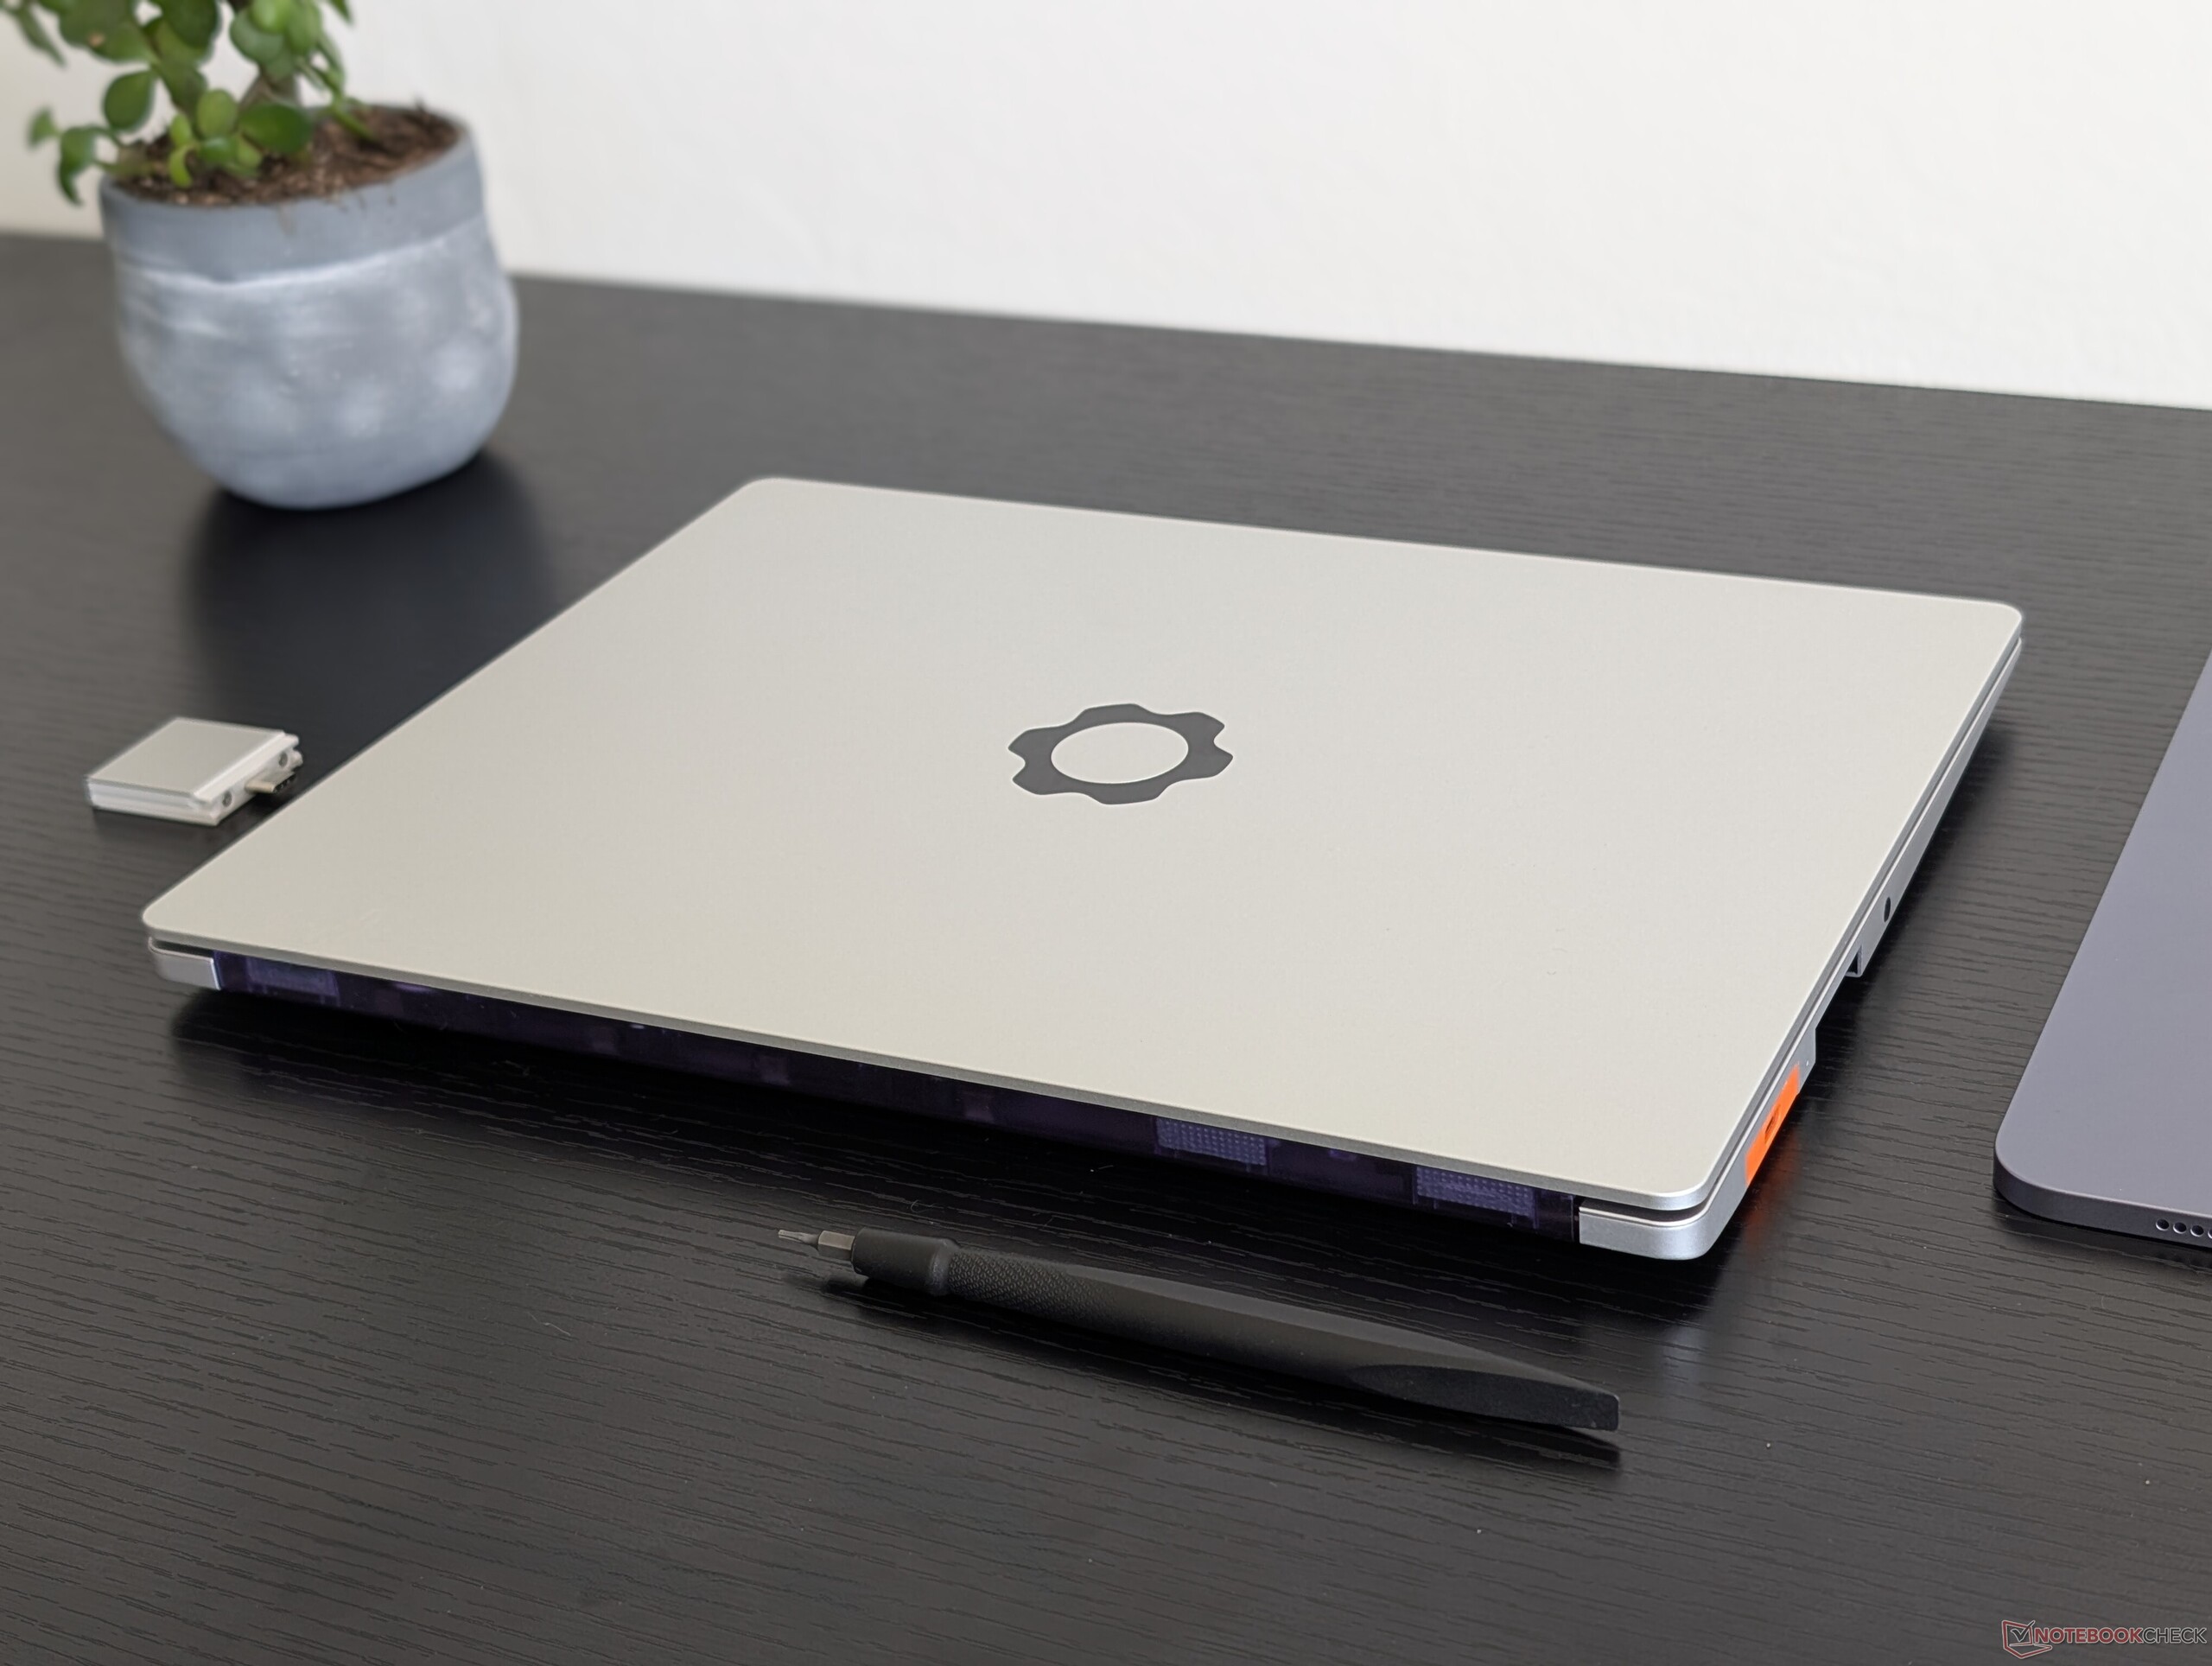
Nie wprowadzono żadnych zmian w konstrukcji obudowy, aby zachować kompatybilność z istniejącymi częściami zamiennymi i akcesoriami.
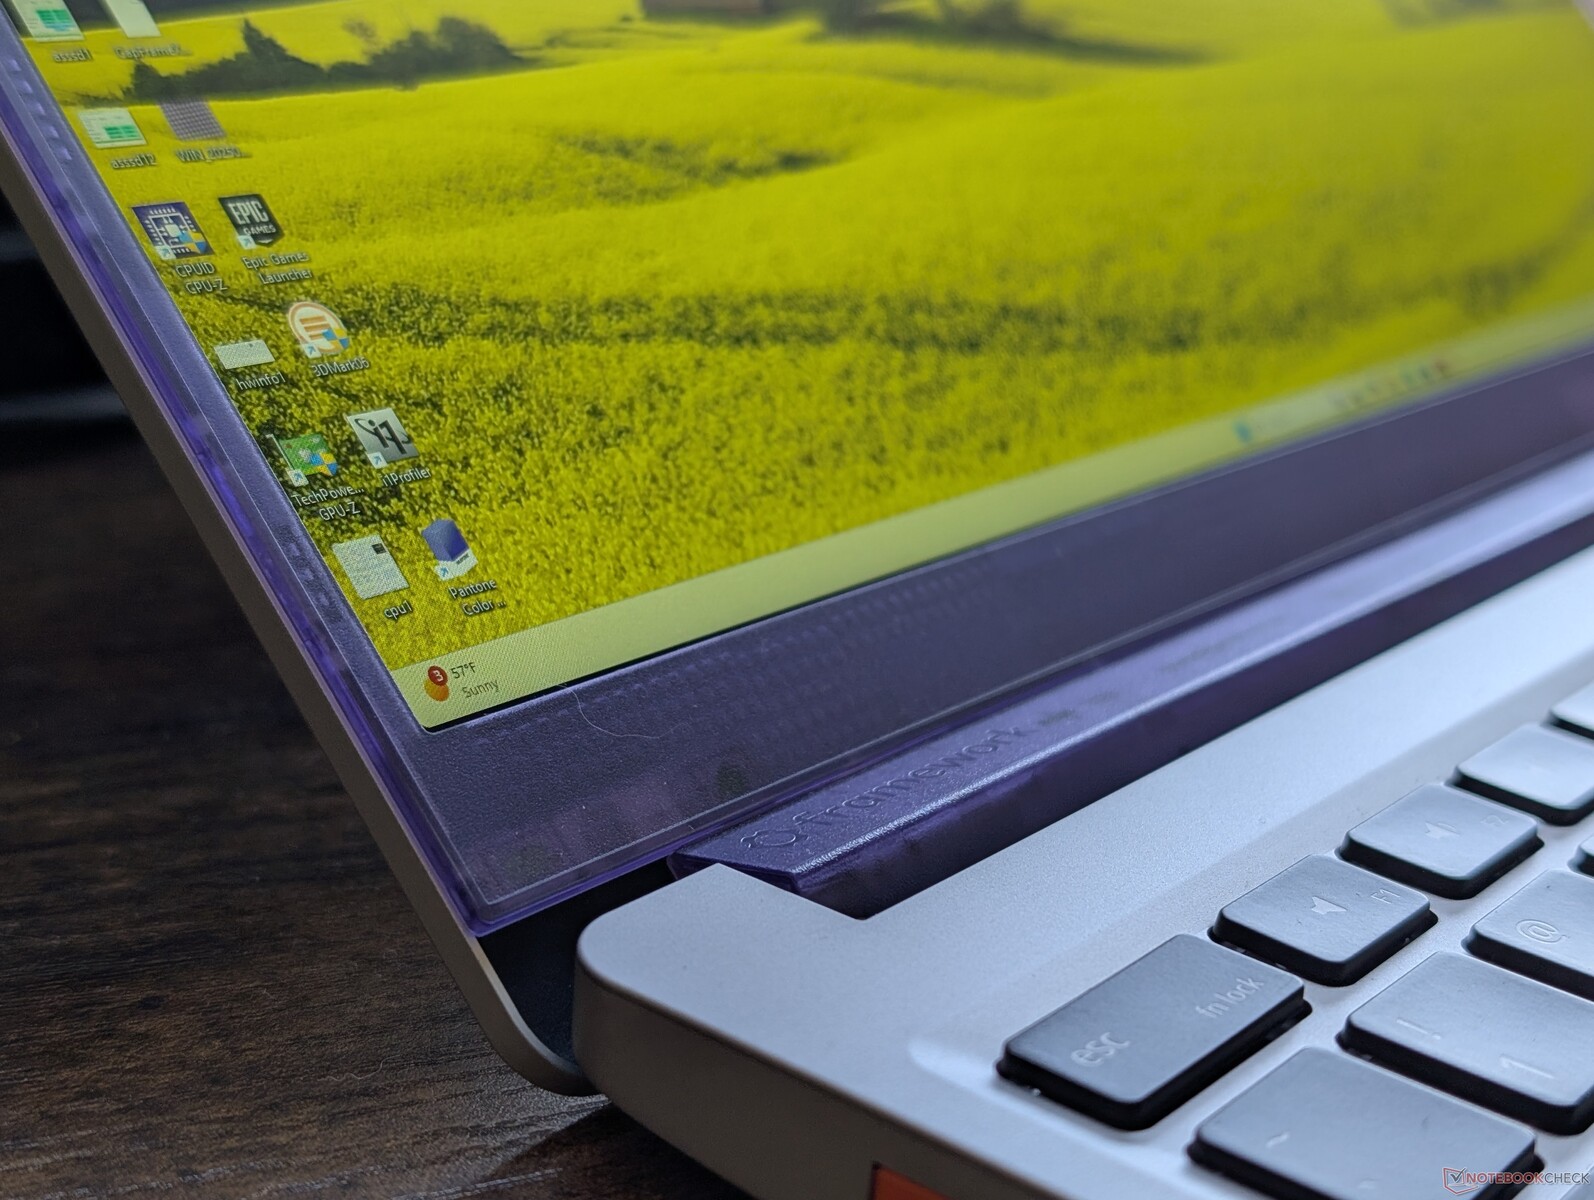
Nowe opcje w tym roku obejmują półprzezroczyste kolorowe plastikowe ramki dla majsterkowiczów, którzy chcą dodać trochę koloru do swoich systemów oraz klawiaturę drugiej generacji, która redukuje stukot klawiszy i wibracje ze zintegrowanych głośników. Mimo to, różnice są prawdopodobnie niewielkie i w dużej mierze estetyczne.
Łączność
Chociaż cztery porty USB-C powróciły, należy pamiętać, że nie wszystkie są identyczne, w przeciwieństwie do wersji Intel tego laptopa, ze względu na podstawowe różnice architektoniczne procesora AMD. W szczególności, tylko dwa tylne porty USB-C są kompatybilne z prędkością USB4, podczas gdy dwa przednie porty USB-C to USB 3.2.
Czytnik kart SD
| SD Card Reader | |
| average JPG Copy Test (av. of 3 runs) | |
| Framework Laptop 13.5 Core Ultra 7 155H (Toshiba Exceria Pro SDXC 64 GB UHS-II) | |
| Framework Laptop 13.5 Ryzen AI 9 HX 370 (AV PRO microSD 128 GB V60) | |
| maximum AS SSD Seq Read Test (1GB) | |
| Framework Laptop 13.5 Core Ultra 7 155H (Toshiba Exceria Pro SDXC 64 GB UHS-II) | |
| Framework Laptop 13.5 Ryzen AI 9 HX 370 (AV PRO microSD 128 GB V60) | |
Komunikacja
Kamera internetowa
Kamera internetowa 2 MP powraca bez opcji wyższej rozdzielczości.


Konserwacja
Łatwość serwisowania pozostaje niezmieniona i niekwestionowana w porównaniu do innych subnotebooków głównych producentów. Proszę zobaczyć nasz film poniżej, aby uzyskać bardziej szczegółowy przewodnik po funkcjach serwisowych.
Zrównoważony rozwój
Framework wykorzystuje 75% aluminium pochodzącego z recyklingu dla górnej pokrywy i głośników, 50% aluminium pochodzącego z recyklingu dla dolnej pokrywy i klawiatury, 50% plastiku pochodzącego z recyklingu dla klawiszy i do 30% plastiku pochodzącego z recyklingu dla kart rozszerzeń. Opakowanie składa się w całości z papieru i tektury, dzięki czemu w pełni nadaje się do recyklingu.
Producent oferuje również części zamienne, moduły modernizacyjne i szczegółowe instrukcje serwisowe, które nawet większym producentom jeszcze nie dorównały.
Akcesoria i gwarancja
Tegoroczną nowością w kartach rozszerzeń są półprzezroczyste plastikowe kolory i zaktualizowane opcje HDMI 2.0b. Półprzezroczyste kolory nie są dodatkowo płatne w porównaniu do istniejących kolorów szarego aluminium lub jednolitego plastiku.
Obowiązuje standardowa roczna ograniczona gwarancja producenta.
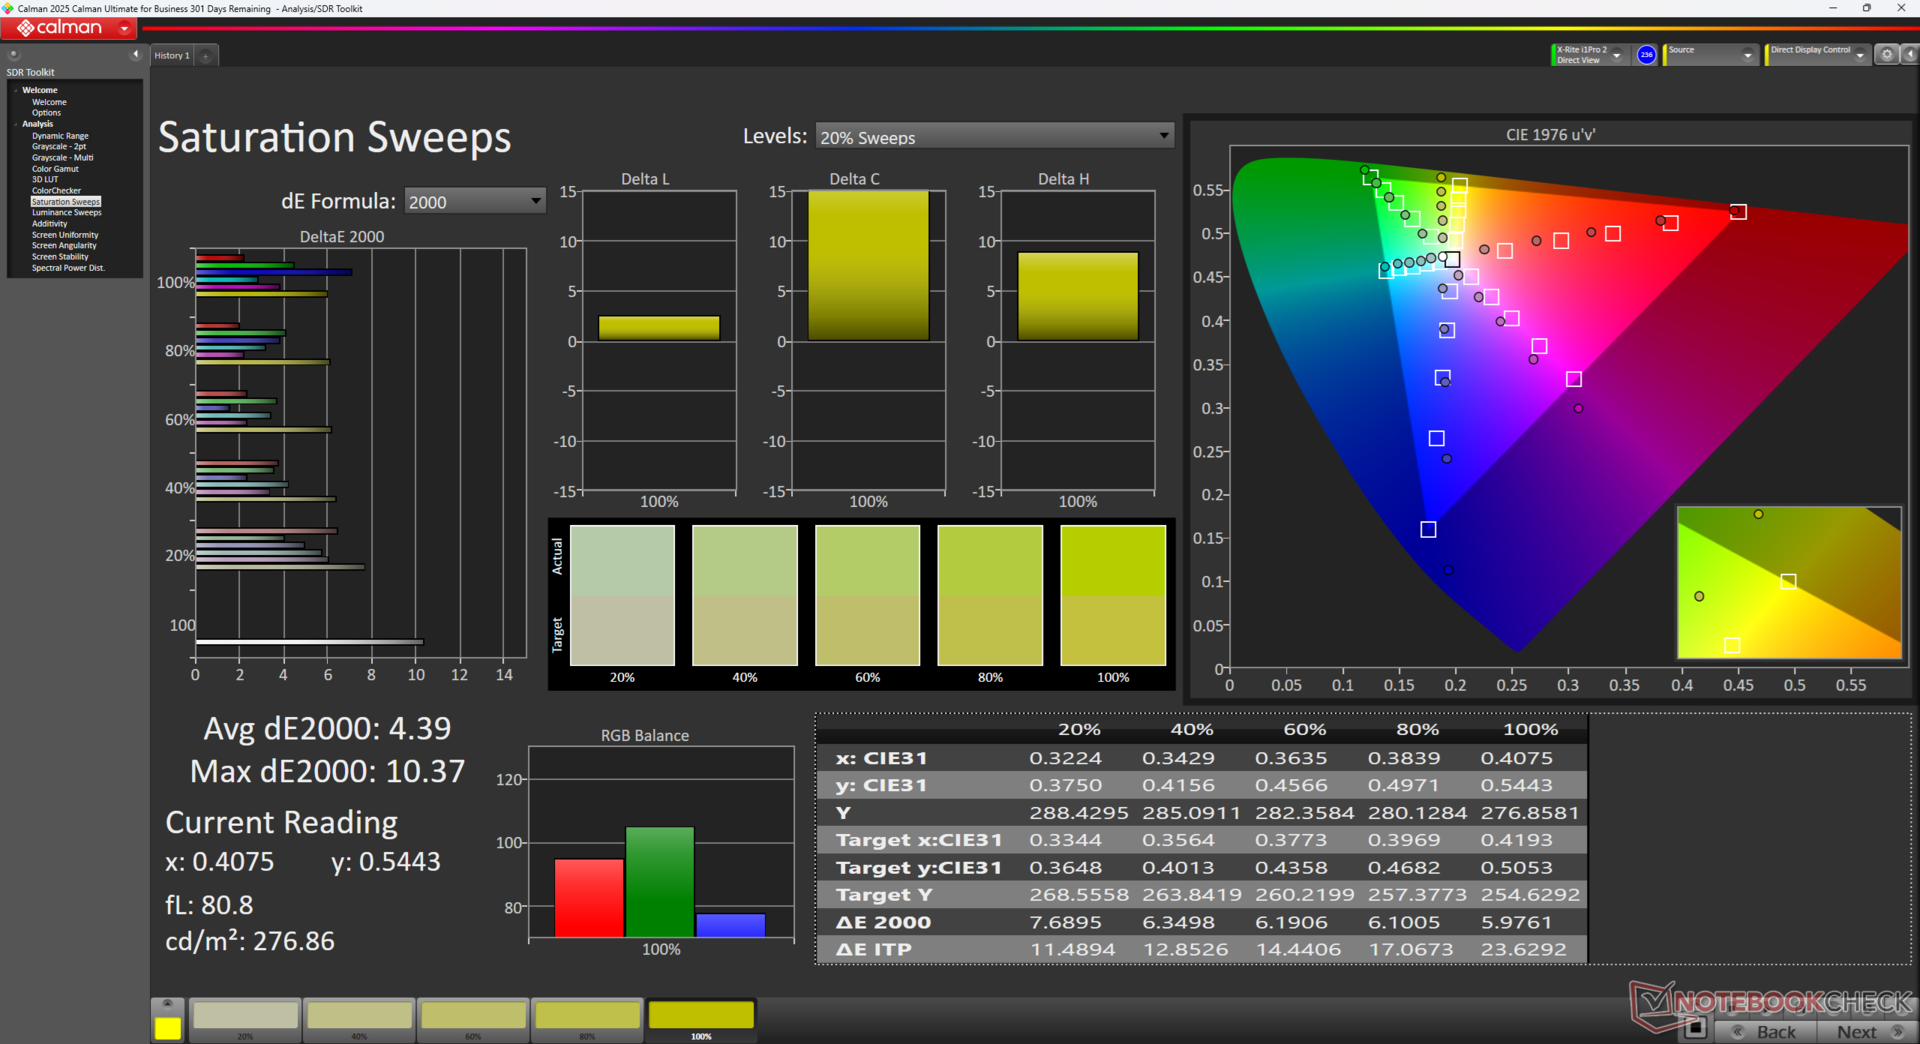
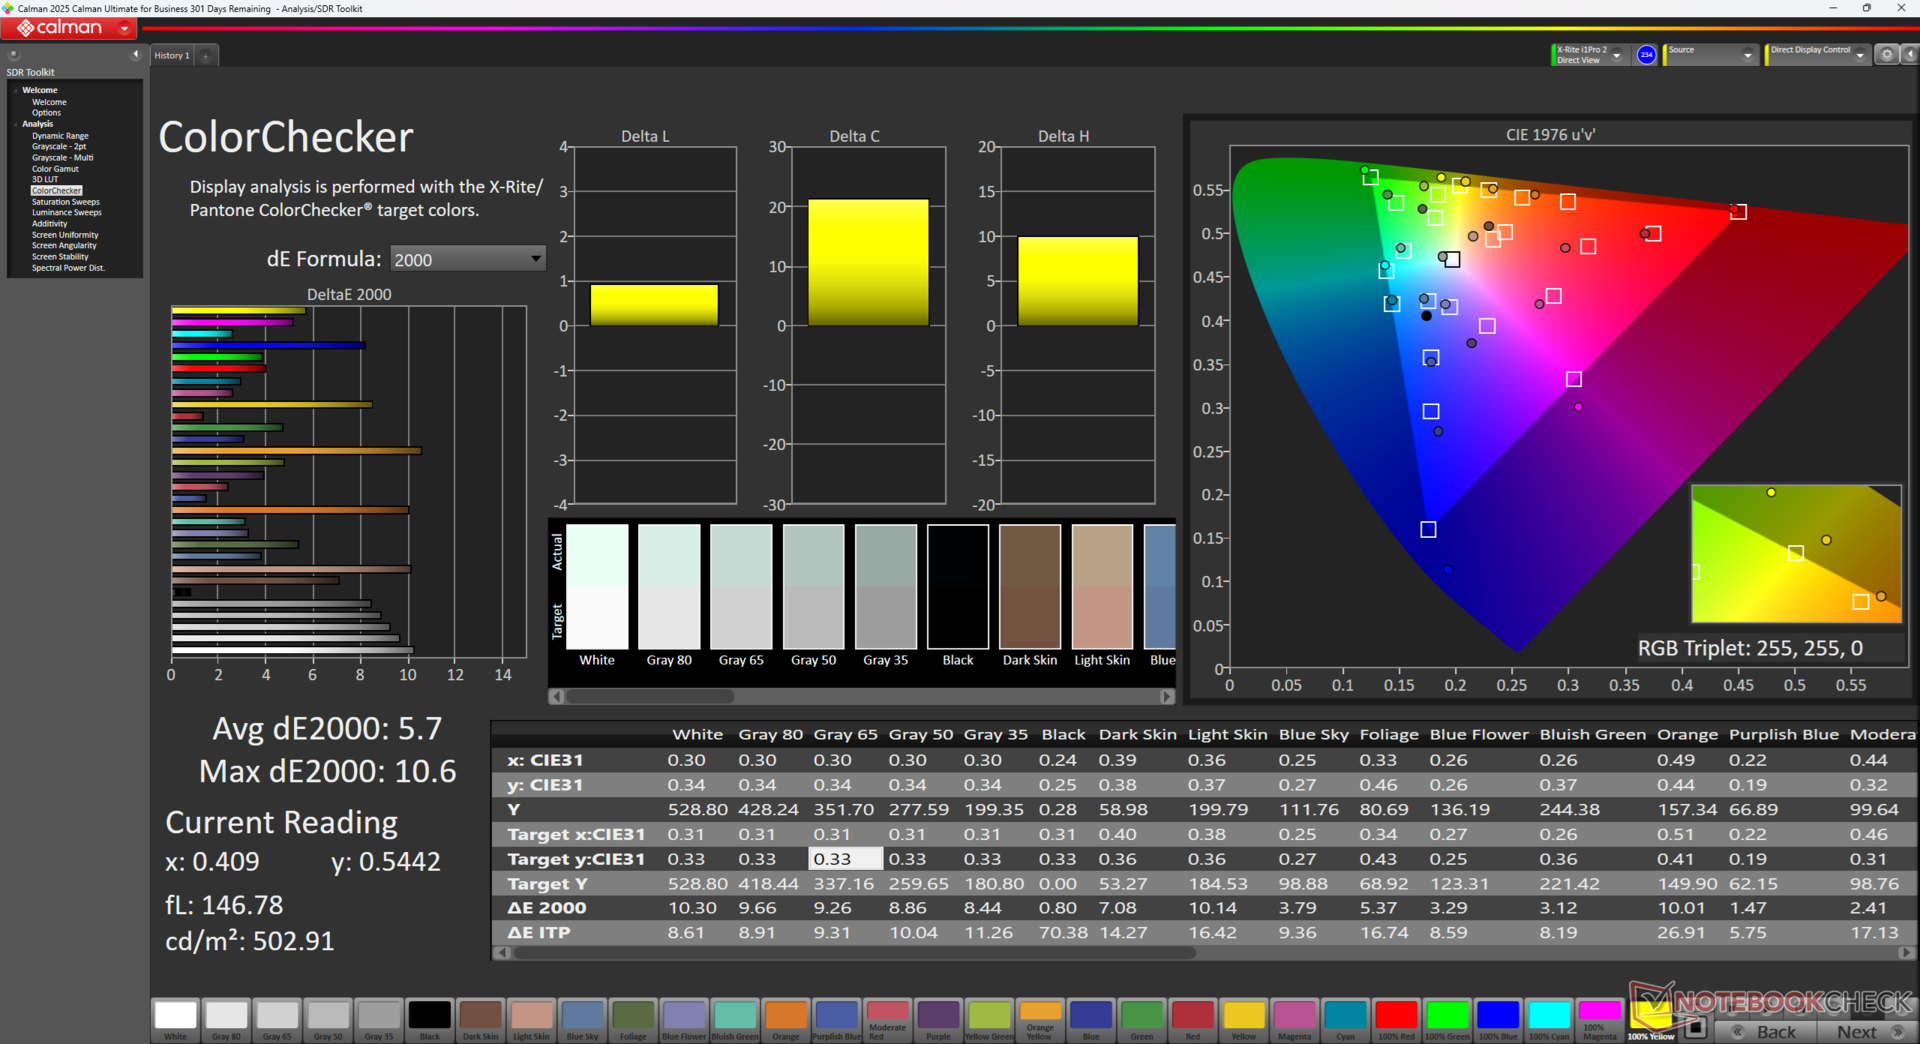
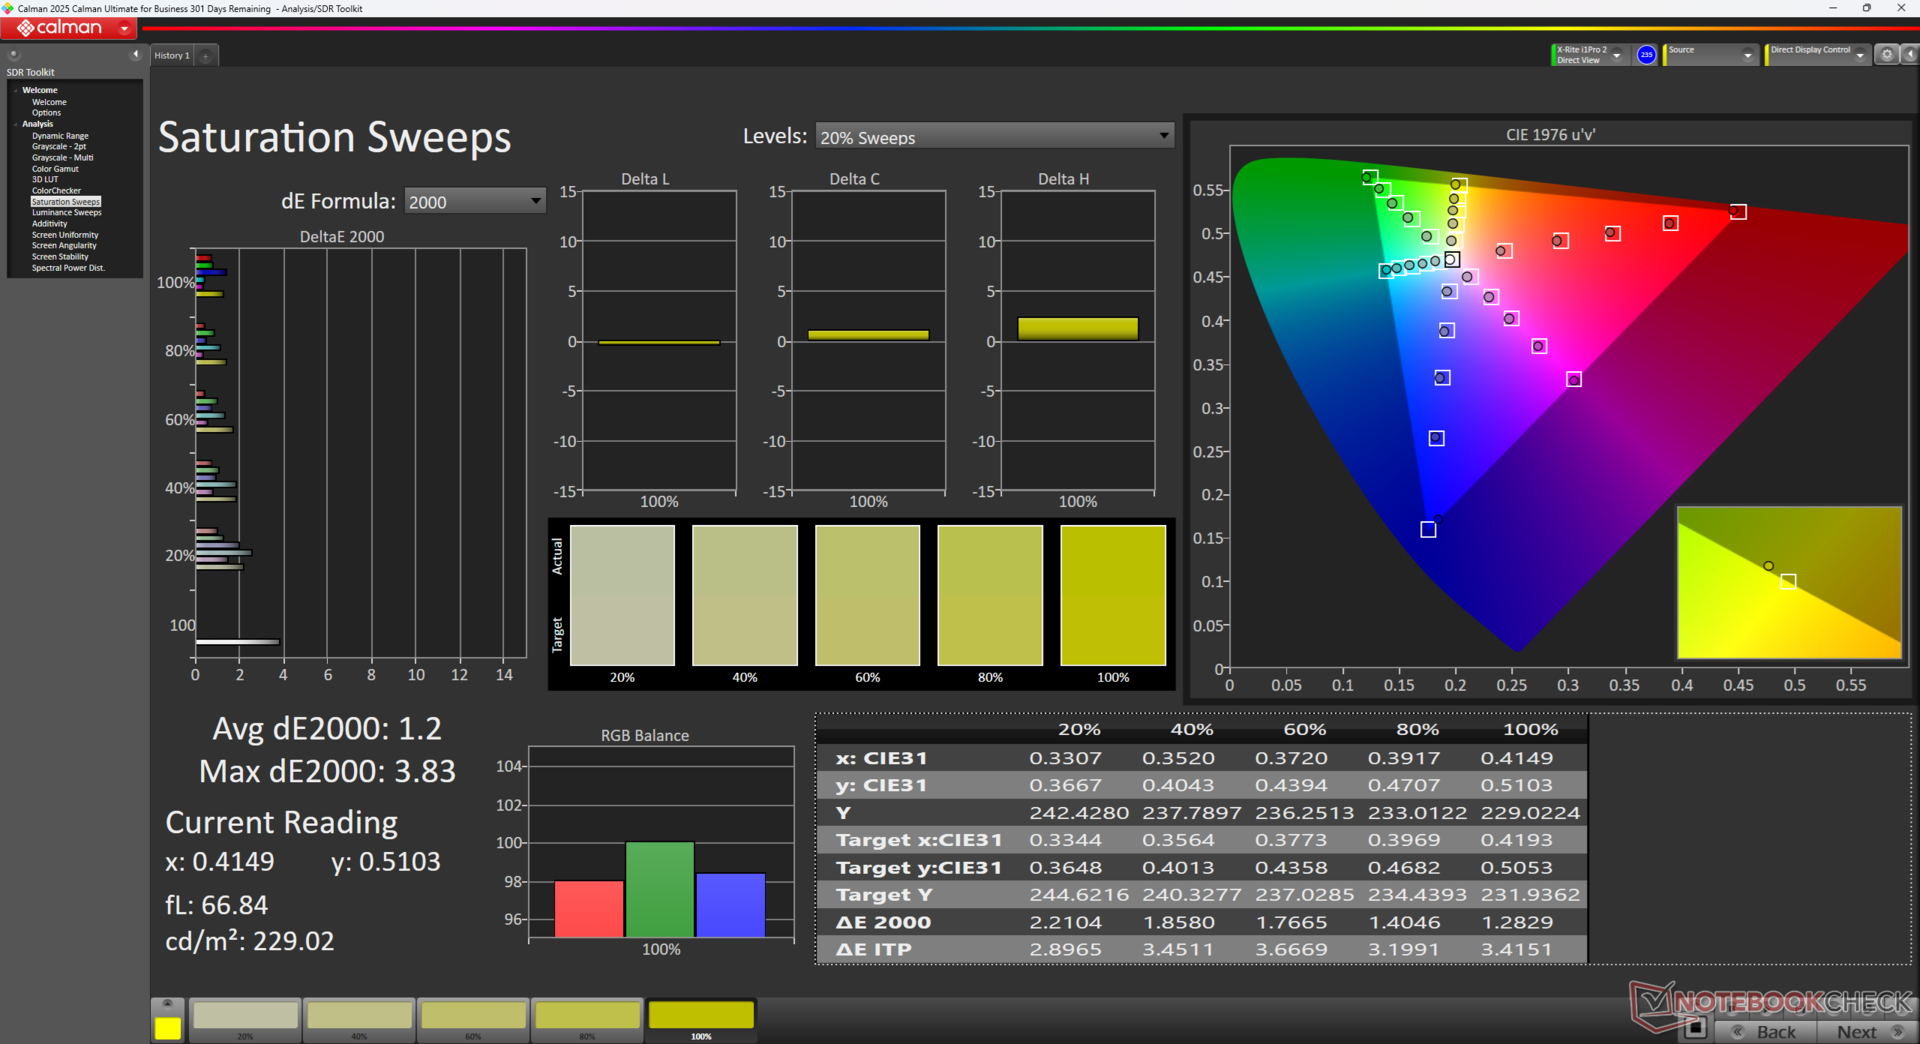
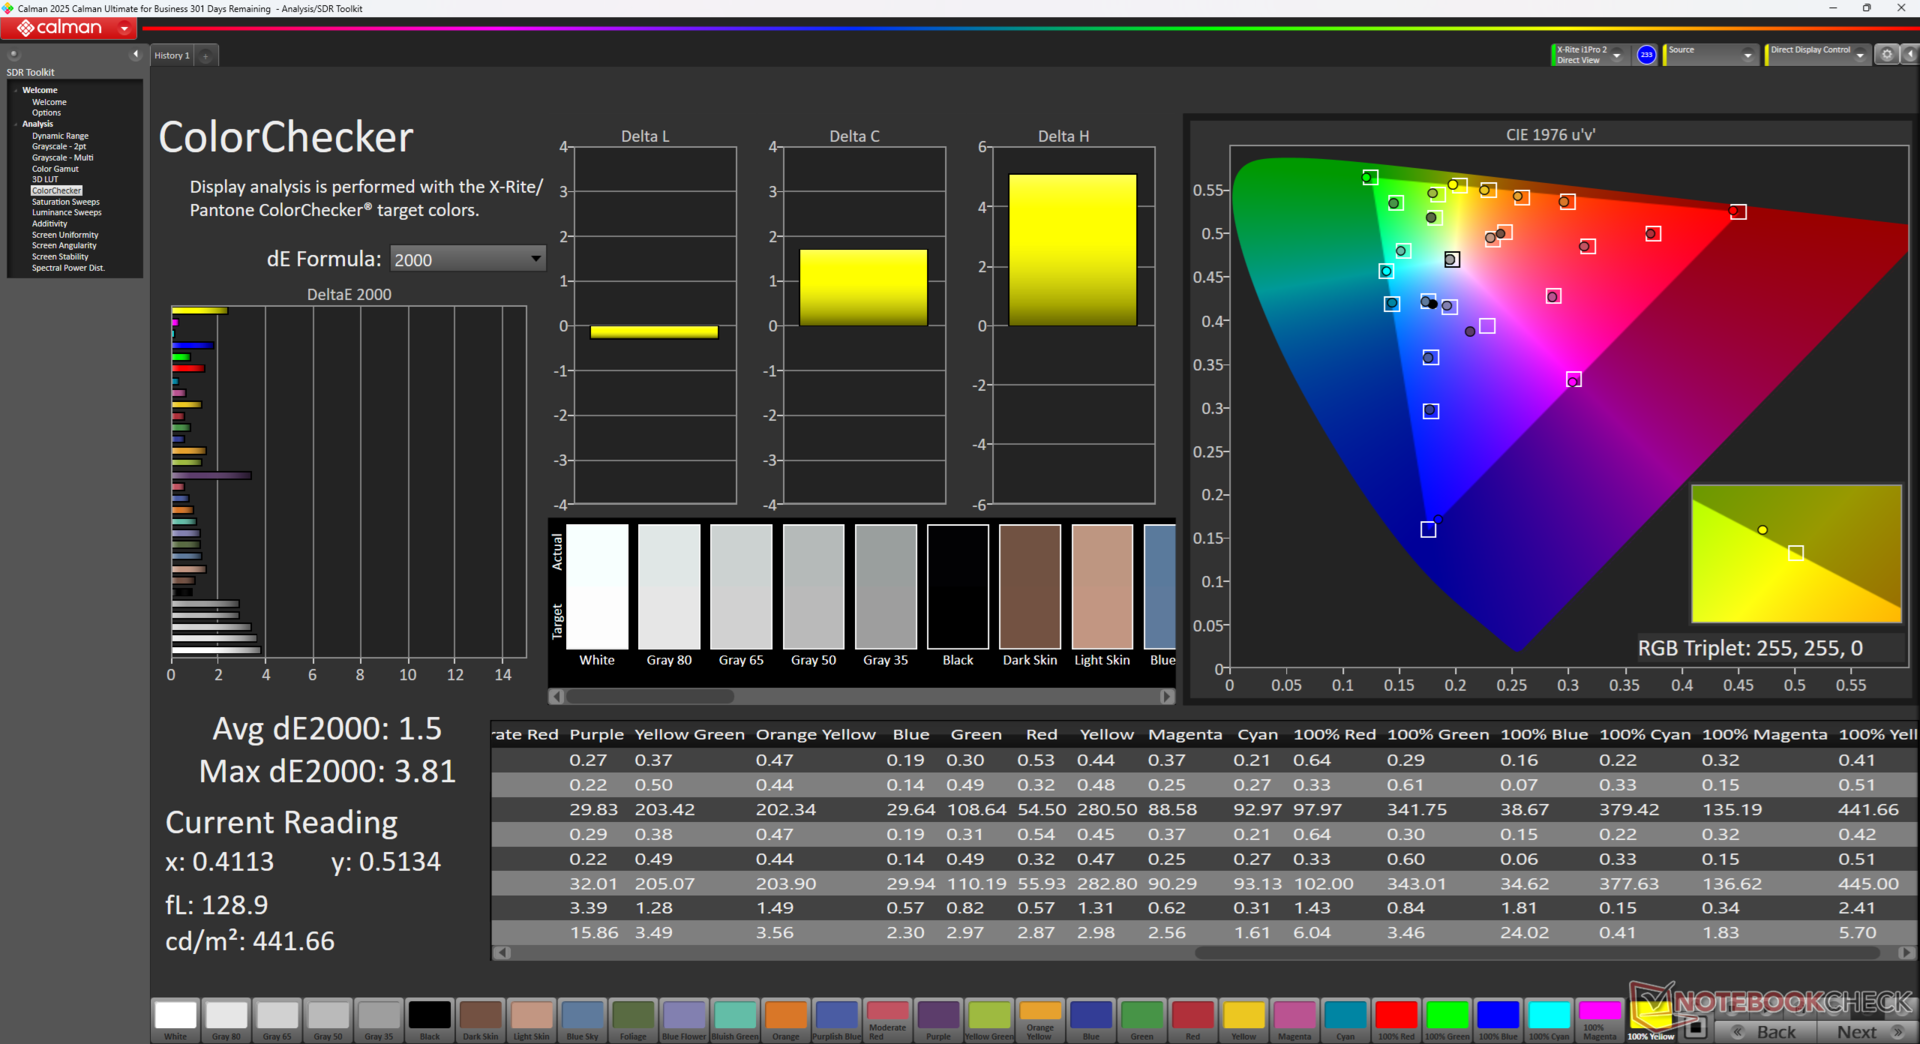
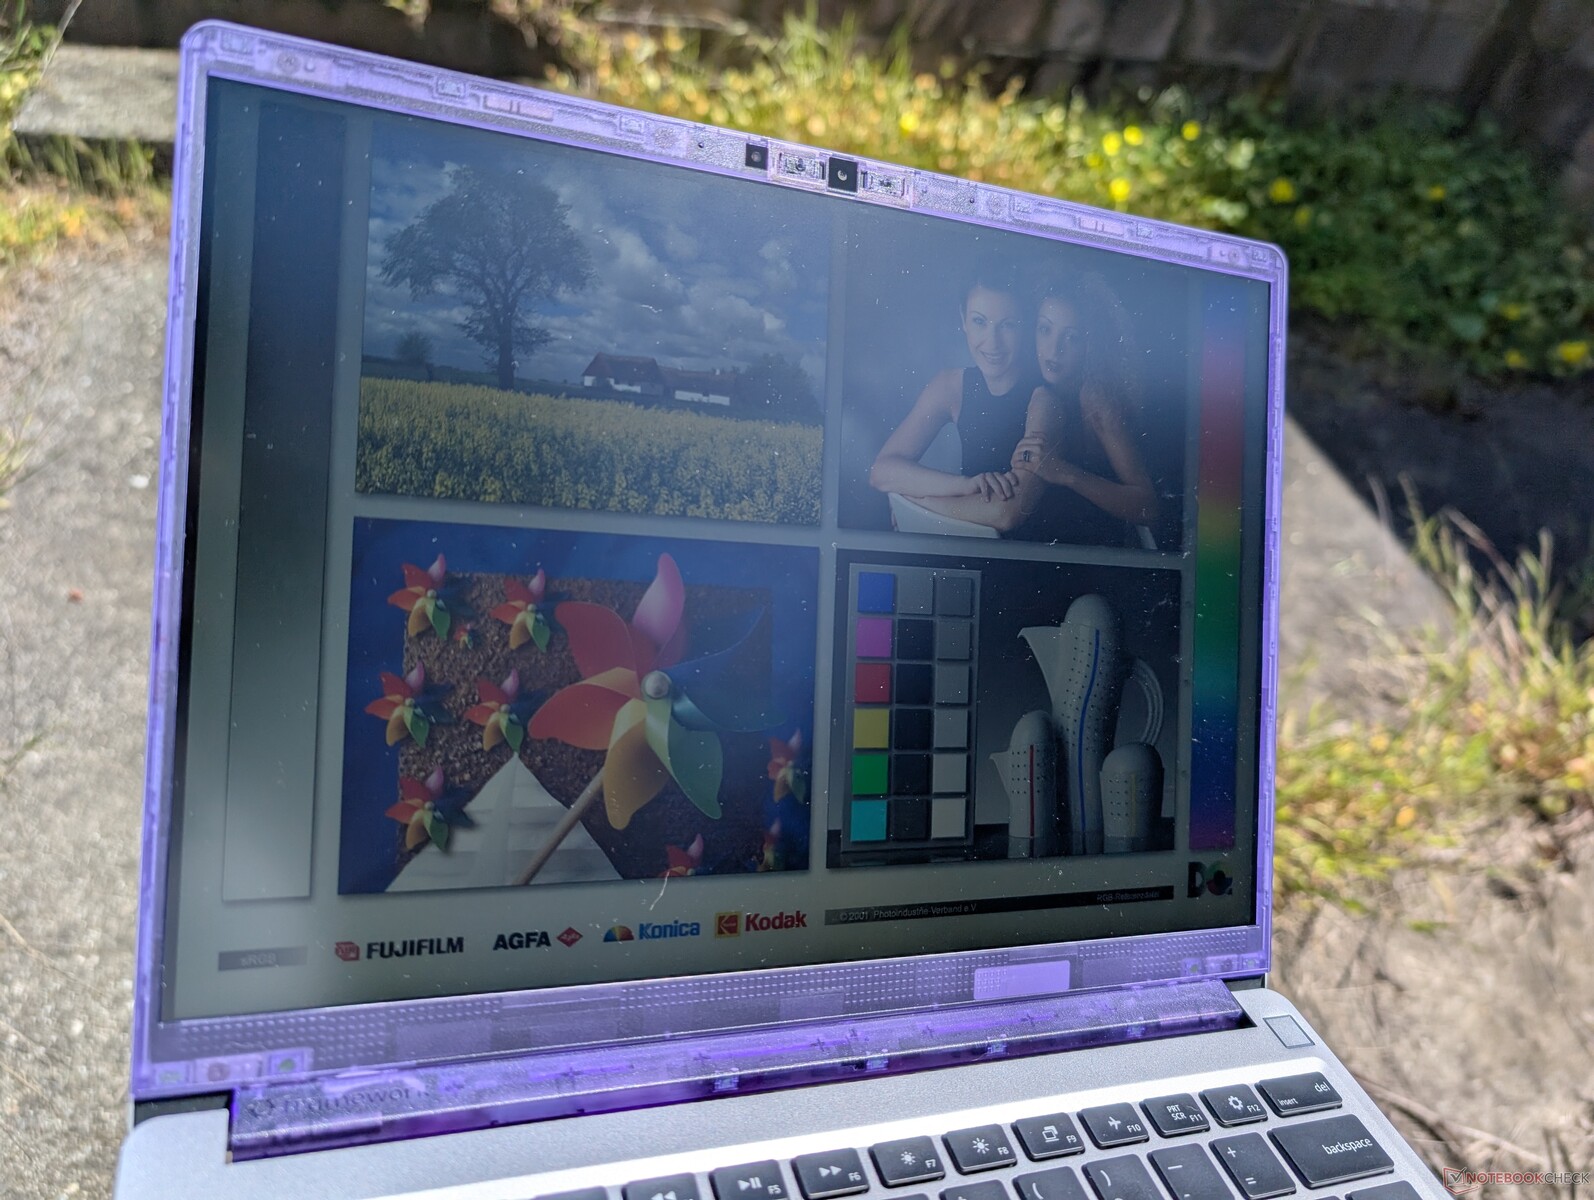
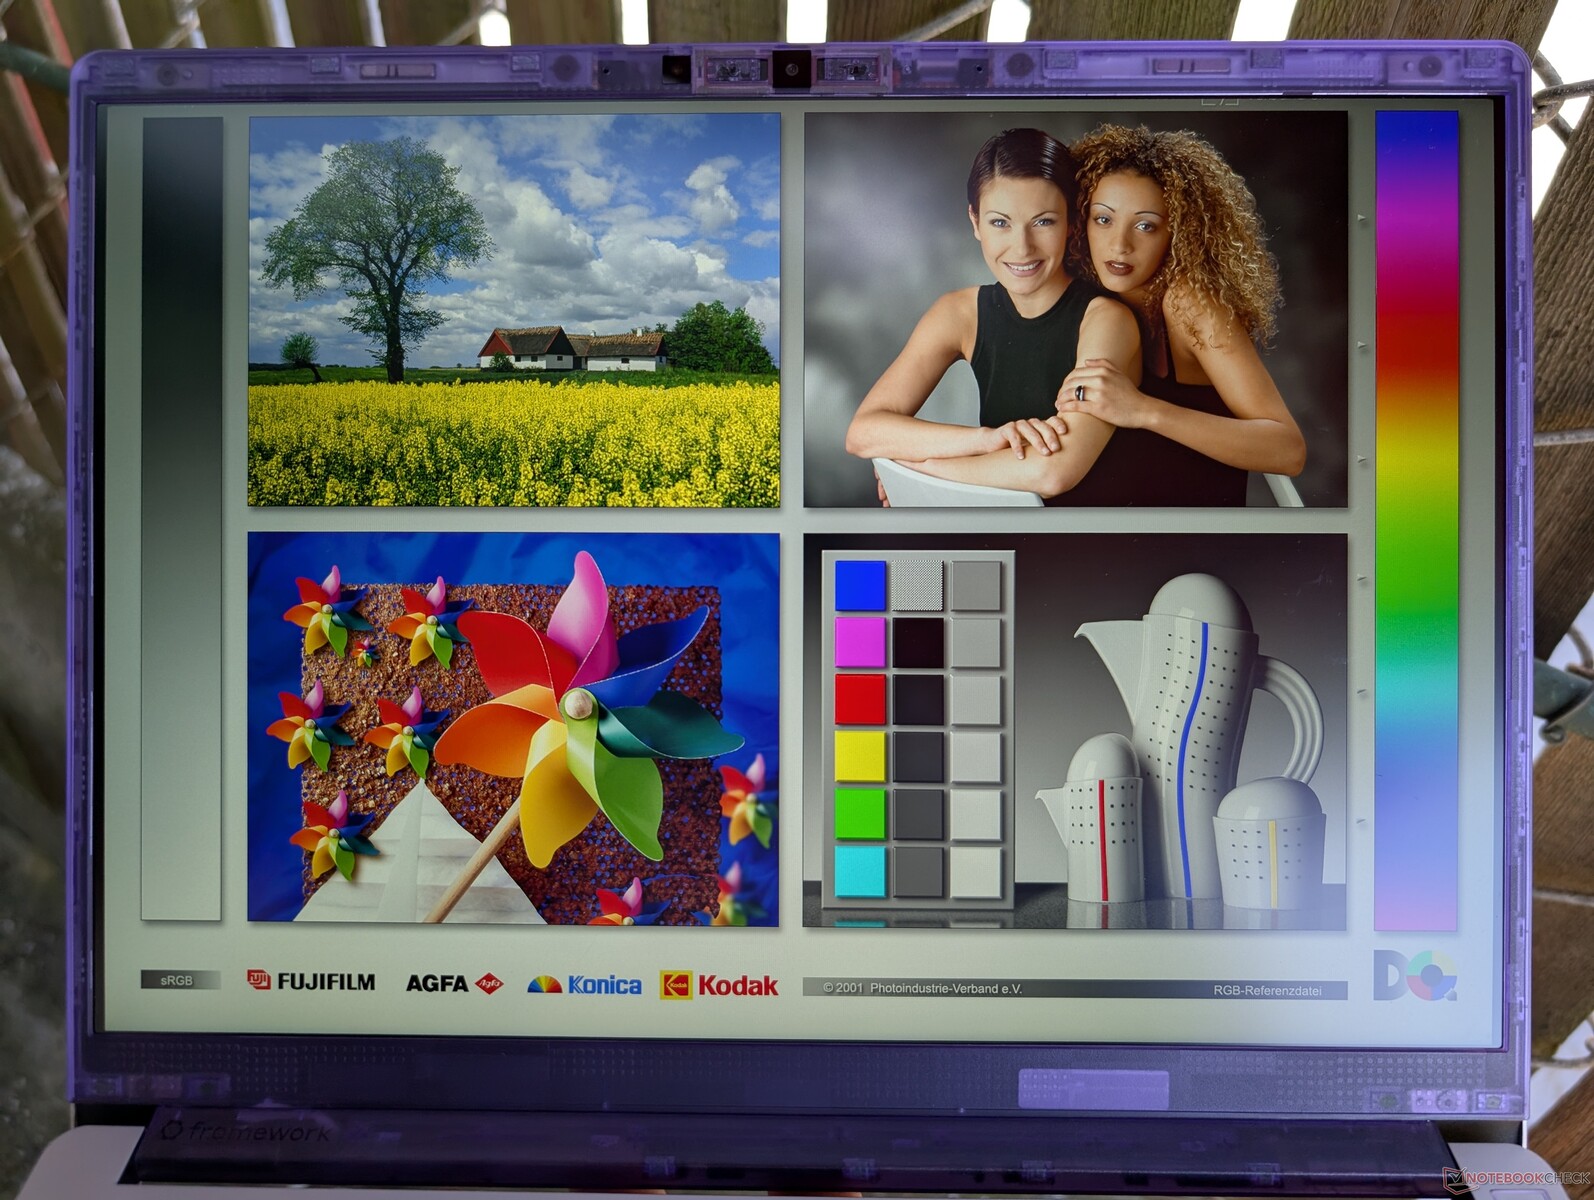
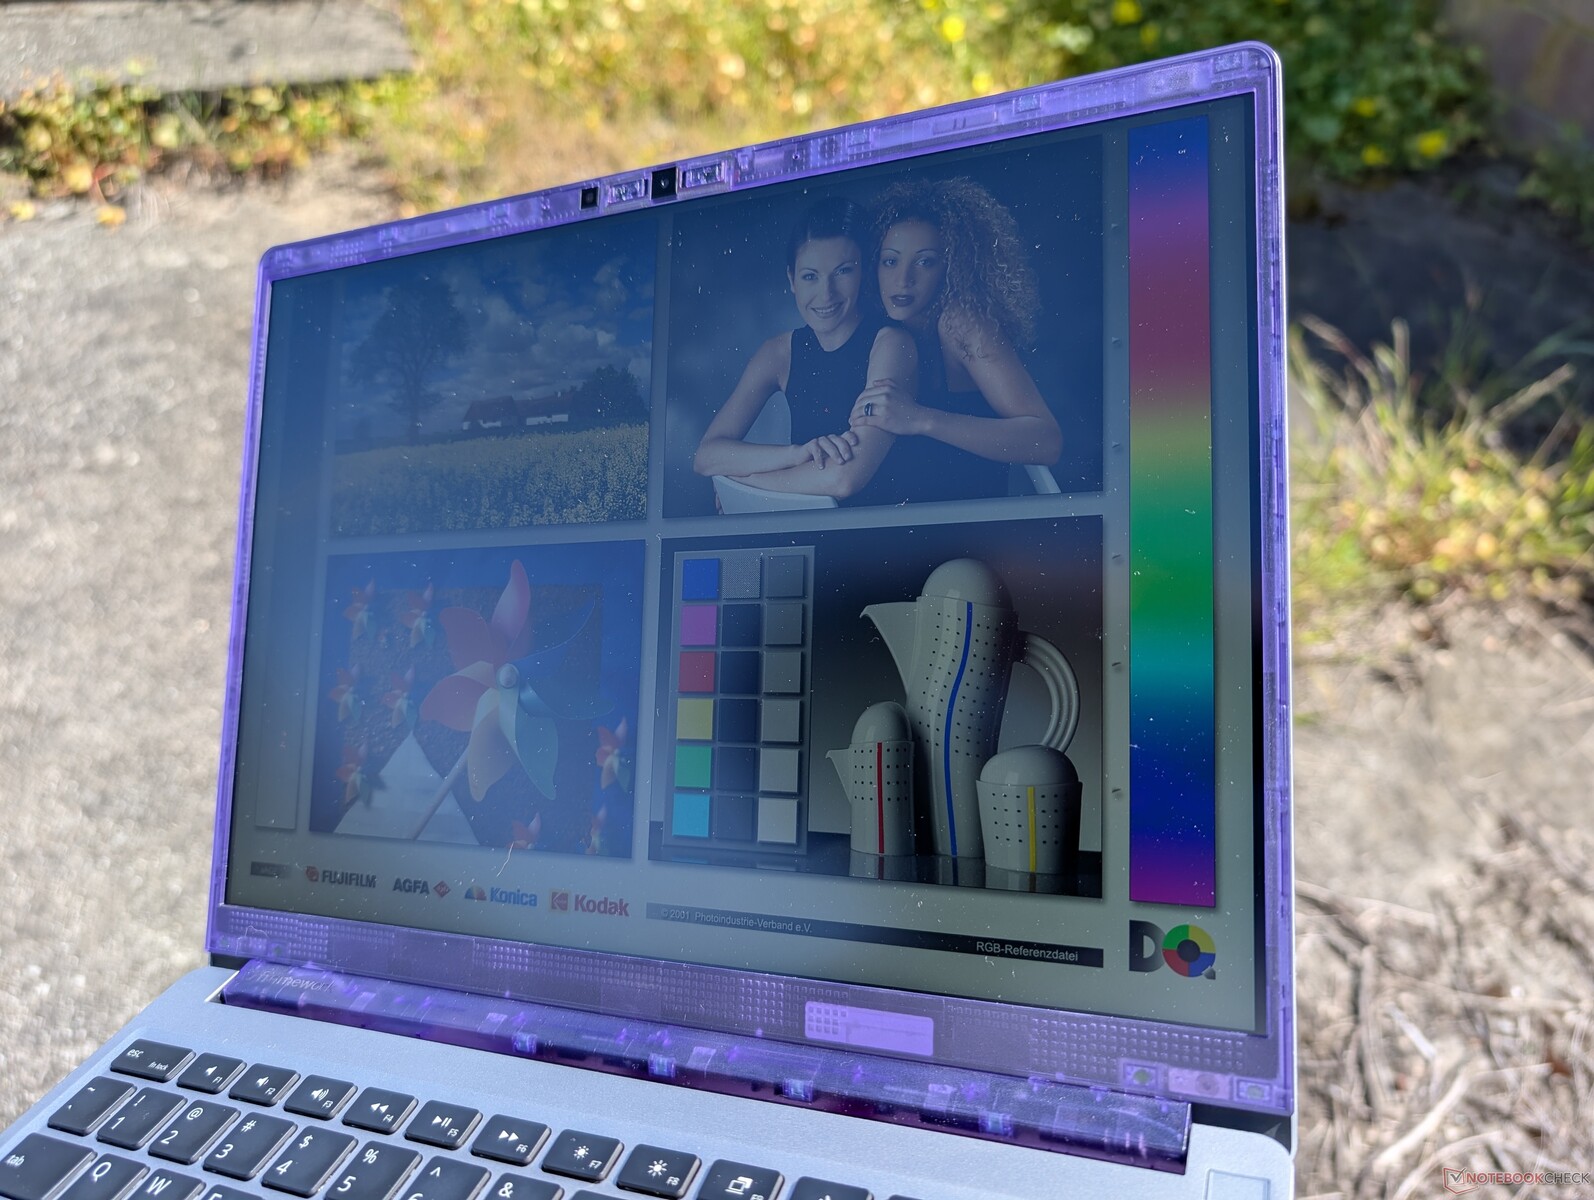
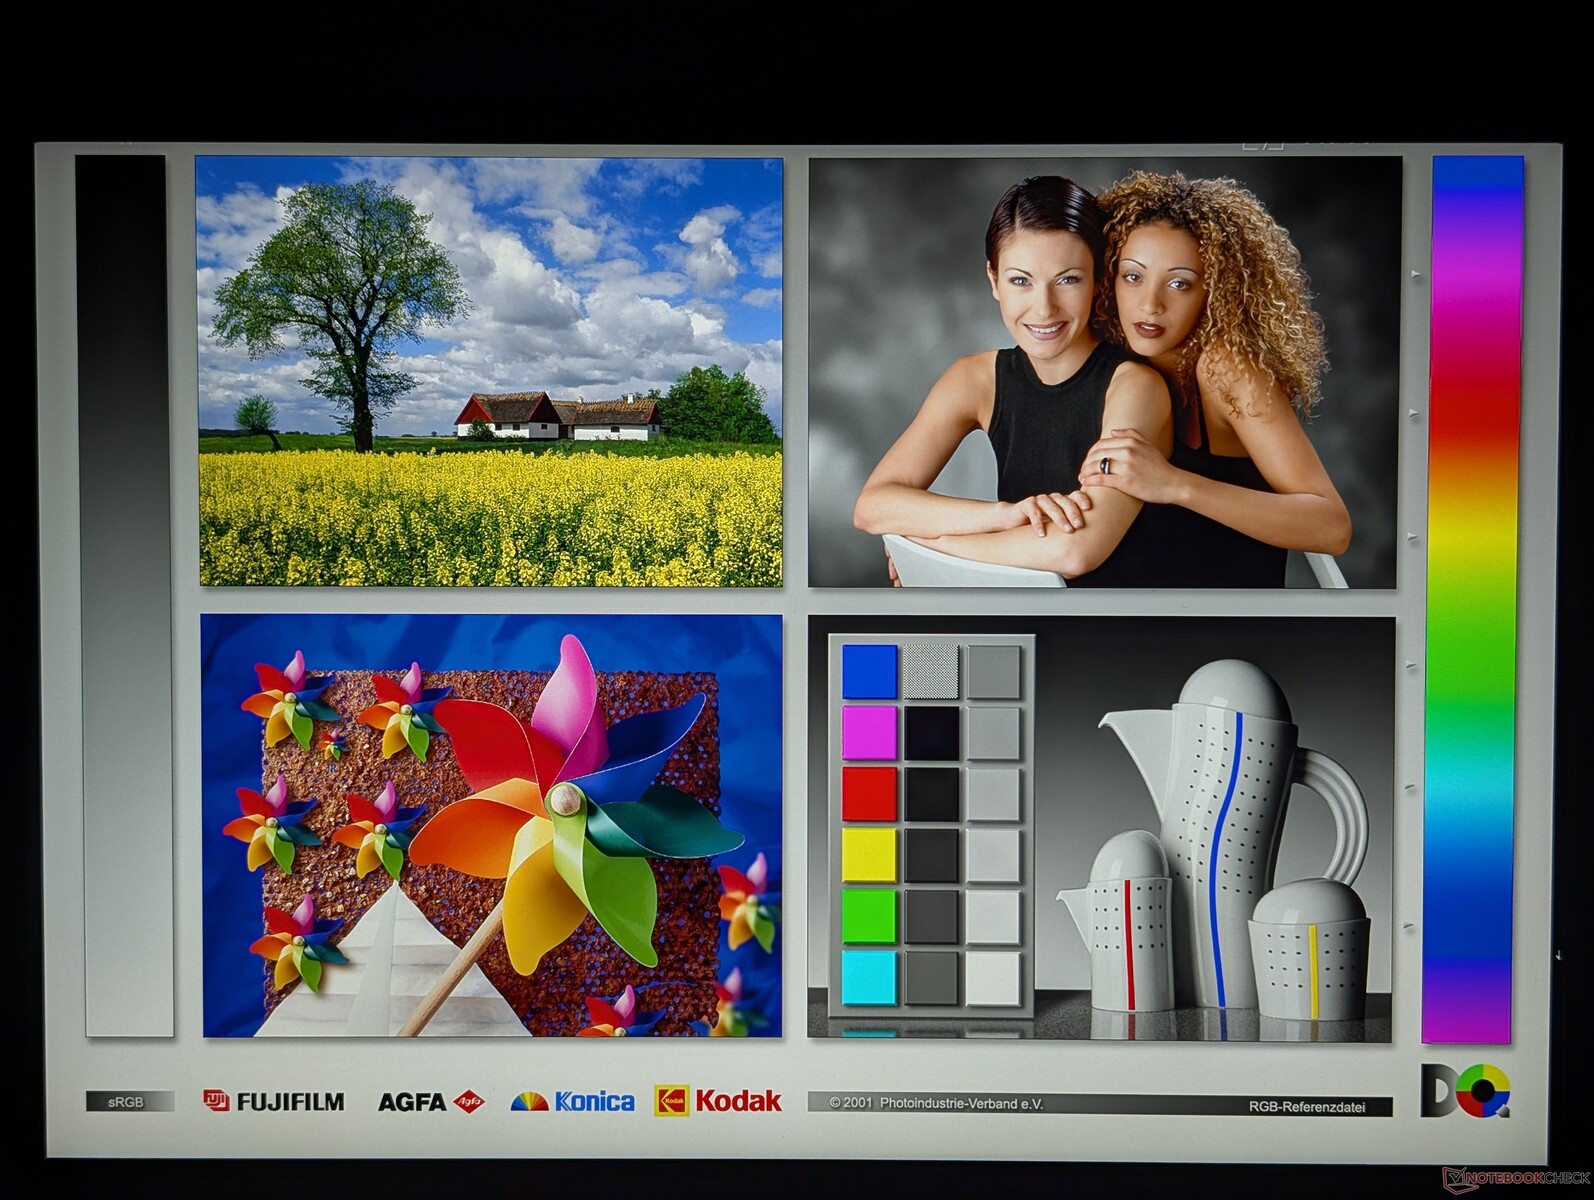
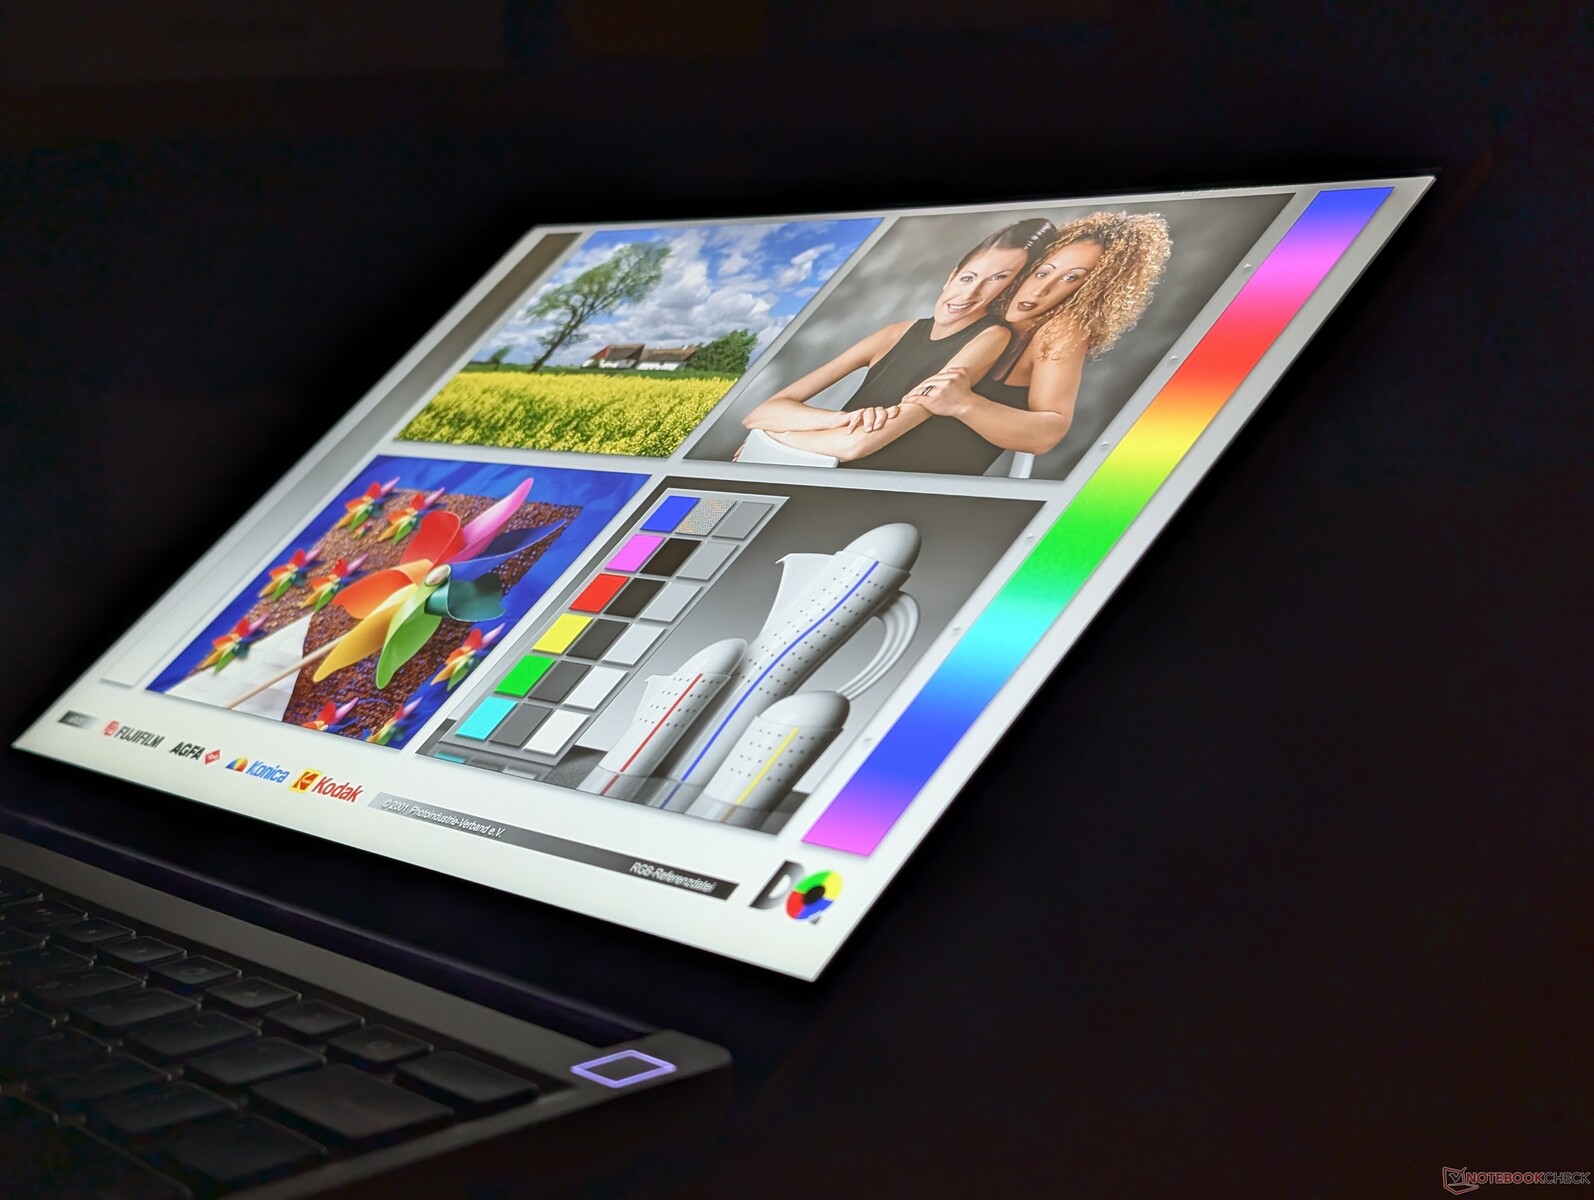
Wyświetlacz
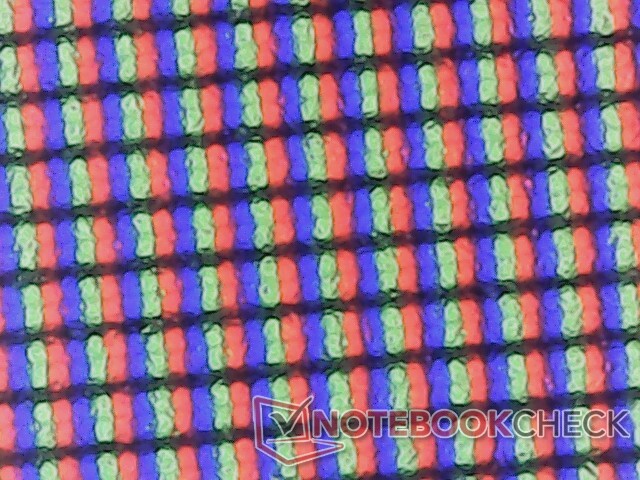
Framework wykorzystuje ten sam panel BOE NE135A1M-NY1 IPS, który znalazł się w zeszłorocznym modelu Intela dla tegorocznego odświeżenia AMD. Choć nadal jest to doskonały panel, miło byłoby zobaczyć opcje OLED lub kolory P3 dla tych, którzy ich potrzebują.
| |||||||||||||||||||||||||
rozświetlenie: 94 %
na akumulatorze: 529.9 cd/m²
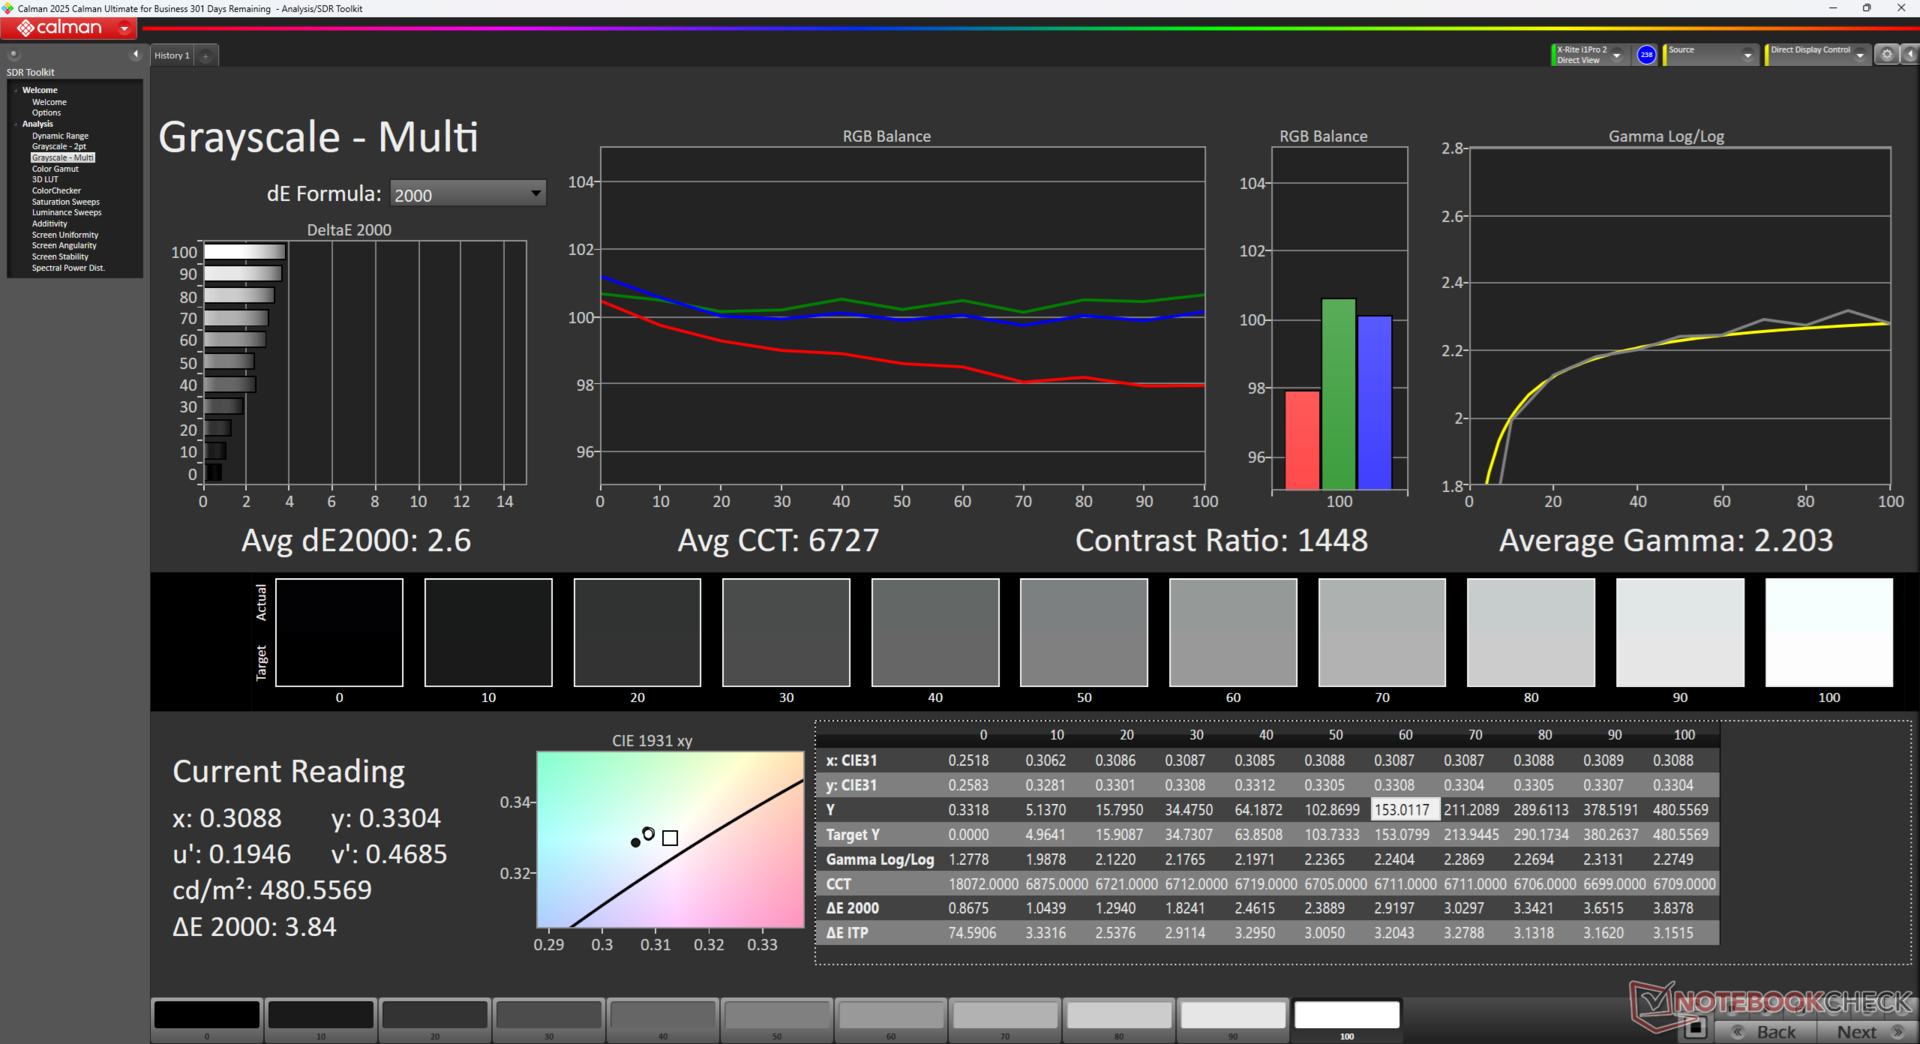
kontrast: 1766:1 (czerń: 0.3 cd/m²)
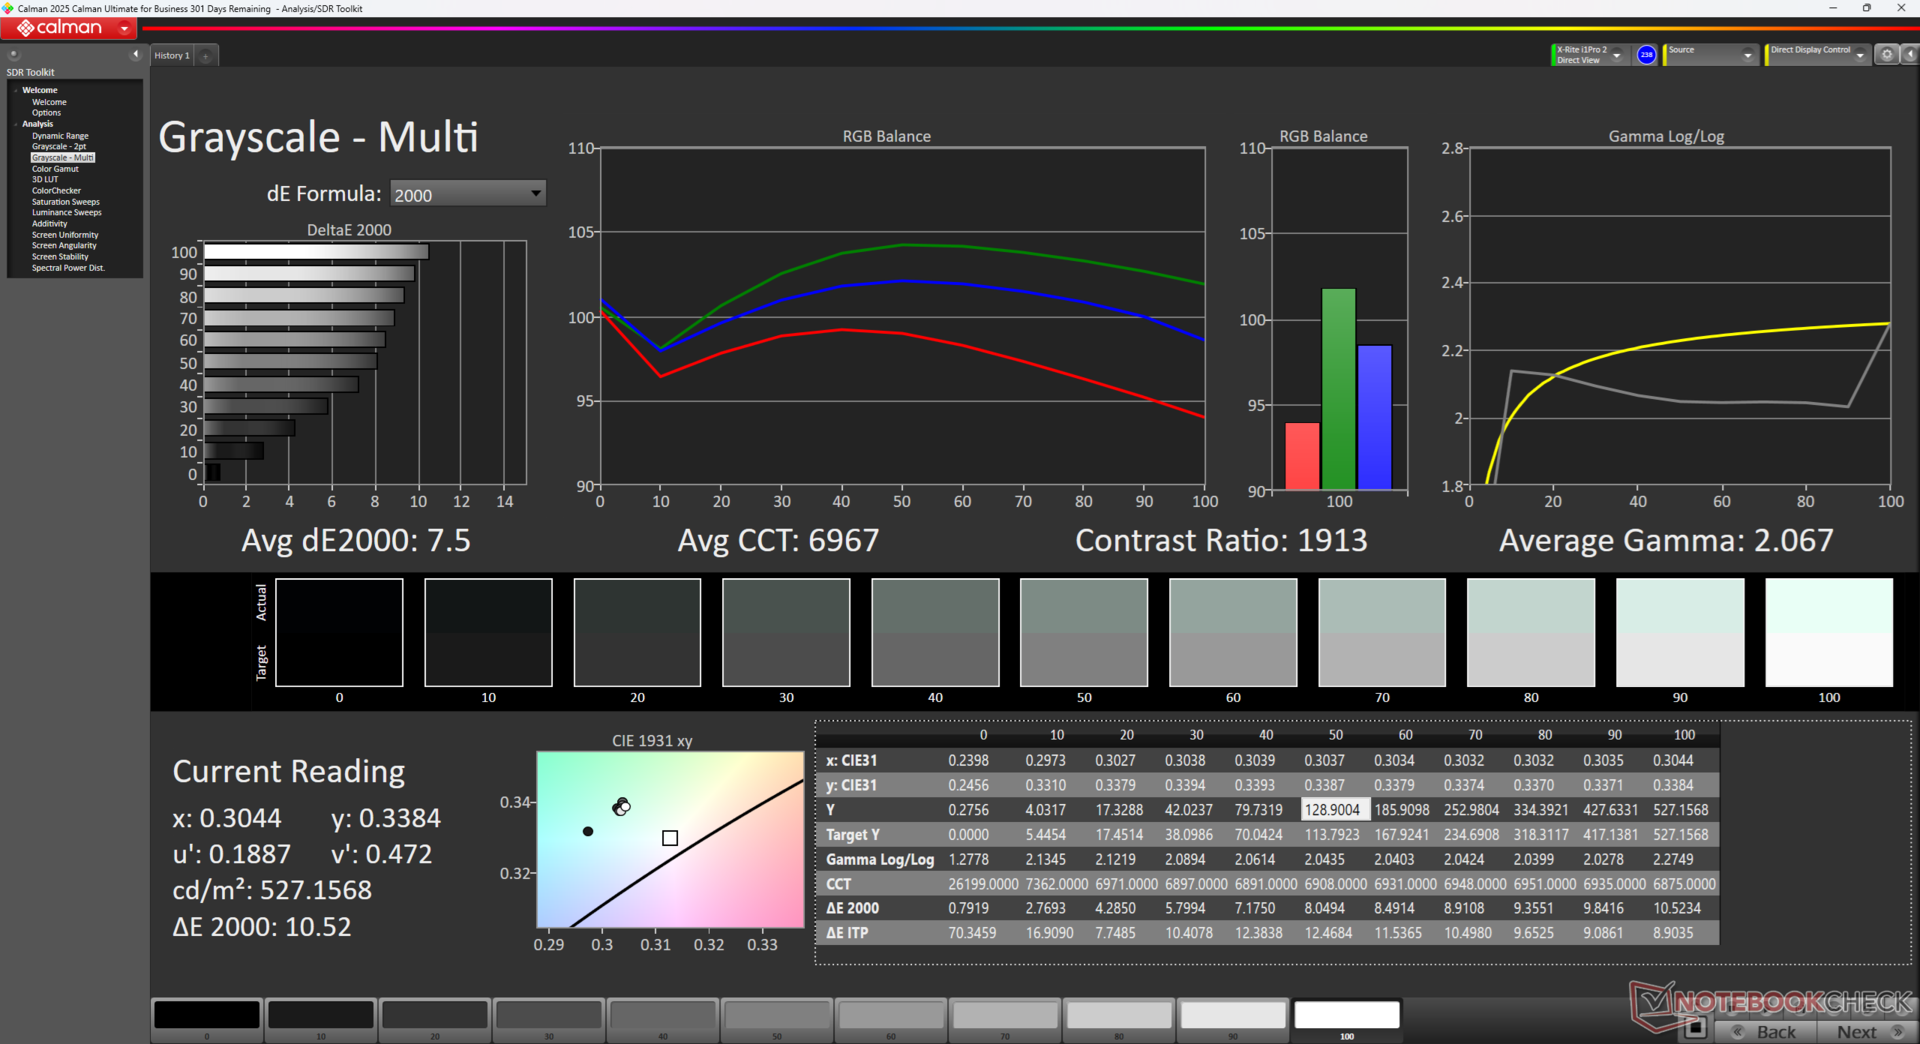
ΔE Color 5.7 | 0.5-29.43 Ø4.87, calibrated: 1.5
ΔE Greyscale 7.5 | 0.5-98 Ø5.1
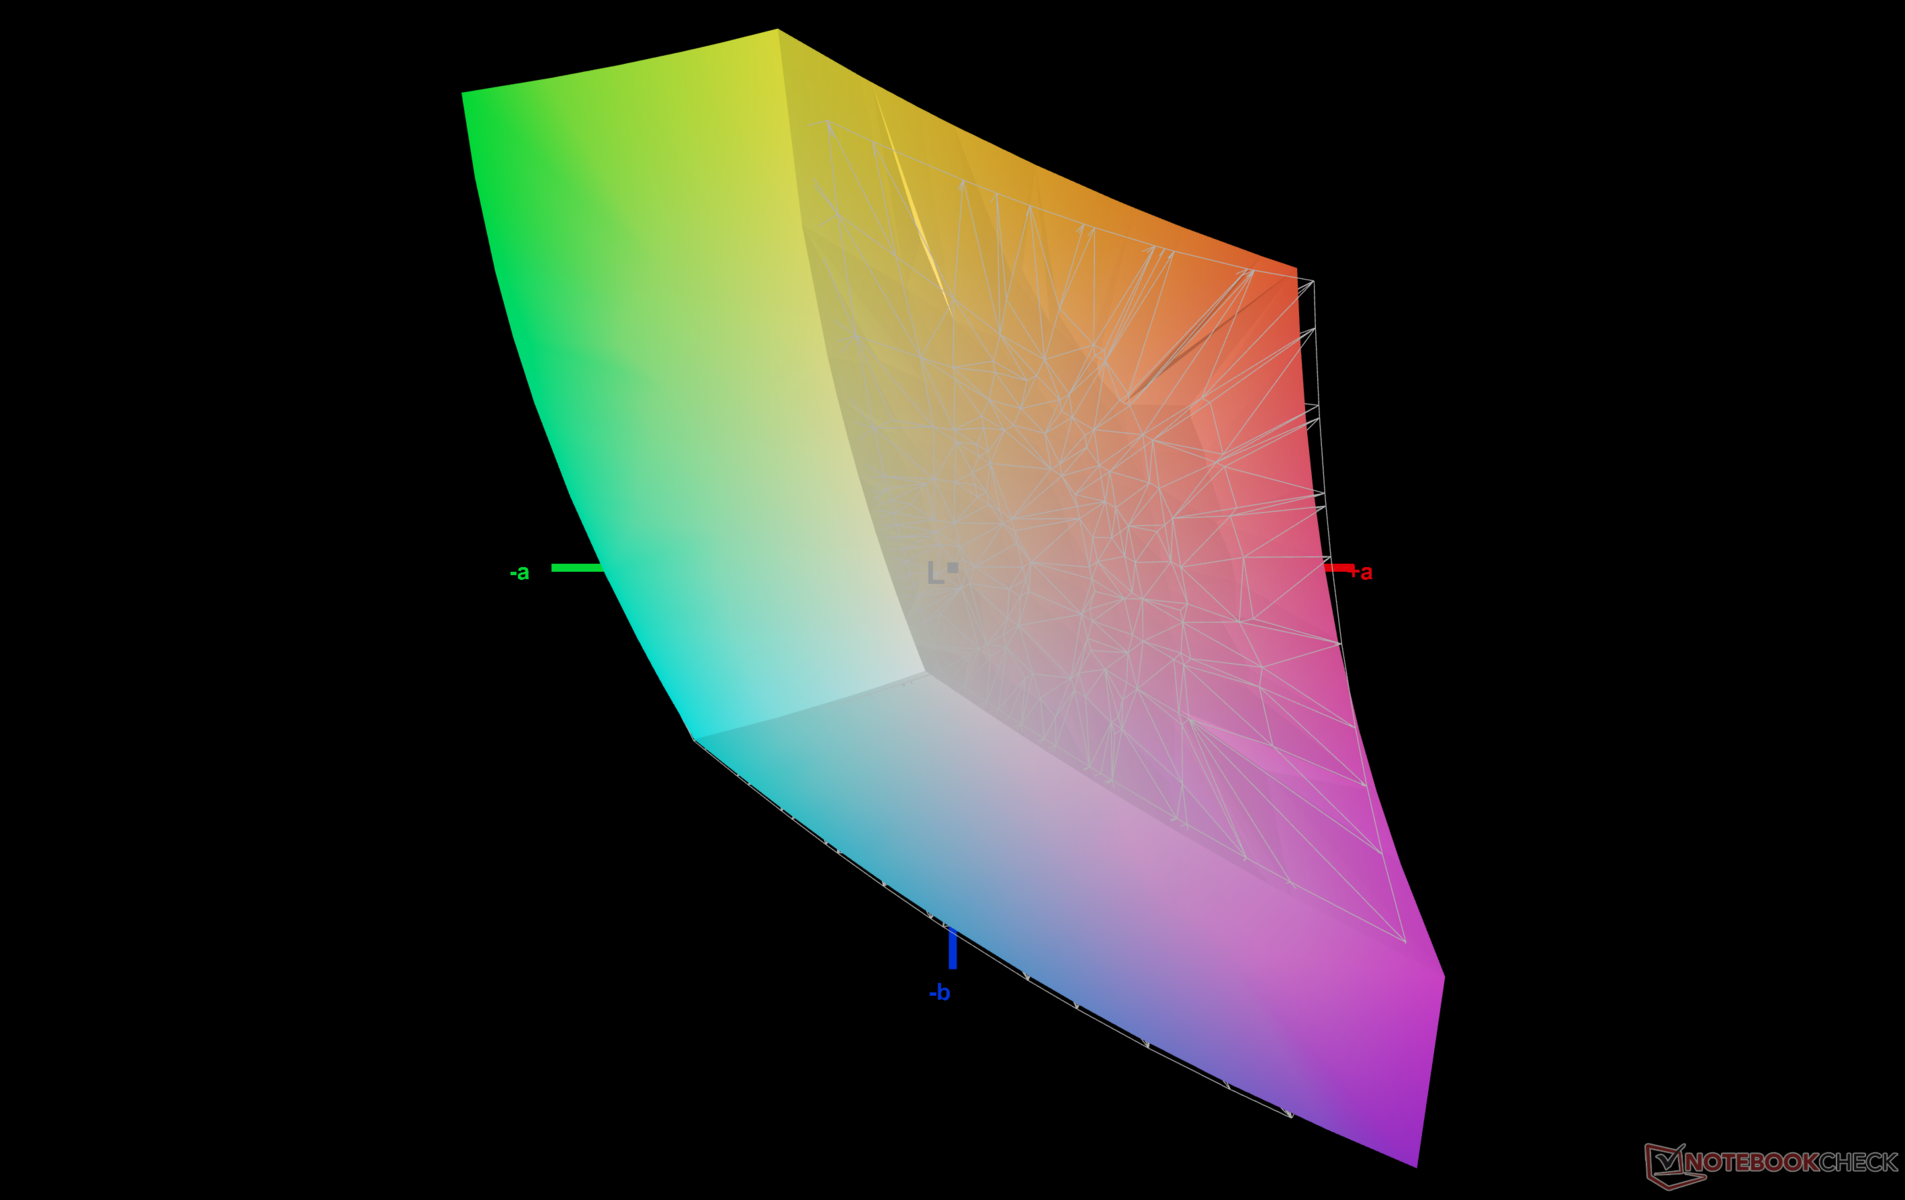
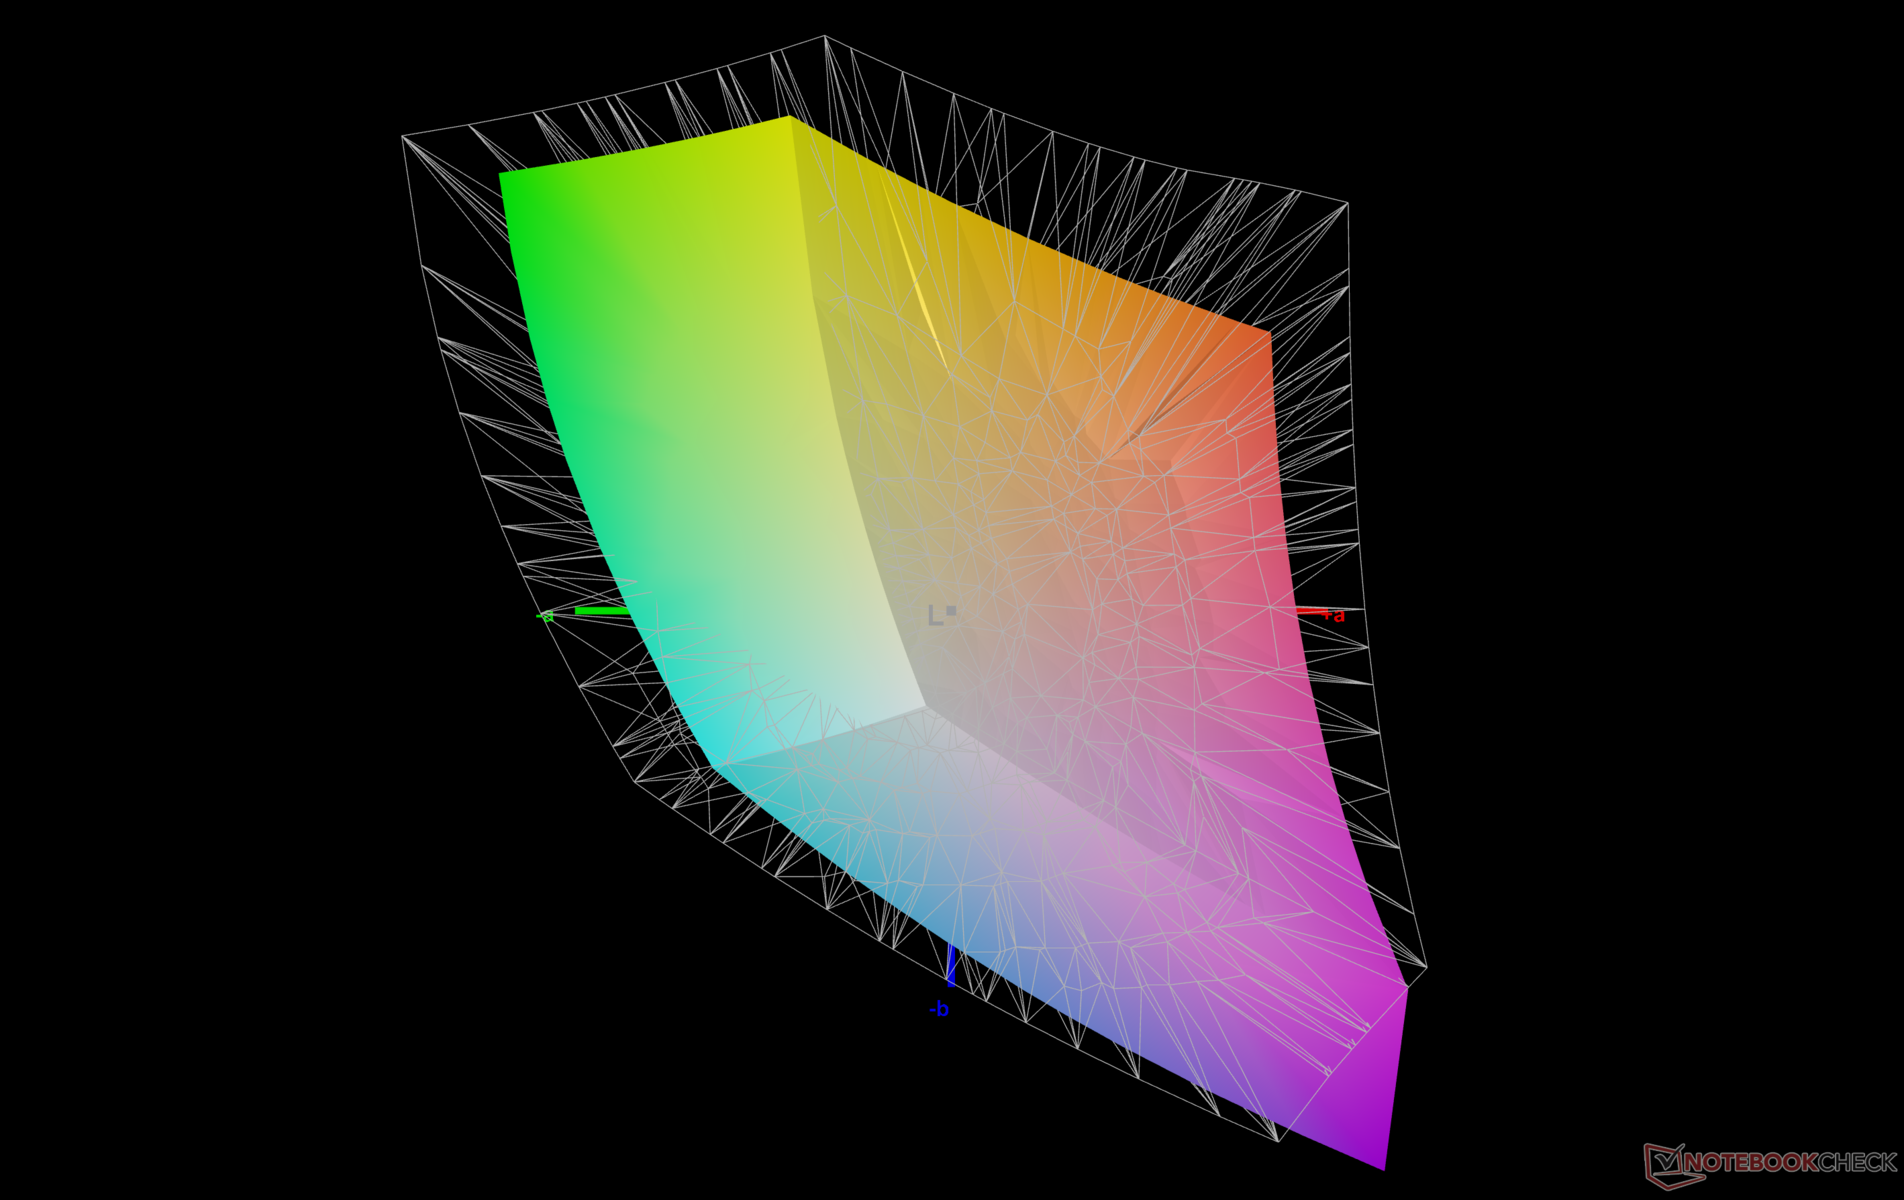
70.8% AdobeRGB 1998 (Argyll 2.2.0 3D)
95.9% sRGB (Argyll 2.2.0 3D)
71.9% Display P3 (Argyll 2.2.0 3D)
Gamma: 2.07
| Framework Laptop 13.5 Ryzen AI 9 HX 370 BOE NE135A1M-NY1, IPS, 2880x1920, 13.5", 120 Hz | Framework Laptop 13.5 Core Ultra 7 155H BOE NE135A1M-NY1, IPS, 2880x1920, 13.5", 120 Hz | Dell Pro 13 Premium PA13250 B133UAN (AUOBEB0), IPS, 1920x1200, 13.3", 60 Hz | MSI Summit E13 AI Evo A1MTG CMN13C6, IPS, 1920x1200, 13.3", 60 Hz | HP EliteBook x360 830 G10 7L7U1ET LGD06E5, IPS LED, 1920x1200, 13.3", Hz | Lenovo ThinkPad Z13 Gen 2 ATNA33AA02-0, OLED, 2880x1800, 13.3", 60 Hz | |
|---|---|---|---|---|---|---|
| Display | 2% | 4% | 2% | -8% | 27% | |
| Display P3 Coverage | 71.9 | 72.8 1% | 74.3 3% | 71.6 0% | 63.2 -12% | 99.7 39% |
| sRGB Coverage | 95.9 | 98.6 3% | 99.1 3% | 98.6 3% | 92.7 -3% | 100 4% |
| AdobeRGB 1998 Coverage | 70.8 | 72.9 3% | 75.9 7% | 73.1 3% | 65.1 -8% | 97.3 37% |
| Response Times | -6% | -25% | -54% | -10% | 93% | |
| Response Time Grey 50% / Grey 80% * | 40 ? | 41.9 ? -5% | 52.8 ? -32% | 60 ? -50% | 39.8 ? -0% | 2.1 ? 95% |
| Response Time Black / White * | 22.3 ? | 23.7 ? -6% | 26.4 ? -18% | 35.1 ? -57% | 26.8 ? -20% | 2.2 ? 90% |
| PWM Frequency | 60.1 ? | |||||
| Screen | 5% | 13% | 18% | 9% | 31% | |
| Brightness middle | 529.9 | 498.5 -6% | 456 -14% | 405.2 -24% | 394 -26% | 372 -30% |
| Brightness | 506 | 464 -8% | 460 -9% | 372 -26% | 372 -26% | 375 -26% |
| Brightness Distribution | 94 | 86 -9% | 89 -5% | 88 -6% | 84 -11% | 99 5% |
| Black Level * | 0.3 | 0.36 -20% | 0.23 23% | 0.34 -13% | 0.17 43% | |
| Contrast | 1766 | 1385 -22% | 1983 12% | 1192 -33% | 2318 31% | |
| Colorchecker dE 2000 * | 5.7 | 4.27 25% | 3.3 42% | 2.4 58% | 4.1 28% | 0.88 85% |
| Colorchecker dE 2000 max. * | 10.6 | 7.08 33% | 6.47 39% | 3.56 66% | 8.3 22% | 3.22 70% |
| Colorchecker dE 2000 calibrated * | 1.5 | 1.26 16% | 1.7 -13% | 0.54 64% | ||
| Greyscale dE 2000 * | 7.5 | 4.7 37% | 4.35 42% | 1.9 75% | 6.6 12% | 1.2 84% |
| Gamma | 2.07 106% | 2.09 105% | 2.51 88% | 2 110% | 2.17 101% | 2.18 101% |
| CCT | 6967 93% | 7417 88% | 6215 105% | 6503 100% | 6019 108% | 6326 103% |
| Całkowita średnia (program / ustawienia) | 0% /
3% | -3% /
6% | -11% /
4% | -3% /
2% | 50% /
41% |
* ... im mniej tym lepiej
Wyświetlacz nie jest fabrycznie skalibrowany. Zalecamy zastosowanie naszego skalibrowanego profilu ICM powyżej, aby uzyskać dokładniejsze kolory sRGB.
Wyświetl czasy reakcji
| ↔ Czas reakcji od czerni do bieli | ||
|---|---|---|
| 22.3 ms ... wzrost ↗ i spadek ↘ łącznie | ↗ 11.1 ms wzrost | 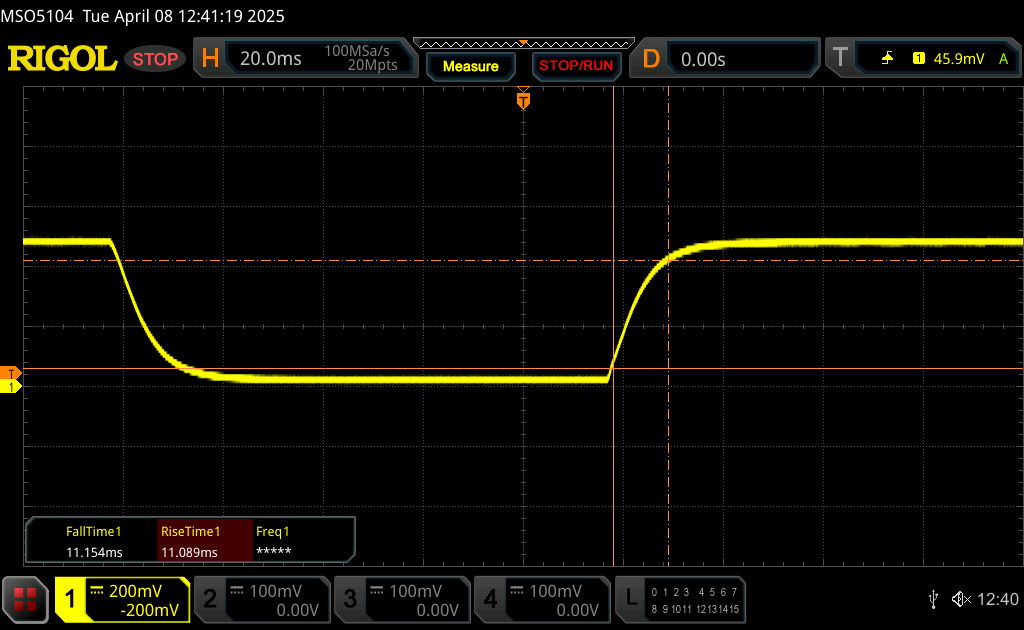 |
| ↘ 11.2 ms upadek | ||
| W naszych testach ekran wykazuje dobry współczynnik reakcji, ale może być zbyt wolny dla graczy rywalizujących ze sobą. Dla porównania, wszystkie testowane urządzenia wahają się od 0.1 (minimum) do 240 (maksimum) ms. » 47 % wszystkich urządzeń jest lepszych. Oznacza to, że zmierzony czas reakcji jest zbliżony do średniej wszystkich testowanych urządzeń (20.8 ms). | ||
| ↔ Czas reakcji 50% szarości do 80% szarości | ||
| 40 ms ... wzrost ↗ i spadek ↘ łącznie | ↗ 18.2 ms wzrost | 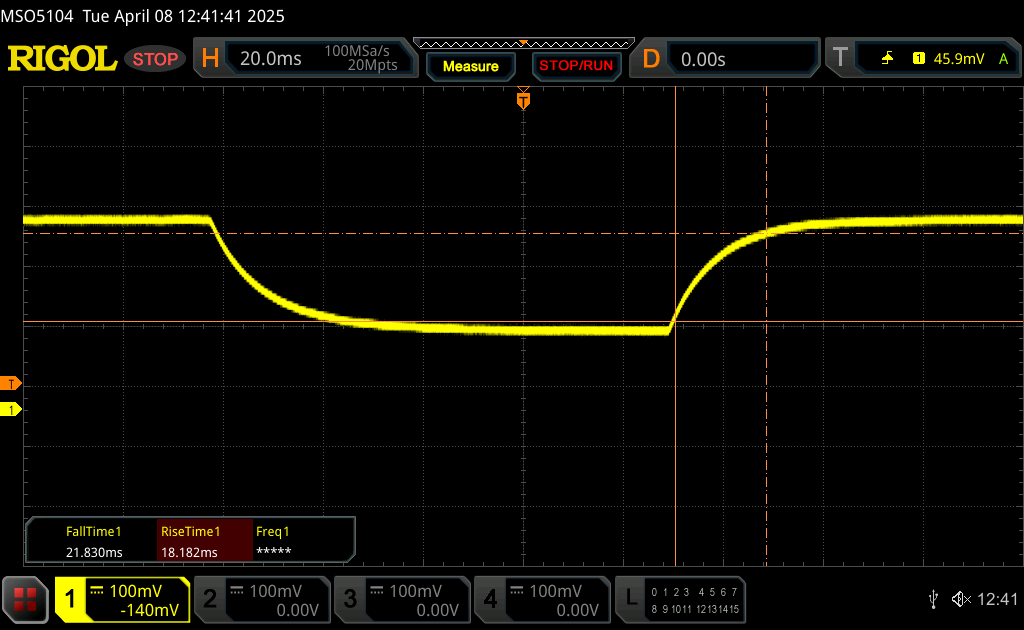 |
| ↘ 21.8 ms upadek | ||
| W naszych testach ekran wykazuje powolne tempo reakcji, co będzie niezadowalające dla graczy. Dla porównania, wszystkie testowane urządzenia wahają się od 0.165 (minimum) do 636 (maksimum) ms. » 58 % wszystkich urządzeń jest lepszych. Oznacza to, że zmierzony czas reakcji jest gorszy od średniej wszystkich testowanych urządzeń (32.5 ms). | ||
Migotanie ekranu / PWM (modulacja szerokości impulsu)
| Migotanie ekranu/nie wykryto PWM | 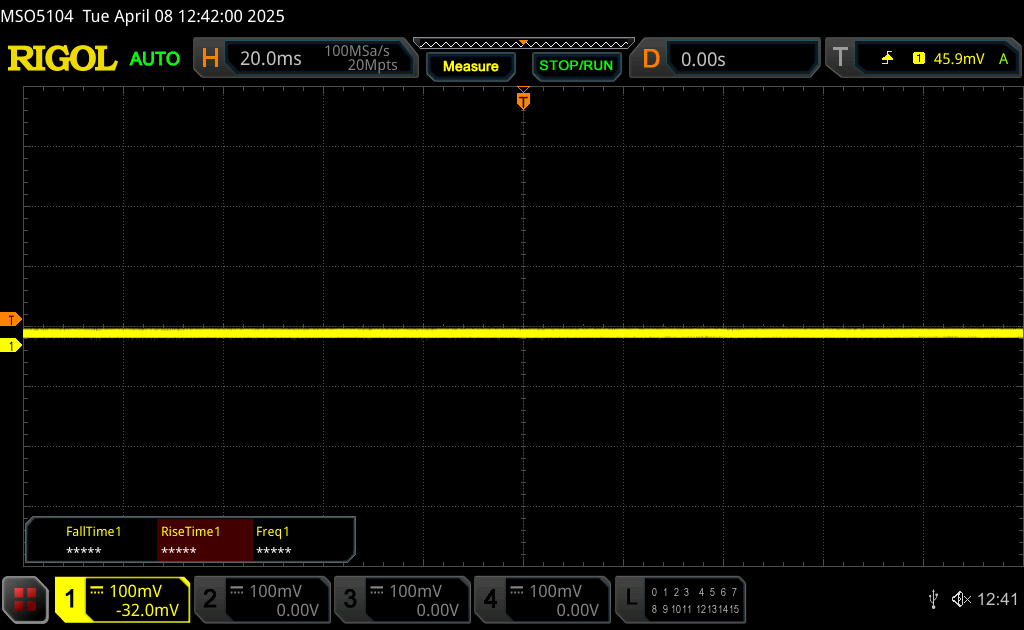 | ||
Dla porównania: 53 % wszystkich testowanych urządzeń nie używa PWM do przyciemniania wyświetlacza. Jeśli wykryto PWM, zmierzono średnio 8516 (minimum: 5 - maksimum: 343500) Hz. | |||

Wydajność
Warunki testowania
Przed uruchomieniem poniższych testów porównawczych ustawiliśmy system Windows w tryb wydajności.
Procesor
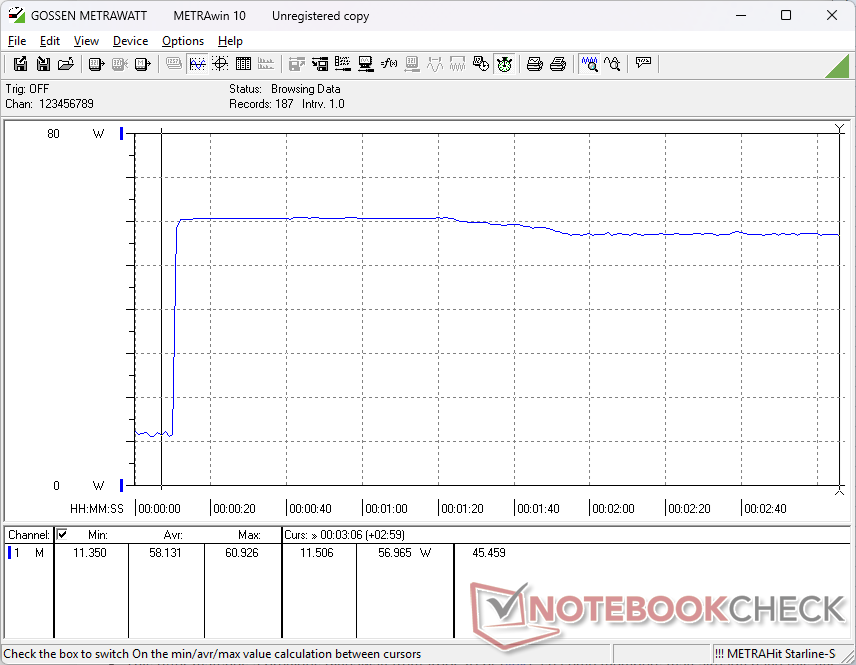
Ryzen Ryzen AI 9 HX 370 jest od 30 do 35 procent szybszy niż zeszłoroczny Intel Core Ultra 7 155H jeśli chodzi o obciążenia wielowątkowe. Zrównoważona wydajność mogłaby być jednak lepsza, ponieważ wyniki powoli spadałyby nawet o 15 procent w czasie wykonywania naszego testu pętli CineBench R15 xT, jak pokazano na poniższym wykresie. Niemniej jednak jest on nadal szybszy niż poprzednie konfiguracje Laptopa 13.5, nawet po uwzględnieniu niewielkiego dławienia.
Cinebench R15 Multi Loop
Cinebench R23: Multi Core | Single Core
Cinebench R20: CPU (Multi Core) | CPU (Single Core)
Cinebench R15: CPU Multi 64Bit | CPU Single 64Bit
Blender: v2.79 BMW27 CPU
7-Zip 18.03: 7z b 4 | 7z b 4 -mmt1
Geekbench 6.4: Multi-Core | Single-Core
Geekbench 5.5: Multi-Core | Single-Core
HWBOT x265 Benchmark v2.2: 4k Preset
LibreOffice : 20 Documents To PDF
R Benchmark 2.5: Overall mean
| CPU Performance Rating | |
| Przeciętny AMD Ryzen AI 9 HX 370 | |
| Framework Laptop 13.5 Ryzen AI 9 HX 370 | |
| Framework Laptop 13.5 13th Gen Intel -2! | |
| Framework Laptop 13.5 Ryzen 7 7840U | |
| Framework Laptop 13.5 Core Ultra 7 155H | |
| Dell XPS 13 Plus 9320 Core i7-1360P -2! | |
| Dell Pro 13 Premium PA13250 | |
| MSI Summit E13 AI Evo A1MTG | |
| Framework Laptop 13.5 12th Gen Intel -2! | |
| HP Dragonfly G4 -2! | |
| Dell Latitude 13 7350 | |
| Framework Laptop 13.5 -4! | |
| Cinebench R23 / Multi Core | |
| Przeciętny AMD Ryzen AI 9 HX 370 (10435 - 23805, n=24) | |
| Framework Laptop 13.5 Ryzen AI 9 HX 370 | |
| Framework Laptop 13.5 Ryzen 7 7840U | |
| Framework Laptop 13.5 Core Ultra 7 155H | |
| Framework Laptop 13.5 13th Gen Intel | |
| MSI Summit E13 AI Evo A1MTG | |
| Dell XPS 13 Plus 9320 Core i7-1360P | |
| Framework Laptop 13.5 12th Gen Intel | |
| Dell Pro 13 Premium PA13250 | |
| Dell Latitude 13 7350 | |
| HP Dragonfly G4 | |
| Framework Laptop 13.5 | |
| Cinebench R23 / Single Core | |
| Przeciętny AMD Ryzen AI 9 HX 370 (1921 - 2049, n=17) | |
| Framework Laptop 13.5 13th Gen Intel | |
| Dell Pro 13 Premium PA13250 | |
| Framework Laptop 13.5 Ryzen AI 9 HX 370 | |
| HP Dragonfly G4 | |
| Dell XPS 13 Plus 9320 Core i7-1360P | |
| Framework Laptop 13.5 Core Ultra 7 155H | |
| MSI Summit E13 AI Evo A1MTG | |
| Framework Laptop 13.5 Ryzen 7 7840U | |
| Framework Laptop 13.5 12th Gen Intel | |
| Dell Latitude 13 7350 | |
| Framework Laptop 13.5 | |
| Cinebench R20 / CPU (Multi Core) | |
| Przeciętny AMD Ryzen AI 9 HX 370 (6449 - 9250, n=16) | |
| Framework Laptop 13.5 Ryzen AI 9 HX 370 | |
| Framework Laptop 13.5 Ryzen 7 7840U | |
| Framework Laptop 13.5 Core Ultra 7 155H | |
| Framework Laptop 13.5 13th Gen Intel | |
| MSI Summit E13 AI Evo A1MTG | |
| Dell XPS 13 Plus 9320 Core i7-1360P | |
| Framework Laptop 13.5 12th Gen Intel | |
| Dell Pro 13 Premium PA13250 | |
| Dell Latitude 13 7350 | |
| HP Dragonfly G4 | |
| Framework Laptop 13.5 | |
| Cinebench R20 / CPU (Single Core) | |
| Przeciętny AMD Ryzen AI 9 HX 370 (753 - 804, n=16) | |
| Framework Laptop 13.5 13th Gen Intel | |
| Dell Pro 13 Premium PA13250 | |
| Framework Laptop 13.5 Ryzen AI 9 HX 370 | |
| Dell XPS 13 Plus 9320 Core i7-1360P | |
| HP Dragonfly G4 | |
| Framework Laptop 13.5 12th Gen Intel | |
| Framework Laptop 13.5 Core Ultra 7 155H | |
| Framework Laptop 13.5 Ryzen 7 7840U | |
| MSI Summit E13 AI Evo A1MTG | |
| Dell Latitude 13 7350 | |
| Framework Laptop 13.5 | |
| Cinebench R15 / CPU Multi 64Bit | |
| Przeciętny AMD Ryzen AI 9 HX 370 (2498 - 3505, n=16) | |
| Framework Laptop 13.5 Ryzen AI 9 HX 370 | |
| Framework Laptop 13.5 13th Gen Intel | |
| Framework Laptop 13.5 Core Ultra 7 155H | |
| Framework Laptop 13.5 Ryzen 7 7840U | |
| MSI Summit E13 AI Evo A1MTG | |
| Dell XPS 13 Plus 9320 Core i7-1360P | |
| Dell Latitude 13 7350 | |
| Framework Laptop 13.5 12th Gen Intel | |
| Dell Pro 13 Premium PA13250 | |
| HP Dragonfly G4 | |
| Framework Laptop 13.5 | |
| Cinebench R15 / CPU Single 64Bit | |
| Przeciętny AMD Ryzen AI 9 HX 370 (293 - 315, n=16) | |
| Dell Pro 13 Premium PA13250 | |
| Framework Laptop 13.5 Ryzen AI 9 HX 370 | |
| Framework Laptop 13.5 13th Gen Intel | |
| Dell XPS 13 Plus 9320 Core i7-1360P | |
| HP Dragonfly G4 | |
| Framework Laptop 13.5 Core Ultra 7 155H | |
| Framework Laptop 13.5 12th Gen Intel | |
| Framework Laptop 13.5 Ryzen 7 7840U | |
| MSI Summit E13 AI Evo A1MTG | |
| Dell Latitude 13 7350 | |
| Framework Laptop 13.5 | |
| Blender / v2.79 BMW27 CPU | |
| Framework Laptop 13.5 | |
| HP Dragonfly G4 | |
| Dell Pro 13 Premium PA13250 | |
| Dell Latitude 13 7350 | |
| Framework Laptop 13.5 12th Gen Intel | |
| MSI Summit E13 AI Evo A1MTG | |
| Dell XPS 13 Plus 9320 Core i7-1360P | |
| Framework Laptop 13.5 Core Ultra 7 155H | |
| Framework Laptop 13.5 13th Gen Intel | |
| Framework Laptop 13.5 Ryzen 7 7840U | |
| Framework Laptop 13.5 Ryzen AI 9 HX 370 | |
| Przeciętny AMD Ryzen AI 9 HX 370 (140 - 192, n=16) | |
| 7-Zip 18.03 / 7z b 4 | |
| Przeciętny AMD Ryzen AI 9 HX 370 (66154 - 83714, n=16) | |
| Framework Laptop 13.5 Ryzen AI 9 HX 370 | |
| Framework Laptop 13.5 Ryzen 7 7840U | |
| Framework Laptop 13.5 13th Gen Intel | |
| Framework Laptop 13.5 Core Ultra 7 155H | |
| Dell XPS 13 Plus 9320 Core i7-1360P | |
| MSI Summit E13 AI Evo A1MTG | |
| Framework Laptop 13.5 12th Gen Intel | |
| Dell Latitude 13 7350 | |
| HP Dragonfly G4 | |
| Dell Pro 13 Premium PA13250 | |
| Framework Laptop 13.5 | |
| 7-Zip 18.03 / 7z b 4 -mmt1 | |
| Framework Laptop 13.5 13th Gen Intel | |
| Framework Laptop 13.5 Ryzen 7 7840U | |
| Przeciętny AMD Ryzen AI 9 HX 370 (5859 - 6497, n=16) | |
| Framework Laptop 13.5 Ryzen AI 9 HX 370 | |
| Dell Pro 13 Premium PA13250 | |
| HP Dragonfly G4 | |
| Framework Laptop 13.5 12th Gen Intel | |
| Dell XPS 13 Plus 9320 Core i7-1360P | |
| Framework Laptop 13.5 | |
| Framework Laptop 13.5 Core Ultra 7 155H | |
| Dell Latitude 13 7350 | |
| MSI Summit E13 AI Evo A1MTG | |
| Geekbench 6.4 / Multi-Core | |
| Framework Laptop 13.5 Ryzen AI 9 HX 370 | |
| Przeciętny AMD Ryzen AI 9 HX 370 (11973 - 15671, n=18) | |
| Framework Laptop 13.5 Core Ultra 7 155H | |
| Framework Laptop 13.5 Ryzen 7 7840U | |
| MSI Summit E13 AI Evo A1MTG | |
| Dell Pro 13 Premium PA13250 | |
| Dell Latitude 13 7350 | |
| Geekbench 6.4 / Single-Core | |
| Przeciętny AMD Ryzen AI 9 HX 370 (2780 - 2965, n=18) | |
| Framework Laptop 13.5 Ryzen AI 9 HX 370 | |
| Dell Pro 13 Premium PA13250 | |
| Framework Laptop 13.5 Ryzen 7 7840U | |
| Framework Laptop 13.5 Core Ultra 7 155H | |
| MSI Summit E13 AI Evo A1MTG | |
| Dell Latitude 13 7350 | |
| Geekbench 5.5 / Multi-Core | |
| Framework Laptop 13.5 Ryzen AI 9 HX 370 | |
| Przeciętny AMD Ryzen AI 9 HX 370 (11394 - 15407, n=17) | |
| Framework Laptop 13.5 13th Gen Intel | |
| Framework Laptop 13.5 Core Ultra 7 155H | |
| Dell XPS 13 Plus 9320 Core i7-1360P | |
| Framework Laptop 13.5 Ryzen 7 7840U | |
| MSI Summit E13 AI Evo A1MTG | |
| Framework Laptop 13.5 12th Gen Intel | |
| Dell Pro 13 Premium PA13250 | |
| HP Dragonfly G4 | |
| Dell Latitude 13 7350 | |
| Geekbench 5.5 / Single-Core | |
| Framework Laptop 13.5 Ryzen AI 9 HX 370 | |
| Przeciętny AMD Ryzen AI 9 HX 370 (1957 - 2136, n=17) | |
| Dell Pro 13 Premium PA13250 | |
| Framework Laptop 13.5 13th Gen Intel | |
| Framework Laptop 13.5 Ryzen 7 7840U | |
| HP Dragonfly G4 | |
| Dell XPS 13 Plus 9320 Core i7-1360P | |
| Framework Laptop 13.5 12th Gen Intel | |
| Framework Laptop 13.5 Core Ultra 7 155H | |
| MSI Summit E13 AI Evo A1MTG | |
| Dell Latitude 13 7350 | |
| HWBOT x265 Benchmark v2.2 / 4k Preset | |
| Przeciętny AMD Ryzen AI 9 HX 370 (20.3 - 28.7, n=16) | |
| Framework Laptop 13.5 Ryzen AI 9 HX 370 | |
| Framework Laptop 13.5 Ryzen 7 7840U | |
| Framework Laptop 13.5 13th Gen Intel | |
| Framework Laptop 13.5 Core Ultra 7 155H | |
| Dell XPS 13 Plus 9320 Core i7-1360P | |
| MSI Summit E13 AI Evo A1MTG | |
| Framework Laptop 13.5 12th Gen Intel | |
| Dell Pro 13 Premium PA13250 | |
| Dell Latitude 13 7350 | |
| HP Dragonfly G4 | |
| Framework Laptop 13.5 | |
| LibreOffice / 20 Documents To PDF | |
| MSI Summit E13 AI Evo A1MTG | |
| Dell Pro 13 Premium PA13250 | |
| Przeciętny AMD Ryzen AI 9 HX 370 (46.8 - 66.6, n=16) | |
| Framework Laptop 13.5 Ryzen AI 9 HX 370 | |
| Dell Latitude 13 7350 | |
| Framework Laptop 13.5 Core Ultra 7 155H | |
| Dell XPS 13 Plus 9320 Core i7-1360P | |
| HP Dragonfly G4 | |
| Framework Laptop 13.5 | |
| Framework Laptop 13.5 Ryzen 7 7840U | |
| Framework Laptop 13.5 12th Gen Intel | |
| Framework Laptop 13.5 13th Gen Intel | |
| R Benchmark 2.5 / Overall mean | |
| Framework Laptop 13.5 | |
| Dell Latitude 13 7350 | |
| MSI Summit E13 AI Evo A1MTG | |
| Framework Laptop 13.5 Core Ultra 7 155H | |
| Dell XPS 13 Plus 9320 Core i7-1360P | |
| Framework Laptop 13.5 12th Gen Intel | |
| HP Dragonfly G4 | |
| Framework Laptop 13.5 Ryzen 7 7840U | |
| Dell Pro 13 Premium PA13250 | |
| Framework Laptop 13.5 13th Gen Intel | |
| Przeciętny AMD Ryzen AI 9 HX 370 (0.3892 - 0.529, n=16) | |
| Framework Laptop 13.5 Ryzen AI 9 HX 370 | |
* ... im mniej tym lepiej
AIDA64: FP32 Ray-Trace | FPU Julia | CPU SHA3 | CPU Queen | FPU SinJulia | FPU Mandel | CPU AES | CPU ZLib | FP64 Ray-Trace | CPU PhotoWorxx
| Performance Rating | |
| Przeciętny AMD Ryzen AI 9 HX 370 | |
| Framework Laptop 13.5 Ryzen AI 9 HX 370 | |
| Lenovo ThinkPad Z13 Gen 2 | |
| Framework Laptop 13.5 Core Ultra 7 155H | |
| MSI Summit E13 AI Evo A1MTG | |
| Dell Pro 13 Premium PA13250 | |
| HP EliteBook x360 830 G10 7L7U1ET | |
| AIDA64 / FP32 Ray-Trace | |
| Przeciętny AMD Ryzen AI 9 HX 370 (24673 - 37654, n=15) | |
| Framework Laptop 13.5 Ryzen AI 9 HX 370 | |
| Lenovo ThinkPad Z13 Gen 2 | |
| Framework Laptop 13.5 Core Ultra 7 155H | |
| Dell Pro 13 Premium PA13250 | |
| MSI Summit E13 AI Evo A1MTG | |
| HP EliteBook x360 830 G10 7L7U1ET | |
| AIDA64 / FPU Julia | |
| Przeciętny AMD Ryzen AI 9 HX 370 (95655 - 147937, n=16) | |
| Framework Laptop 13.5 Ryzen AI 9 HX 370 | |
| Lenovo ThinkPad Z13 Gen 2 | |
| Framework Laptop 13.5 Core Ultra 7 155H | |
| MSI Summit E13 AI Evo A1MTG | |
| Dell Pro 13 Premium PA13250 | |
| HP EliteBook x360 830 G10 7L7U1ET | |
| AIDA64 / CPU SHA3 | |
| Przeciętny AMD Ryzen AI 9 HX 370 (4421 - 5843, n=16) | |
| Framework Laptop 13.5 Ryzen AI 9 HX 370 | |
| Lenovo ThinkPad Z13 Gen 2 | |
| Framework Laptop 13.5 Core Ultra 7 155H | |
| MSI Summit E13 AI Evo A1MTG | |
| Dell Pro 13 Premium PA13250 | |
| HP EliteBook x360 830 G10 7L7U1ET | |
| AIDA64 / CPU Queen | |
| Lenovo ThinkPad Z13 Gen 2 | |
| Framework Laptop 13.5 Core Ultra 7 155H | |
| Framework Laptop 13.5 Ryzen AI 9 HX 370 | |
| Przeciętny AMD Ryzen AI 9 HX 370 (41744 - 99088, n=16) | |
| MSI Summit E13 AI Evo A1MTG | |
| HP EliteBook x360 830 G10 7L7U1ET | |
| Dell Pro 13 Premium PA13250 | |
| AIDA64 / FPU SinJulia | |
| Przeciętny AMD Ryzen AI 9 HX 370 (16445 - 19115, n=16) | |
| Framework Laptop 13.5 Ryzen AI 9 HX 370 | |
| Lenovo ThinkPad Z13 Gen 2 | |
| Framework Laptop 13.5 Core Ultra 7 155H | |
| MSI Summit E13 AI Evo A1MTG | |
| Dell Pro 13 Premium PA13250 | |
| HP EliteBook x360 830 G10 7L7U1ET | |
| AIDA64 / FPU Mandel | |
| Przeciętny AMD Ryzen AI 9 HX 370 (50357 - 79251, n=15) | |
| Framework Laptop 13.5 Ryzen AI 9 HX 370 | |
| Lenovo ThinkPad Z13 Gen 2 | |
| Framework Laptop 13.5 Core Ultra 7 155H | |
| MSI Summit E13 AI Evo A1MTG | |
| Dell Pro 13 Premium PA13250 | |
| HP EliteBook x360 830 G10 7L7U1ET | |
| AIDA64 / CPU ZLib | |
| Przeciętny AMD Ryzen AI 9 HX 370 (1077 - 1530, n=16) | |
| Framework Laptop 13.5 Ryzen AI 9 HX 370 | |
| Lenovo ThinkPad Z13 Gen 2 | |
| Framework Laptop 13.5 Core Ultra 7 155H | |
| MSI Summit E13 AI Evo A1MTG | |
| HP EliteBook x360 830 G10 7L7U1ET | |
| Dell Pro 13 Premium PA13250 | |
| AIDA64 / FP64 Ray-Trace | |
| Przeciętny AMD Ryzen AI 9 HX 370 (13665 - 20608, n=16) | |
| Framework Laptop 13.5 Ryzen AI 9 HX 370 | |
| Lenovo ThinkPad Z13 Gen 2 | |
| Framework Laptop 13.5 Core Ultra 7 155H | |
| Dell Pro 13 Premium PA13250 | |
| MSI Summit E13 AI Evo A1MTG | |
| HP EliteBook x360 830 G10 7L7U1ET | |
| AIDA64 / CPU PhotoWorxx | |
| Przeciętny AMD Ryzen AI 9 HX 370 (36752 - 51727, n=16) | |
| Framework Laptop 13.5 Ryzen AI 9 HX 370 | |
| Dell Pro 13 Premium PA13250 | |
| Framework Laptop 13.5 Core Ultra 7 155H | |
| MSI Summit E13 AI Evo A1MTG | |
| Lenovo ThinkPad Z13 Gen 2 | |
| HP EliteBook x360 830 G10 7L7U1ET | |
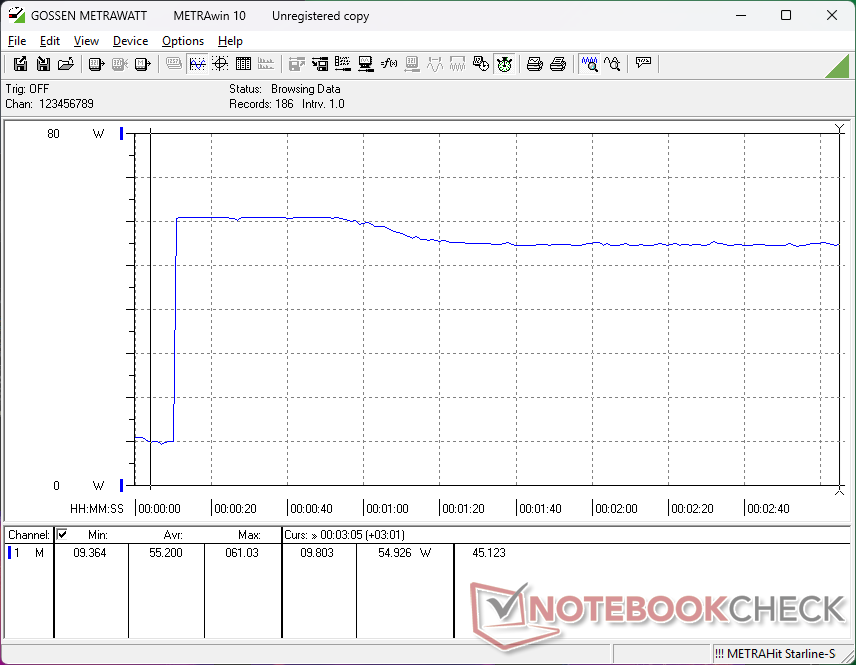
Test warunków skrajnych
Procesor przyspieszał do 3,2 GHz i 46 W podczas inicjowania stresu Prime95, po czym spadał do 2,6 GHz i 33 W po minucie testu, reprezentując ograniczony maksymalny Turbo Boost. Temperatury rdzenia są poza tym podobne do konfiguracji Intela, jeśli nie nieco niższe podczas grania.

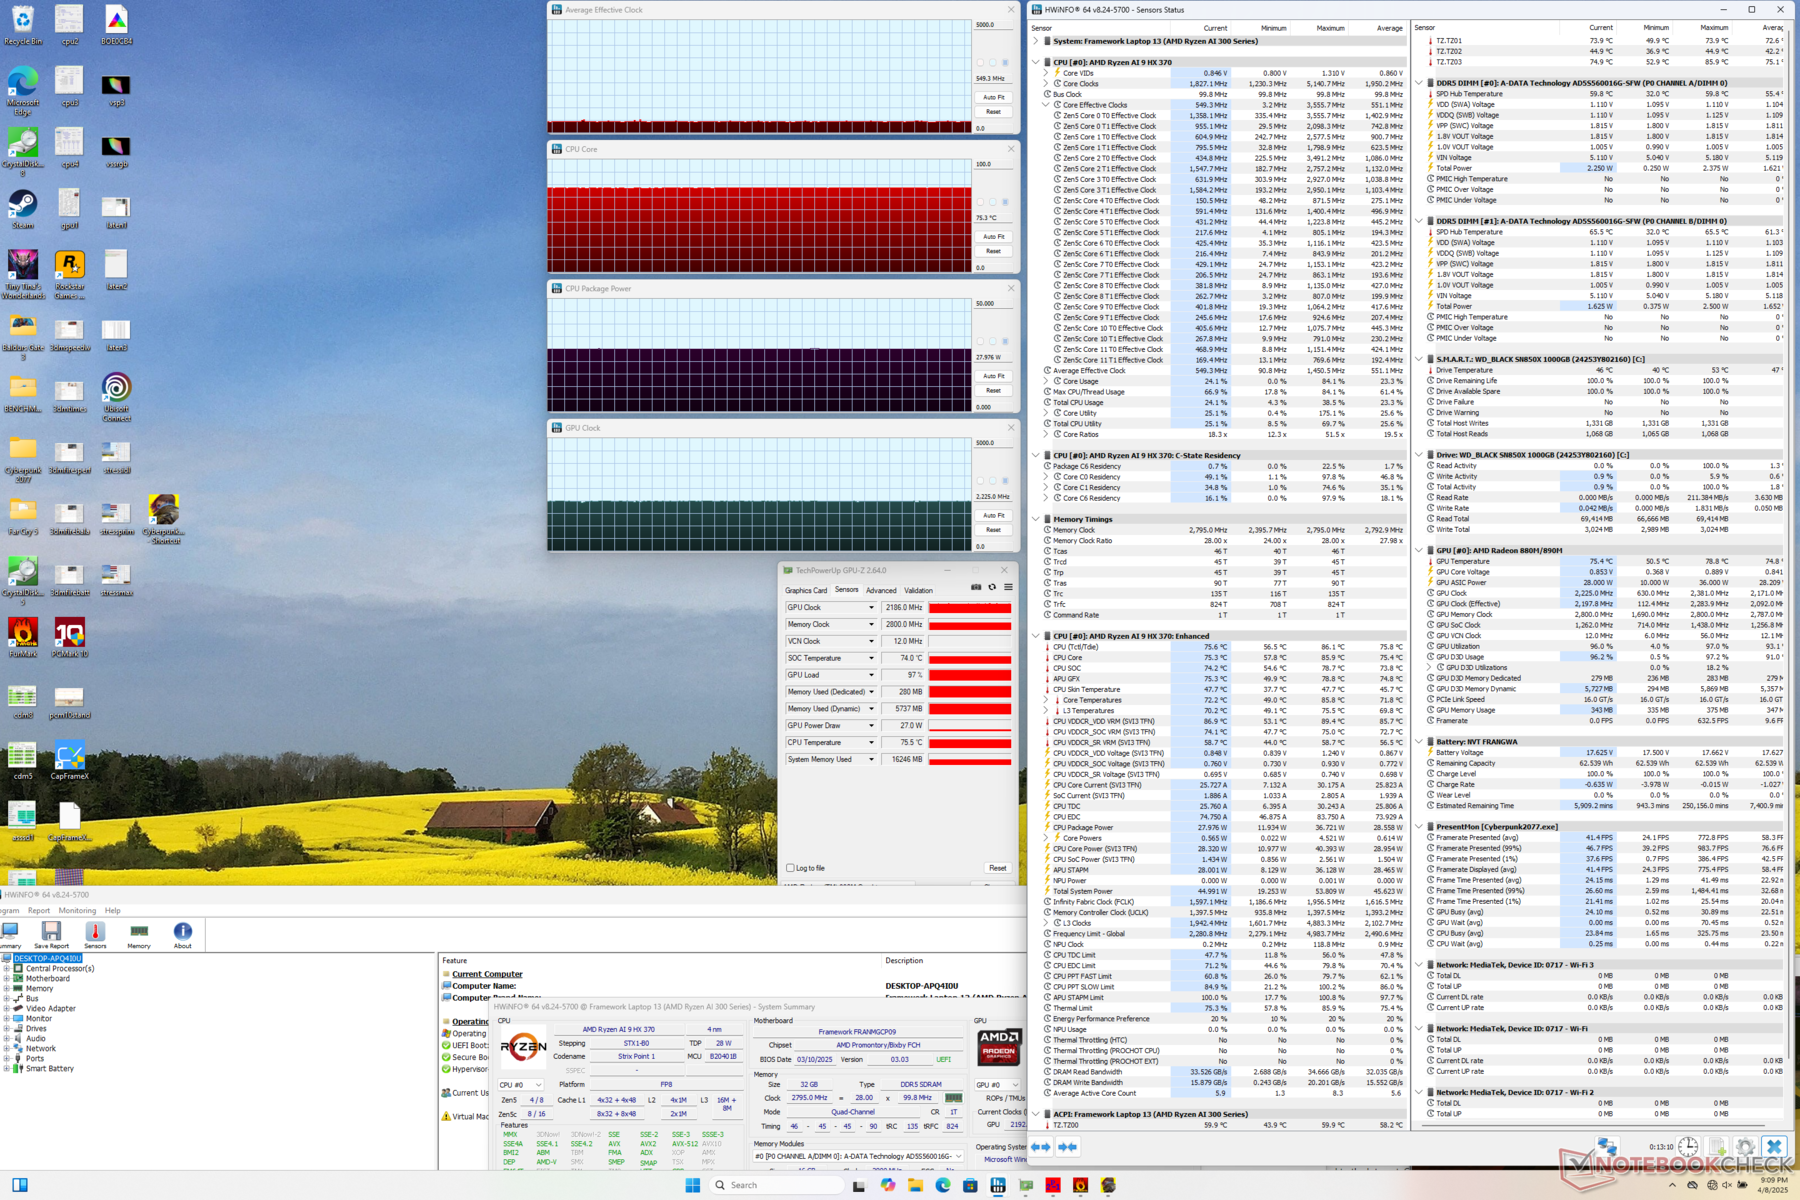
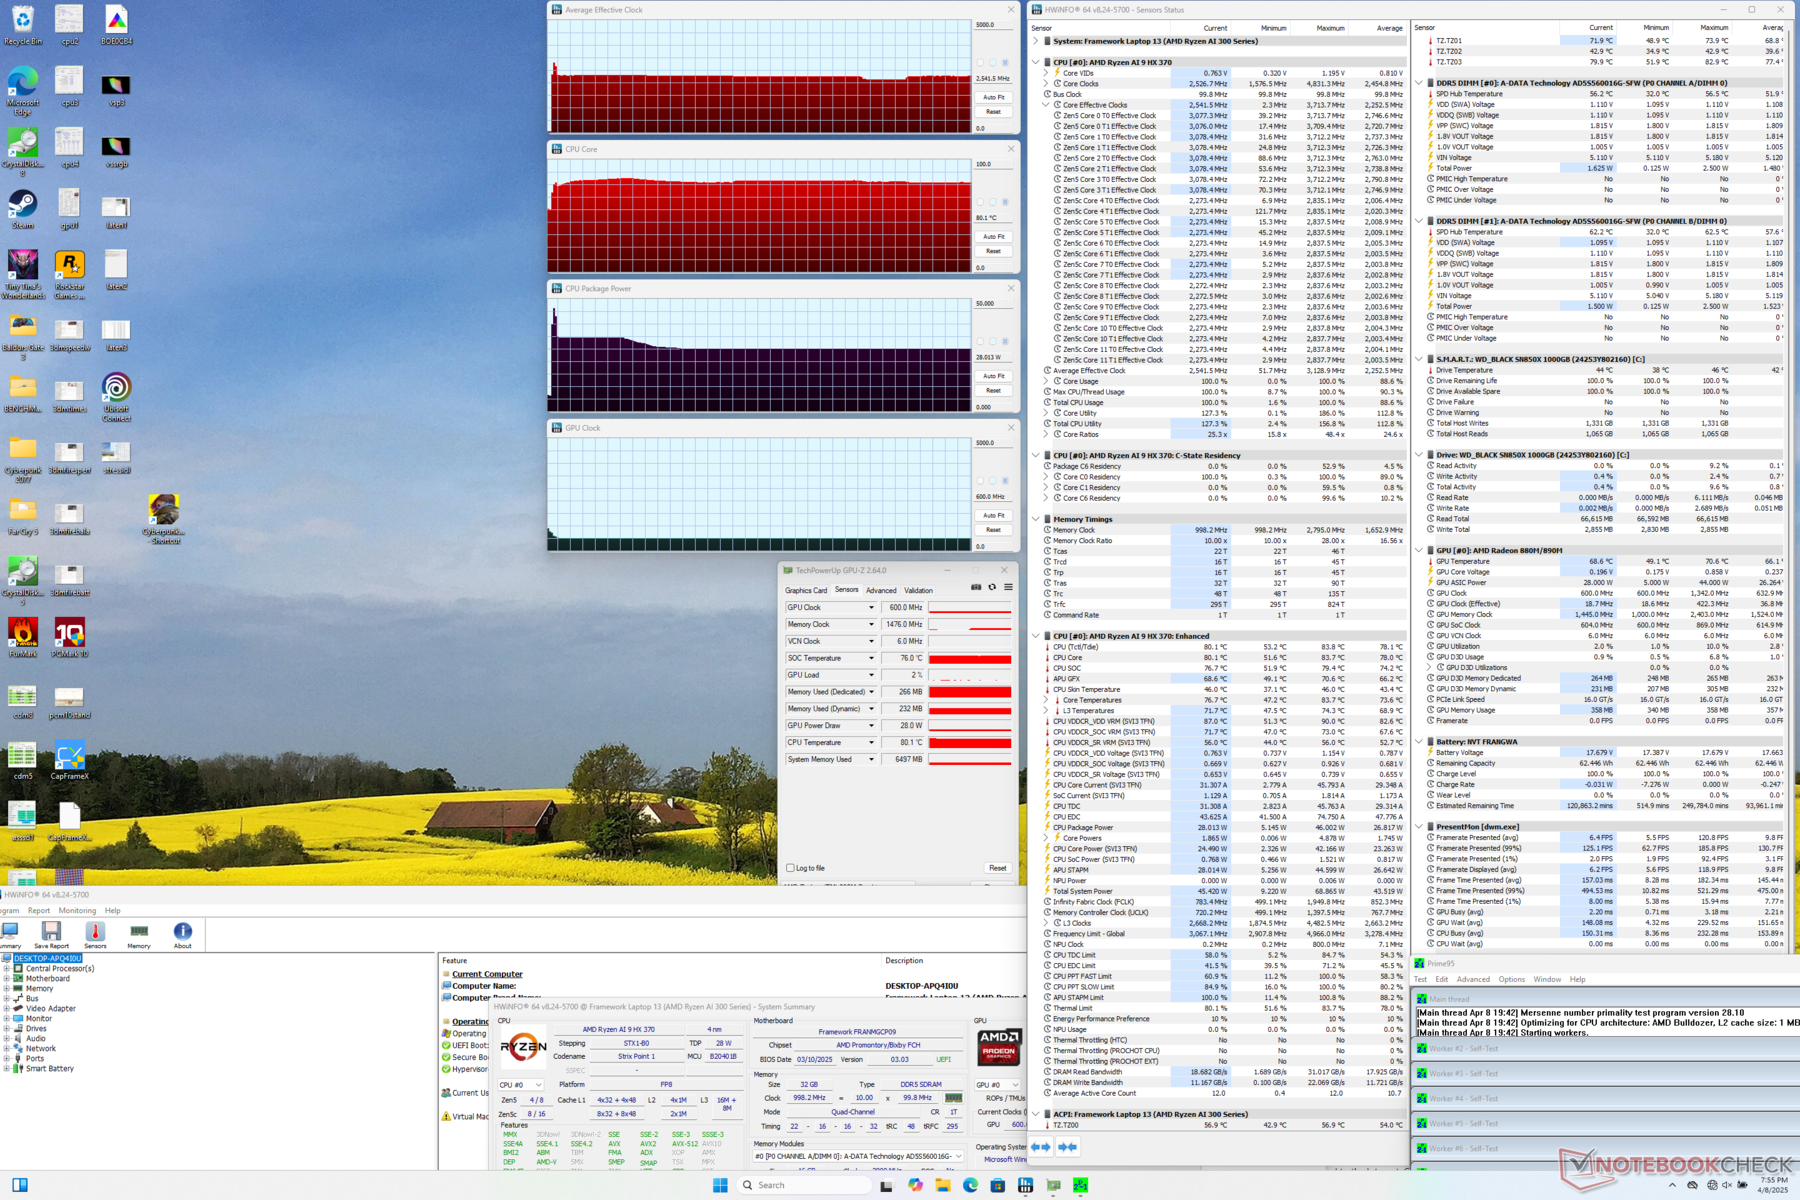
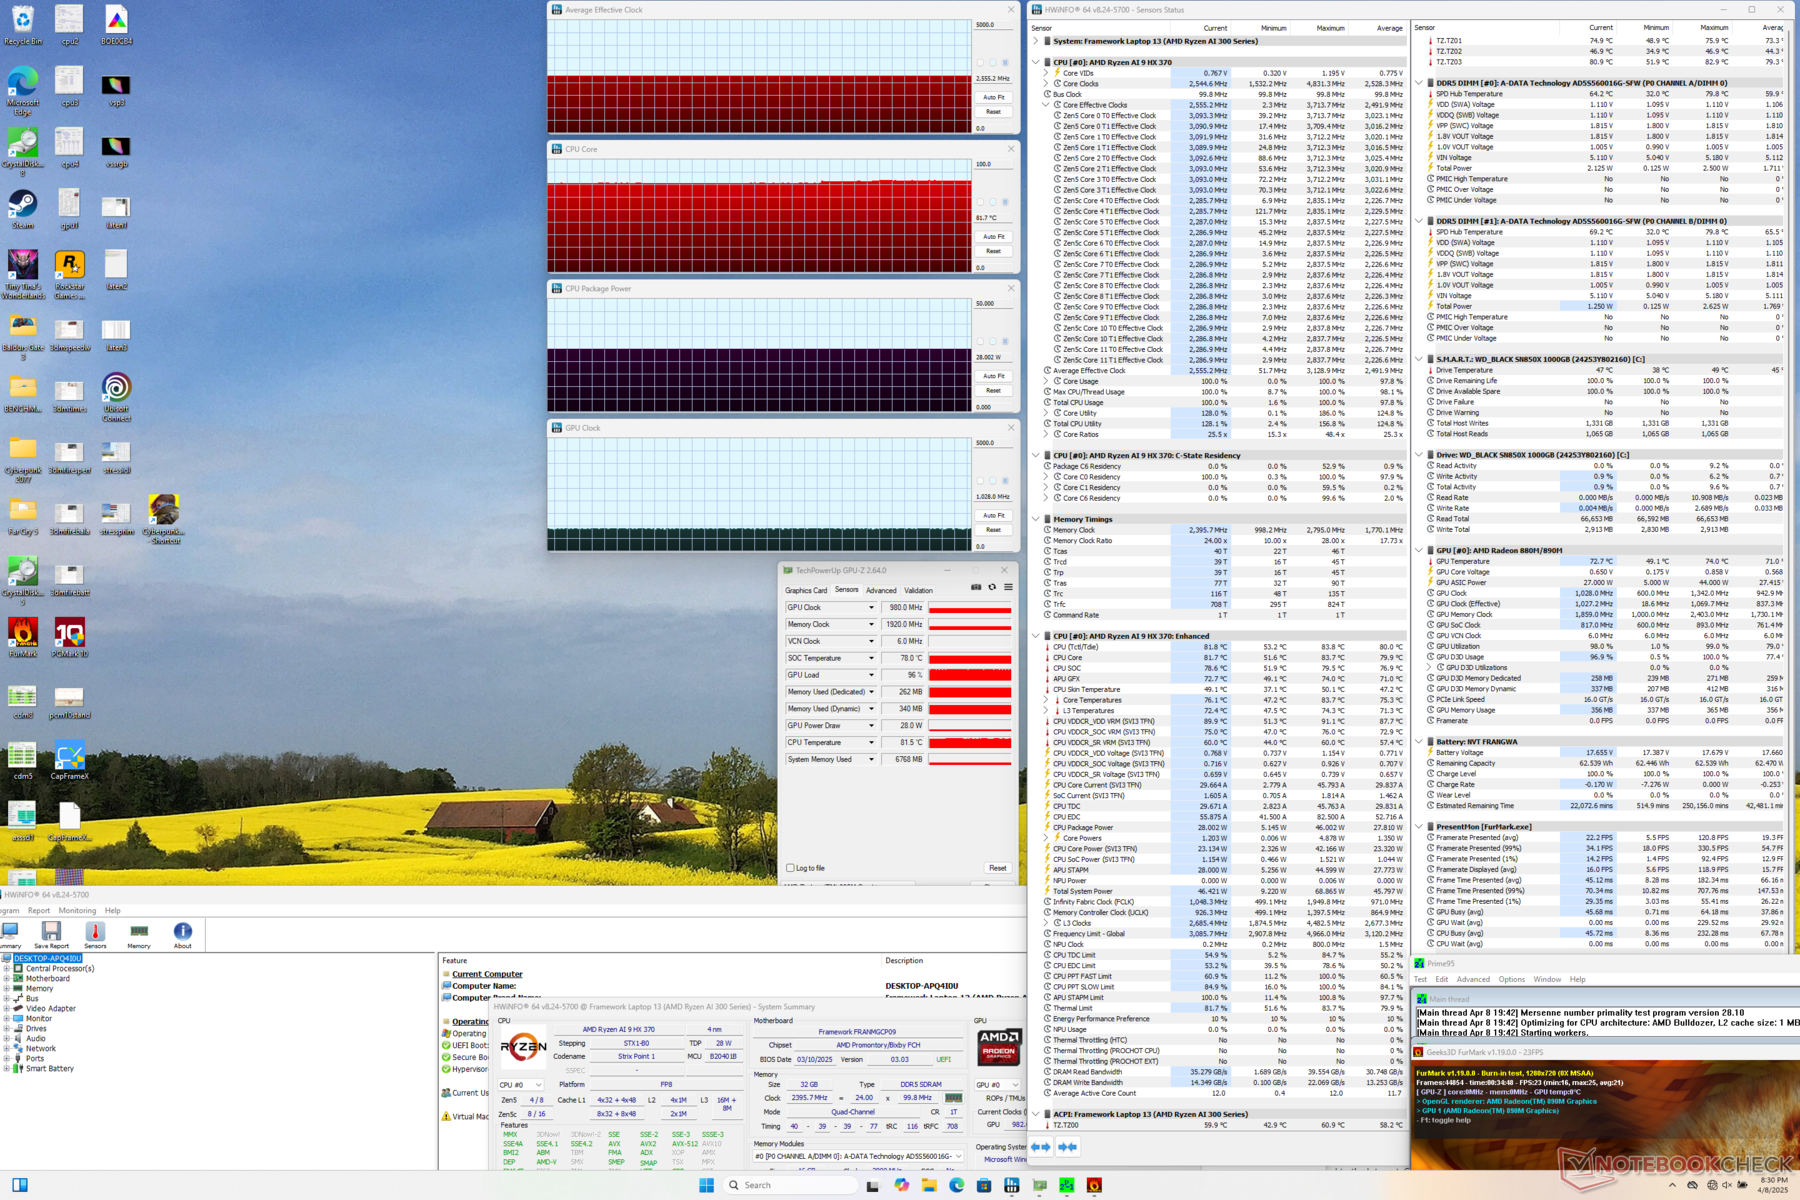
| Średnie taktowanie CPU (GHz) | Taktowanie GPU (MHz) | Średnia temperatura CPU (°C) | |
| System bezczynności | -- | -- | 52 |
| Prime95 Stress | 2.5 | -- | 80 |
| Prime95 + FurMark Stress | 2.6 | 980 | 82 |
| Cyberpunk 2077 Stress | 0.6 | 2186 | 75 |
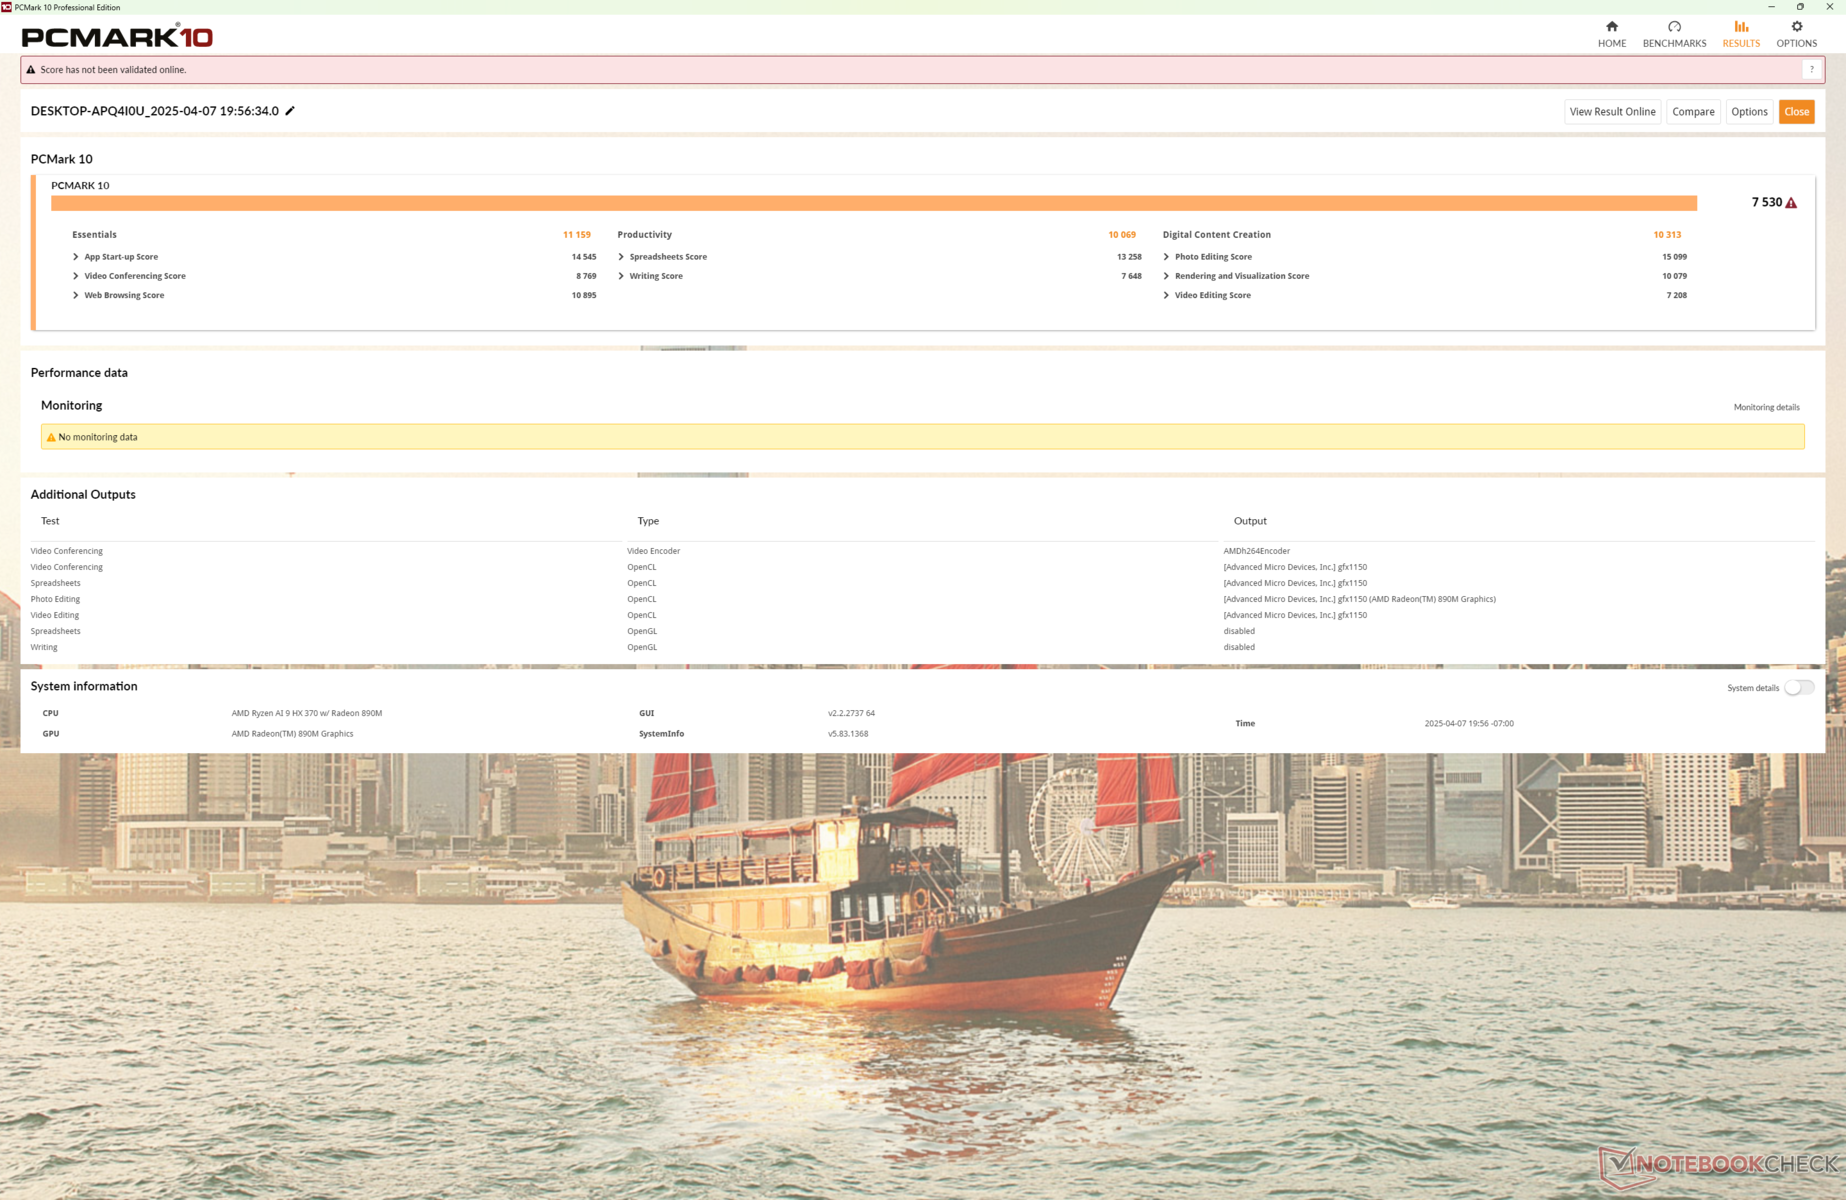
Wydajność systemu
CrossMark: Overall | Productivity | Creativity | Responsiveness
WebXPRT 3: Overall
WebXPRT 4: Overall
Mozilla Kraken 1.1: Total
| PCMark 10 / Score | |
| Framework Laptop 13.5 Ryzen AI 9 HX 370 | |
| Przeciętny AMD Ryzen AI 9 HX 370, AMD Radeon 890M (6577 - 7646, n=10) | |
| Lenovo ThinkPad Z13 Gen 2 | |
| Framework Laptop 13.5 Core Ultra 7 155H | |
| Dell Pro 13 Premium PA13250 | |
| HP EliteBook x360 830 G10 7L7U1ET | |
| MSI Summit E13 AI Evo A1MTG | |
| PCMark 10 / Essentials | |
| Framework Laptop 13.5 Ryzen AI 9 HX 370 | |
| Lenovo ThinkPad Z13 Gen 2 | |
| Framework Laptop 13.5 Core Ultra 7 155H | |
| Przeciętny AMD Ryzen AI 9 HX 370, AMD Radeon 890M (9277 - 11262, n=10) | |
| HP EliteBook x360 830 G10 7L7U1ET | |
| Dell Pro 13 Premium PA13250 | |
| MSI Summit E13 AI Evo A1MTG | |
| PCMark 10 / Productivity | |
| Framework Laptop 13.5 Ryzen AI 9 HX 370 | |
| Przeciętny AMD Ryzen AI 9 HX 370, AMD Radeon 890M (8497 - 10615, n=10) | |
| Lenovo ThinkPad Z13 Gen 2 | |
| Dell Pro 13 Premium PA13250 | |
| Framework Laptop 13.5 Core Ultra 7 155H | |
| HP EliteBook x360 830 G10 7L7U1ET | |
| MSI Summit E13 AI Evo A1MTG | |
| PCMark 10 / Digital Content Creation | |
| Przeciętny AMD Ryzen AI 9 HX 370, AMD Radeon 890M (9334 - 11422, n=10) | |
| Framework Laptop 13.5 Ryzen AI 9 HX 370 | |
| Framework Laptop 13.5 Core Ultra 7 155H | |
| Dell Pro 13 Premium PA13250 | |
| Lenovo ThinkPad Z13 Gen 2 | |
| MSI Summit E13 AI Evo A1MTG | |
| HP EliteBook x360 830 G10 7L7U1ET | |
| CrossMark / Overall | |
| Framework Laptop 13.5 Ryzen AI 9 HX 370 | |
| Przeciętny AMD Ryzen AI 9 HX 370, AMD Radeon 890M (1686 - 1847, n=8) | |
| Framework Laptop 13.5 Core Ultra 7 155H | |
| Dell Pro 13 Premium PA13250 | |
| MSI Summit E13 AI Evo A1MTG | |
| Lenovo ThinkPad Z13 Gen 2 | |
| HP EliteBook x360 830 G10 7L7U1ET | |
| CrossMark / Productivity | |
| Framework Laptop 13.5 Ryzen AI 9 HX 370 | |
| Przeciętny AMD Ryzen AI 9 HX 370, AMD Radeon 890M (1588 - 1719, n=8) | |
| Framework Laptop 13.5 Core Ultra 7 155H | |
| Dell Pro 13 Premium PA13250 | |
| MSI Summit E13 AI Evo A1MTG | |
| Lenovo ThinkPad Z13 Gen 2 | |
| HP EliteBook x360 830 G10 7L7U1ET | |
| CrossMark / Creativity | |
| Framework Laptop 13.5 Ryzen AI 9 HX 370 | |
| Przeciętny AMD Ryzen AI 9 HX 370, AMD Radeon 890M (1817 - 2211, n=8) | |
| Framework Laptop 13.5 Core Ultra 7 155H | |
| Dell Pro 13 Premium PA13250 | |
| Lenovo ThinkPad Z13 Gen 2 | |
| MSI Summit E13 AI Evo A1MTG | |
| HP EliteBook x360 830 G10 7L7U1ET | |
| CrossMark / Responsiveness | |
| Przeciętny AMD Ryzen AI 9 HX 370, AMD Radeon 890M (1222 - 1610, n=8) | |
| Framework Laptop 13.5 Ryzen AI 9 HX 370 | |
| MSI Summit E13 AI Evo A1MTG | |
| Framework Laptop 13.5 Core Ultra 7 155H | |
| Dell Pro 13 Premium PA13250 | |
| Lenovo ThinkPad Z13 Gen 2 | |
| HP EliteBook x360 830 G10 7L7U1ET | |
| WebXPRT 3 / Overall | |
| Framework Laptop 13.5 Ryzen AI 9 HX 370 | |
| Przeciętny AMD Ryzen AI 9 HX 370, AMD Radeon 890M (252 - 342, n=9) | |
| Lenovo ThinkPad Z13 Gen 2 | |
| Framework Laptop 13.5 Core Ultra 7 155H | |
| MSI Summit E13 AI Evo A1MTG | |
| HP EliteBook x360 830 G10 7L7U1ET | |
| Dell Pro 13 Premium PA13250 | |
| WebXPRT 4 / Overall | |
| Framework Laptop 13.5 Ryzen AI 9 HX 370 | |
| Framework Laptop 13.5 Core Ultra 7 155H | |
| Przeciętny AMD Ryzen AI 9 HX 370, AMD Radeon 890M (210 - 277, n=10) | |
| Dell Pro 13 Premium PA13250 | |
| Lenovo ThinkPad Z13 Gen 2 | |
| MSI Summit E13 AI Evo A1MTG | |
| Mozilla Kraken 1.1 / Total | |
| Lenovo ThinkPad Z13 Gen 2 | |
| HP EliteBook x360 830 G10 7L7U1ET | |
| MSI Summit E13 AI Evo A1MTG | |
| Framework Laptop 13.5 Core Ultra 7 155H | |
| Dell Pro 13 Premium PA13250 | |
| Framework Laptop 13.5 Ryzen AI 9 HX 370 | |
| Przeciętny AMD Ryzen AI 9 HX 370, AMD Radeon 890M (419 - 503, n=11) | |
* ... im mniej tym lepiej
| PCMark 10 Score | 7530 pkt. | |
Pomoc | ||
| AIDA64 / Memory Copy | |
| Przeciętny AMD Ryzen AI 9 HX 370 (72702 - 93640, n=16) | |
| Framework Laptop 13.5 Core Ultra 7 155H | |
| Framework Laptop 13.5 Ryzen AI 9 HX 370 | |
| Framework Laptop 13.5 Ryzen 7 7840U | |
| Framework Laptop 13.5 13th Gen Intel | |
| Framework Laptop 13.5 12th Gen Intel | |
| Framework Laptop 13.5 | |
| AIDA64 / Memory Read | |
| Przeciętny AMD Ryzen AI 9 HX 370 (84635 - 102937, n=16) | |
| Framework Laptop 13.5 Ryzen AI 9 HX 370 | |
| Framework Laptop 13.5 Core Ultra 7 155H | |
| Framework Laptop 13.5 Ryzen 7 7840U | |
| Framework Laptop 13.5 13th Gen Intel | |
| Framework Laptop 13.5 12th Gen Intel | |
| Framework Laptop 13.5 | |
| AIDA64 / Memory Write | |
| Przeciętny AMD Ryzen AI 9 HX 370 (83907 - 108954, n=16) | |
| Framework Laptop 13.5 Ryzen AI 9 HX 370 | |
| Framework Laptop 13.5 Ryzen 7 7840U | |
| Framework Laptop 13.5 Core Ultra 7 155H | |
| Framework Laptop 13.5 13th Gen Intel | |
| Framework Laptop 13.5 12th Gen Intel | |
| Framework Laptop 13.5 | |
| AIDA64 / Memory Latency | |
| Framework Laptop 13.5 Core Ultra 7 155H | |
| Przeciętny AMD Ryzen AI 9 HX 370 (87.2 - 119.4, n=16) | |
| Framework Laptop 13.5 Ryzen AI 9 HX 370 | |
| Framework Laptop 13.5 Ryzen 7 7840U | |
| Framework Laptop 13.5 12th Gen Intel | |
| Framework Laptop 13.5 | |
| Framework Laptop 13.5 13th Gen Intel | |
* ... im mniej tym lepiej
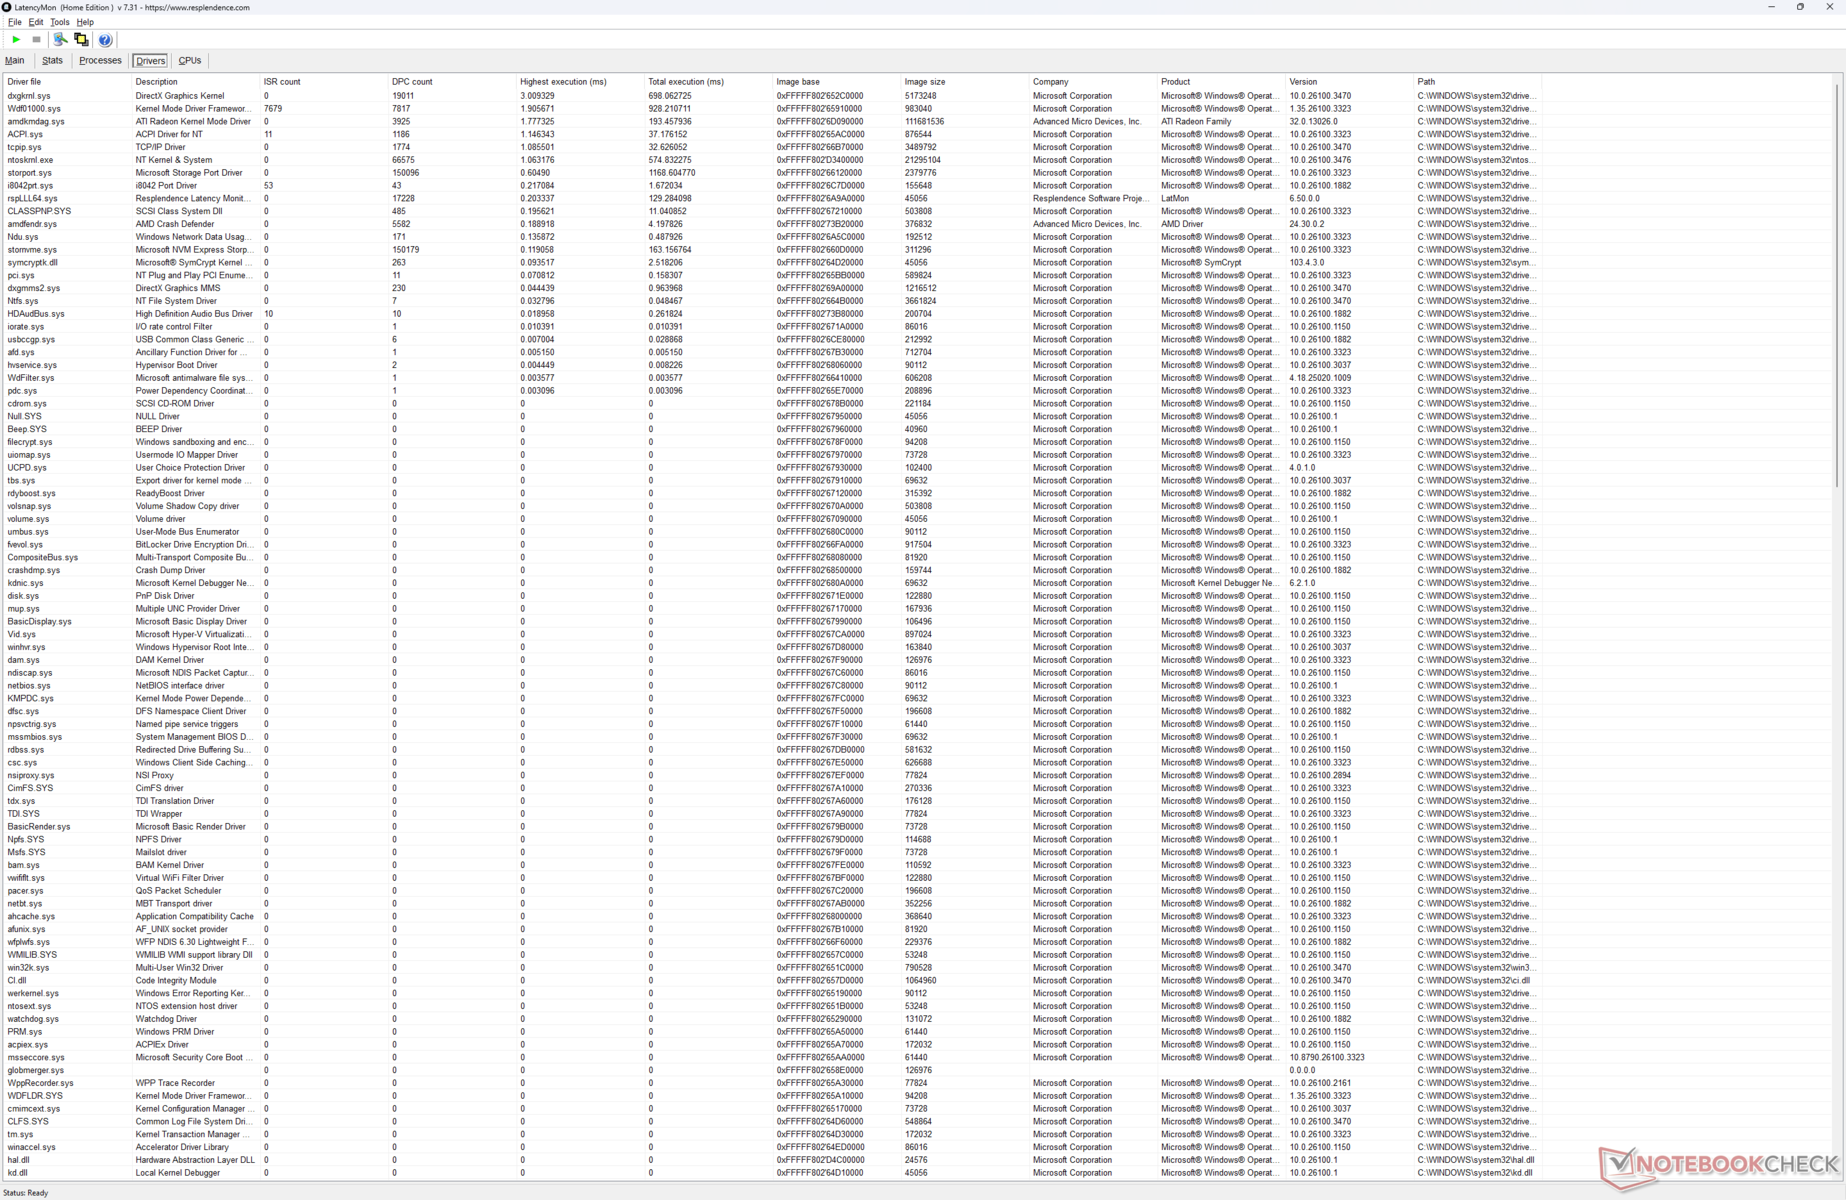
Opóźnienie DPC
Konfiguracja AMD doświadcza nieco wyższych opóźnień i spadków klatek niż konfiguracja Intela podczas odtwarzania wideo 4K60.
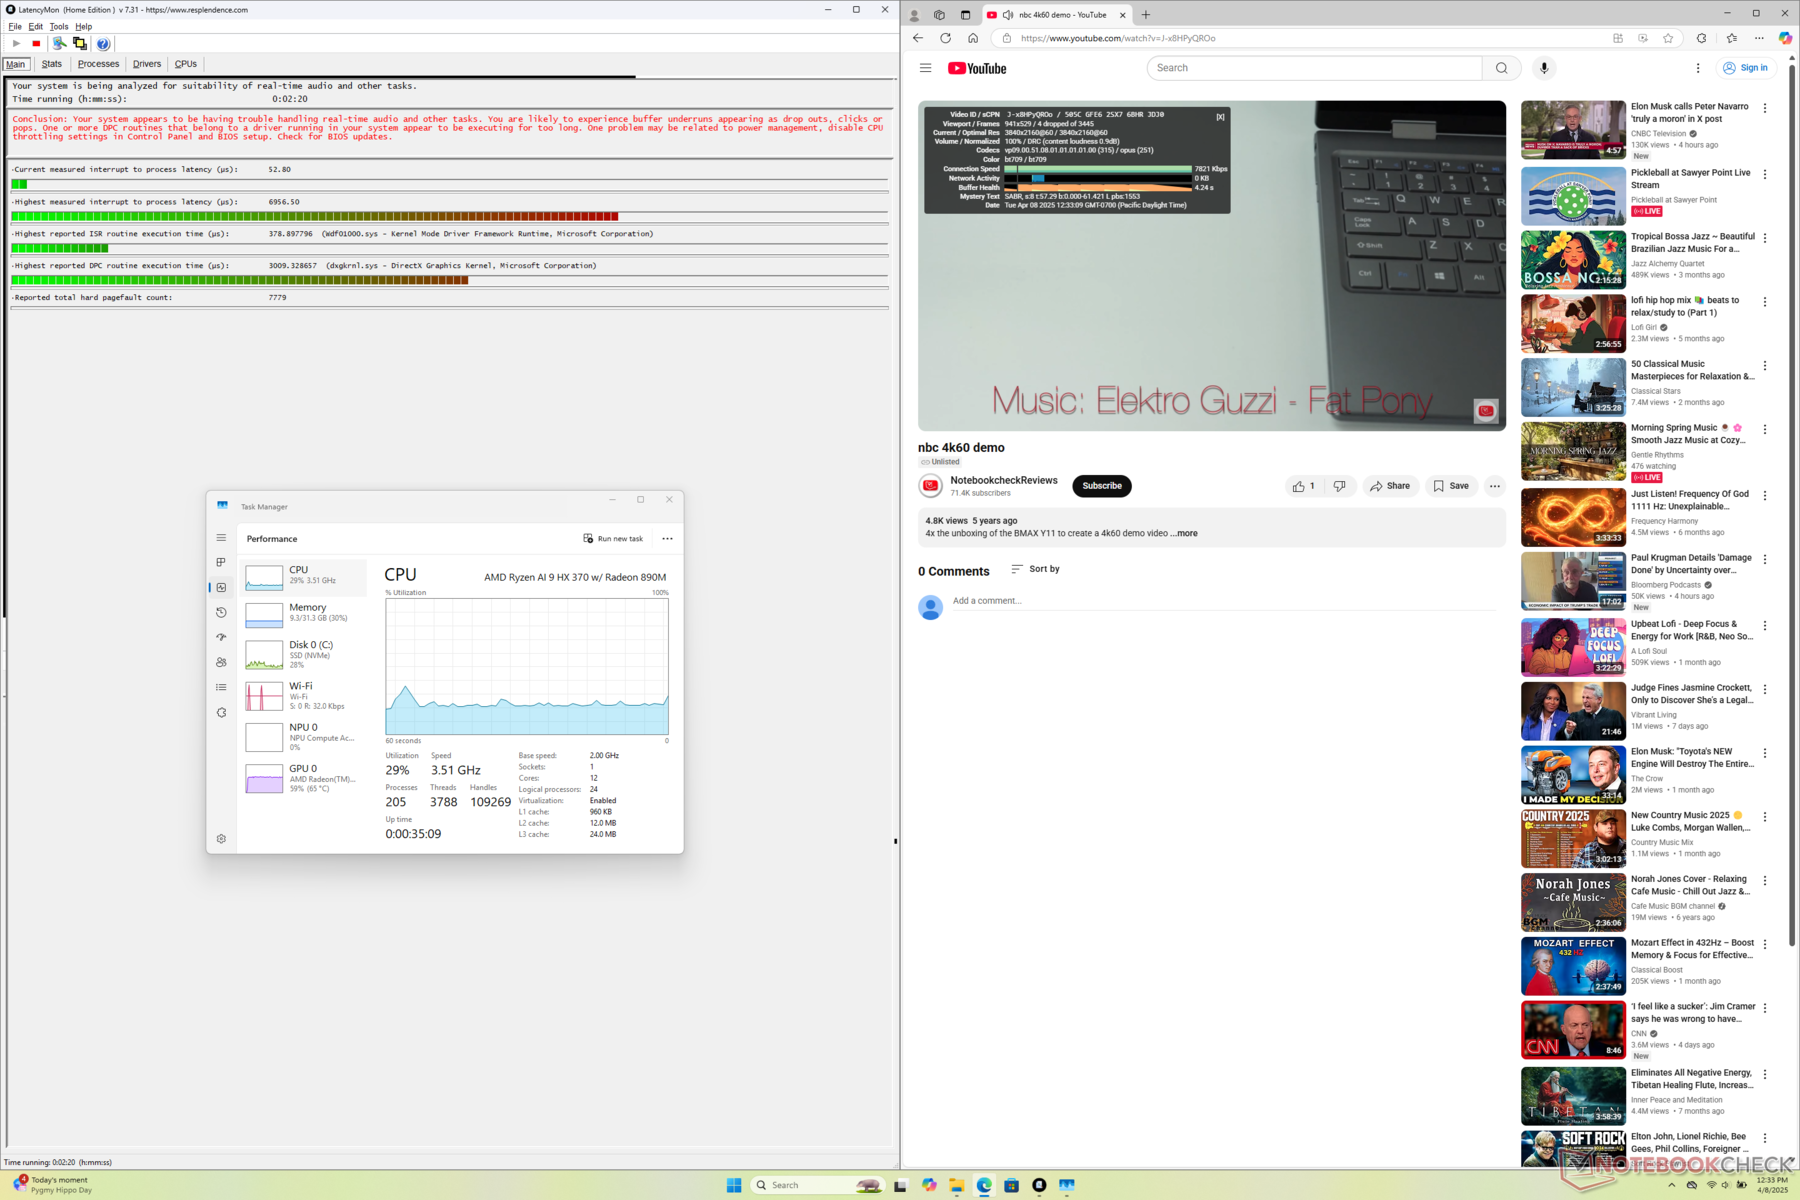
| DPC Latencies / LatencyMon - interrupt to process latency (max), Web, Youtube, Prime95 | |
| Framework Laptop 13.5 Ryzen AI 9 HX 370 | |
| MSI Summit E13 AI Evo A1MTG | |
| HP EliteBook x360 830 G10 7L7U1ET | |
| Lenovo ThinkPad Z13 Gen 2 | |
| Dell Pro 13 Premium PA13250 | |
| Framework Laptop 13.5 Core Ultra 7 155H | |
* ... im mniej tym lepiej
Urządzenia pamięci masowej
Framework oferuje to samo WD Black SN850X PCIe4 NVMe SSD, jak w zeszłorocznym modelu.
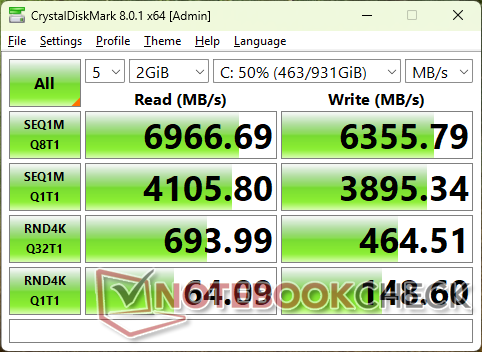
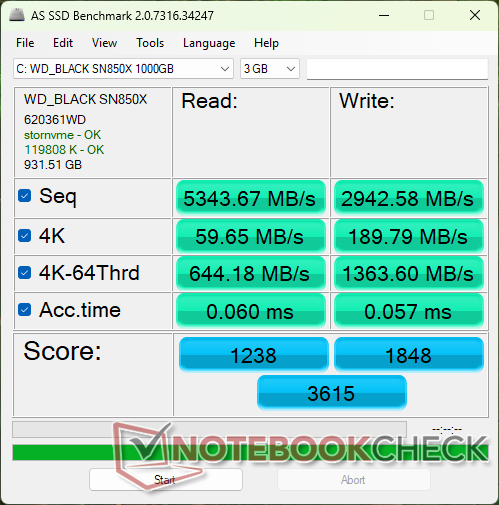

* ... im mniej tym lepiej
Disk Throttling: DiskSpd Read Loop, Queue Depth 8
Wydajność GPU
wyniki 3DMark są niższe od oczekiwanych nawet o 15 procent w porównaniu do przeciętnego laptopa w naszej bazie danych z tą samą kartą graficzną GPU Radeon RX 890M. Jednak podczas uruchamiania rzeczywistych gier nasza jednostka nadal konsekwentnie przewyższała starsze Core Ultra 7 155H i Arc 8 o komfortowe marginesy.
| 3DMark Performance Rating - Percent | |
| Przeciętny AMD Radeon 890M | |
| Dell Pro 13 Premium PA13250 | |
| Framework Laptop 13.5 Core Ultra 7 155H | |
| Framework Laptop 13.5 Ryzen AI 9 HX 370 | |
| Framework Laptop 13.5 Ryzen 7 7840U | |
| MSI Summit E13 AI Evo A1MTG | |
| Dell Latitude 13 7350 | |
| Dell XPS 13 Plus 9320 Core i7-1360P | |
| Framework Laptop 13.5 13th Gen Intel | |
| Framework Laptop 13.5 12th Gen Intel | |
| HP Dragonfly G4 | |
| Framework Laptop 13.5 | |
| 3DMark 11 - 1280x720 Performance GPU | |
| Przeciętny AMD Radeon 890M (12641 - 16800, n=13) | |
| Framework Laptop 13.5 Core Ultra 7 155H | |
| Framework Laptop 13.5 Ryzen AI 9 HX 370 | |
| Framework Laptop 13.5 Ryzen 7 7840U | |
| Dell Pro 13 Premium PA13250 | |
| MSI Summit E13 AI Evo A1MTG | |
| Framework Laptop 13.5 13th Gen Intel | |
| Dell Latitude 13 7350 | |
| Dell XPS 13 Plus 9320 Core i7-1360P | |
| Framework Laptop 13.5 12th Gen Intel | |
| HP Dragonfly G4 | |
| Framework Laptop 13.5 | |
| 3DMark 11 Performance | 12491 pkt. | |
| 3DMark Fire Strike Score | 7387 pkt. | |
| 3DMark Time Spy Score | 3287 pkt. | |
Pomoc | ||
* ... im mniej tym lepiej
Cyberpunk 2077 ultra FPS Chart
| low | med. | high | ultra | |
|---|---|---|---|---|
| GTA V (2015) | 172.7 | 159.9 | 71.2 | 29.7 |
| Dota 2 Reborn (2015) | 171.3 | 138.8 | 47.7 | 45.1 |
| Final Fantasy XV Benchmark (2018) | 73 | 39.1 | 27.8 | |
| X-Plane 11.11 (2018) | 71.6 | 55 | 45.4 | |
| Far Cry 5 (2018) | 80 | 45 | 42 | 40 |
| Strange Brigade (2018) | 174.4 | 70.8 | 58.7 | 48.5 |
| Tiny Tina's Wonderlands (2022) | 68.1 | 52.2 | 36.1 | 29.4 |
| F1 22 (2022) | 99.2 | 90.6 | 67.8 | 20.1 |
| Baldur's Gate 3 (2023) | 44.6 | 36.9 | 30.8 | 30 |
| Cyberpunk 2077 2.2 Phantom Liberty (2023) | 44.5 | 34.7 | 27.4 | 24.4 |
| Monster Hunter Wilds (2025) | 25 | 19.5 | 14 |
Emisje
Hałas systemowy
Profil hałasu wentylatora pozostaje w dużej mierze taki sam, z podobną podłogą i sufitem jak w konfiguracji Intela. Obroty wentylatora mają jednak tendencję do nieco szybszego wzrostu w konfiguracji AMD.
Hałas
| luz |
| 24.4 / 24.4 / 28 dB |
| obciążenie |
| 46.2 / 45.9 dB |
 | ||
30 dB cichy 40 dB(A) słyszalny 50 dB(A) irytujący |
||
min: | ||
| Framework Laptop 13.5 Ryzen AI 9 HX 370 Radeon 890M, Ryzen AI 9 HX 370 | Framework Laptop 13.5 Core Ultra 7 155H Arc 8-Core, Ultra 7 155H | Dell Pro 13 Premium PA13250 Arc 140V, Core Ultra 7 268V, Micron 2550 1TB | MSI Summit E13 AI Evo A1MTG Arc 8-Core, Ultra 7 155H, Micron 2400 MTFDKBA1T0QFM | HP EliteBook x360 830 G10 7L7U1ET Iris Xe G7 80EUs, i5-1335U, Samsung PM991 MZVLQ512HBLU | Lenovo ThinkPad Z13 Gen 2 Radeon 780M, R7 PRO 7840U, SK hynix BC901 HFS001TEJ4X164N | |
|---|---|---|---|---|---|---|
| Noise | 4% | 10% | 2% | 12% | 4% | |
| wyłączone / środowisko * | 24.2 | 24 1% | 23 5% | 24 1% | 23.2 4% | 25.1 -4% |
| Idle Minimum * | 24.4 | 24.1 1% | 23 6% | 24.1 1% | 23.2 5% | 25.8 -6% |
| Idle Average * | 24.4 | 25.1 -3% | 23 6% | 24.8 -2% | 23.2 5% | 25.8 -6% |
| Idle Maximum * | 28 | 27 4% | 23 18% | 26.5 5% | 23.2 17% | 28.3 -1% |
| Load Average * | 46.2 | 38.4 17% | 37 20% | 39.3 15% | 29.4 36% | 28.3 39% |
| Cyberpunk 2077 ultra * | 45.8 | 43.7 5% | 42.74 7% | 45 2% | ||
| Load Maximum * | 45.9 | 45.8 -0% | 42.74 7% | 49.1 -7% | 42.5 7% | 44.8 2% |
| Witcher 3 ultra * | 42.3 | 44.8 |
* ... im mniej tym lepiej
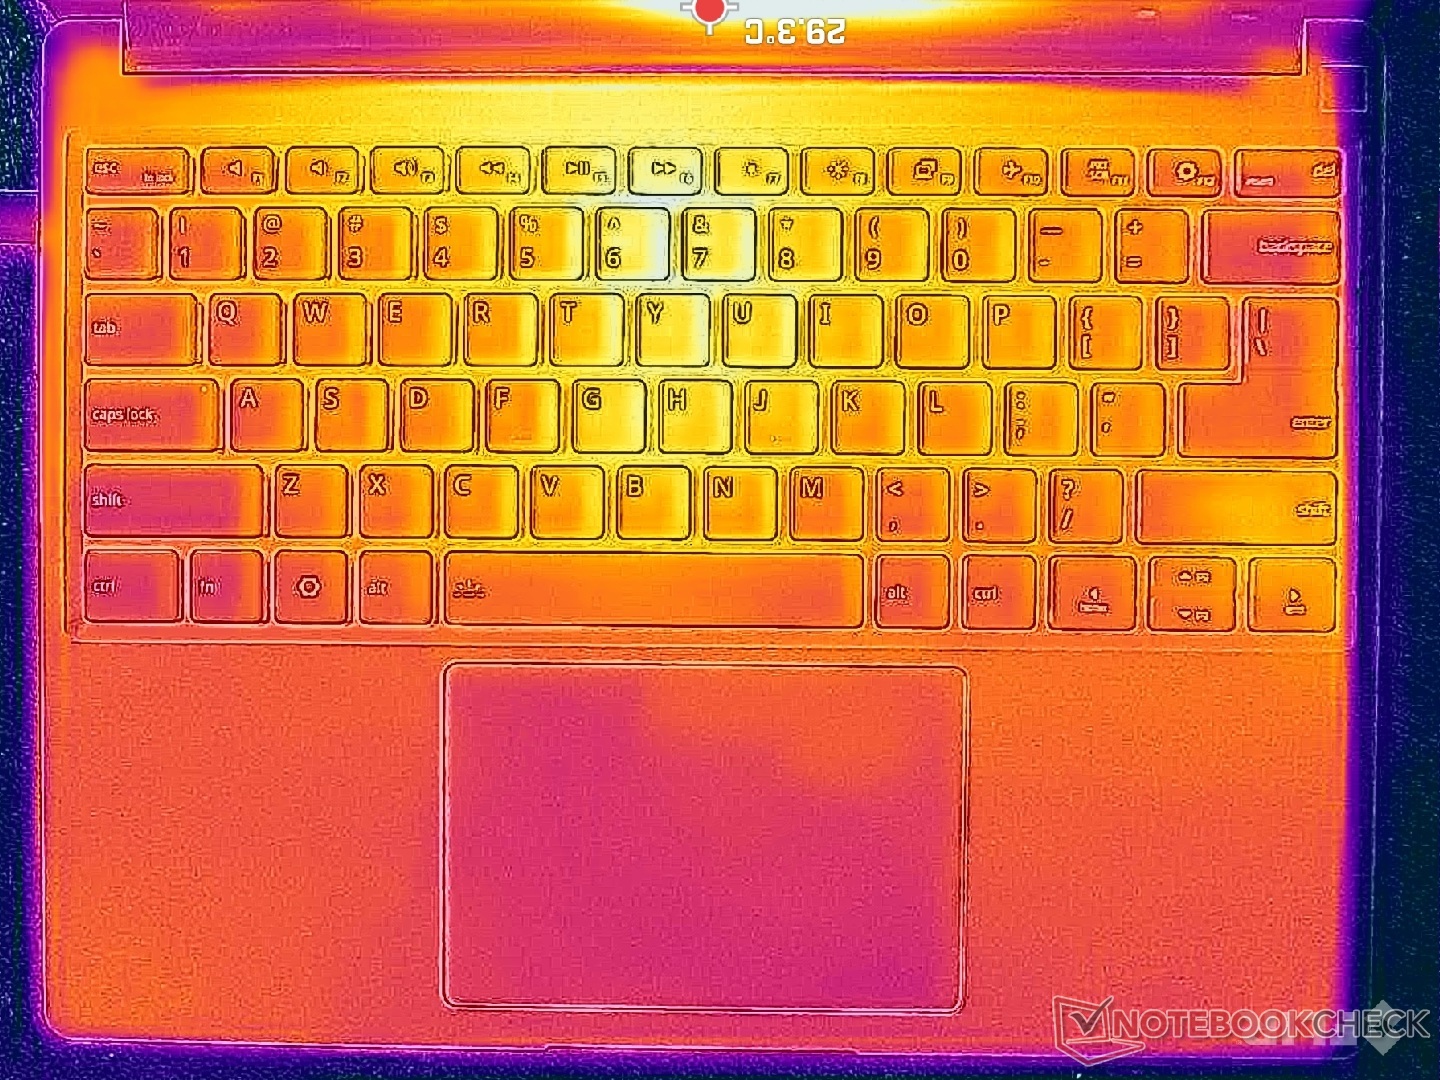
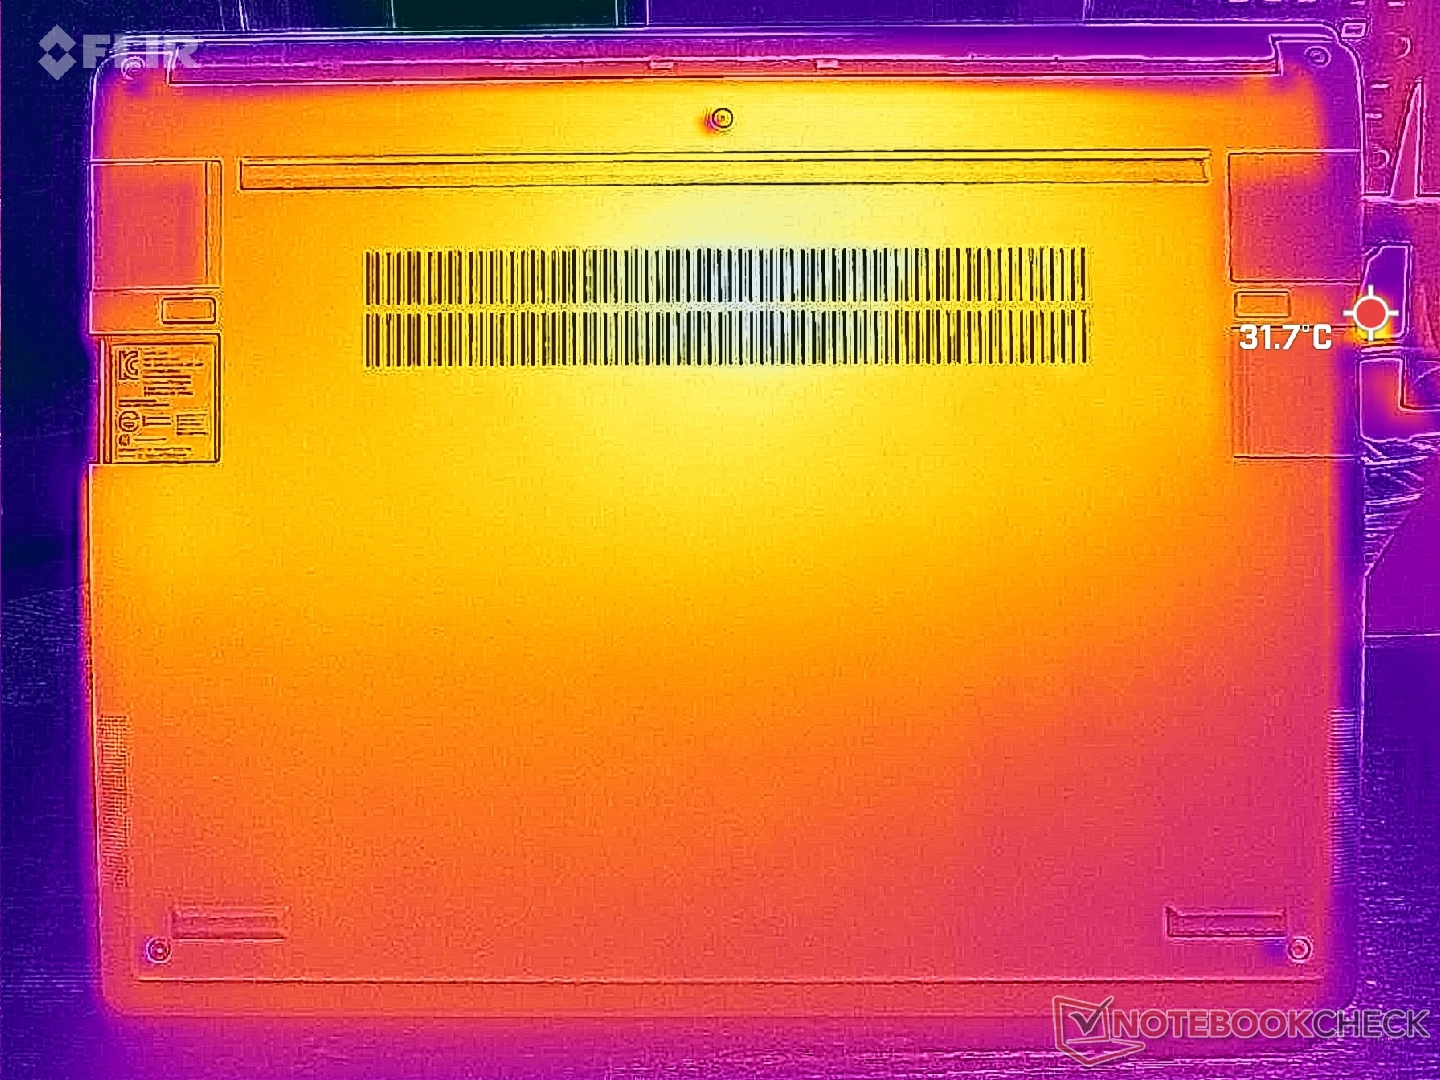
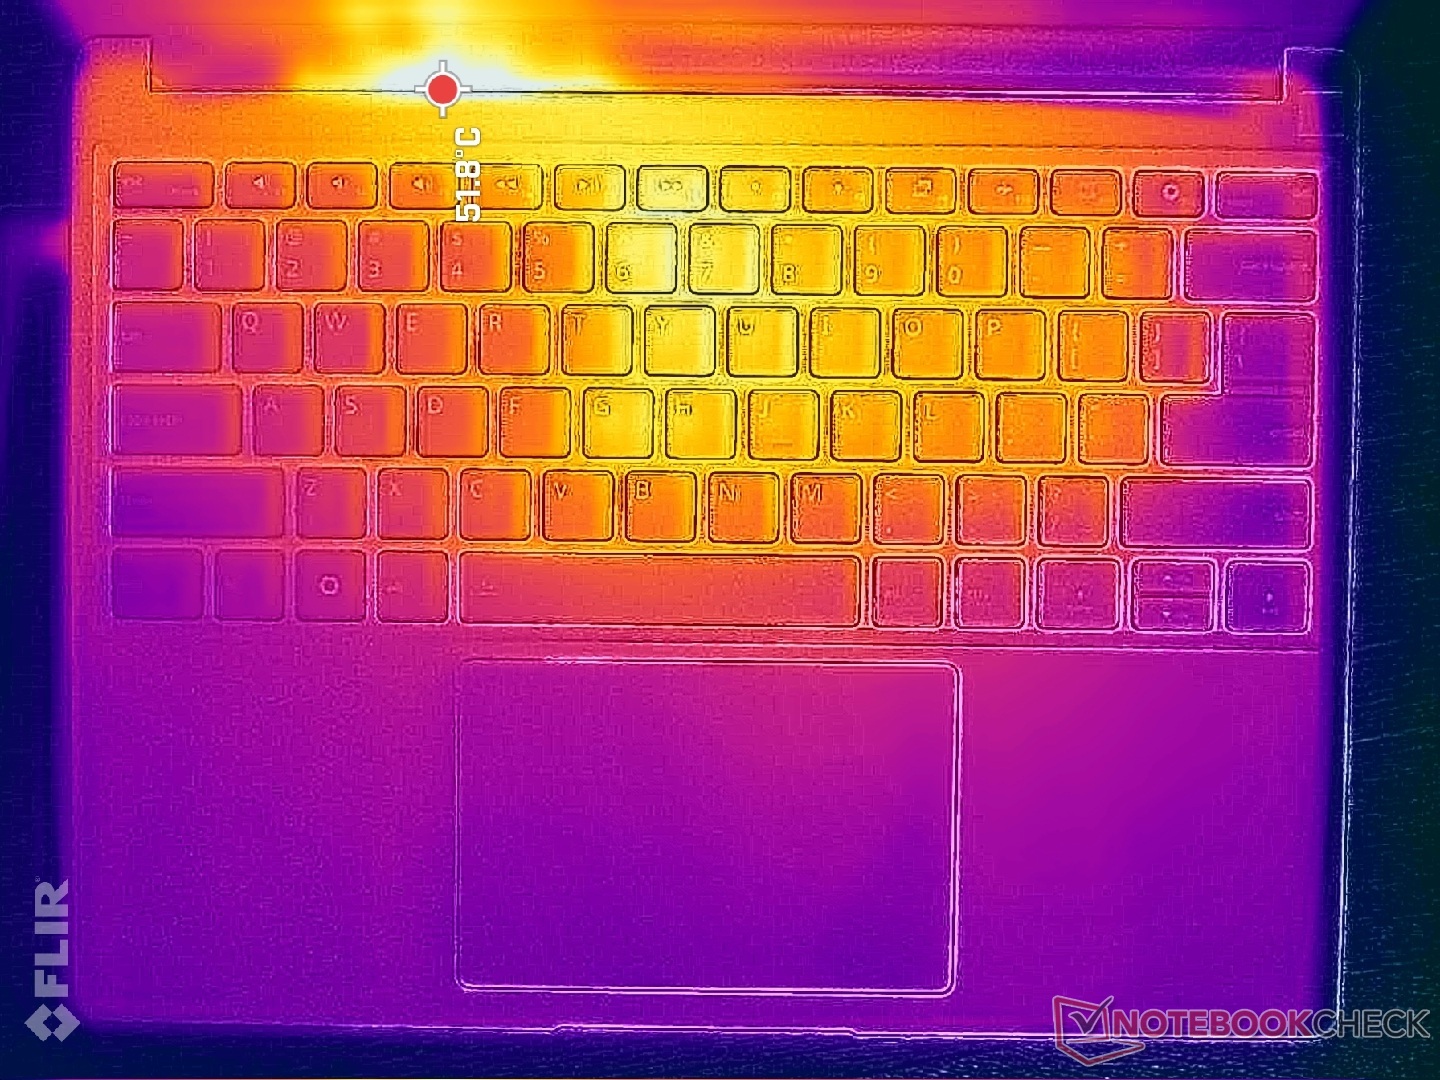
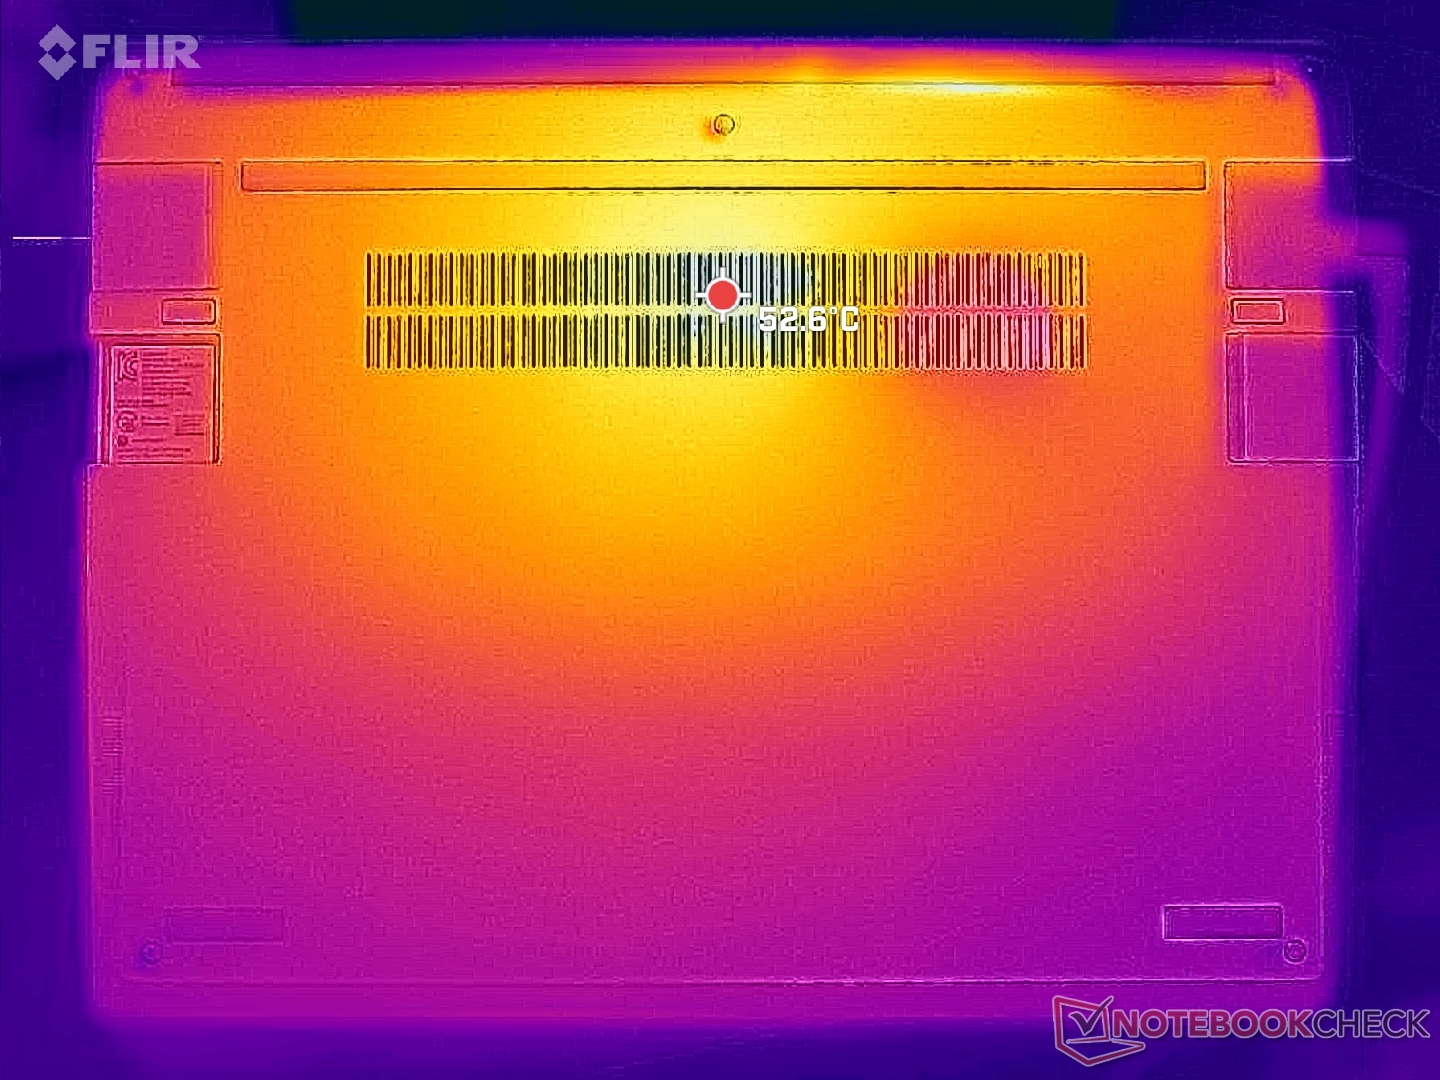
Temperatura
Rozwój temperatury powierzchni pozostaje w dużej mierze taki sam jak poprzednio, ponieważ powłoka termiczna i rozwiązanie chłodzące nie uległy zmianie.
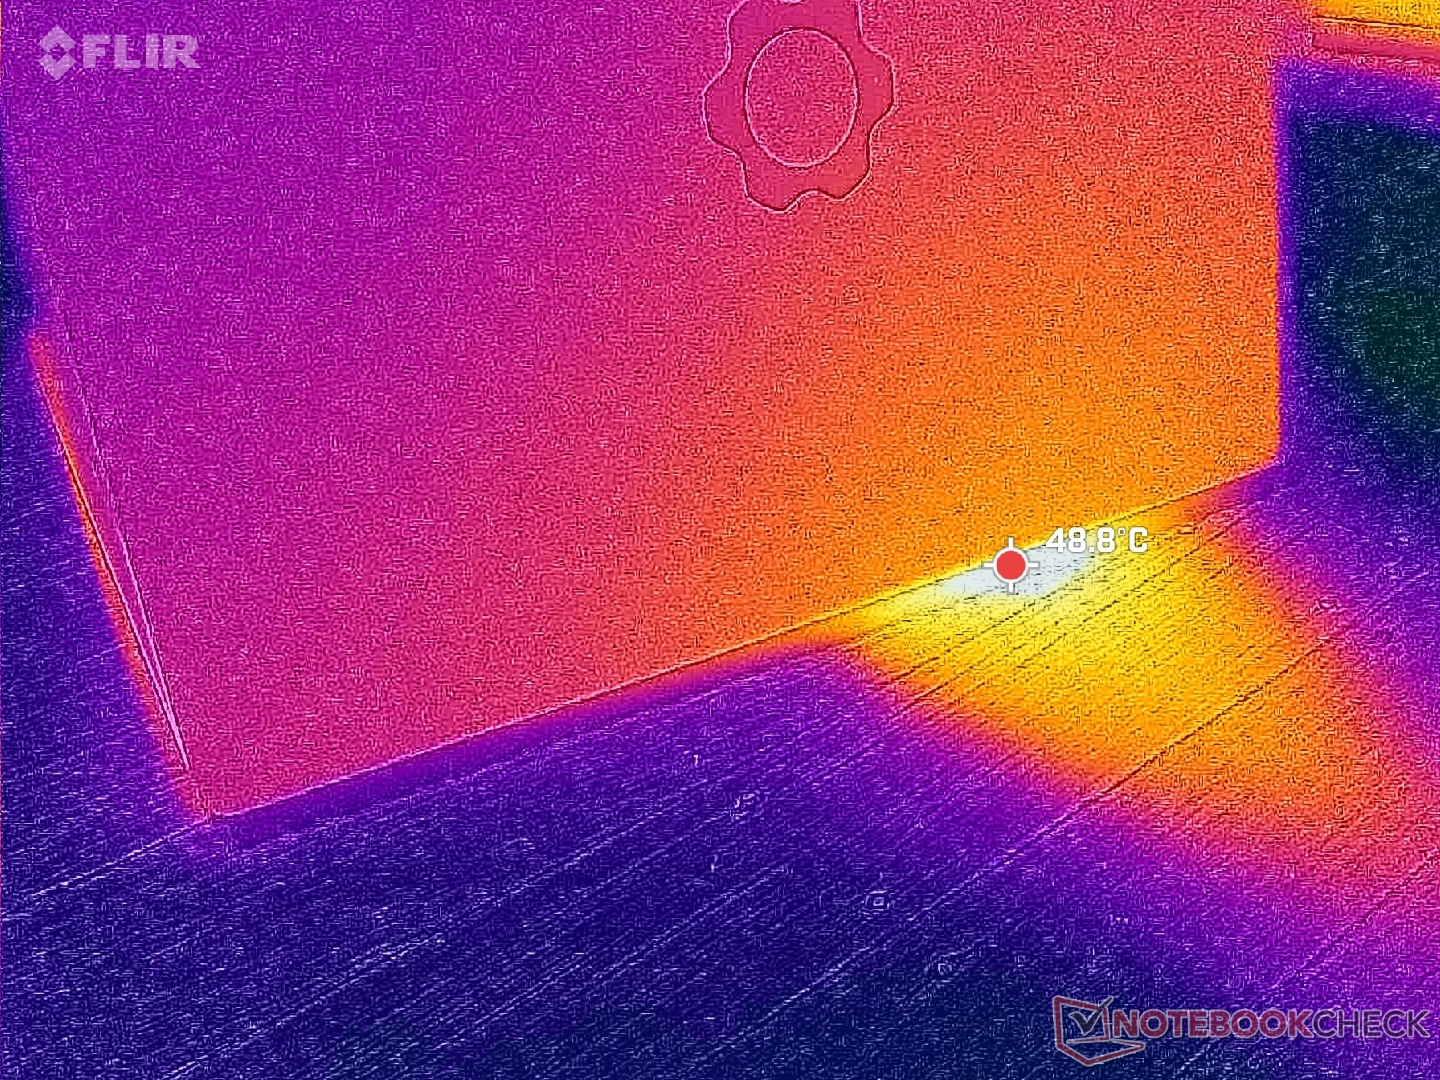
(±) Maksymalna temperatura w górnej części wynosi 42.2 °C / 108 F, w porównaniu do średniej 34.3 °C / 94 F , począwszy od 21.2 do 62.5 °C dla klasy Office.
(-) Dno nagrzewa się maksymalnie do 46.8 °C / 116 F, w porównaniu do średniej 36.8 °C / 98 F
(+) W stanie bezczynności średnia temperatura górnej części wynosi 29.2 °C / 85 F, w porównaniu ze średnią temperaturą urządzenia wynoszącą 29.5 °C / ### class_avg_f### F.
(+) Podpórki pod nadgarstki i touchpad są chłodniejsze niż temperatura skóry i maksymalnie 29 °C / 84.2 F i dlatego są chłodne w dotyku.
(±) Średnia temperatura obszaru podparcia dłoni w podobnych urządzeniach wynosiła 27.6 °C / 81.7 F (-1.4 °C / -2.5 F).
| Framework Laptop 13.5 Ryzen AI 9 HX 370 AMD Ryzen AI 9 HX 370, AMD Radeon 890M | Framework Laptop 13.5 Core Ultra 7 155H Intel Core Ultra 7 155H, Intel Arc 8-Core iGPU | Dell Pro 13 Premium PA13250 Intel Core Ultra 7 268V, Intel Arc Graphics 140V | MSI Summit E13 AI Evo A1MTG Intel Core Ultra 7 155H, Intel Arc 8-Core iGPU | HP EliteBook x360 830 G10 7L7U1ET Intel Core i5-1335U, Intel Iris Xe Graphics G7 80EUs | Lenovo ThinkPad Z13 Gen 2 AMD Ryzen 7 PRO 7840U, AMD Radeon 780M | |
|---|---|---|---|---|---|---|
| Heat | 6% | 27% | -7% | 5% | 11% | |
| Maximum Upper Side * | 42.2 | 42.8 -1% | 31 27% | 45.2 -7% | 40.2 5% | 46.2 -9% |
| Maximum Bottom * | 46.8 | 45.2 3% | 31 34% | 44.8 4% | 42.4 9% | 48.4 -3% |
| Idle Upper Side * | 31 | 27.2 12% | 24 23% | 34.8 -12% | 30 3% | 23.2 25% |
| Idle Bottom * | 32.2 | 28.6 11% | 24 25% | 35.8 -11% | 31.8 1% | 23 29% |
* ... im mniej tym lepiej
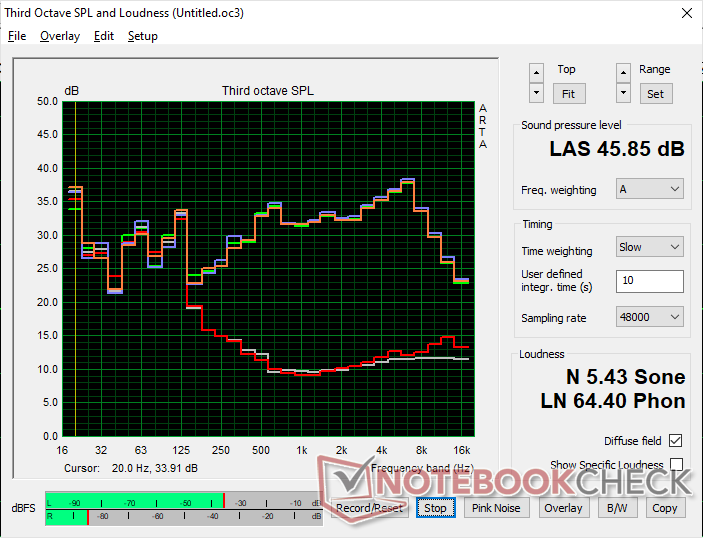
Głośniki
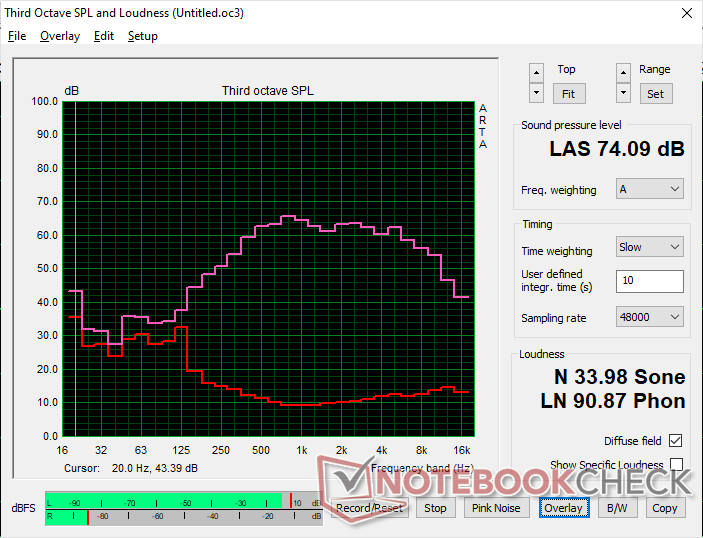
Framework Laptop 13.5 Ryzen AI 9 HX 370 analiza dźwięku
(±) | głośność głośnika jest średnia, ale dobra (74.1 dB)
Bas 100 - 315 Hz
(±) | zredukowany bas - średnio 14.3% niższy od mediany
(±) | liniowość basu jest średnia (7.3% delta do poprzedniej częstotliwości)
Średnie 400 - 2000 Hz
(+) | zbalansowane środki średnie - tylko 3.5% od mediany
(+) | średnie są liniowe (4.7% delta do poprzedniej częstotliwości)
Wysokie 2–16 kHz
(+) | zrównoważone maksima - tylko 2.9% od mediany
(+) | wzloty są liniowe (4.3% delta do poprzedniej częstotliwości)
Ogólnie 100 - 16.000 Hz
(±) | liniowość ogólnego dźwięku jest średnia (17.4% różnicy w stosunku do mediany)
W porównaniu do tej samej klasy
» 23% wszystkich testowanych urządzeń w tej klasie było lepszych, 7% podobnych, 69% gorszych
» Najlepszy miał deltę 7%, średnia wynosiła ###średnia###%, najgorsza wynosiła 53%
W porównaniu do wszystkich testowanych urządzeń
» 30% wszystkich testowanych urządzeń było lepszych, 8% podobnych, 61% gorszych
» Najlepszy miał deltę 4%, średnia wynosiła ###średnia###%, najgorsza wynosiła 134%
Apple MacBook Pro 16 2021 M1 Pro analiza dźwięku
(+) | głośniki mogą odtwarzać stosunkowo głośno (84.7 dB)
Bas 100 - 315 Hz
(+) | dobry bas - tylko 3.8% od mediany
(+) | bas jest liniowy (5.2% delta do poprzedniej częstotliwości)
Średnie 400 - 2000 Hz
(+) | zbalansowane środki średnie - tylko 1.3% od mediany
(+) | średnie są liniowe (2.1% delta do poprzedniej częstotliwości)
Wysokie 2–16 kHz
(+) | zrównoważone maksima - tylko 1.9% od mediany
(+) | wzloty są liniowe (2.7% delta do poprzedniej częstotliwości)
Ogólnie 100 - 16.000 Hz
(+) | ogólny dźwięk jest liniowy (4.6% różnicy w stosunku do mediany)
W porównaniu do tej samej klasy
» 0% wszystkich testowanych urządzeń w tej klasie było lepszych, 0% podobnych, 100% gorszych
» Najlepszy miał deltę 5%, średnia wynosiła ###średnia###%, najgorsza wynosiła 45%
W porównaniu do wszystkich testowanych urządzeń
» 0% wszystkich testowanych urządzeń było lepszych, 0% podobnych, 100% gorszych
» Najlepszy miał deltę 4%, średnia wynosiła ###średnia###%, najgorsza wynosiła 134%
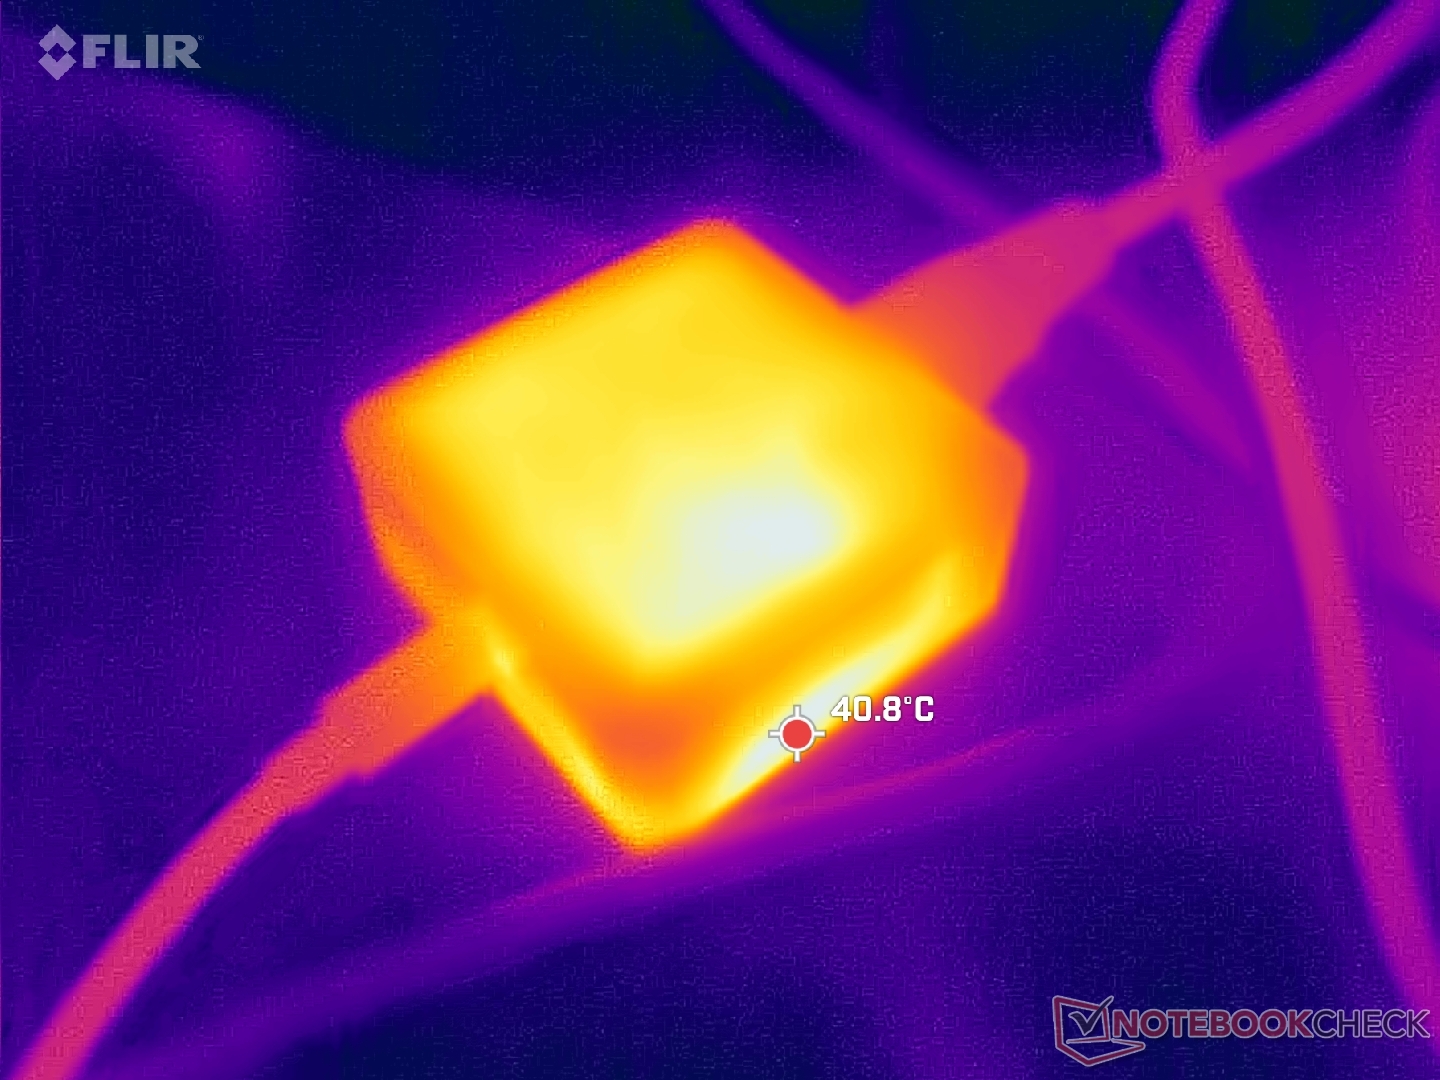
Zarządzanie energią
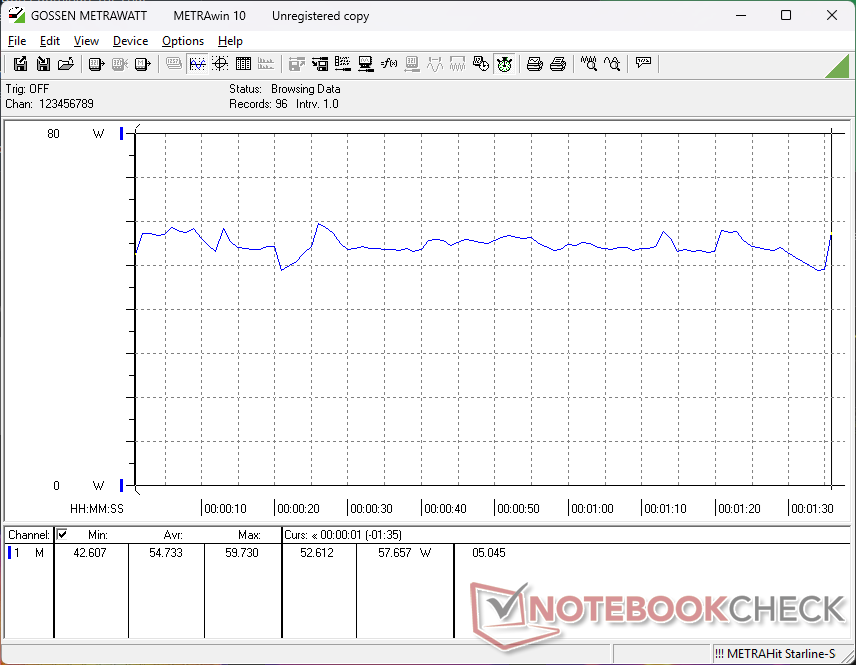
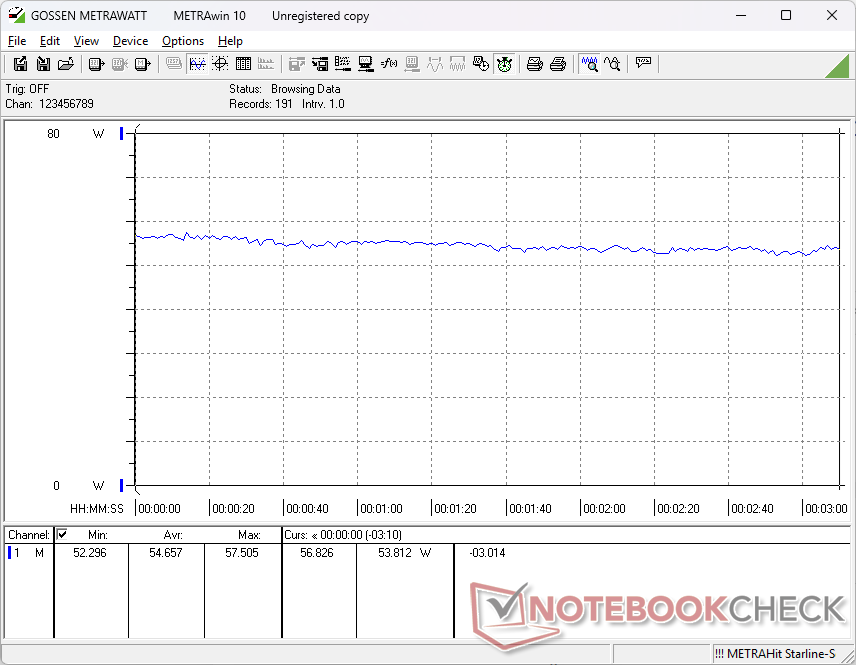
Zużycie energii
Poziomy zużycia energii są zbliżone do tego, co odnotowaliśmy w zeszłorocznej opcji Core Ultra 7 155H, zapewniając jednocześnie szybszą wydajność procesora i karty graficznej, co zapewnia lepszą wydajność w przeliczeniu na wat w przypadku naszej konfiguracji AMD. Mimo to, system AMD jest nieco bardziej wymagający podczas bezczynności na pulpicie, co ma wpływ na żywotność baterii.
| wyłączony / stan wstrzymania | |
| luz | |
| obciążenie |
|
Legenda:
min: | |
| Framework Laptop 13.5 Ryzen AI 9 HX 370 Ryzen AI 9 HX 370, Radeon 890M, , IPS, 2880x1920, 13.5" | Framework Laptop 13.5 Core Ultra 7 155H Ultra 7 155H, Arc 8-Core, , IPS, 2880x1920, 13.5" | Framework Laptop 13.5 Ryzen 7 7840U R7 7840U, Radeon 780M, WD PC SN740 512GB SDDPNQD-512G, IPS, 2256x1504, 13.5" | Framework Laptop 13.5 13th Gen Intel i7-1370P, Iris Xe G7 96EUs, WD PC SN740 SDDPNQD-1T00, IPS, 2256x1504, 13.5" | Framework Laptop 13.5 12th Gen Intel i7-1260P, Iris Xe G7 96EUs, WDC PC SN730 SDBPNTY-512G, IPS, 2256x1504, 13.5" | Framework Laptop 13.5 i7-1165G7, Iris Xe G7 96EUs, Western Digital WD_BLACK SN850 WDS100T1X0E, IPS, 2256x1504, 13.5" | |
|---|---|---|---|---|---|---|
| Power Consumption | 26% | 30% | 23% | 11% | 23% | |
| Idle Minimum * | 7.6 | 2.5 67% | 4 47% | 2.9 62% | 5.3 30% | 4.3 43% |
| Idle Average * | 11.3 | 5.2 54% | 6.5 42% | 6.3 44% | 8.4 26% | 8.2 27% |
| Idle Maximum * | 11.5 | 5.8 50% | 6.8 41% | 9.9 14% | 11.2 3% | 8.7 24% |
| Load Average * | 54.7 | 47.5 13% | 48 12% | 56.2 -3% | 57.4 -5% | 43.5 20% |
| Cyberpunk 2077 ultra external monitor * | 51.3 | 52.4 -2% | ||||
| Cyberpunk 2077 ultra * | 54.6 | 54.5 -0% | ||||
| Load Maximum * | 60.9 | 61.5 -1% | 55.2 9% | 60.8 -0% | 61.2 -0% | 61.8 -1% |
| Witcher 3 ultra * | 52.3 | 56.6 | 46.7 | 43.5 |
* ... im mniej tym lepiej
Power Consumption Cyberpunk / Stress Test
Power Consumption external Monitor
Żywotność baterii
Czas pracy jest dobry, ale zauważalnie krótszy niż w przypadku starszych procesorów.
| Framework Laptop 13.5 Ryzen AI 9 HX 370 Ryzen AI 9 HX 370, Radeon 890M, 61 Wh | Framework Laptop 13.5 Core Ultra 7 155H Ultra 7 155H, Arc 8-Core, 61 Wh | Framework Laptop 13.5 Ryzen 7 7840U R7 7840U, Radeon 780M, 61 Wh | Framework Laptop 13.5 13th Gen Intel i7-1370P, Iris Xe G7 96EUs, 61 Wh | Framework Laptop 13.5 12th Gen Intel i7-1260P, Iris Xe G7 96EUs, 55 Wh | Framework Laptop 13.5 i7-1165G7, Iris Xe G7 96EUs, 55 Wh | |
|---|---|---|---|---|---|---|
| Czasy pracy | 31% | 51% | 10% | -7% | 0% | |
| WiFi v1.3 | 480 | 630 31% | 726 51% | 527 10% | 447 -7% | 478 0% |
| Reader / Idle | 2296 | |||||
| Load | 90 |
Ocena Notebookcheck
Framework Laptop 13.5 Ryzen AI 9 HX 370
- 14/04/2025 v8
Allen Ngo
 Total Sustainability Score:
 Potential Competitors in Comparison
Obraz | Model / recenzja | Cena | Waga | Wysokość | Ekran |
|---|---|---|---|---|---|
1. 83.8%  | Framework Laptop 13.5 Ryzen AI 9 HX 370 AMD Ryzen AI 9 HX 370 ⎘ AMD Radeon 890M ⎘ 32 GB Pamięć | Amazon: 1. $1,094.16 ASUS Vivobook S 14 OLED Slim... 2. $1,449.00 HP 2024 OmniBook Ultra 14”... 3. $1,449.00 HP OmniBook Ultra 14 2024 La... Cena katalogowa: 2100 USD | 1.3 kg | 15.85 mm | 13.50" 2880x1920 256 PPI IPS |
2. 84%  | Framework Laptop 13.5 Core Ultra 7 155H Intel Core Ultra 7 155H ⎘ Intel Arc 8-Core iGPU ⎘ 32 GB Pamięć | Cena katalogowa: 1500 USD | 1.4 kg | 15.85 mm | 13.50" 2880x1920 256 PPI IPS |
3. 89.9%  | Dell Pro 13 Premium PA13250 Intel Core Ultra 7 268V ⎘ Intel Arc Graphics 140V ⎘ 32 GB Pamięć, 1024 GB SSD | Amazon: 1. $39.99 Smatree Hard Shell Laptop Ca... 2. $29.99 Smatree Hard EVA Protective ... 3. $49.99 Smatree 13 inch Laptop Sleev... Cena katalogowa: 2700 Euro | 1.1 kg | 17.2 mm | 13.30" 1920x1200 170 PPI IPS |
4. 78.6%  | MSI Summit E13 AI Evo A1MTG Intel Core Ultra 7 155H ⎘ Intel Arc 8-Core iGPU ⎘ 16 GB Pamięć, 1024 GB SSD | Amazon: $1,099.00 Cena katalogowa: 1100 USD | 1.3 kg | 16.2 mm | 13.30" 1920x1200 170 PPI IPS |
5. 89.4% v7 (old)  | HP EliteBook x360 830 G10 7L7U1ET Intel Core i5-1335U ⎘ Intel Iris Xe Graphics G7 80EUs ⎘ 16 GB Pamięć, 512 GB SSD | Amazon: $699.99 Cena katalogowa: 1300 Euro | 1.3 kg | 19.2 mm | 13.30" 1920x1200 170 PPI IPS LED |
6. 89.5% v7 (old)  | Lenovo ThinkPad Z13 Gen 2 AMD Ryzen 7 PRO 7840U ⎘ AMD Radeon 780M ⎘ 32 GB Pamięć, 1024 GB SSD | Amazon: 1. $1,279.00 Lenovo 2024 ThinkPad Z13 Gen... 2. $1,339.99 Lenovo ThinkPad X13 2-in-1 G... 3. $959.99 Lenovo ThinkPad E16 Gen 2 AI... Cena katalogowa: 1800 USD | 1.2 kg | 13.99 mm | 13.30" 2880x1800 255 PPI OLED |
Przezroczystość
Wyboru urządzeń do recenzji dokonuje nasza redakcja. Próbka testowa została udostępniona autorowi jako pożyczka od producenta lub sprzedawcy detalicznego na potrzeby tej recenzji. Pożyczkodawca nie miał wpływu na tę recenzję, producent nie otrzymał też kopii tej recenzji przed publikacją. Nie było obowiązku publikowania tej recenzji. Nigdy nie przyjmujemy rekompensaty ani płatności w zamian za nasze recenzje. Jako niezależna firma medialna, Notebookcheck nie podlega władzy producentów, sprzedawców detalicznych ani wydawców.
Tak testuje Notebookcheck
Każdego roku Notebookcheck niezależnie sprawdza setki laptopów i smartfonów, stosując standardowe procedury, aby zapewnić porównywalność wszystkich wyników. Od około 20 lat stale rozwijamy nasze metody badawcze, ustanawiając przy tym standardy branżowe. W naszych laboratoriach testowych doświadczeni technicy i redaktorzy korzystają z wysokiej jakości sprzętu pomiarowego. Testy te obejmują wieloetapowy proces walidacji. Nasz kompleksowy system ocen opiera się na setkach uzasadnionych pomiarów i benchmarków, co pozwala zachować obiektywizm.
