Recenzja stacji roboczej Lenovo ThinkPad P16 Gen 2: Ciężki z doładowaną grafiką
Nvidia RTX 4000 Ada debiutuje z imponującymi wynikami.
Opcja grafiki TGP o mocy 130 W sprawia, że jest to jedna z najszybszych 16-calowych stacji roboczych w portfolio Lenovo. Jednak takie aspekty jak temperatura i hałas wentylatora są odpowiednio cieplejsze i głośniejsze niż przeciętnie, co wynika z wymagającego GPU.Allen Ngo (tłumaczenie DeepL / Ninh Duy) Opublikowany 🇺🇸 🇫🇷 ...
Werdykt - władza ma swoją cenę
ThinkPad P16 Gen 2 stawia na wydajność, nawet jeśli oznacza to większy, cięższy, głośniejszy i cieplejszy system. Jeśli są Państwo w stanie poradzić sobie z tymi wadami, to okaże się, że jego 130 W RTX 4000 Ada jest potworem mobilnej stacji roboczej.
ThinkPad P16 Gen 2 jest w stanie sprostać wymagającym obciążeniom dzięki wymagającej grafice TGP o mocy 130 W, która odróżnia go od większości innych 16-calowych stacji roboczych.
Być może najbardziej zauważalną wadą jest to, że GPU może dławić się o około 10 procent po kilku minutach stresu, co sugeruje, że rozwiązanie chłodzące nie jest w stanie wytrzymać pełnego zapotrzebowania GPU w nieskończoność. Czas pracy na baterii jest również bardzo krótki i wynosi maksymalnie kilka godzin. Mimo to ThinkPad P16 Gen 2 jest nadal jedną z najszybszych stacji roboczych w swojej 16-calowej klasie wielkości.
Za
Przeciw
Cena i dostępność
Lenovo wysyła teraz ThinkPad P16 Gen 2 bezpośrednio ze swojego sklepu internetowego w cenie od 1850 USD lub 3770 USD w przypadku konfiguracji z RTX 4000. Niewielka liczba jednostek SKU jest również dostępna za pośrednictwem Amazon.
Price comparison
Potencjalni konkurenci w porównaniu
Obraz | Model / recenzja | Geizhals | Waga | Wysokość | Ekran |
|---|---|---|---|---|---|
1. 85.9%  | Lenovo ThinkPad P16 Gen 2 Intel Core i7-14700HX ⎘ NVIDIA RTX 4000 Ada Generation Laptop ⎘ 32 GB Pamięć, 1024 GB SSD | Listenpreis 3500 USD Geizhals Suche | 3.1 kg | 30.23 mm | 16.00" 2560x1600 189 PPI IPS |
2. 90.2% v7 (old)  | Lenovo ThinkPad P16 G2 21FA000FGE Intel Core i7-13700HX ⎘ NVIDIA RTX 2000 Ada Generation Laptop ⎘ 32 GB Pamięć, 1024 GB SSD | 3 kg | 30.23 mm | 16.00" 2560x1600 189 PPI IPS LED | |
3. 88.6% v7 (old)  | Lenovo ThinkPad P16s G2 21K9000CGE AMD Ryzen 7 PRO 7840U ⎘ AMD Radeon 780M ⎘ 32 GB Pamięć, 1024 GB SSD | 1.8 kg | 24.4 mm | 16.00" 3840x2400 283 PPI OLED | |
4. 91% v7 (old)  | Lenovo ThinkPad P16 G1 RTX A5500 Intel Core i9-12950HX ⎘ NVIDIA RTX A5500 Laptop GPU ⎘ 64 GB Pamięć, 2048 GB SSD | Listenpreis 9000 USD | 3 kg | 30.23 mm | 16.00" 3840x2400 283 PPI IPS |
5. 85.4%  | HP ZBook Power 16 G11 A AMD Ryzen 7 8845HS ⎘ NVIDIA RTX 2000 Ada Generation Laptop ⎘ 64 GB Pamięć, 2048 GB SSD | 2.2 kg | 22.9 mm | 16.00" 2560x1600 189 PPI IPS | |
6. 88.3% v7 (old)  | Dell Precision 5690 Intel Core Ultra 9 185H ⎘ NVIDIA RTX 5000 Ada Generation Laptop ⎘ 32 GB Pamięć, 2048 GB SSD | 2.3 kg | 22.17 mm | 16.00" 3840x2400 283 PPI OLED |
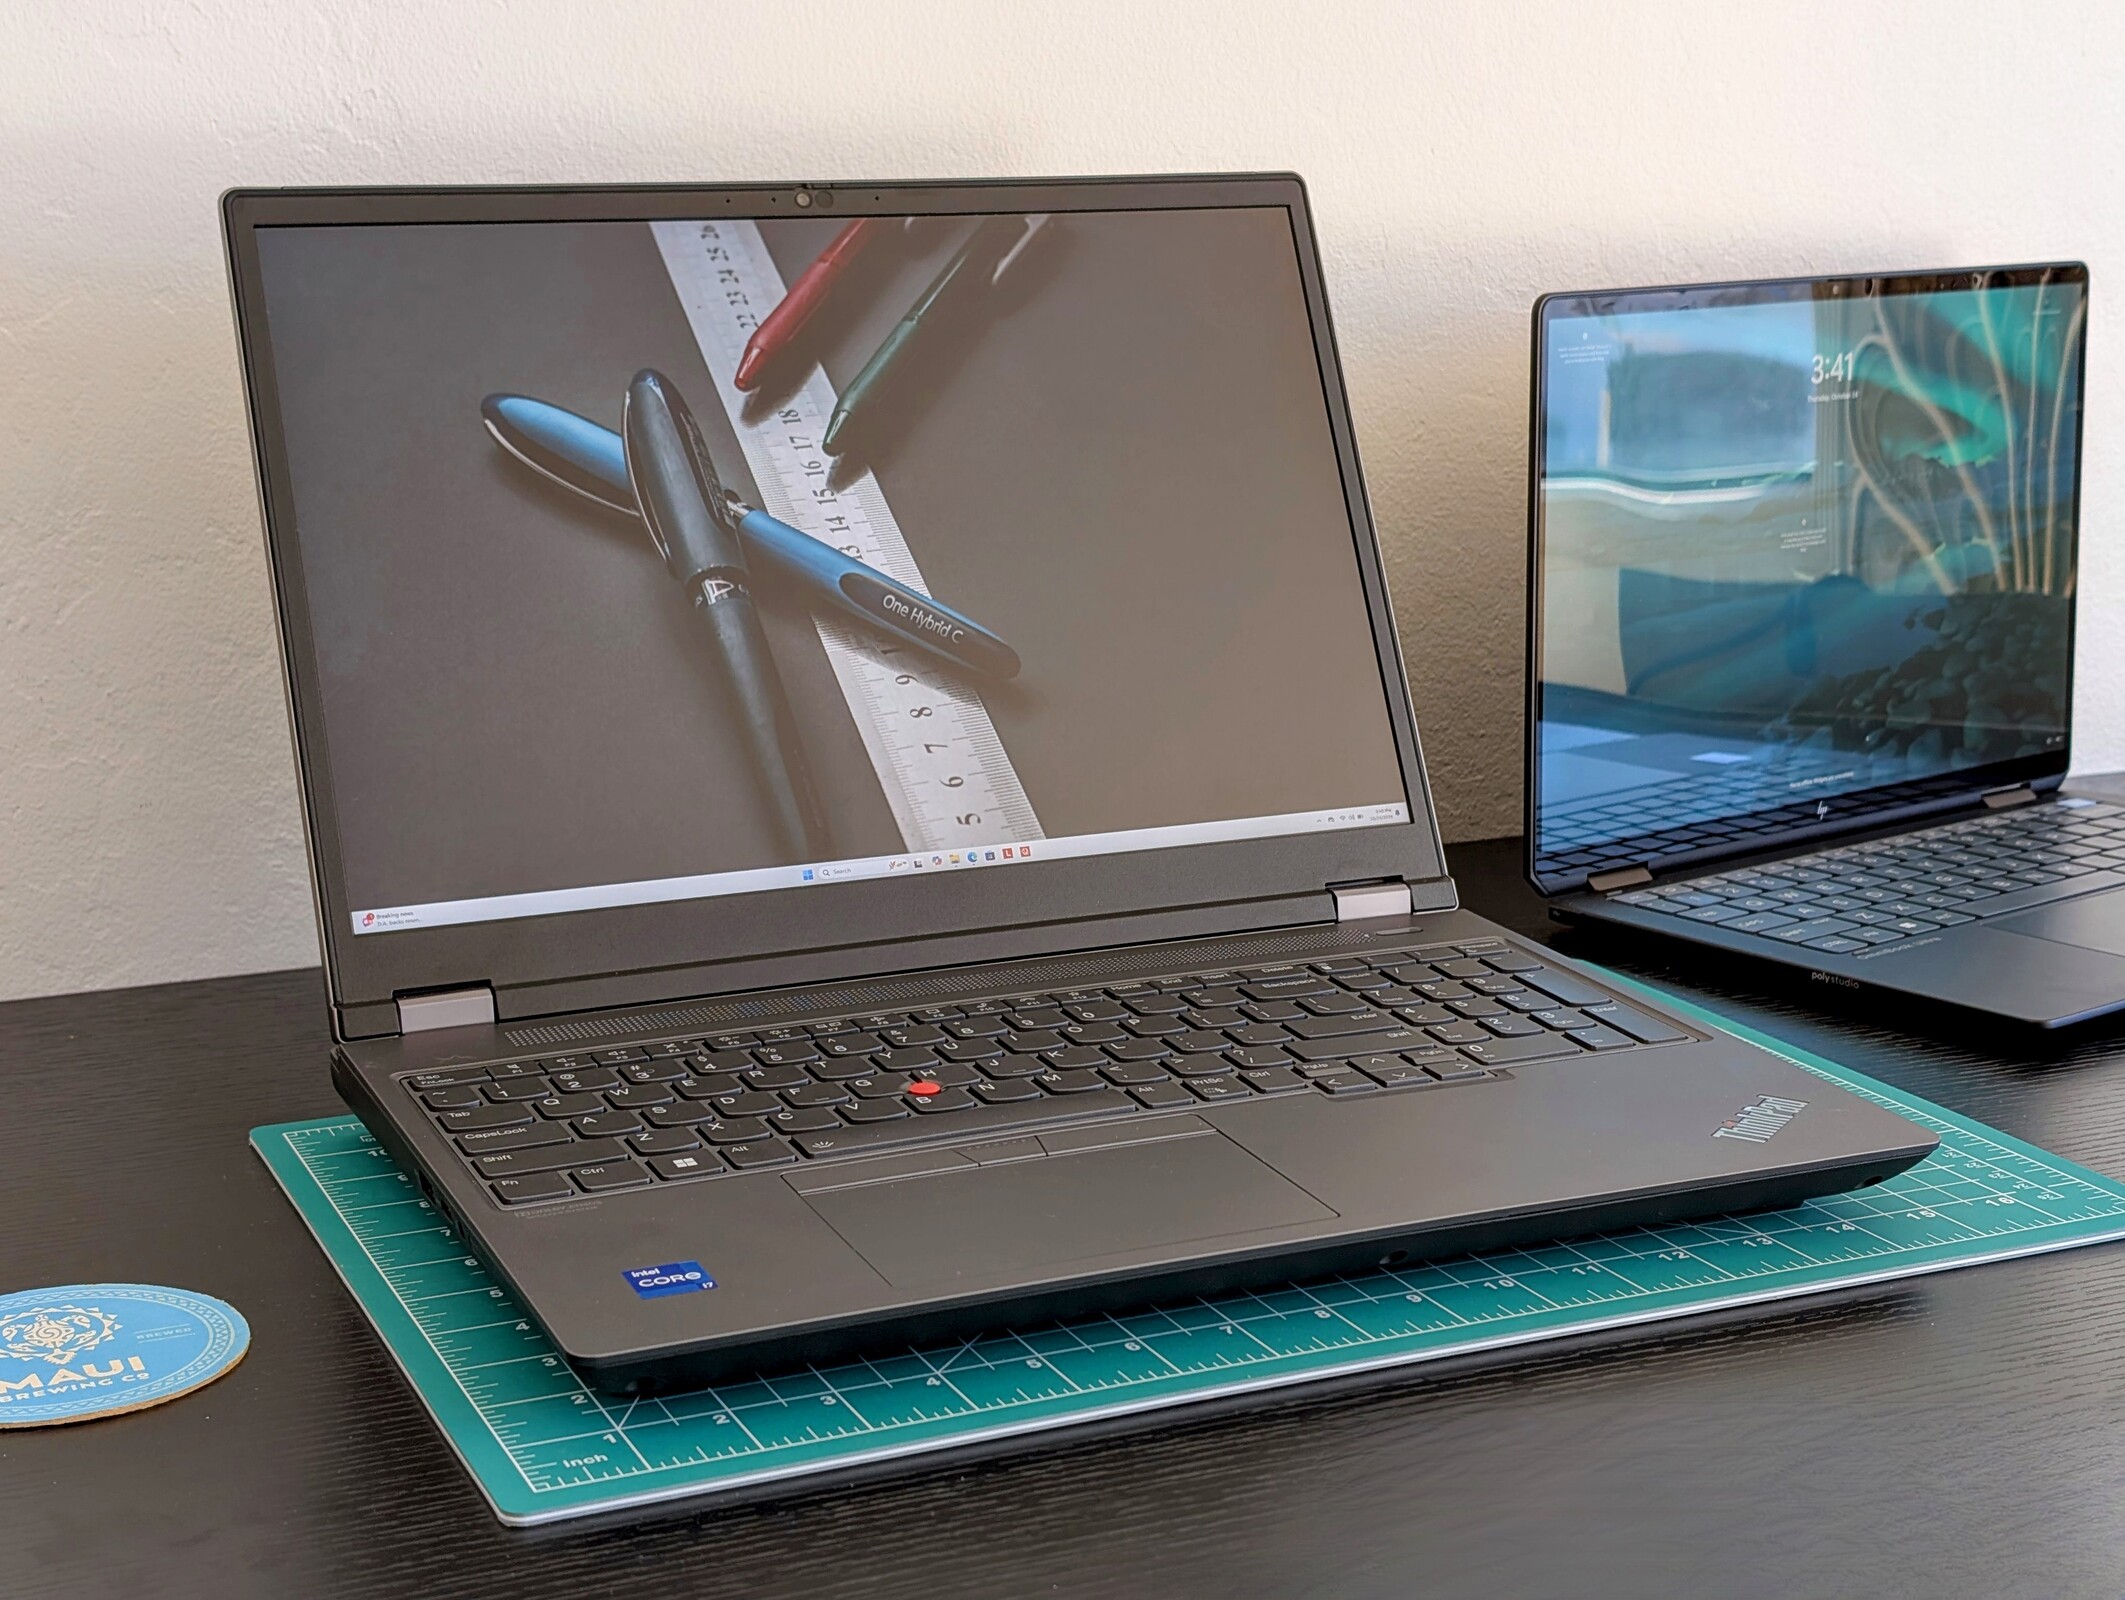
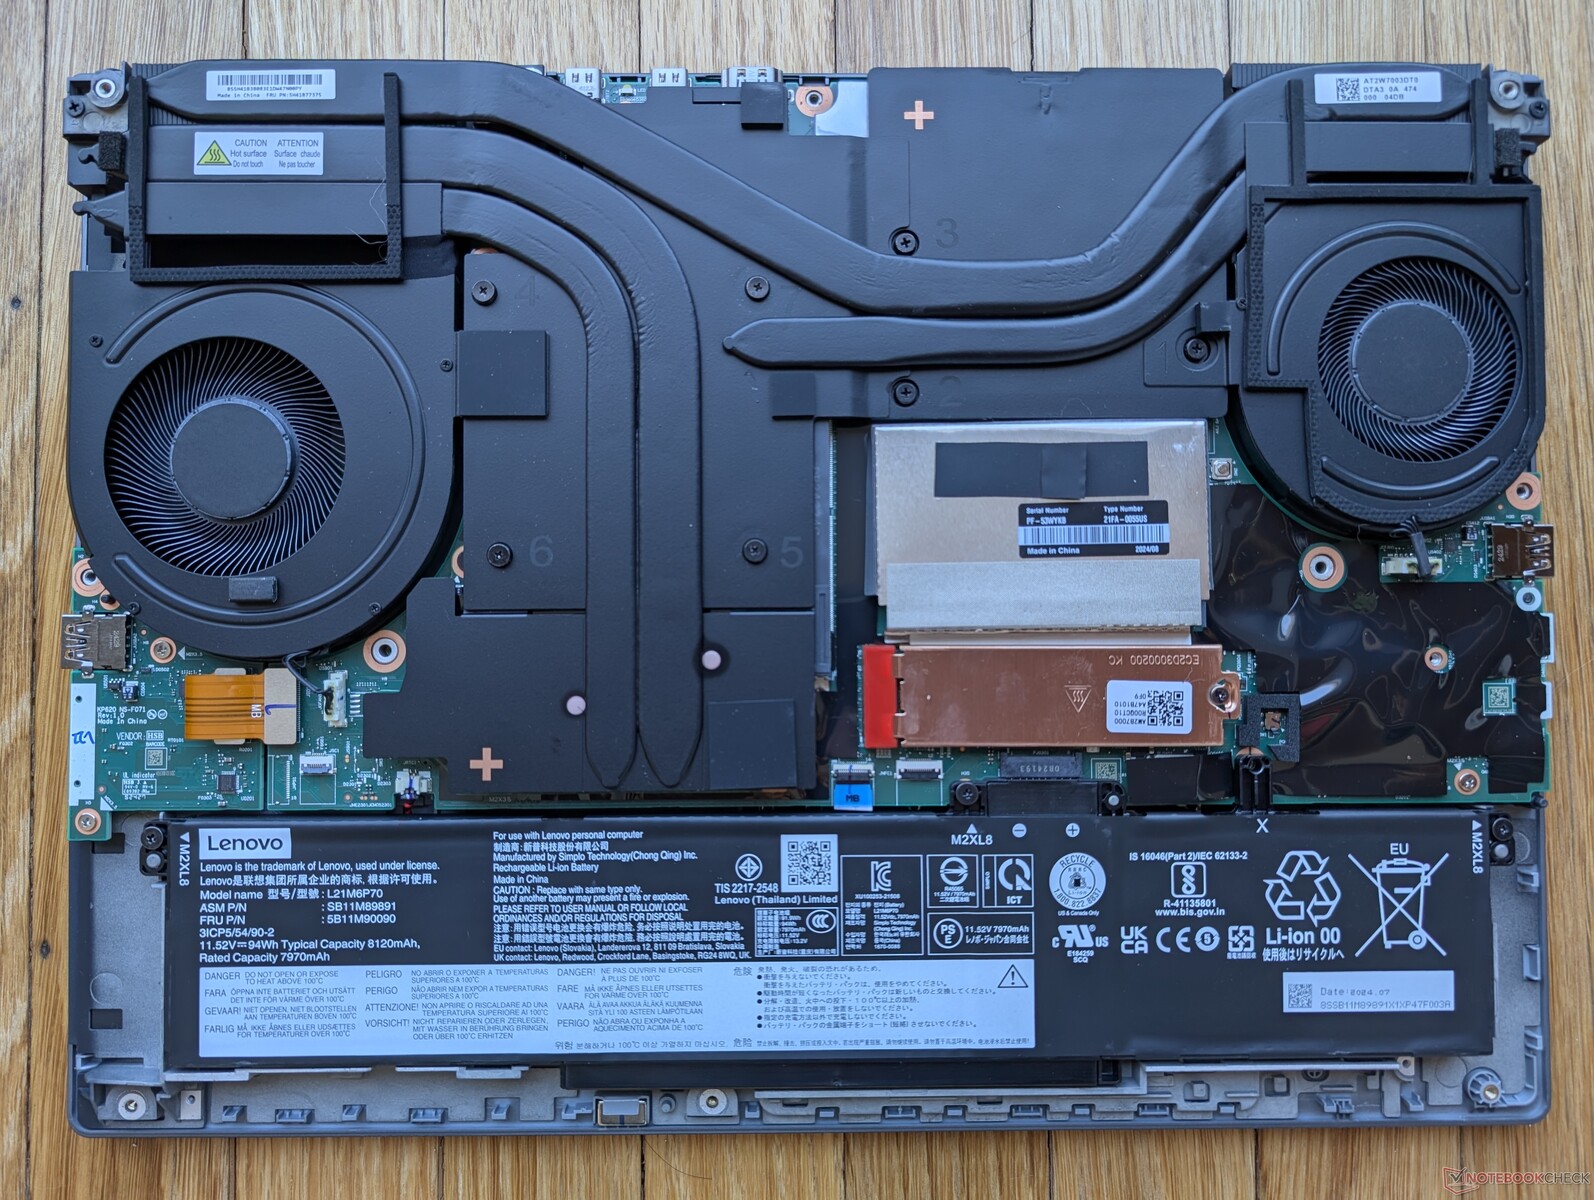
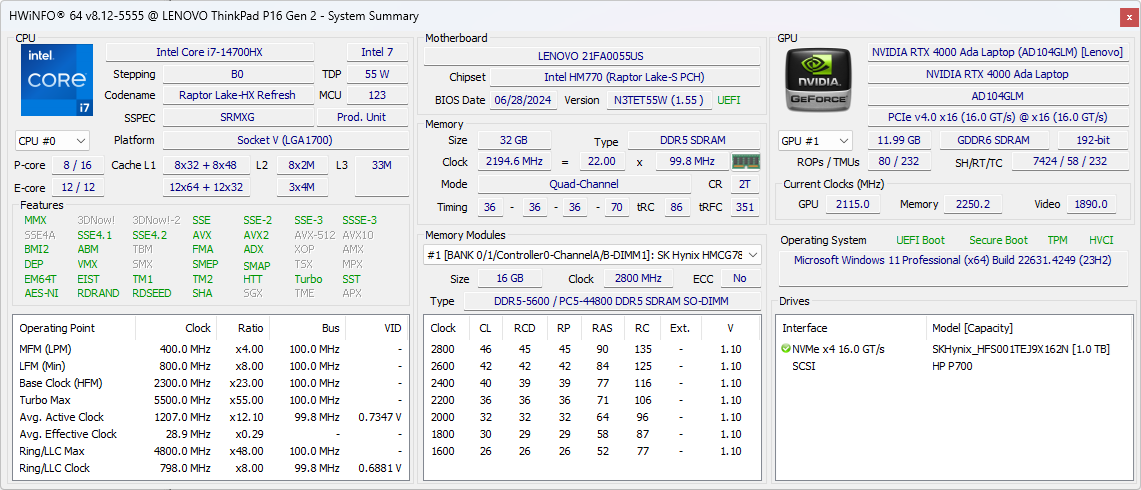
Lenovo aktualizuje swoją linię premium ThinkPad P16 Gen 2 o nowsze procesory Raptor Lake-HX Refresh na czwarty kwartał 2024 roku, aby zastąpić oryginalne opcje Raptor Lake-HX wydane na początku tego roku. Konstrukcja obudowy poza tym pozostaje niezmieniona, więc wszystkie nasze wrażenia dotyczące oryginalnej recenzji ThinkPada P16 Gen 2 dotyczą również portów.
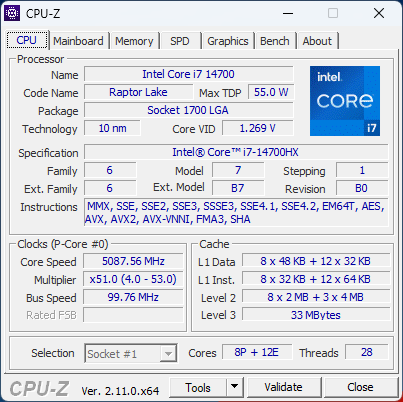
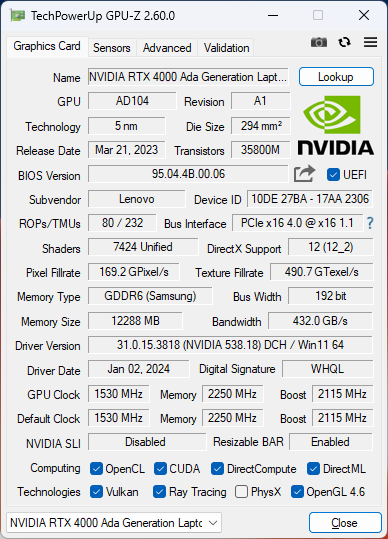
Nasza jednostka testowa została wyposażona w procesor Core i7-14700HX i 130 W GPU Nvidia RTX 4000 Ada w porównaniu do Core i7-13700HX i 80 W RTX 2000 w naszej pierwszej recenzji ThinkPada P16 Gen 2. Wzrost wydajności jest znaczący, co pokazują poniższe dane.
Konkurentami ThinkPada P16 Gen 2 są inne wysokowydajne 16-calowe mobilne stacje robocze, takie jak HP ZBook Power 16 G11 A lub Dell Precision 5690.
Więcej recenzji Lenovo:
Specyfikacje
Sprawa
Czytnik kart SD
| SD Card Reader | |
| average JPG Copy Test (av. of 3 runs) | |
| HP ZBook Power 16 G11 A (Toshiba Exceria Pro SDXC 64 GB UHS-II) | |
| Lenovo ThinkPad P16 Gen 2 (Toshiba Exceria Pro SDXC 64 GB UHS-II) | |
| Lenovo ThinkPad P16 G1 RTX A5500 (Toshiba Exceria Pro SDXC 64 GB UHS-II) | |
| Lenovo ThinkPad P16 G2 21FA000FGE | |
| maximum AS SSD Seq Read Test (1GB) | |
| HP ZBook Power 16 G11 A (Toshiba Exceria Pro SDXC 64 GB UHS-II) | |
| Lenovo ThinkPad P16 Gen 2 (Toshiba Exceria Pro SDXC 64 GB UHS-II) | |
| Lenovo ThinkPad P16 G2 21FA000FGE | |
| Lenovo ThinkPad P16 G1 RTX A5500 (Toshiba Exceria Pro SDXC 64 GB UHS-II) | |
Komunikacja
Kamera internetowa


Konserwacja
Zrównoważony rozwój
Podczas produkcji Lenovo wykorzystuje znaczną ilość materiałów pochodzących z recyklingu, w tym 50 procent aluminium pochodzącego z recyklingu na zewnętrzną pokrywę (pokrywa A), 90 procent magnezu na klawiaturę (pokrywa C) oraz >85 procent tworzyw sztucznych pochodzących od konsumentów na nasadki klawiszy, akumulator i głośniki.
Opakowanie nie zawiera plastiku i w pełni nadaje się do recyklingu.
Akcesoria i gwarancja
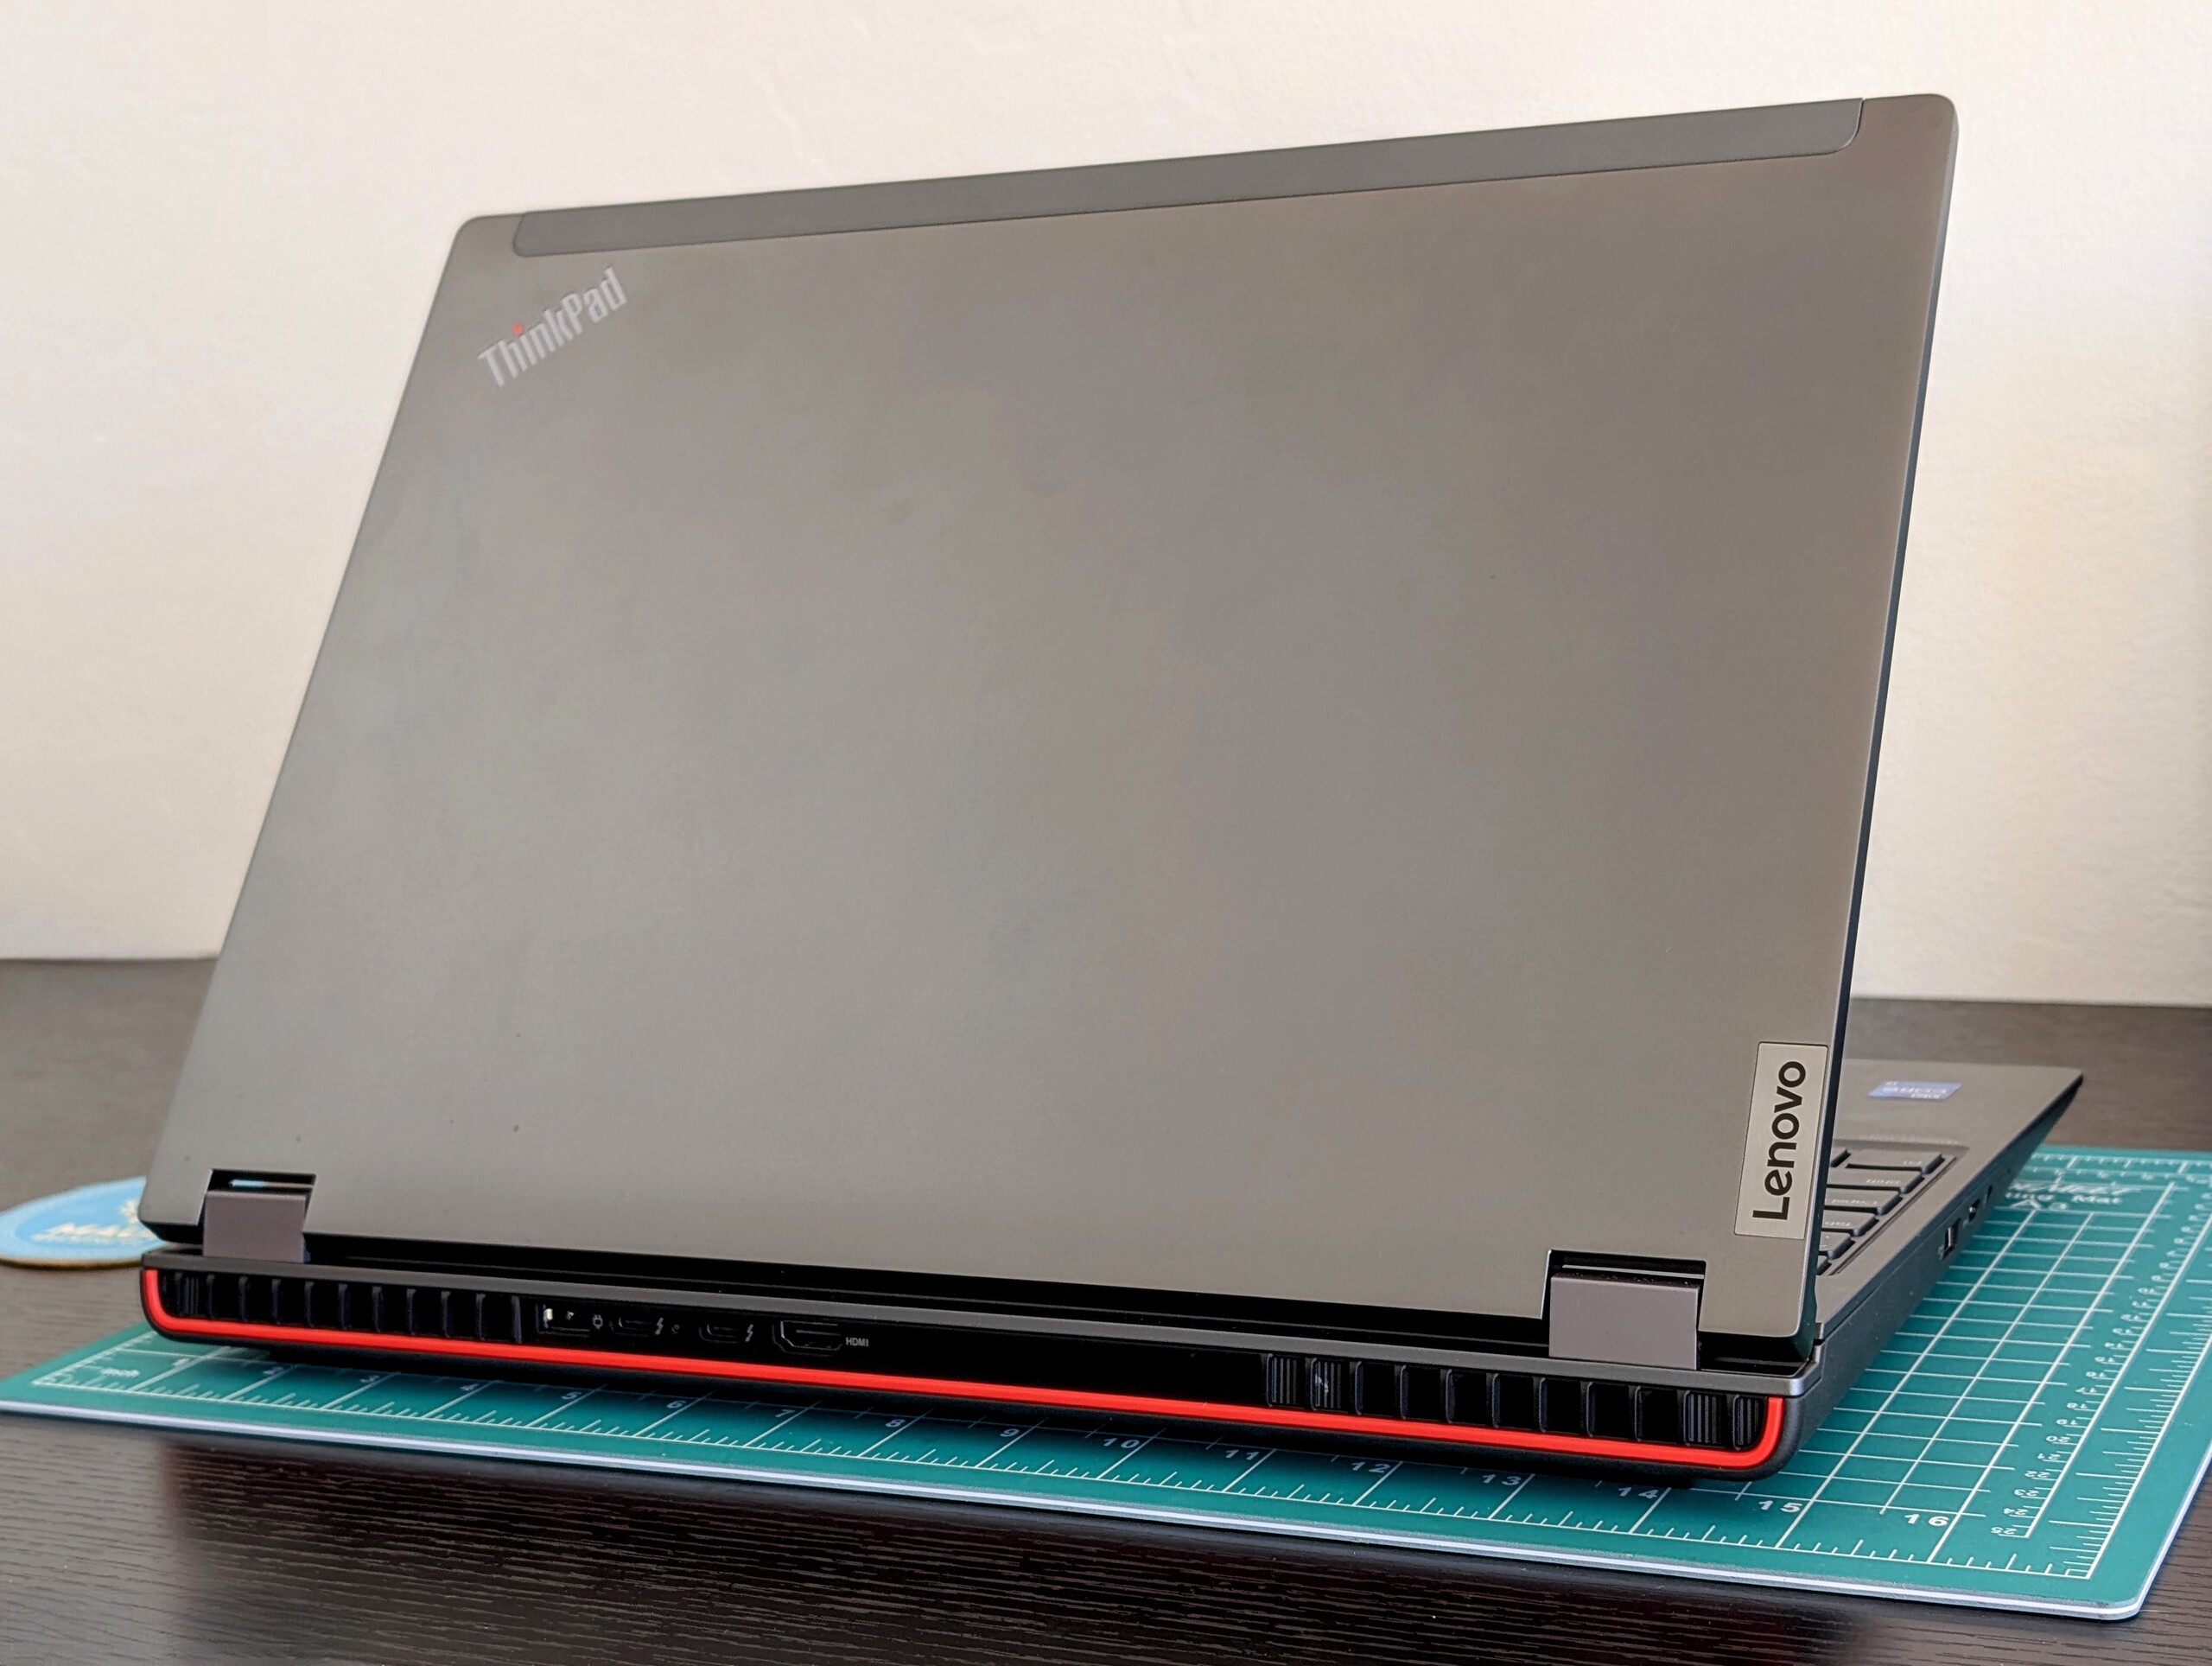
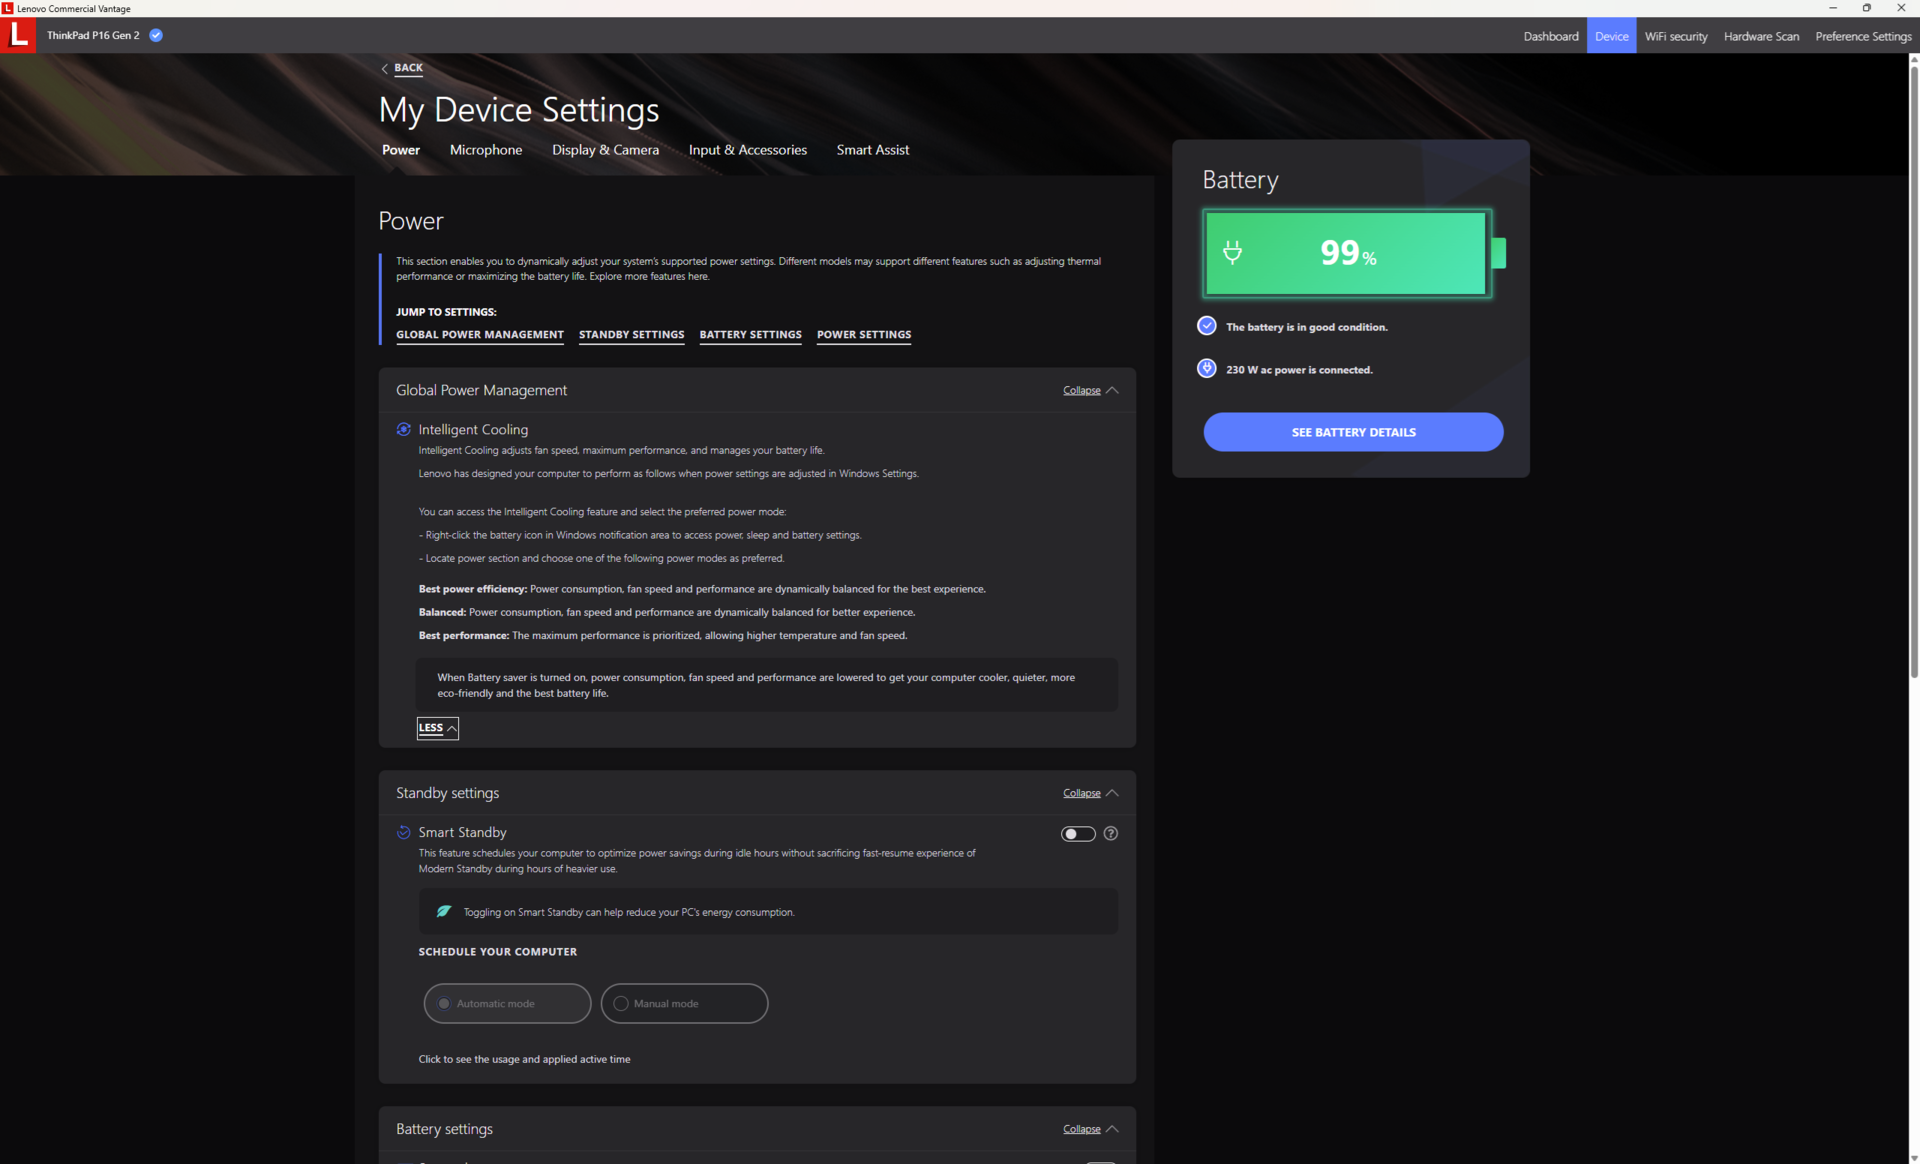
W pudełku nie ma żadnych dodatków poza zasilaczem sieciowym i dokumentacją. Należy jednak zauważyć, że nasza jednostka jest dostarczana z większym zasilaczem sieciowym 230 W zamiast zasilacza 170 W w naszym pierwszym ThinkPadzie P16 Gen 2 ze względu na bardziej wymagającą kartę graficzną RTX 4000 Ada.
Trzyletnia gwarancja producenta jest standardem.
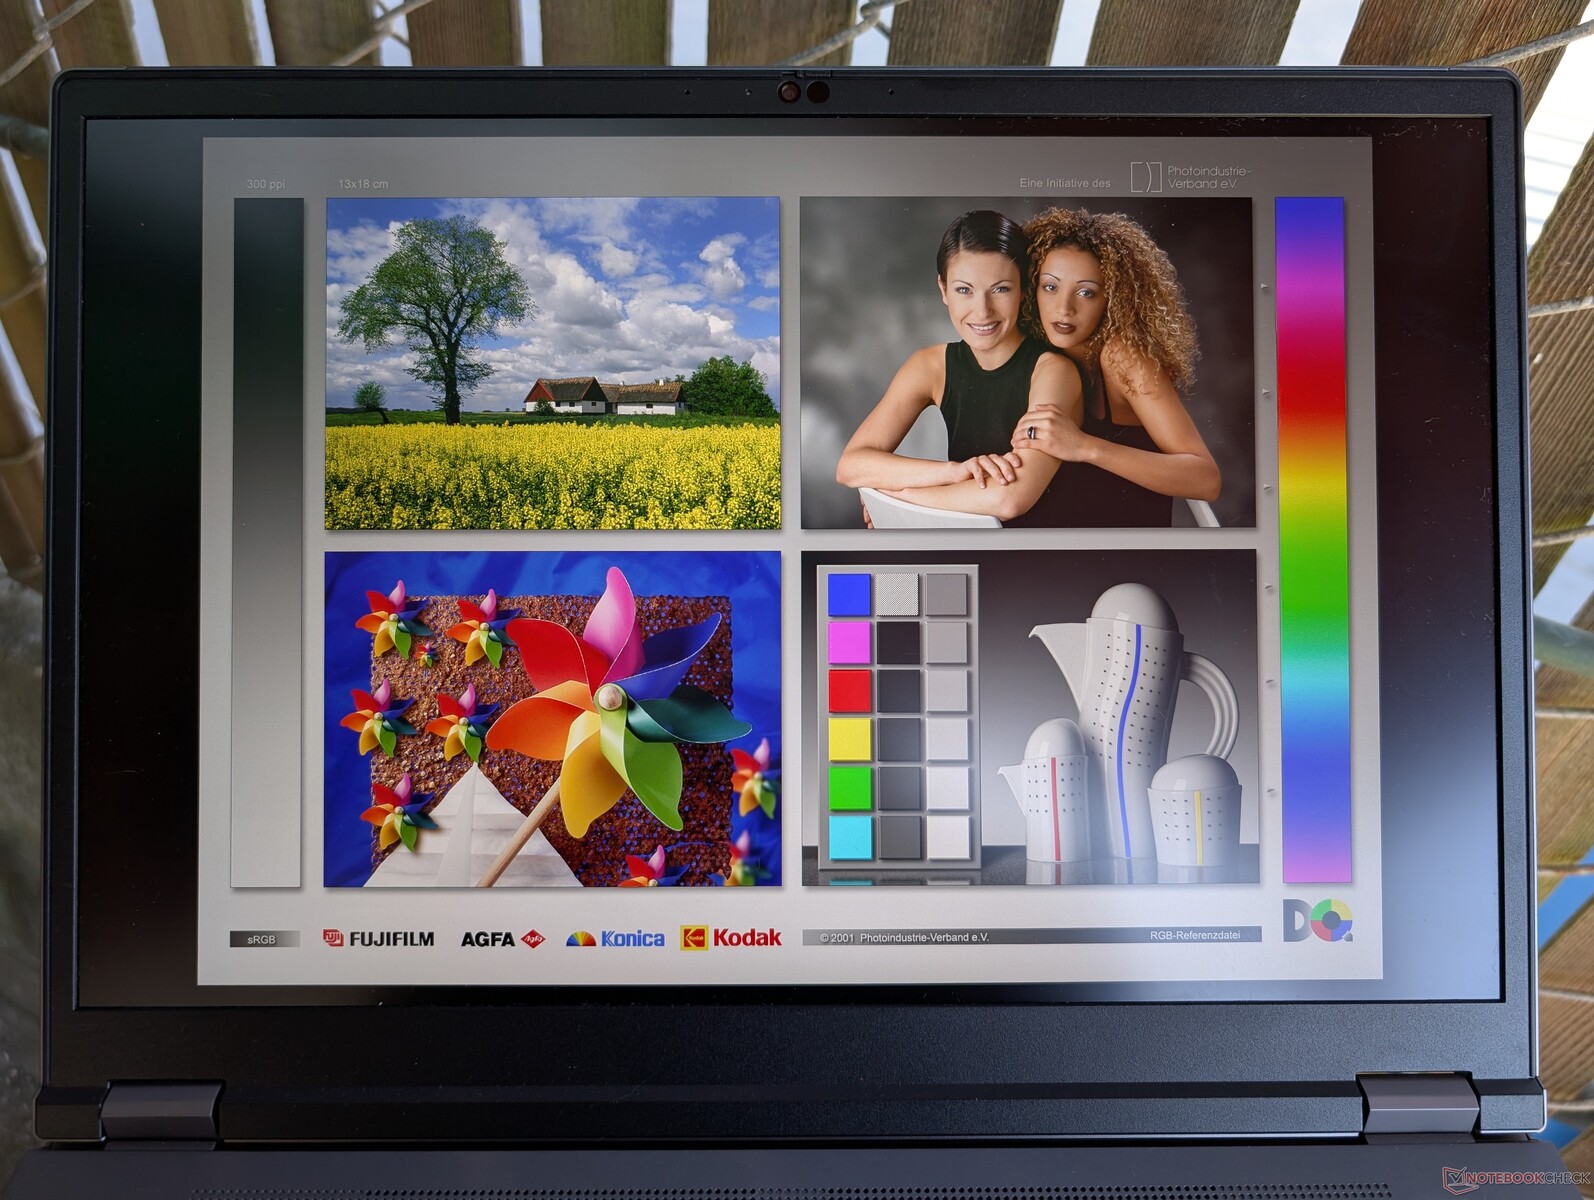
Wyświetlacz
Co ciekawe, nasz panel IPS 1600p165 pochodzi od innego producenta w porównaniu do panelu IPS 1600p165 w naszej pierwszej jednostce ThinkPad P16 Gen 2 (NE160QDM-NY1 vs. MNG007DA1-9). Poza tym, podstawowe atrybuty i jasność są niemal identyczne. Dostępne są również inne opcje wyświetlaczy, w tym 2400p OLED i 1200p IPS.


| |||||||||||||||||||||||||
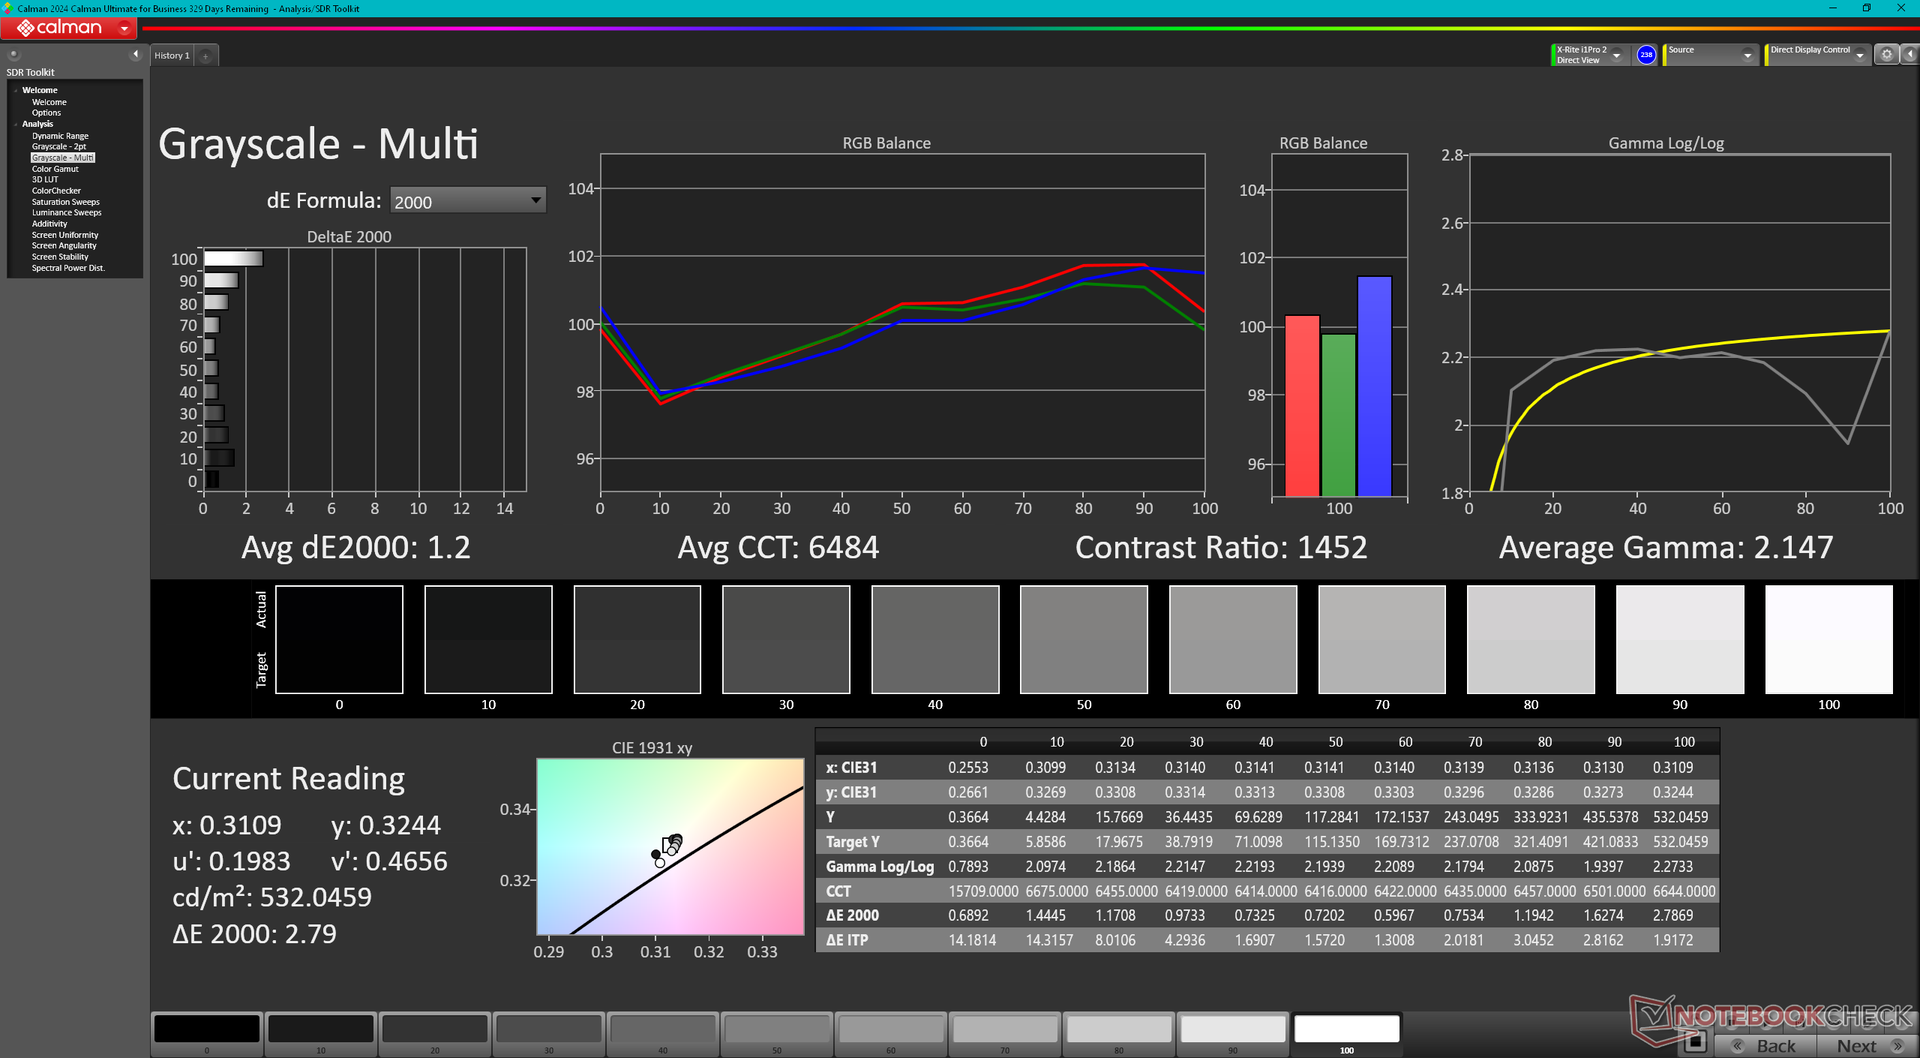
rozświetlenie: 89 %
na akumulatorze: 531.5 cd/m²
kontrast: 1399:1 (czerń: 0.38 cd/m²)
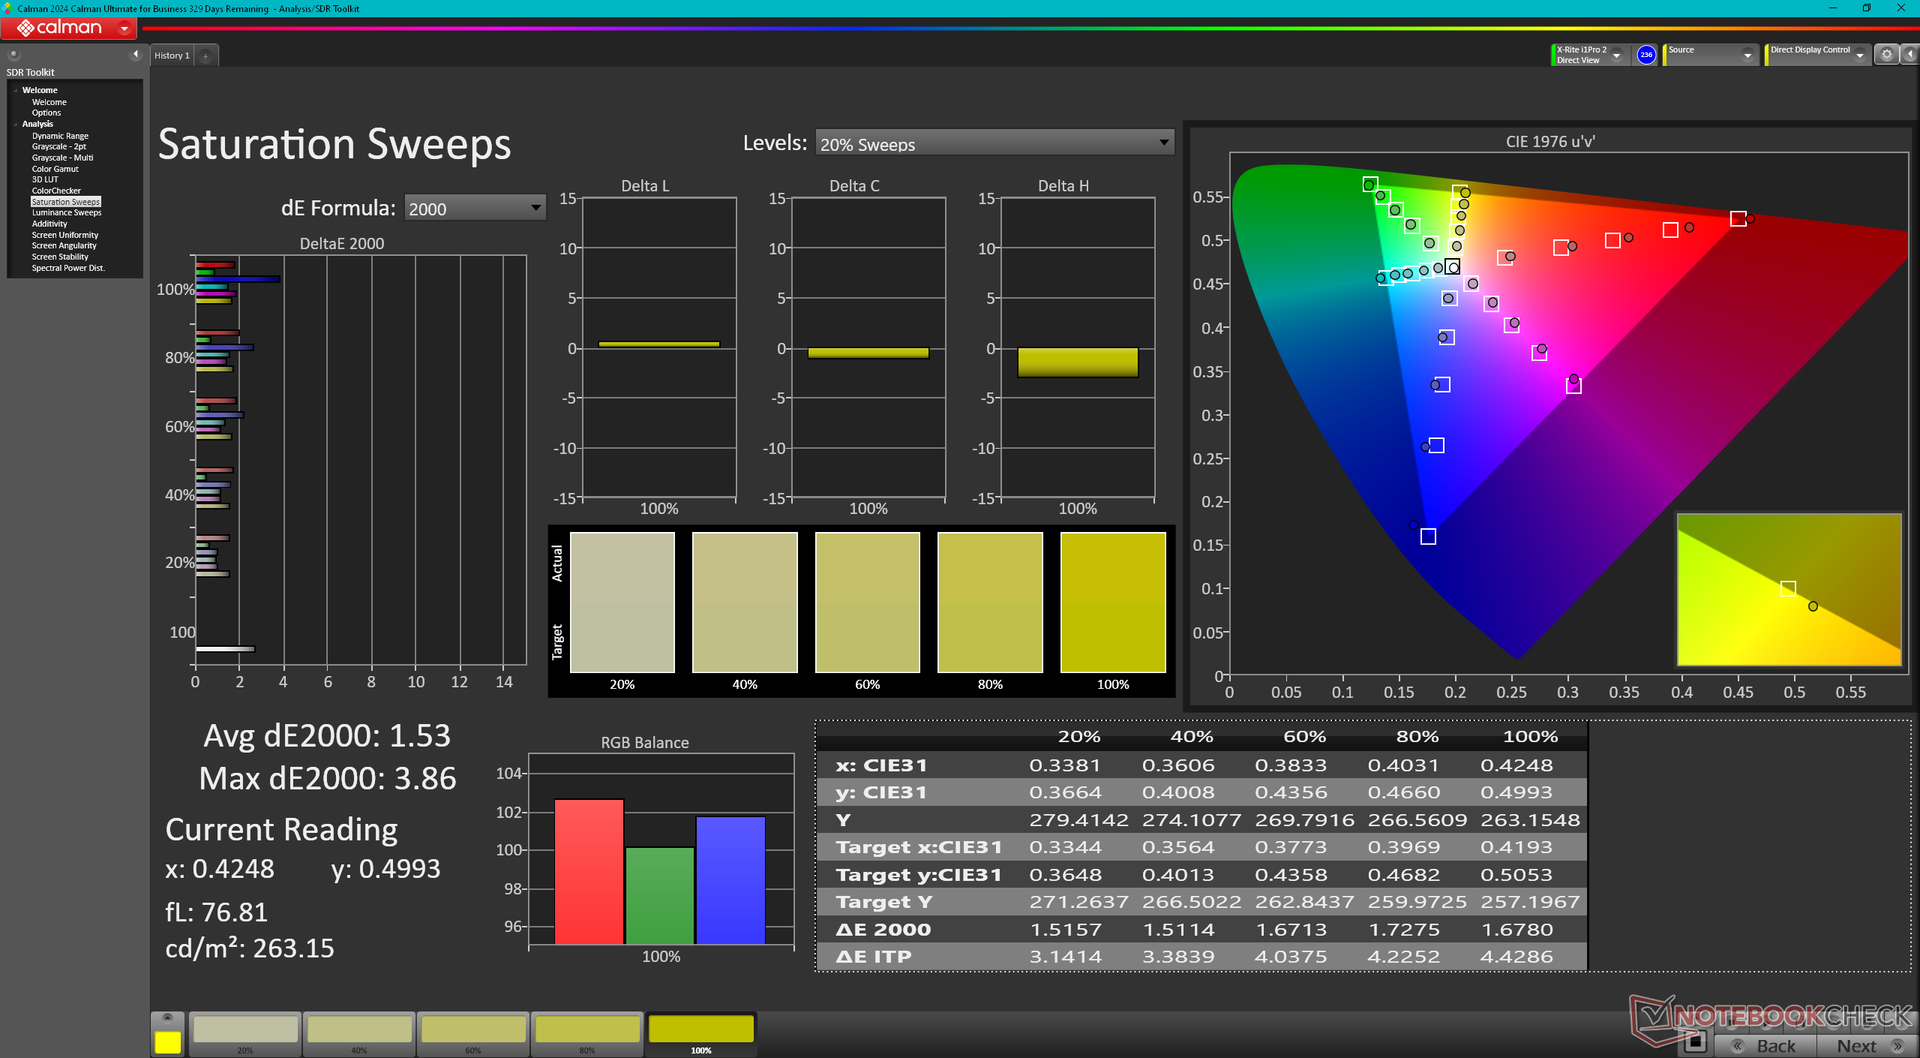
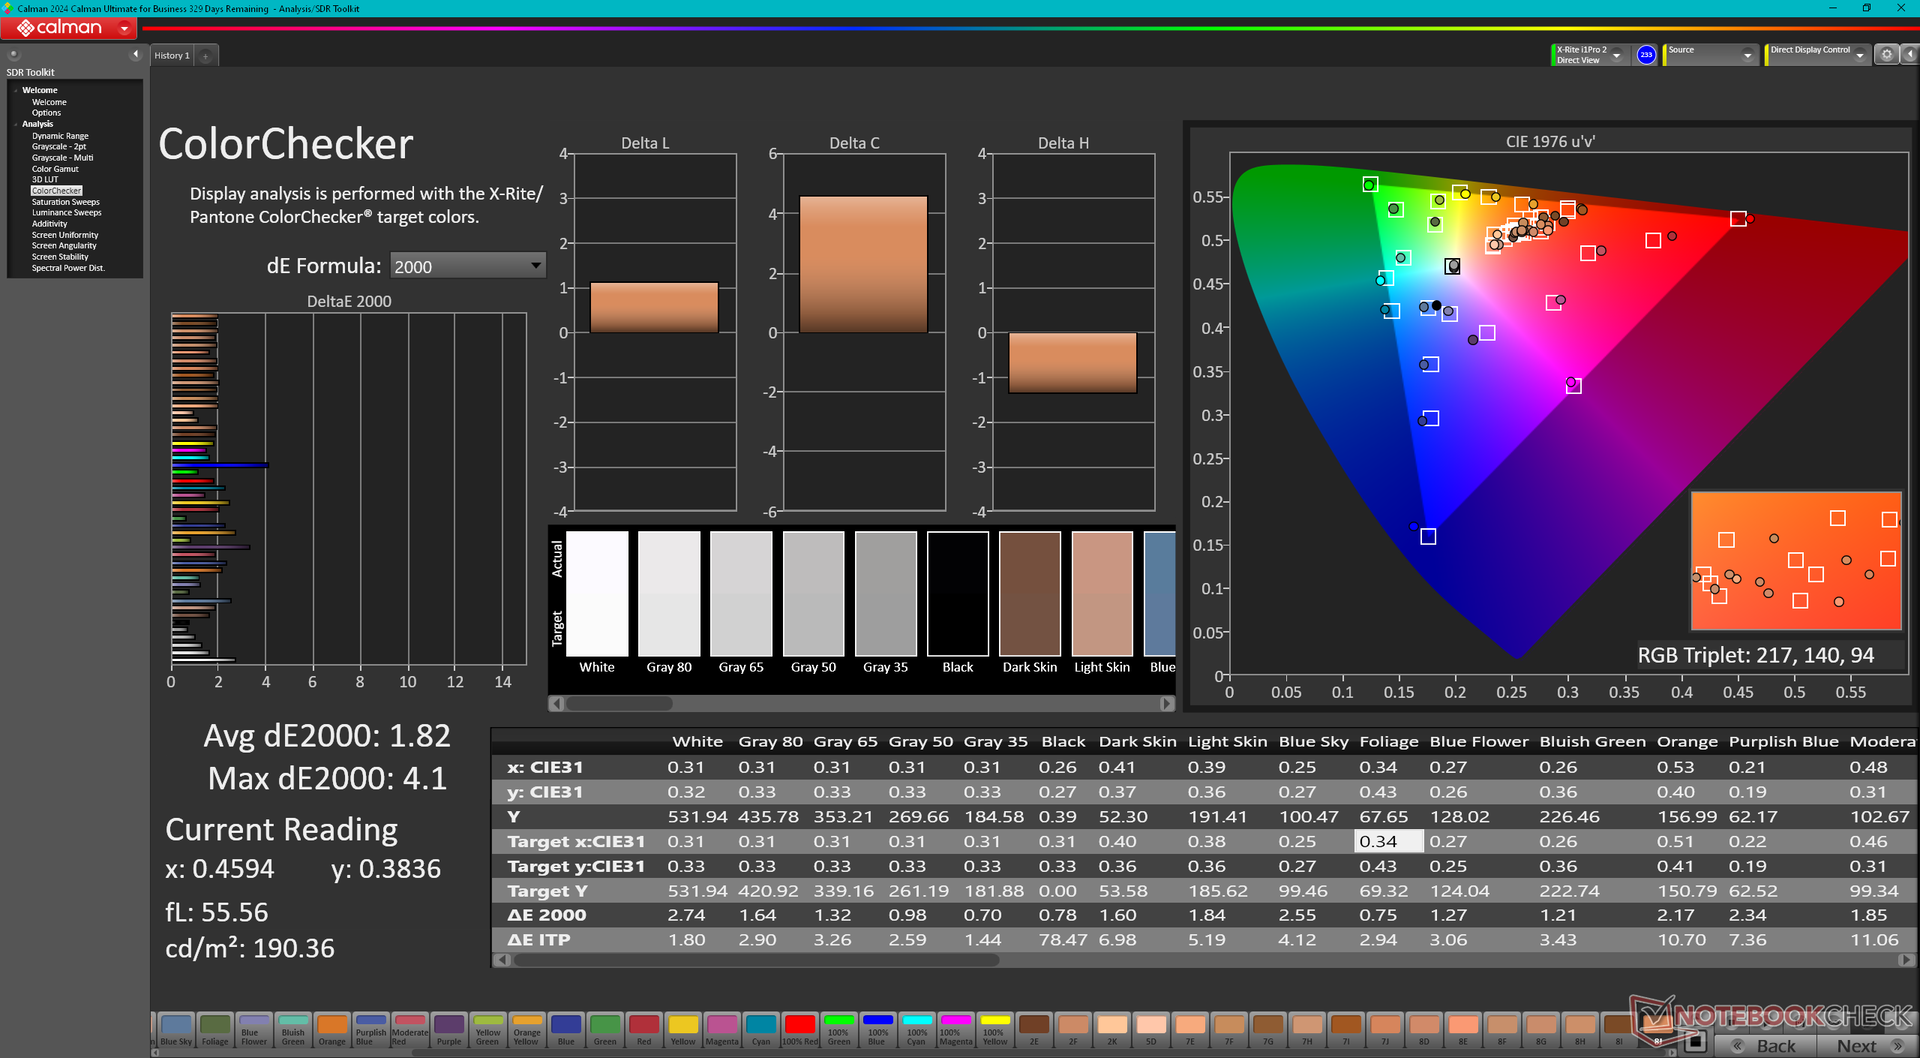
ΔE ColorChecker Calman: 1.82 | ∀{0.5-29.43 Ø4.74}
calibrated: 0.63
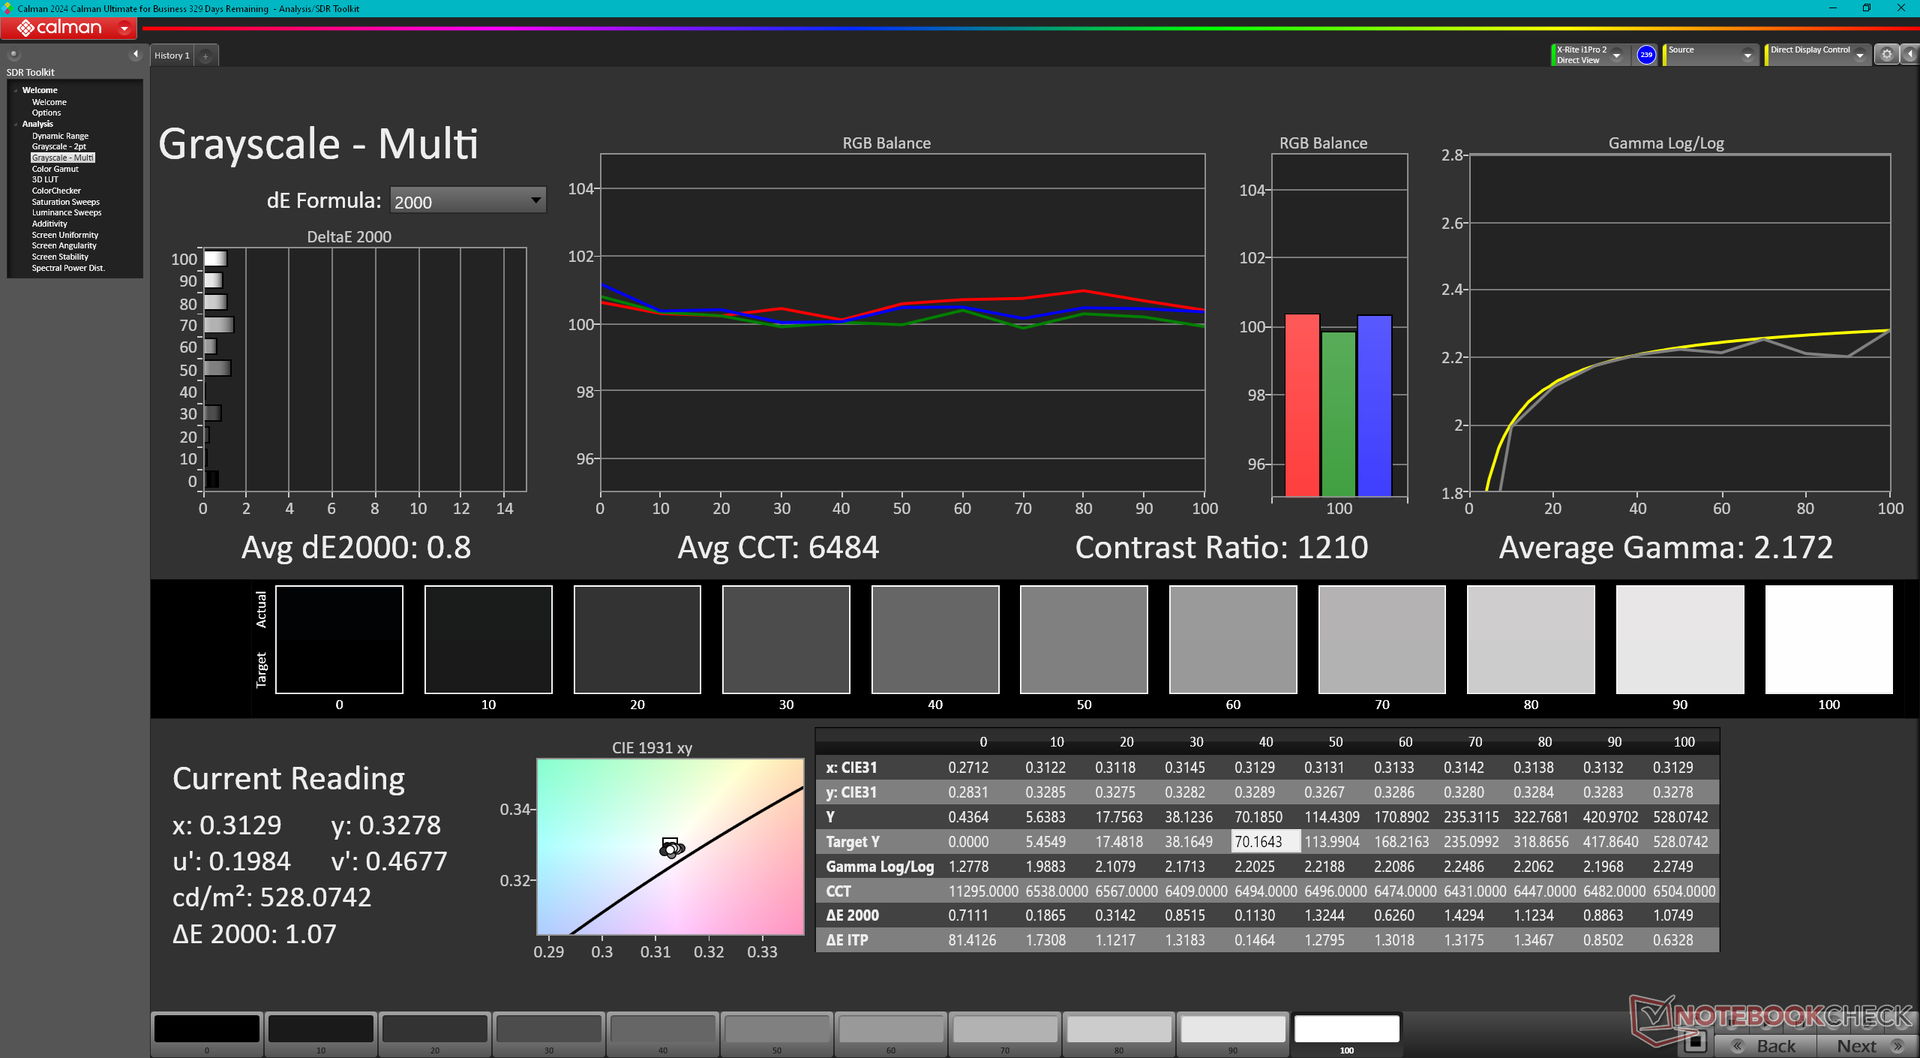
ΔE Greyscale Calman: 1.2 | ∀{0.09-98 Ø4.98}
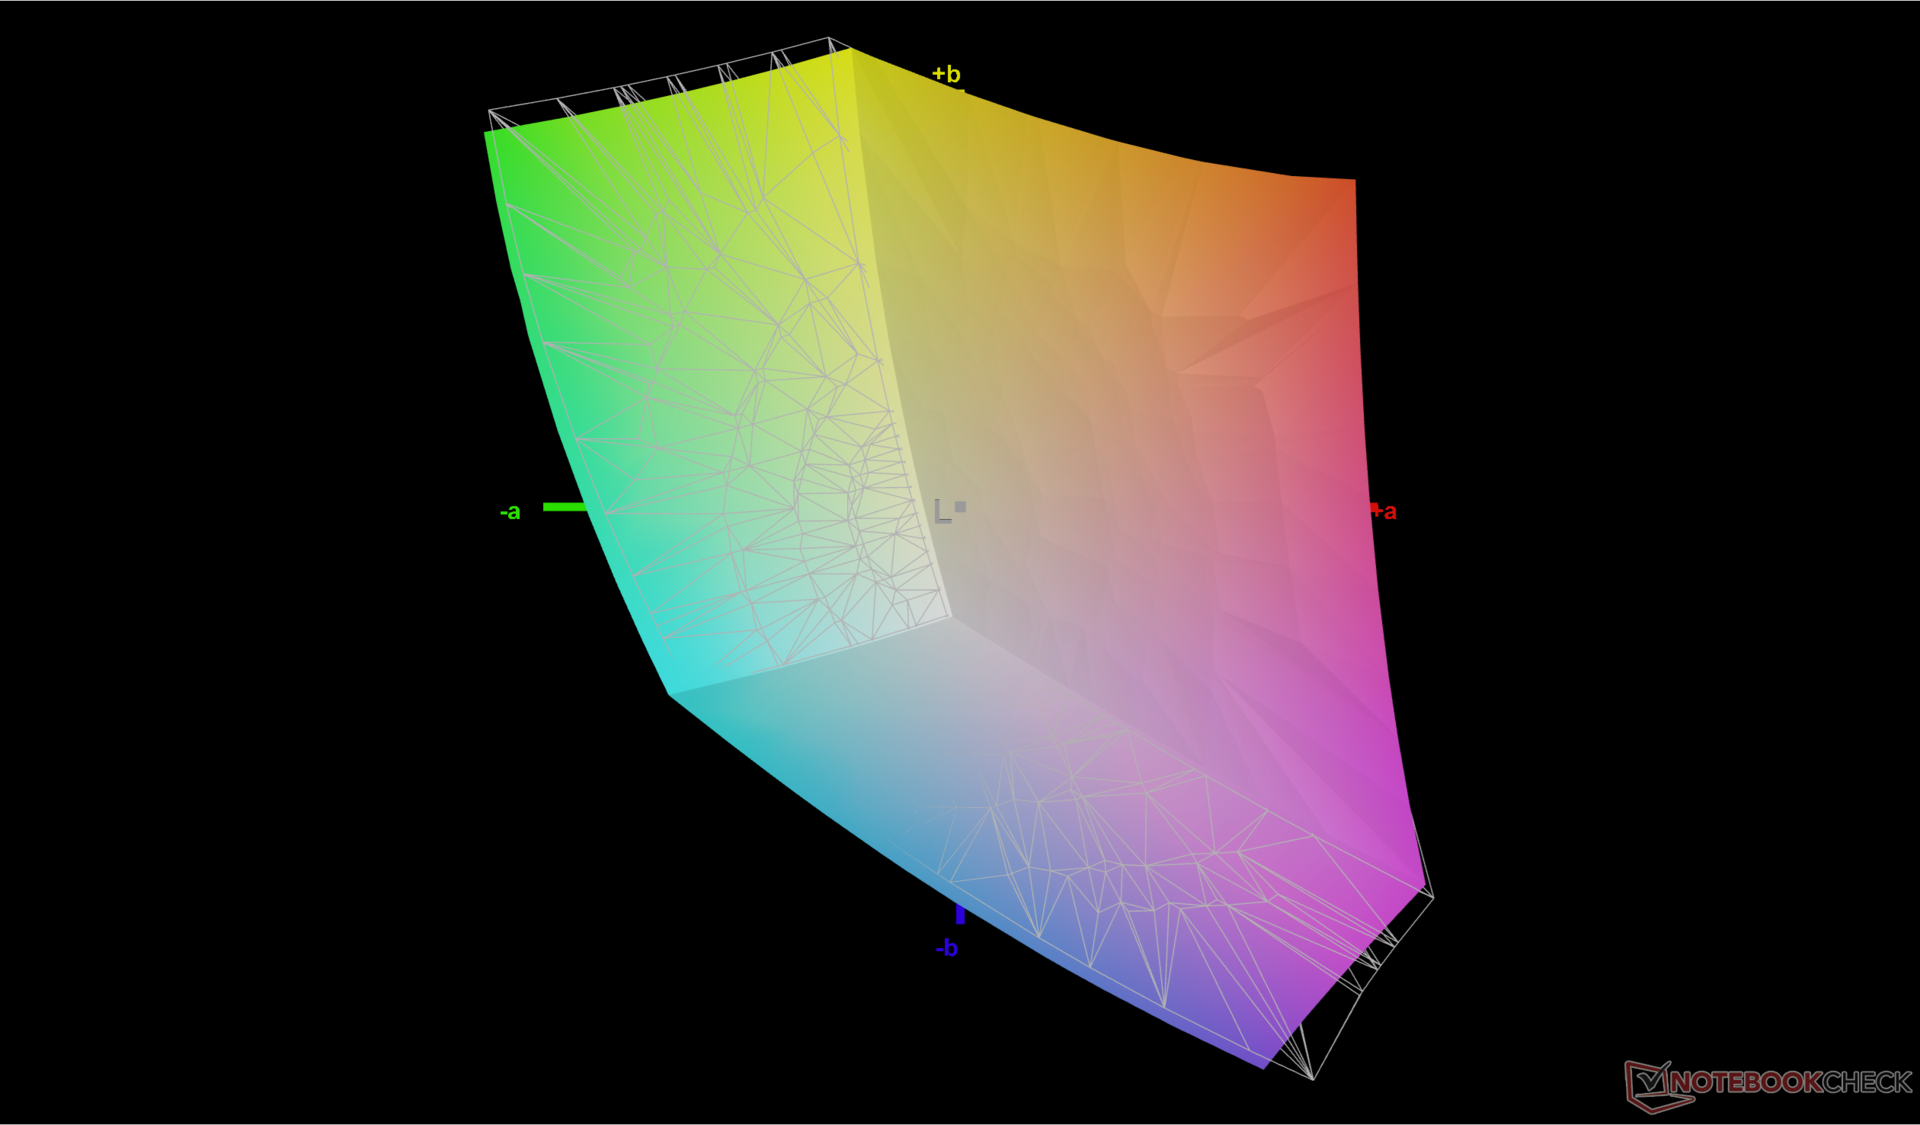
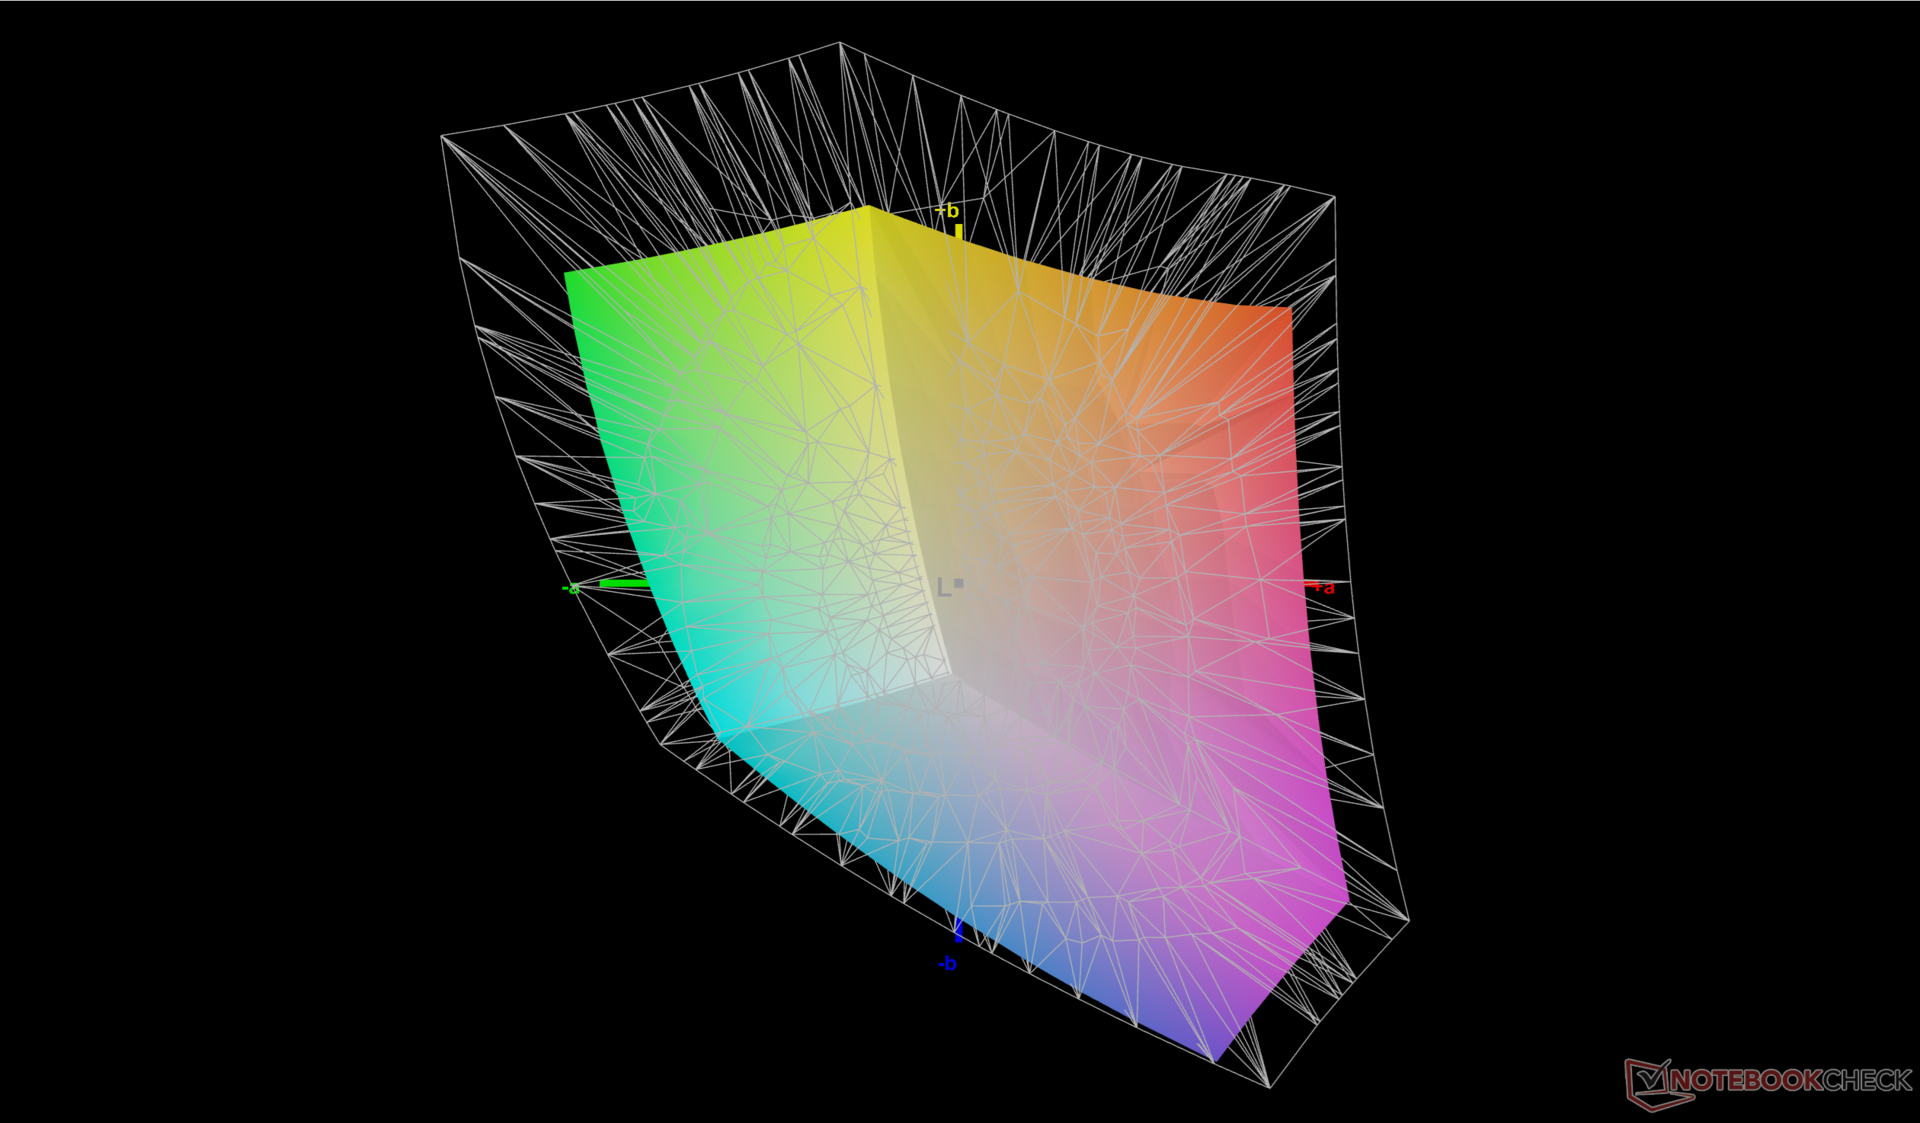
70.6% AdobeRGB 1998 (Argyll 3D)
96.9% sRGB (Argyll 3D)
68.4% Display P3 (Argyll 3D)
Gamma: 2.15
CCT: 6484 K
| Lenovo ThinkPad P16 Gen 2 NE160QDM-NY1, IPS, 2560x1600, 16", 165 Hz | Lenovo ThinkPad P16 G2 21FA000FGE MNG007DA1-9, IPS LED, 2560x1600, 16", 165 Hz | Lenovo ThinkPad P16s G2 21K9000CGE ATNA60YV04-0, OLED, 3840x2400, 16", 60 Hz | Lenovo ThinkPad P16 G1 RTX A5500 LP160UQ1-SPB1, IPS, 3840x2400, 16", 60 Hz | HP ZBook Power 16 G11 A AUOA0A9, IPS, 2560x1600, 16", 120 Hz | Dell Precision 5690 Samsung 160YV03, OLED, 3840x2400, 16", 60 Hz | |
|---|---|---|---|---|---|---|
| Display | 3% | 29% | 20% | 1% | 29% | |
| Display P3 Coverage (%) | 68.4 | 71 4% | 99.9 46% | 82.9 21% | 69.1 1% | 99.8 46% |
| sRGB Coverage (%) | 96.9 | 99.2 2% | 100 3% | 98.9 2% | 97.7 1% | 100 3% |
| AdobeRGB 1998 Coverage (%) | 70.6 | 73.2 4% | 96.9 37% | 95.9 36% | 71 1% | 96.6 37% |
| Response Times | 4% | 88% | -248% | 10% | 86% | |
| Response Time Grey 50% / Grey 80% * (ms) | 14.1 ? | 12.8 ? 9% | 1.5 ? 89% | 45.6 ? -223% | 13.6 ? 4% | 1.7 ? 88% |
| Response Time Black / White * (ms) | 9.9 ? | 10.1 ? -2% | 1.3 ? 87% | 36.8 ? -272% | 8.4 ? 15% | 1.7 ? 83% |
| PWM Frequency (Hz) | 60 | 60 ? | ||||
| Screen | -59% | -54% | -22% | -52% | -49% | |
| Brightness middle (cd/m²) | 531.5 | 510 -4% | 416 -22% | 601.9 13% | 470.7 -11% | 348.1 -35% |
| Brightness (cd/m²) | 499 | 517 4% | 421 -16% | 569 14% | 431 -14% | 351 -30% |
| Brightness Distribution (%) | 89 | 89 0% | 98 10% | 77 -13% | 88 -1% | 97 9% |
| Black Level * (cd/m²) | 0.38 | 0.37 3% | 0.47 -24% | 0.57 -50% | ||
| Contrast (:1) | 1399 | 1378 -2% | 1281 -8% | 826 -41% | ||
| Colorchecker dE 2000 * | 1.82 | 2.6 -43% | 1.3 29% | 2.45 -35% | 2.16 -19% | 4.18 -130% |
| Colorchecker dE 2000 max. * | 4.1 | 5.2 -27% | 2.8 32% | 4.46 -9% | 4.39 -7% | 6.68 -63% |
| Colorchecker dE 2000 calibrated * | 0.63 | 2.3 -265% | 2.9 -360% | 1.37 -117% | 0.97 -54% | |
| Greyscale dE 2000 * | 1.2 | 3.6 -200% | 1.8 -50% | 2.6 -117% | 3.7 -208% | 1.7 -42% |
| Gamma | 2.15 102% | 2.26 97% | 2.25 98% | 2.3 96% | 2.38 92% | 2.2 100% |
| CCT | 6484 100% | 5969 109% | 6574 99% | 6805 96% | 6765 96% | 6198 105% |
| Całkowita średnia (program / ustawienia) | -17% /
-37% | 21% /
-10% | -83% /
-47% | -14% /
-32% | 22% /
-7% |
* ... im mniej tym lepiej
Wyświetlacz jest wstępnie skalibrowany pod kątem standardu sRGB ze średnimi wartościami deltaE w skali szarości wynoszącymi odpowiednio zaledwie 1,2 i 1,82. W większości przypadków nie jest więc wymagana kalibracja przez użytkownika końcowego.

Wyświetl czasy reakcji
| ↔ Czas reakcji od czerni do bieli | ||
|---|---|---|
| 9.9 ms ... wzrost ↗ i spadek ↘ łącznie | ↗ 5 ms wzrost | 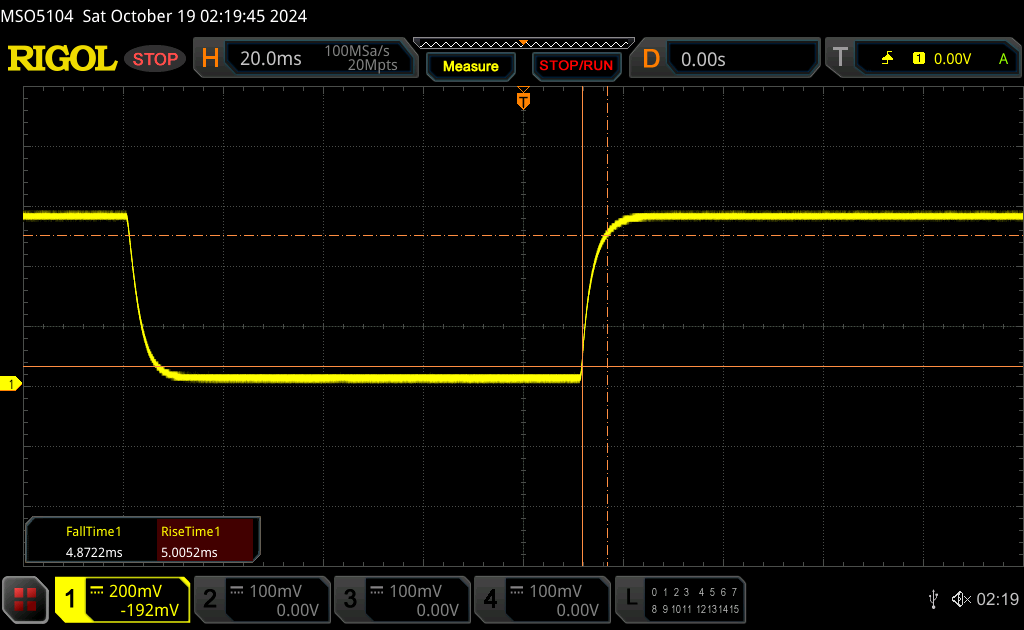 |
| ↘ 4.9 ms upadek | ||
| W naszych testach ekran wykazuje szybki czas reakcji i powinien nadawać się do gier. Dla porównania, wszystkie testowane urządzenia wahają się od 0.1 (minimum) do 240 (maksimum) ms. » 27 % wszystkich urządzeń jest lepszych. Oznacza to, że zmierzony czas reakcji jest lepszy od średniej wszystkich testowanych urządzeń (19.9 ms). | ||
| ↔ Czas reakcji 50% szarości do 80% szarości | ||
| 14.1 ms ... wzrost ↗ i spadek ↘ łącznie | ↗ 6.7 ms wzrost | 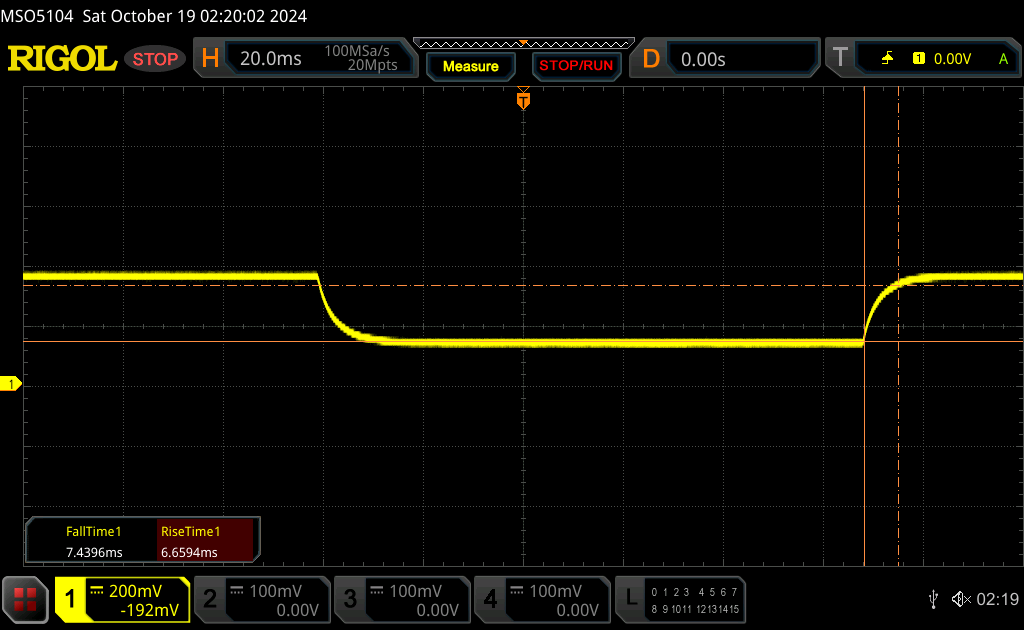 |
| ↘ 7.4 ms upadek | ||
| W naszych testach ekran wykazuje dobry współczynnik reakcji, ale może być zbyt wolny dla graczy rywalizujących ze sobą. Dla porównania, wszystkie testowane urządzenia wahają się od 0.165 (minimum) do 636 (maksimum) ms. » 28 % wszystkich urządzeń jest lepszych. Oznacza to, że zmierzony czas reakcji jest lepszy od średniej wszystkich testowanych urządzeń (31.2 ms). | ||
Migotanie ekranu / PWM (modulacja szerokości impulsu)
| Migotanie ekranu/nie wykryto PWM |  | ||
Dla porównania: 52 % wszystkich testowanych urządzeń nie używa PWM do przyciemniania wyświetlacza. Jeśli wykryto PWM, zmierzono średnio 7867 (minimum: 5 - maksimum: 343500) Hz. | |||

Wydajność
Warunki testowania
Przed uruchomieniem poniższych testów porównawczych ustawiliśmy system Windows na tryb wydajności, a procesor graficzny na tryb dyskretny. Według Panelu Sterowania Nvidii, system nie obsługuje funkcji Advanced Optimus.
Procesor
Procesor Core i7-14700HX to zdrowy wzrost w stosunku do Core i7-13700HX z 20-25-procentowym wzrostem wydajności wielowątkowej. Jednostki SKU z procesorem Core i9-13980HX są nadal dostępne, co może zapewnić jeszcze wyższą wydajność niż nasz Core I7-14700HX, mimo że jest to starszy procesor.
Zrównoważona wydajność jest dobra, ale mogłaby być lepsza. Przykładowo, podczas wykonywania testu CineBench R15 xT w pętli, nasz początkowy wynik 3930 punktów spadał o 10% po zaledwie kilku pętlach.
Cinebench R15 Multi Loop
Cinebench R23: Multi Core | Single Core
Cinebench R20: CPU (Multi Core) | CPU (Single Core)
Cinebench R15: CPU Multi 64Bit | CPU Single 64Bit
Blender: v2.79 BMW27 CPU
7-Zip 18.03: 7z b 4 | 7z b 4 -mmt1
Geekbench 6.6: Multi-Core | Single-Core
Geekbench 5.5: Multi-Core | Single-Core
HWBOT x265 Benchmark v2.2: 4k Preset
LibreOffice : 20 Documents To PDF
R Benchmark 2.5: Overall mean
| CPU Performance rating | |
| HP ZBook Fury 16 G11 | |
| Lenovo ThinkPad P16 Gen 2 | |
| Przeciętny Intel Core i7-14700HX | |
| Średnia w klasie Workstation | |
| Lenovo ThinkPad P16 G1 RTX A5500 -2! | |
| Lenovo ThinkPad P1 G6 21FV001KUS | |
| Lenovo ThinkPad P16 G2 21FA000FGE -2! | |
| Dell Precision 5690 | |
| Lenovo ThinkPad P1 G6-21FV000DGE | |
| Lenovo ThinkPad P1 Gen 7 21KV001SGE | |
| HP ZBook Fury 16 G9 -2! | |
| HP ZBook Power 16 G11 A | |
| MSI CreatorPro Z16P B12UKST -2! | |
| Lenovo ThinkPad P16v G1 AMD | |
| Lenovo ThinkPad P16s G2 21K9000CGE | |
| HP ZBook Firefly 16 G9-6B897EA -2! | |
| Geekbench 6.6 / Multi-Core | |
| Lenovo ThinkPad P16 Gen 2 | |
| Średnia w klasie Workstation (12196 - 20887, n=25, ostatnie 2 lata) | |
| Przeciętny Intel Core i7-14700HX (14163 - 17562, n=9) | |
| HP ZBook Fury 16 G11 | |
| Dell Precision 5690 | |
| Lenovo ThinkPad P1 Gen 7 21KV001SGE | |
| Lenovo ThinkPad P1 G6 21FV001KUS | |
| HP ZBook Power 16 G11 A | |
| Lenovo ThinkPad P1 G6-21FV000DGE | |
| Lenovo ThinkPad P16s G2 21K9000CGE | |
| Lenovo ThinkPad P16v G1 AMD | |
| Geekbench 6.6 / Single-Core | |
| HP ZBook Fury 16 G11 | |
| Lenovo ThinkPad P16 Gen 2 | |
| Średnia w klasie Workstation (2389 - 3065, n=25, ostatnie 2 lata) | |
| Przeciętny Intel Core i7-14700HX (2378 - 2975, n=9) | |
| Lenovo ThinkPad P1 G6 21FV001KUS | |
| Lenovo ThinkPad P1 G6-21FV000DGE | |
| HP ZBook Power 16 G11 A | |
| Lenovo ThinkPad P16v G1 AMD | |
| Dell Precision 5690 | |
| Lenovo ThinkPad P16s G2 21K9000CGE | |
| Lenovo ThinkPad P1 Gen 7 21KV001SGE | |
Cinebench R23: Multi Core | Single Core
Cinebench R20: CPU (Multi Core) | CPU (Single Core)
Cinebench R15: CPU Multi 64Bit | CPU Single 64Bit
Blender: v2.79 BMW27 CPU
7-Zip 18.03: 7z b 4 | 7z b 4 -mmt1
Geekbench 6.6: Multi-Core | Single-Core
Geekbench 5.5: Multi-Core | Single-Core
HWBOT x265 Benchmark v2.2: 4k Preset
LibreOffice : 20 Documents To PDF
R Benchmark 2.5: Overall mean
* ... im mniej tym lepiej
AIDA64: FP32 Ray-Trace | FPU Julia | CPU SHA3 | CPU Queen | FPU SinJulia | FPU Mandel | CPU AES | CPU ZLib | FP64 Ray-Trace | CPU PhotoWorxx
| Performance rating | |
| Lenovo ThinkPad P16 Gen 2 | |
| HP ZBook Power 16 G11 A | |
| Przeciętny Intel Core i7-14700HX | |
| Lenovo ThinkPad P16s G2 21K9000CGE | |
| Dell Precision 5690 | |
| Lenovo ThinkPad P16 G1 RTX A5500 | |
| Lenovo ThinkPad P16 G2 21FA000FGE | |
| AIDA64 / FP32 Ray-Trace | |
| HP ZBook Power 16 G11 A | |
| Lenovo ThinkPad P16s G2 21K9000CGE | |
| Lenovo ThinkPad P16 Gen 2 | |
| Przeciętny Intel Core i7-14700HX (14147 - 23676, n=9) | |
| Dell Precision 5690 | |
| Lenovo ThinkPad P16 G2 21FA000FGE | |
| Lenovo ThinkPad P16 G1 RTX A5500 | |
| AIDA64 / FPU Julia | |
| HP ZBook Power 16 G11 A | |
| Lenovo ThinkPad P16 Gen 2 | |
| Przeciętny Intel Core i7-14700HX (71875 - 116556, n=9) | |
| Lenovo ThinkPad P16s G2 21K9000CGE | |
| Dell Precision 5690 | |
| Lenovo ThinkPad P16 G2 21FA000FGE | |
| Lenovo ThinkPad P16 G1 RTX A5500 | |
| AIDA64 / CPU SHA3 | |
| Lenovo ThinkPad P16 Gen 2 | |
| Przeciętny Intel Core i7-14700HX (3388 - 5567, n=9) | |
| HP ZBook Power 16 G11 A | |
| Lenovo ThinkPad P16s G2 21K9000CGE | |
| Dell Precision 5690 | |
| Lenovo ThinkPad P16 G2 21FA000FGE | |
| Lenovo ThinkPad P16 G1 RTX A5500 | |
| AIDA64 / CPU Queen | |
| Lenovo ThinkPad P16 Gen 2 | |
| Przeciętny Intel Core i7-14700HX (129134 - 152200, n=9) | |
| HP ZBook Power 16 G11 A | |
| Lenovo ThinkPad P16 G2 21FA000FGE | |
| Lenovo ThinkPad P16 G1 RTX A5500 | |
| Lenovo ThinkPad P16s G2 21K9000CGE | |
| Dell Precision 5690 | |
| AIDA64 / FPU SinJulia | |
| HP ZBook Power 16 G11 A | |
| Lenovo ThinkPad P16s G2 21K9000CGE | |
| Lenovo ThinkPad P16 Gen 2 | |
| Przeciętny Intel Core i7-14700HX (10266 - 14434, n=9) | |
| Lenovo ThinkPad P16 G1 RTX A5500 | |
| Lenovo ThinkPad P16 G2 21FA000FGE | |
| Dell Precision 5690 | |
| AIDA64 / FPU Mandel | |
| HP ZBook Power 16 G11 A | |
| Lenovo ThinkPad P16s G2 21K9000CGE | |
| Lenovo ThinkPad P16 Gen 2 | |
| Przeciętny Intel Core i7-14700HX (35155 - 58380, n=9) | |
| Dell Precision 5690 | |
| Lenovo ThinkPad P16 G1 RTX A5500 | |
| Lenovo ThinkPad P16 G2 21FA000FGE | |
| AIDA64 / CPU AES | |
| Lenovo ThinkPad P16 Gen 2 | |
| Przeciętny Intel Core i7-14700HX (68616 - 113157, n=9) | |
| Dell Precision 5690 | |
| Lenovo ThinkPad P16 G2 21FA000FGE | |
| Lenovo ThinkPad P16 G1 RTX A5500 | |
| HP ZBook Power 16 G11 A | |
| Lenovo ThinkPad P16s G2 21K9000CGE | |
| AIDA64 / CPU ZLib | |
| Lenovo ThinkPad P16 Gen 2 | |
| Przeciętny Intel Core i7-14700HX (1003 - 1682, n=9) | |
| Dell Precision 5690 | |
| Lenovo ThinkPad P16 G1 RTX A5500 | |
| Lenovo ThinkPad P16 G2 21FA000FGE | |
| HP ZBook Power 16 G11 A | |
| Lenovo ThinkPad P16s G2 21K9000CGE | |
| AIDA64 / FP64 Ray-Trace | |
| HP ZBook Power 16 G11 A | |
| Lenovo ThinkPad P16s G2 21K9000CGE | |
| Lenovo ThinkPad P16 Gen 2 | |
| Przeciętny Intel Core i7-14700HX (7585 - 12928, n=9) | |
| Lenovo ThinkPad P16 G1 RTX A5500 | |
| Lenovo ThinkPad P16 G2 21FA000FGE | |
| Dell Precision 5690 | |
| AIDA64 / CPU PhotoWorxx | |
| Dell Precision 5690 | |
| Przeciętny Intel Core i7-14700HX (24276 - 49671, n=9) | |
| Lenovo ThinkPad P16 G1 RTX A5500 | |
| HP ZBook Power 16 G11 A | |
| Lenovo ThinkPad P16 Gen 2 | |
| Lenovo ThinkPad P16s G2 21K9000CGE | |
| Lenovo ThinkPad P16 G2 21FA000FGE | |
Test warunków skrajnych
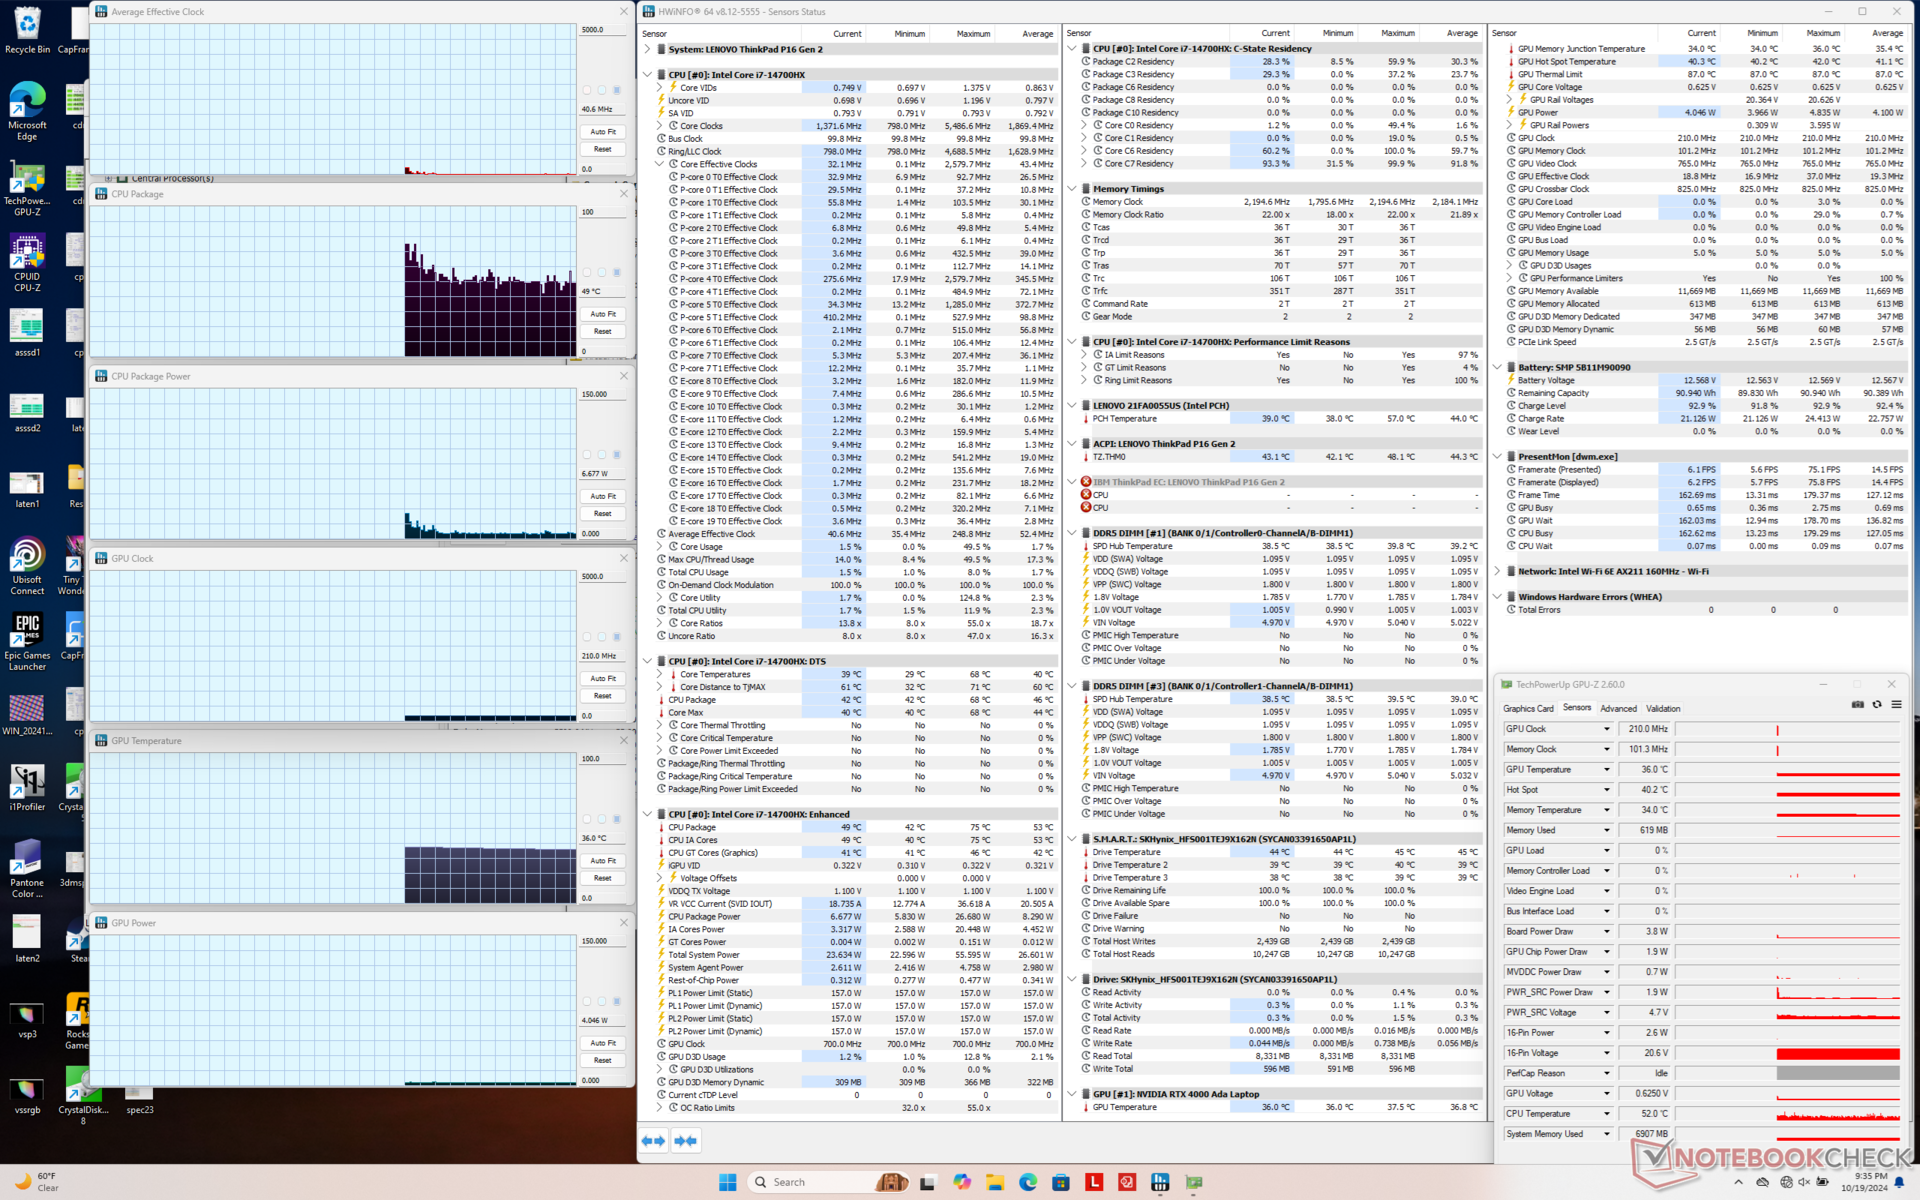
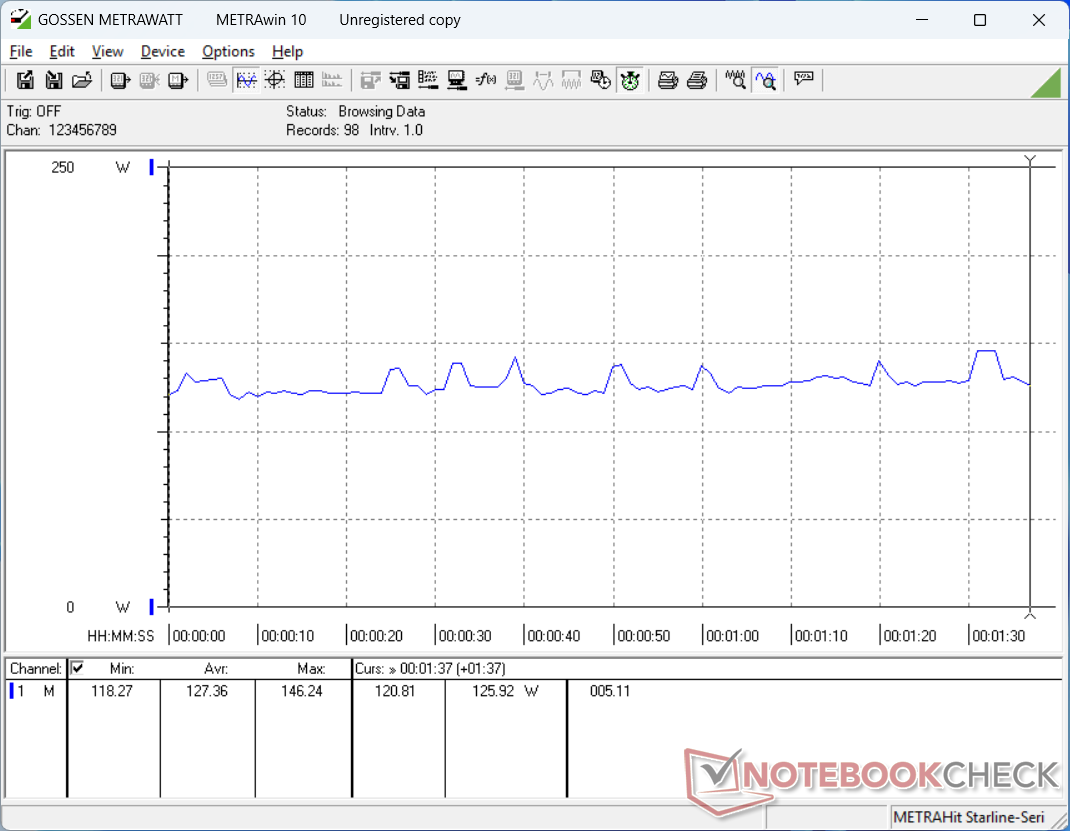
Temperatury rdzenia są dość wysokie, gdy system jest obciążony, co prowadzi do bardzo wysokich temperatur powierzchni, jak wspomniano w sekcji Temperatura poniżej. Podczas uruchamiania Prime95 lub Cyberpunk 2077, na przykład, procesor osiągał znacznie ponad 80 C, a czasem nawet 100 C. Pobór mocy przez układ graficzny, a tym samym częstotliwość taktowania, wahały się od 66 W do 90 W, aby utrzymać temperatury w ryzach, jak pokazano na poniższych zrzutach ekranu.
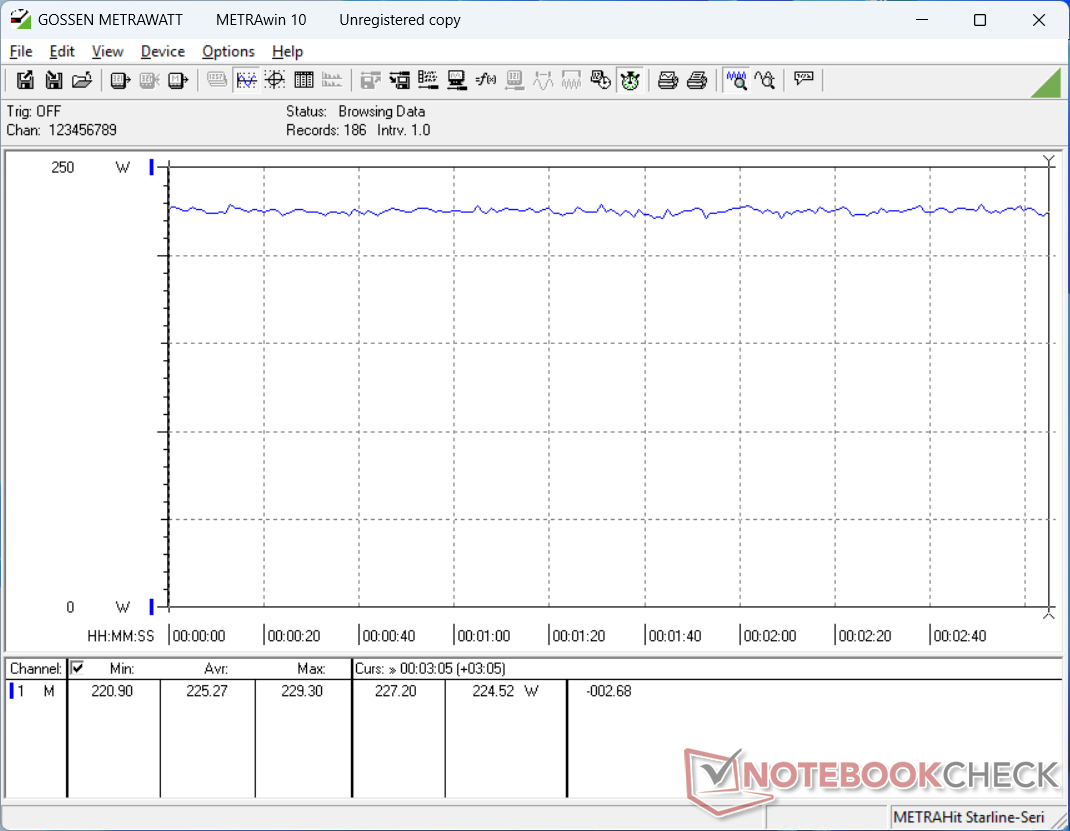
Pobór mocy karty graficznej może osiągnąć pełne 130 W, jak reklamowano, podczas uruchamiania Cyberpunk 2077 w trybie wydajności. Temperatura GPU byłaby jednak stosunkowo wysoka i wynosiłaby ponad 85 C, więc liczba klatek na sekundę ostatecznie spadłaby w odpowiedzi, jak wspomniano w naszej sekcji Wydajność GPU. Taktowanie rdzenia, taktowanie pamięci i pobór mocy z płyty spadłyby jeszcze bardziej, gdybyśmy grali w trybie zrównoważonym.
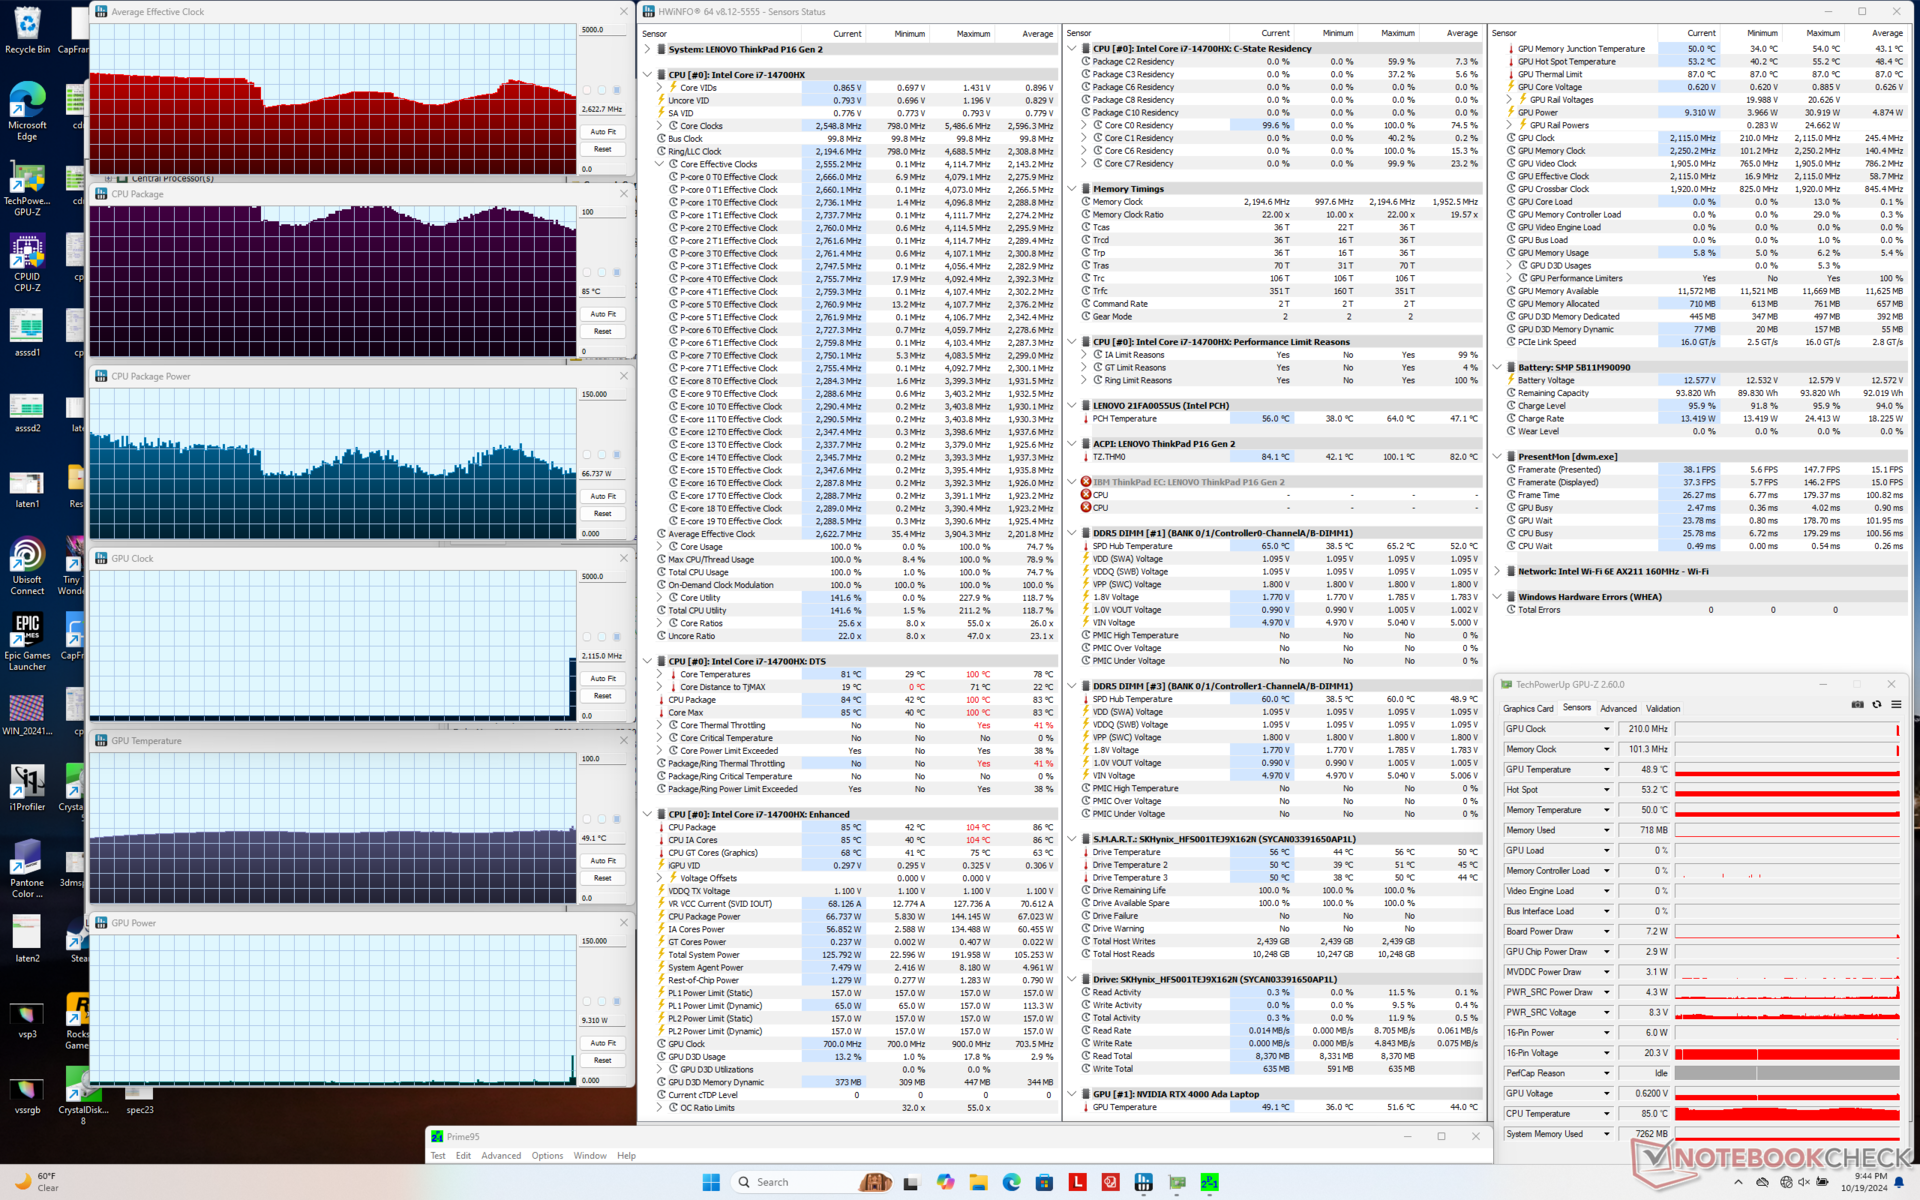
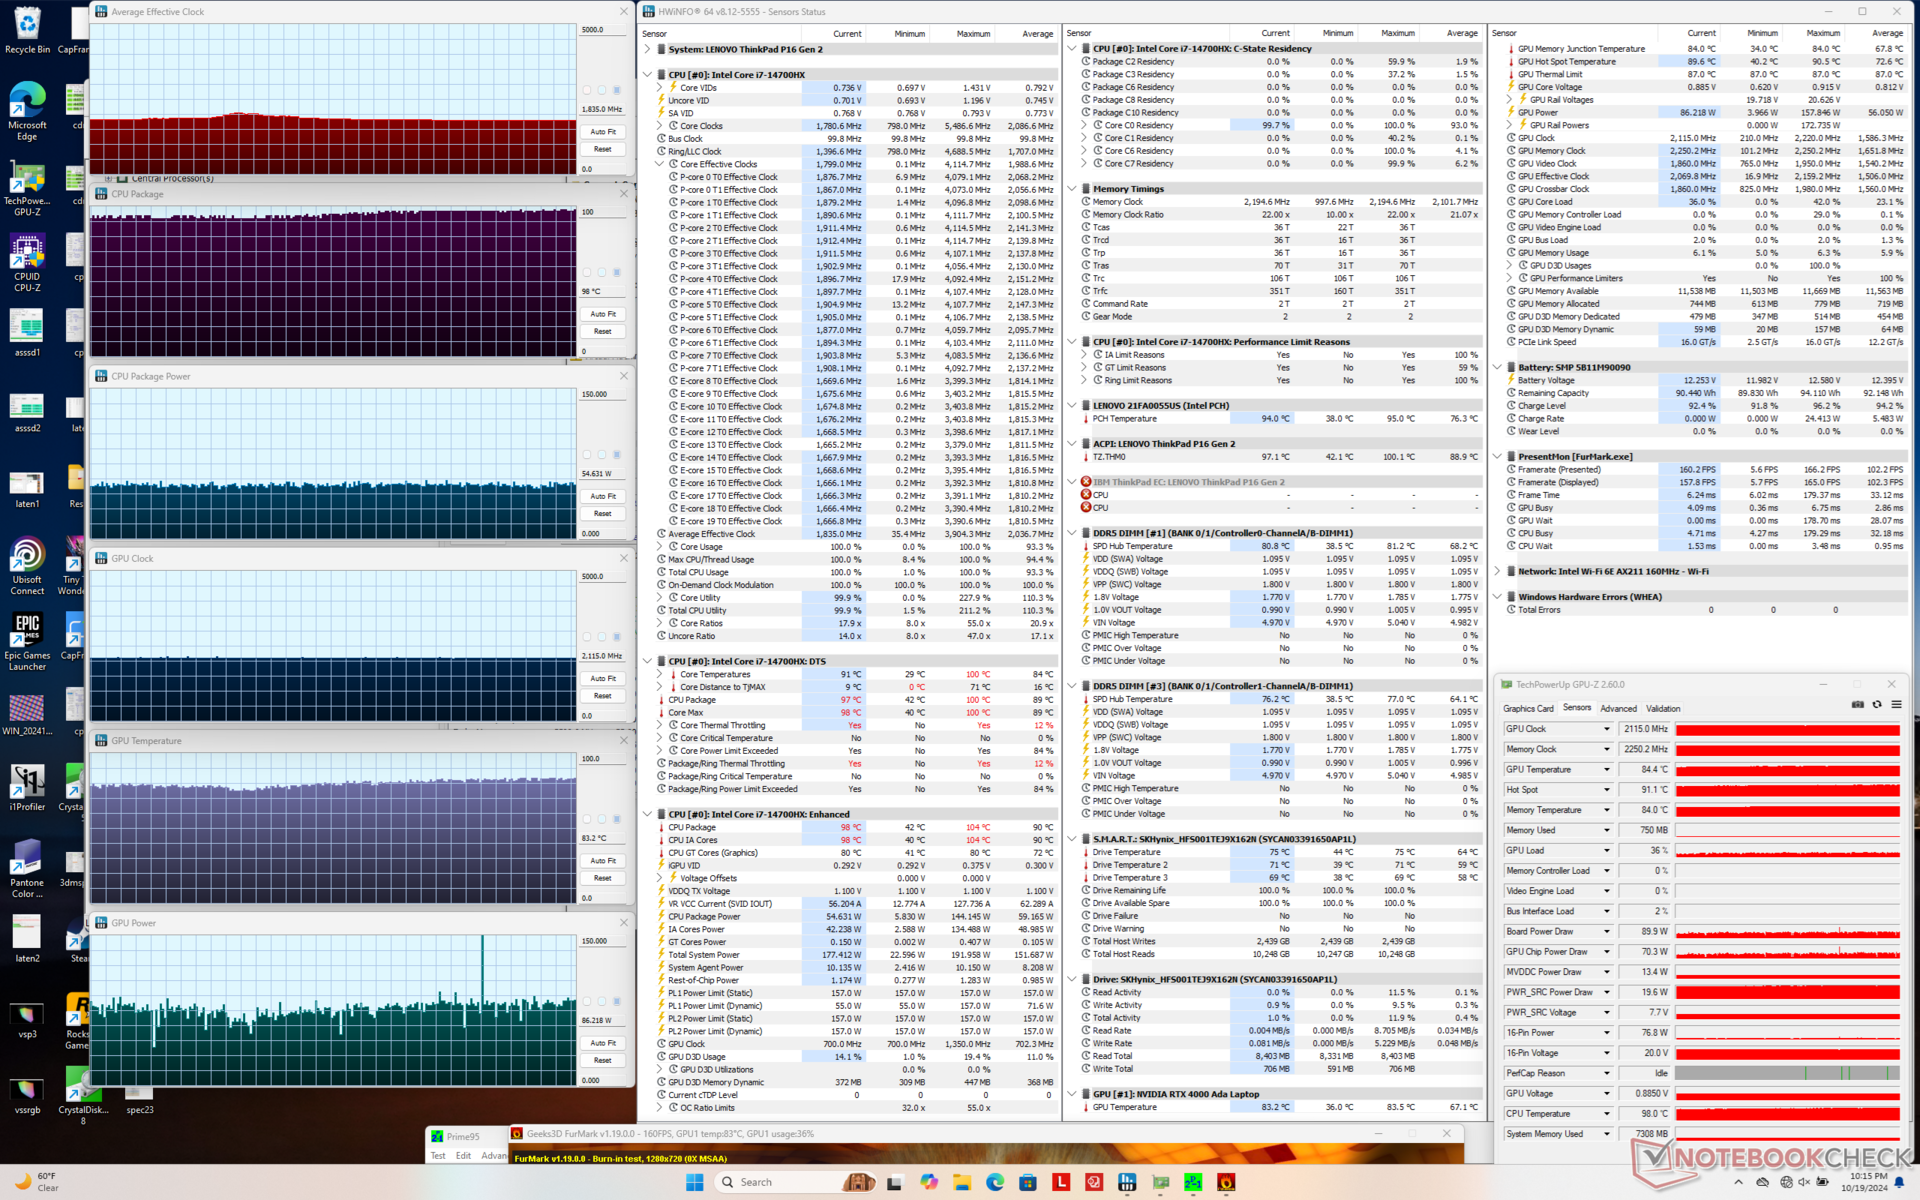
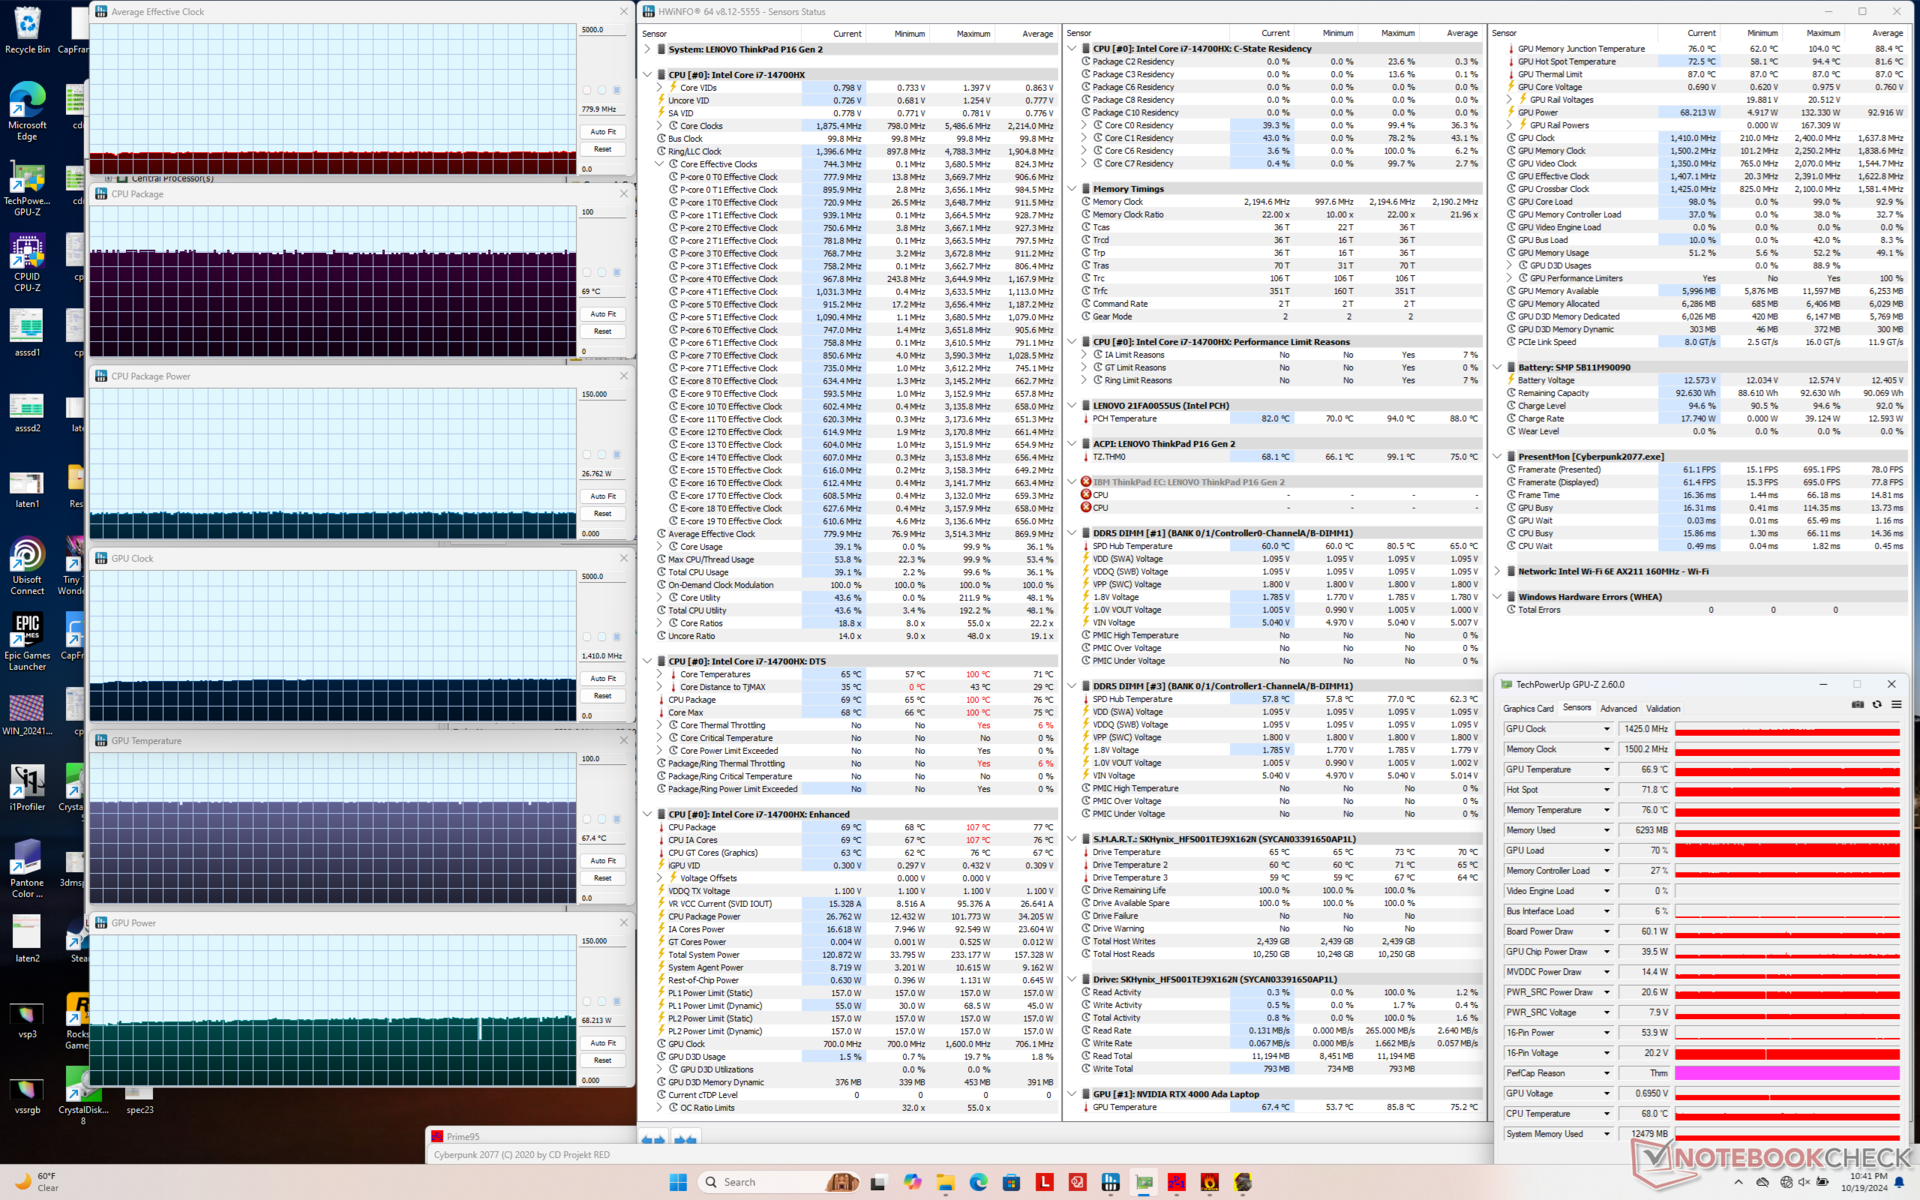
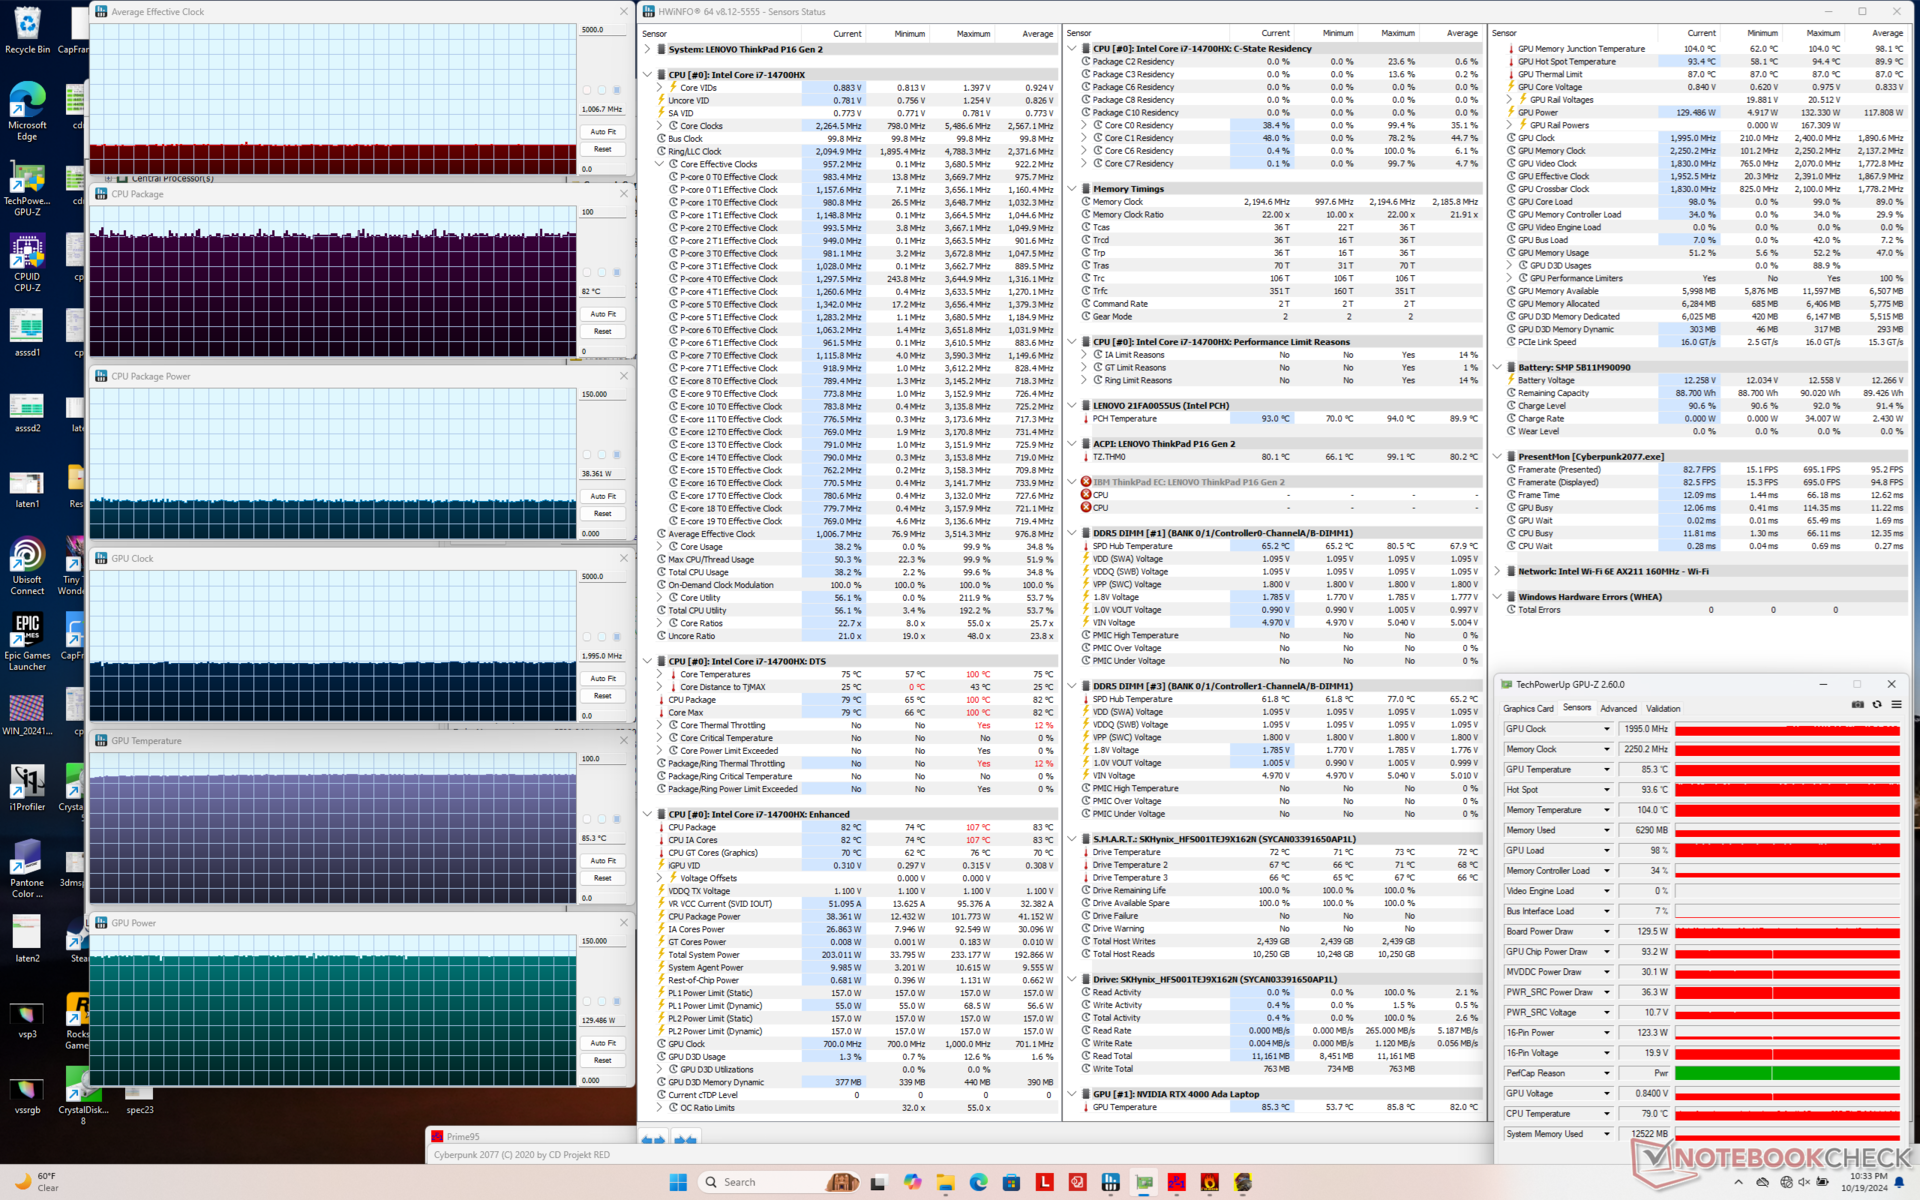
| TaktowanieCPU (GHz) | Taktowanie GPU (MHz) | Średnia temperatura CPU (°C) | Średnia temperatura GPU (°C) | |
| System w stanie spoczynku | -- | -- | 49 | 36 |
| Prime95 Stress | 2.6 - 3.1 | -- | 85 - 100 | 49 |
| Prime95 + FurMark Stress | 1.8 | 2115 | 98 | 83 |
| Cyberpunk 2077 Stress (tryb zrównoważony) | 0.8 | 1425 | 69 | 67 |
| Cyberpunk 2077 Stress (tryb wydajności) | 1.0 | 1995 | 82 | 85 |
Wydajność systemu

CrossMark: Overall | Productivity | Creativity | Responsiveness
WebXPRT 3: Overall
WebXPRT 4: Overall
Mozilla Kraken 1.1: Total
| PCMark 10 / Score | |
| Lenovo ThinkPad P16 Gen 2 | |
| Przeciętny Intel Core i7-14700HX, NVIDIA RTX 4000 Ada Generation Laptop (n=1) | |
| Dell Precision 5690 | |
| HP ZBook Power 16 G11 A | |
| Lenovo ThinkPad P16 G1 RTX A5500 | |
| Lenovo ThinkPad P16 G2 21FA000FGE | |
| Lenovo ThinkPad P16s G2 21K9000CGE | |
| PCMark 10 / Essentials | |
| Lenovo ThinkPad P16 Gen 2 | |
| Przeciętny Intel Core i7-14700HX, NVIDIA RTX 4000 Ada Generation Laptop (n=1) | |
| Dell Precision 5690 | |
| Lenovo ThinkPad P16 G2 21FA000FGE | |
| Lenovo ThinkPad P16 G1 RTX A5500 | |
| HP ZBook Power 16 G11 A | |
| Lenovo ThinkPad P16s G2 21K9000CGE | |
| PCMark 10 / Productivity | |
| Dell Precision 5690 | |
| Lenovo ThinkPad P16 Gen 2 | |
| Przeciętny Intel Core i7-14700HX, NVIDIA RTX 4000 Ada Generation Laptop (n=1) | |
| HP ZBook Power 16 G11 A | |
| Lenovo ThinkPad P16 G1 RTX A5500 | |
| Lenovo ThinkPad P16 G2 21FA000FGE | |
| Lenovo ThinkPad P16s G2 21K9000CGE | |
| PCMark 10 / Digital Content Creation | |
| Lenovo ThinkPad P16 Gen 2 | |
| Przeciętny Intel Core i7-14700HX, NVIDIA RTX 4000 Ada Generation Laptop (n=1) | |
| Dell Precision 5690 | |
| HP ZBook Power 16 G11 A | |
| Lenovo ThinkPad P16 G1 RTX A5500 | |
| Lenovo ThinkPad P16 G2 21FA000FGE | |
| Lenovo ThinkPad P16s G2 21K9000CGE | |
| CrossMark / Overall | |
| Lenovo ThinkPad P16 Gen 2 | |
| Przeciętny Intel Core i7-14700HX, NVIDIA RTX 4000 Ada Generation Laptop (n=1) | |
| Lenovo ThinkPad P16 G1 RTX A5500 | |
| Lenovo ThinkPad P16 G2 21FA000FGE | |
| Dell Precision 5690 | |
| HP ZBook Power 16 G11 A | |
| Lenovo ThinkPad P16s G2 21K9000CGE | |
| CrossMark / Productivity | |
| Lenovo ThinkPad P16 Gen 2 | |
| Przeciętny Intel Core i7-14700HX, NVIDIA RTX 4000 Ada Generation Laptop (n=1) | |
| Lenovo ThinkPad P16 G1 RTX A5500 | |
| Dell Precision 5690 | |
| Lenovo ThinkPad P16 G2 21FA000FGE | |
| HP ZBook Power 16 G11 A | |
| Lenovo ThinkPad P16s G2 21K9000CGE | |
| CrossMark / Creativity | |
| Lenovo ThinkPad P16 Gen 2 | |
| Przeciętny Intel Core i7-14700HX, NVIDIA RTX 4000 Ada Generation Laptop (n=1) | |
| Lenovo ThinkPad P16 G1 RTX A5500 | |
| Lenovo ThinkPad P16 G2 21FA000FGE | |
| HP ZBook Power 16 G11 A | |
| Dell Precision 5690 | |
| Lenovo ThinkPad P16s G2 21K9000CGE | |
| CrossMark / Responsiveness | |
| Lenovo ThinkPad P16 Gen 2 | |
| Przeciętny Intel Core i7-14700HX, NVIDIA RTX 4000 Ada Generation Laptop (n=1) | |
| Dell Precision 5690 | |
| Lenovo ThinkPad P16 G1 RTX A5500 | |
| Lenovo ThinkPad P16 G2 21FA000FGE | |
| HP ZBook Power 16 G11 A | |
| Lenovo ThinkPad P16s G2 21K9000CGE | |
| WebXPRT 3 / Overall | |
| Lenovo ThinkPad P16 Gen 2 | |
| Przeciętny Intel Core i7-14700HX, NVIDIA RTX 4000 Ada Generation Laptop (n=1) | |
| Lenovo ThinkPad P16 G2 21FA000FGE | |
| Lenovo ThinkPad P16 G1 RTX A5500 | |
| HP ZBook Power 16 G11 A | |
| Dell Precision 5690 | |
| Lenovo ThinkPad P16s G2 21K9000CGE | |
| WebXPRT 4 / Overall | |
| Lenovo ThinkPad P16 Gen 2 | |
| Przeciętny Intel Core i7-14700HX, NVIDIA RTX 4000 Ada Generation Laptop (n=1) | |
| Lenovo ThinkPad P16 G1 RTX A5500 | |
| Dell Precision 5690 | |
| HP ZBook Power 16 G11 A | |
| Mozilla Kraken 1.1 / Total | |
| Lenovo ThinkPad P16s G2 21K9000CGE | |
| HP ZBook Power 16 G11 A | |
| Dell Precision 5690 | |
| Lenovo ThinkPad P16 G1 RTX A5500 | |
| Lenovo ThinkPad P16 G2 21FA000FGE | |
| Lenovo ThinkPad P16 Gen 2 | |
| Przeciętny Intel Core i7-14700HX, NVIDIA RTX 4000 Ada Generation Laptop (n=1) | |
* ... im mniej tym lepiej
| PCMark 10 Score | 8353 pkt. | |
Pomoc | ||
| AIDA64 / Memory Copy | |
| Dell Precision 5690 | |
| Przeciętny Intel Core i7-14700HX (41617 - 78742, n=9) | |
| Lenovo ThinkPad P16s G2 21K9000CGE | |
| Lenovo ThinkPad P16 Gen 2 | |
| Lenovo ThinkPad P16 G1 RTX A5500 | |
| HP ZBook Power 16 G11 A | |
| Lenovo ThinkPad P16 G2 21FA000FGE | |
| AIDA64 / Memory Read | |
| Dell Precision 5690 | |
| Przeciętny Intel Core i7-14700HX (46627 - 86175, n=9) | |
| Lenovo ThinkPad P16 Gen 2 | |
| Lenovo ThinkPad P16 G1 RTX A5500 | |
| HP ZBook Power 16 G11 A | |
| Lenovo ThinkPad P16 G2 21FA000FGE | |
| Lenovo ThinkPad P16s G2 21K9000CGE | |
| AIDA64 / Memory Write | |
| Lenovo ThinkPad P16s G2 21K9000CGE | |
| HP ZBook Power 16 G11 A | |
| Dell Precision 5690 | |
| Przeciętny Intel Core i7-14700HX (39155 - 76976, n=9) | |
| Lenovo ThinkPad P16 Gen 2 | |
| Lenovo ThinkPad P16 G1 RTX A5500 | |
| Lenovo ThinkPad P16 G2 21FA000FGE | |
| AIDA64 / Memory Latency | |
| Dell Precision 5690 | |
| Lenovo ThinkPad P16s G2 21K9000CGE | |
| Lenovo ThinkPad P16 G2 21FA000FGE | |
| HP ZBook Power 16 G11 A | |
| Lenovo ThinkPad P16 Gen 2 | |
| Lenovo ThinkPad P16 G1 RTX A5500 | |
| Przeciętny Intel Core i7-14700HX (82.7 - 96.4, n=9) | |
* ... im mniej tym lepiej
Opóźnienie DPC
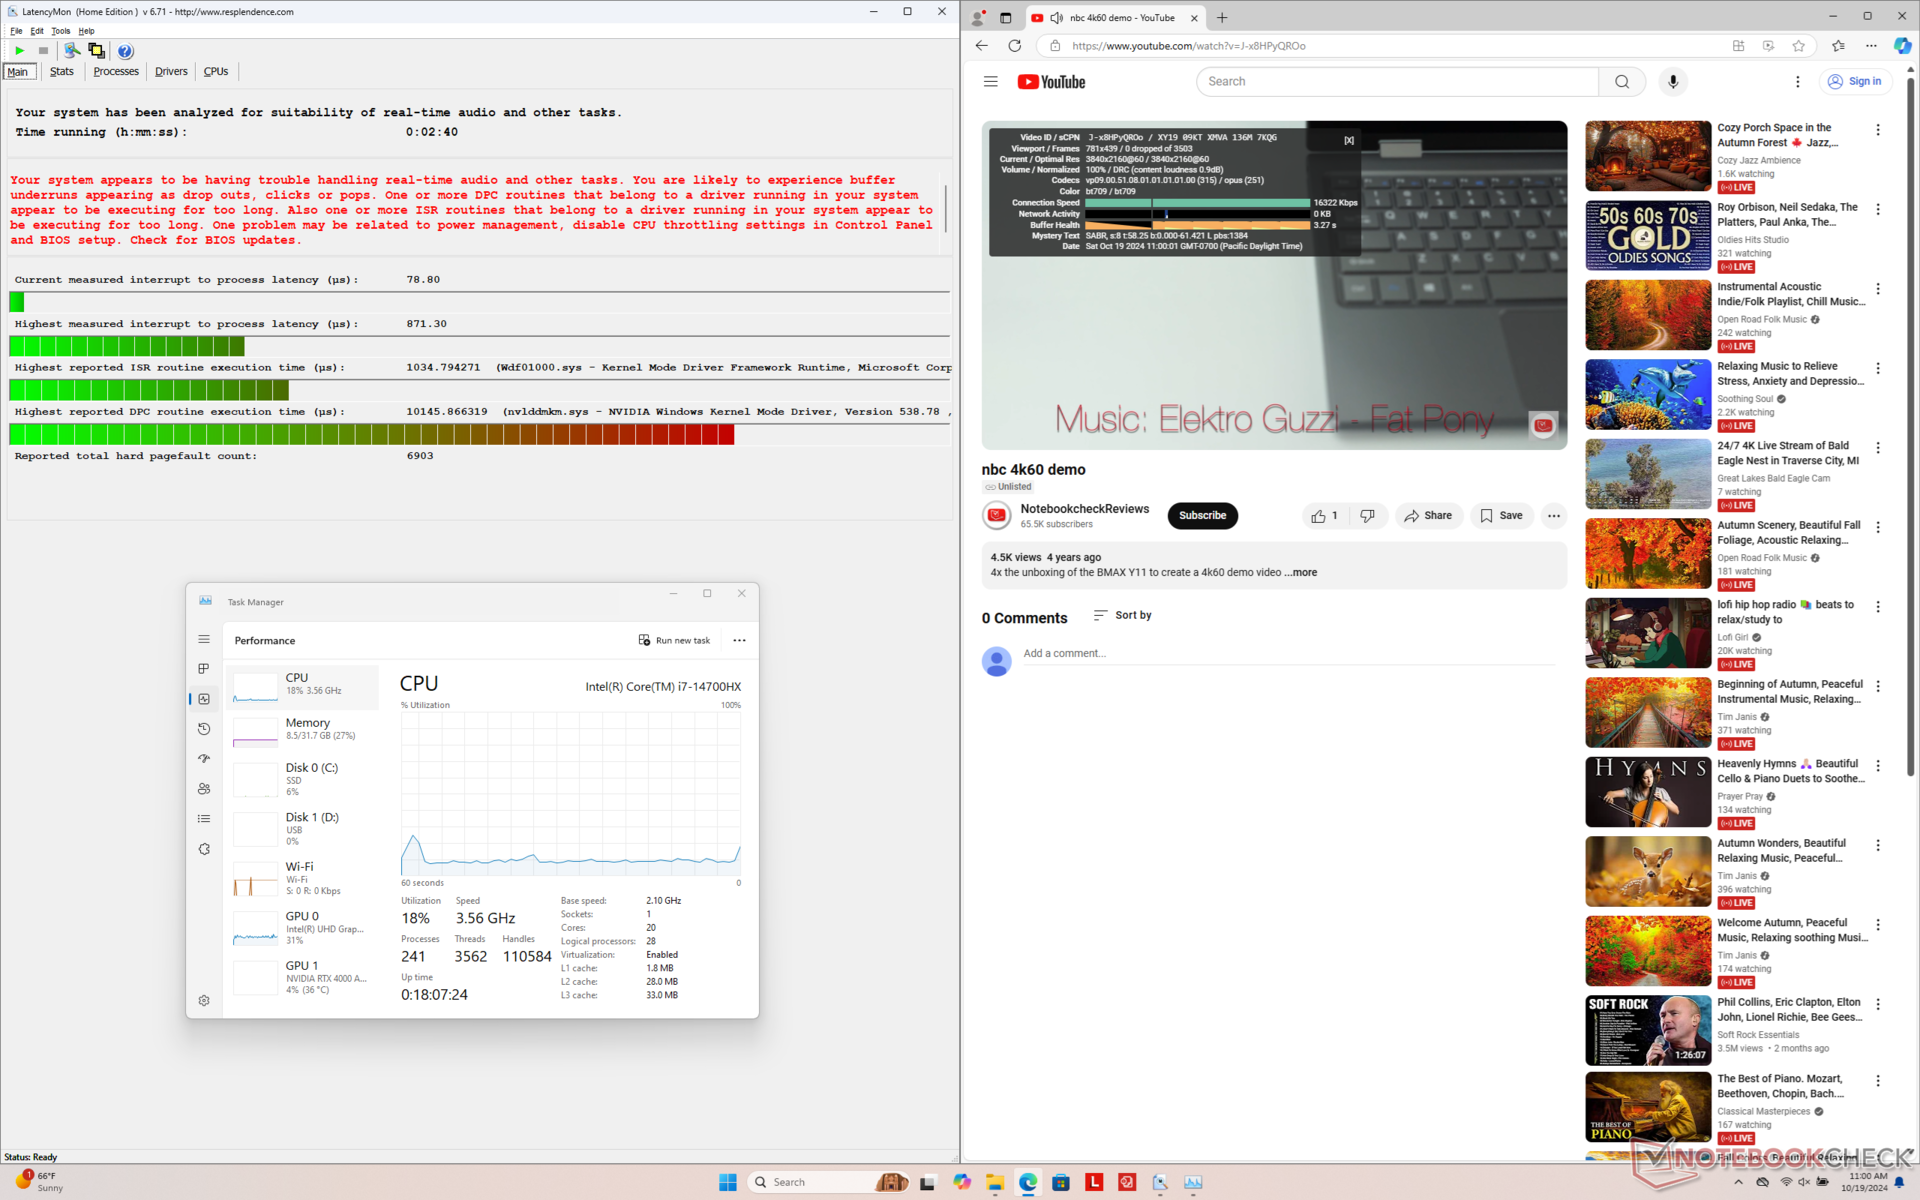
LatencyMon ujawnia niewielkie problemy z DPC podczas otwierania wielu kart przeglądarki na naszej stronie głównej. odtwarzanie wideo 4K przy 60 FPS jest poza tym idealne i nie odnotowano żadnych spadków klatek.
| DPC Latencies / LatencyMon - interrupt to process latency (max), Web, Youtube, Prime95 | |
| HP ZBook Power 16 G11 A | |
| Lenovo ThinkPad P16 G1 RTX A5500 | |
| Lenovo ThinkPad P16s G2 21K9000CGE | |
| Lenovo ThinkPad P16 G2 21FA000FGE | |
| Lenovo ThinkPad P16 Gen 2 | |
| Dell Precision 5690 | |
* ... im mniej tym lepiej
Urządzenia pamięci masowej
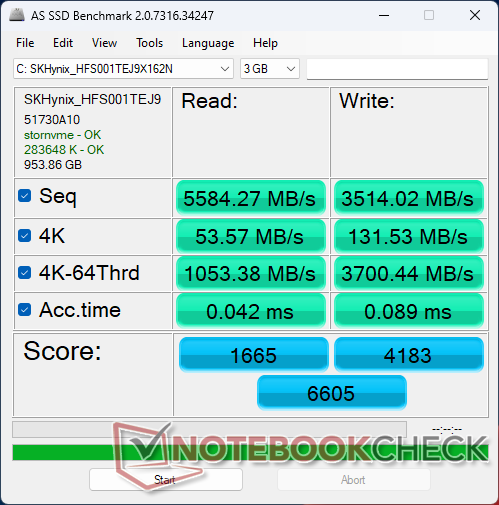
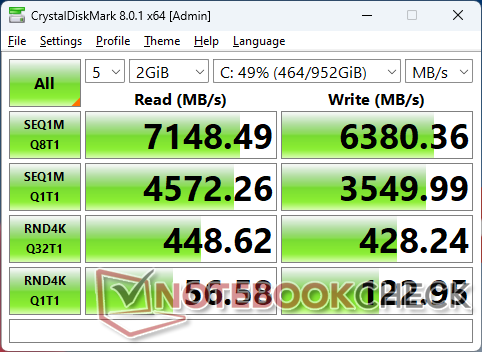
Nie zaobserwowano żadnych zmian w opcjach pamięci masowej ani wydajności dysków SSD między naszymi dwoma jednostkami testowymi ThinkPad P16 Gen 2.

* ... im mniej tym lepiej
Disk Throttling: DiskSpd Read Loop, Queue Depth 8
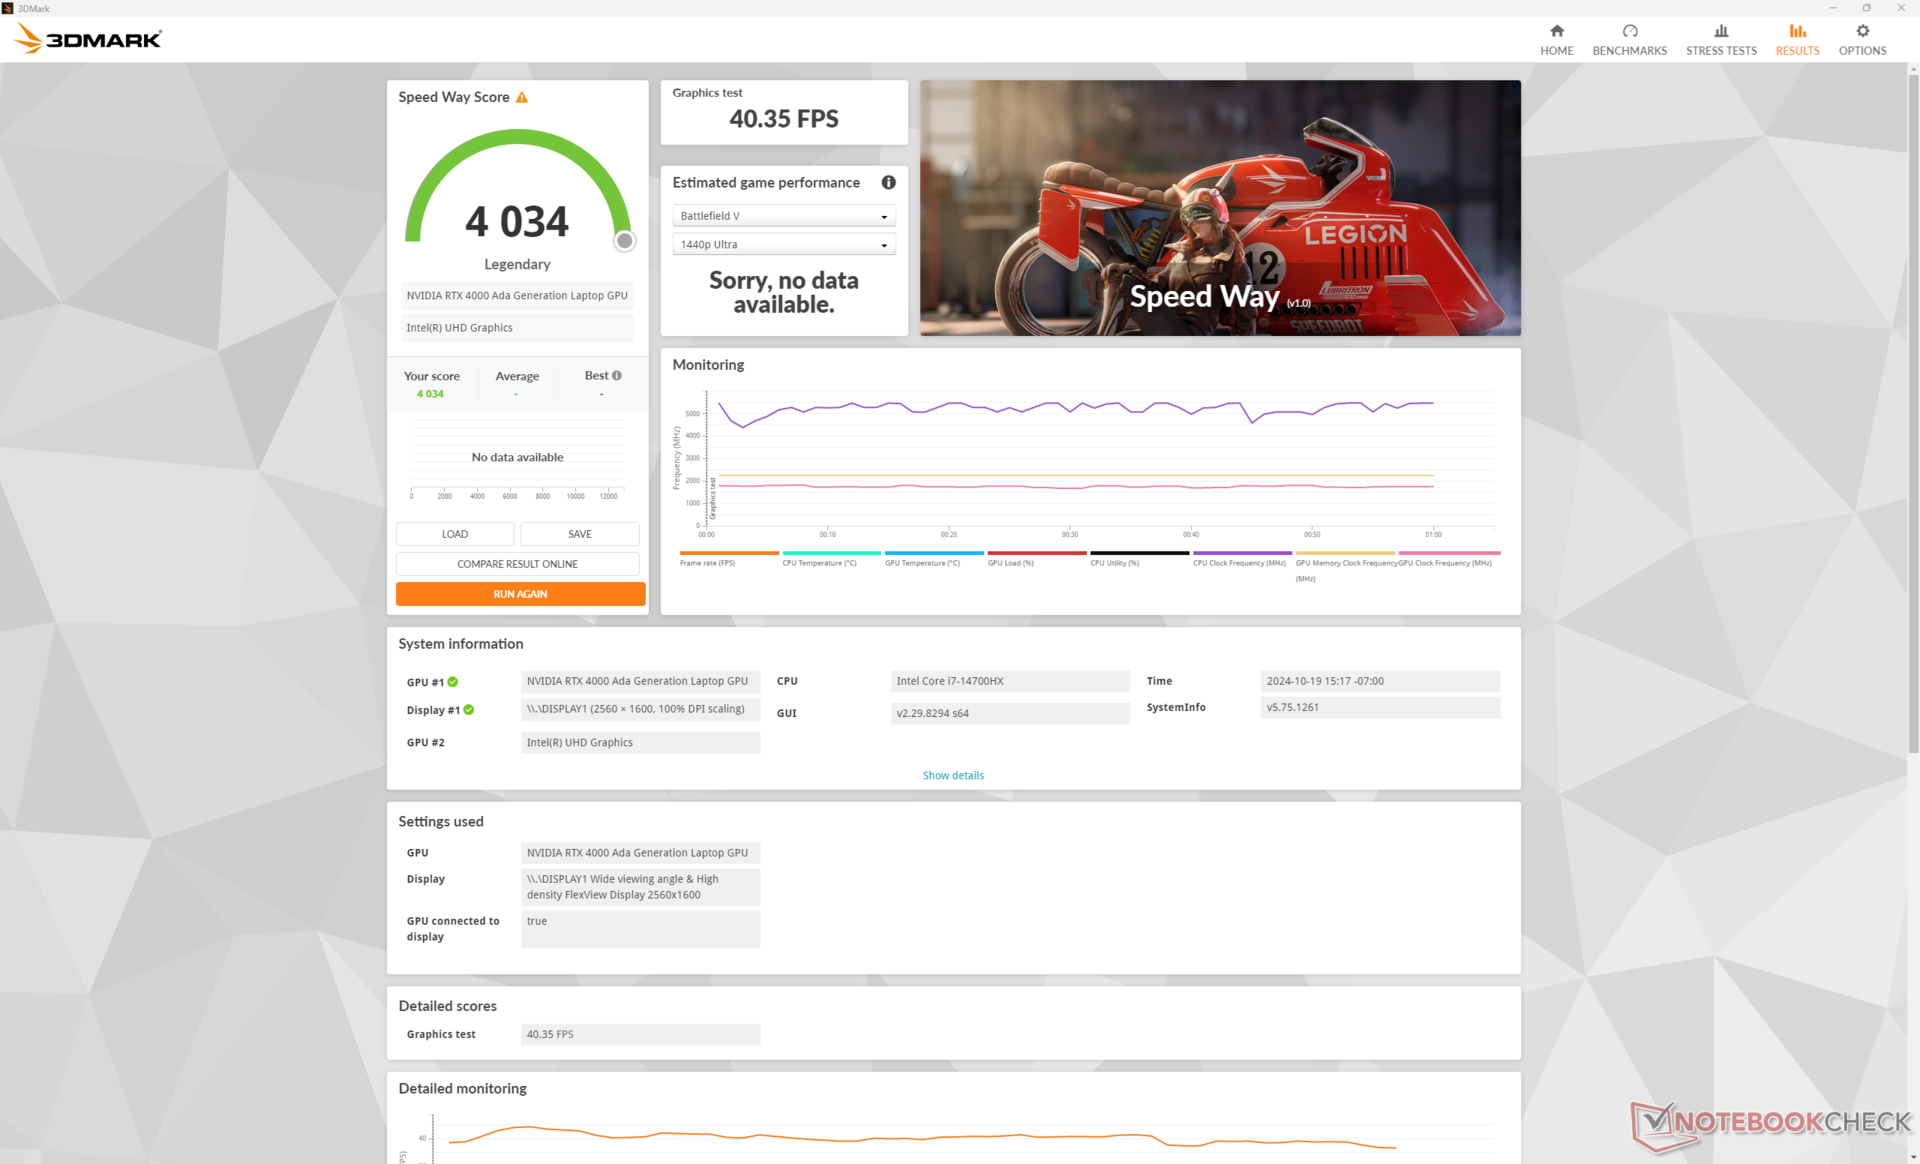
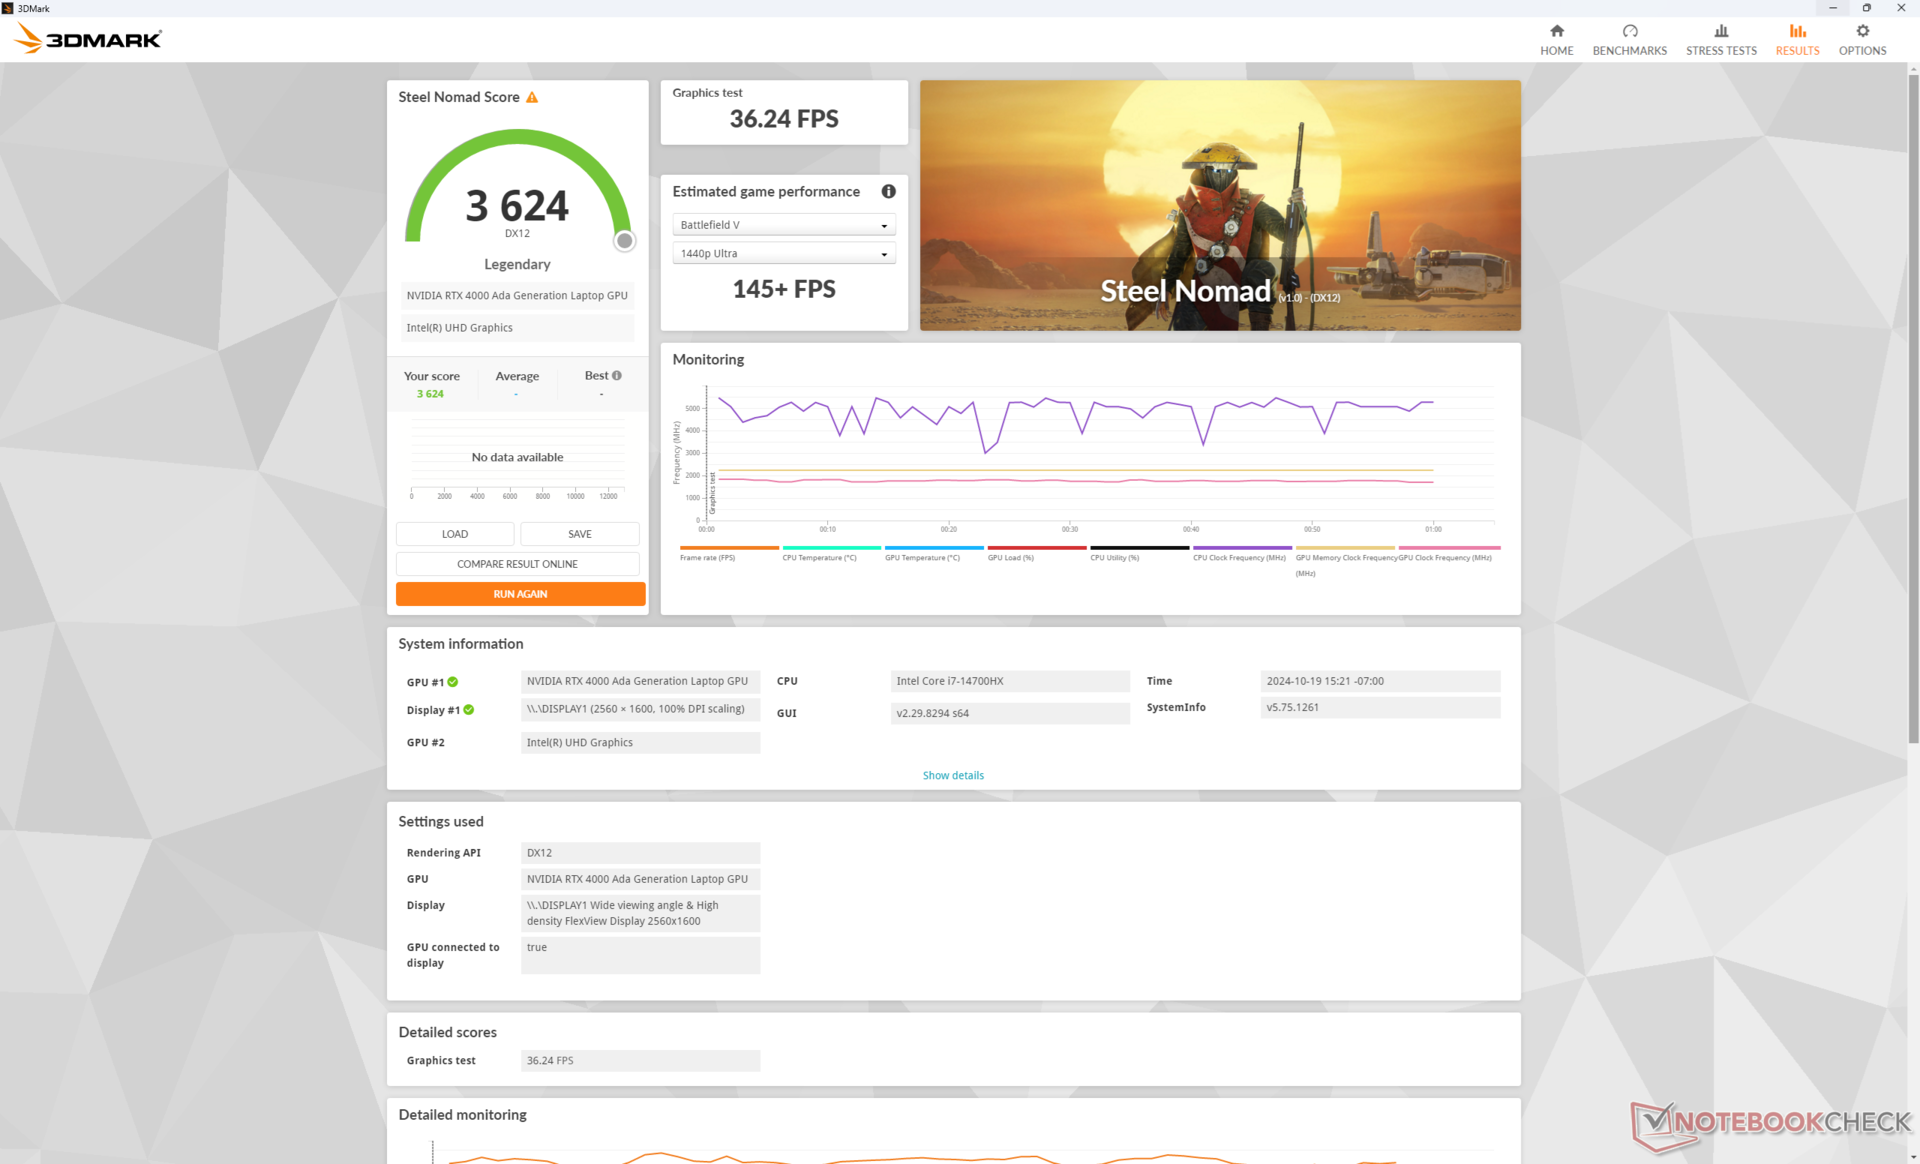
Wydajność GPU
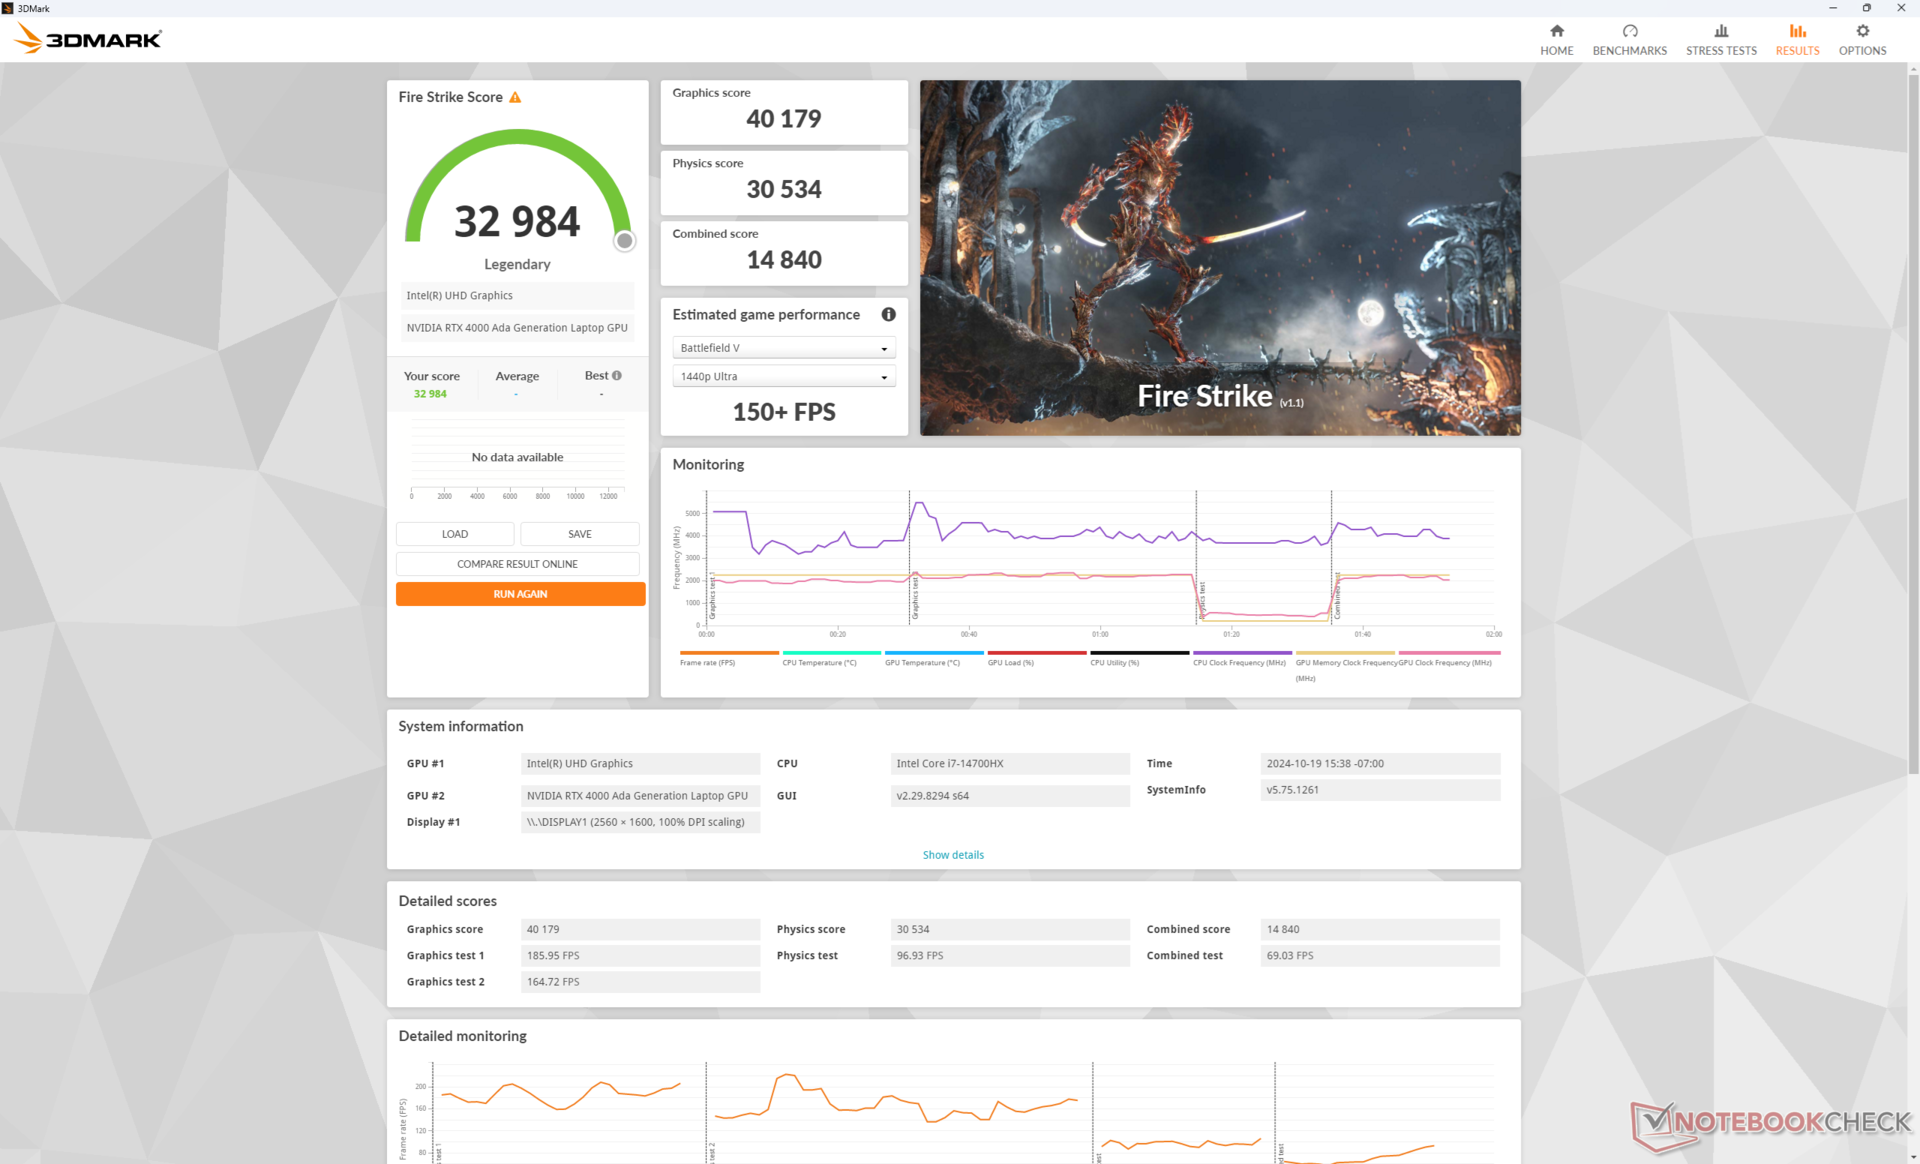
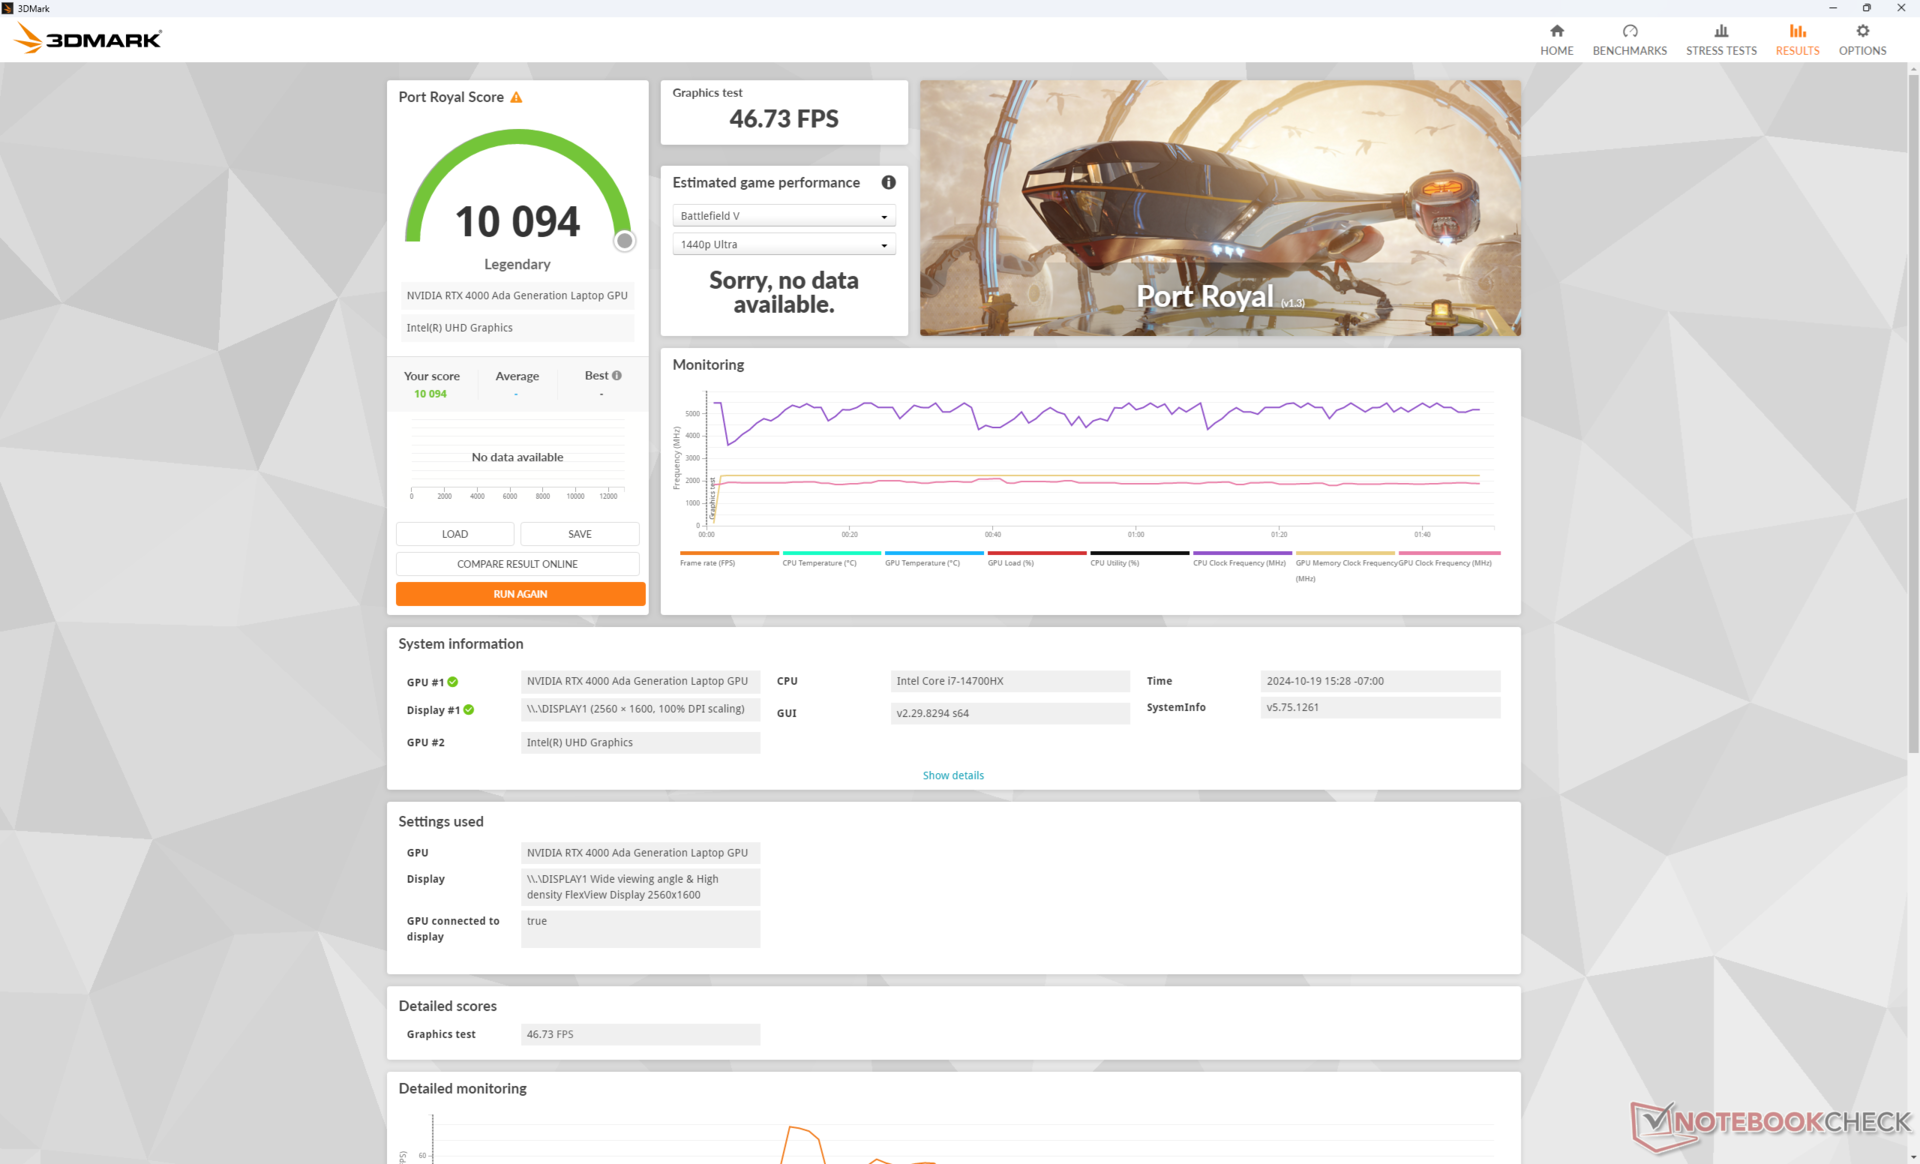
130 W RTX 4000 Ada w naszym Lenovo jest bardzo mocny jak na mobilny procesor graficzny, pokonując nawet 95 W RTX 5000 Ada w Precision 5690 ze zdrowym marginesem. wyniki 3DMark, na przykład, są od 10 do 40 procent wyższe i podobne wyniki można uzyskać po uruchomieniu SpecViewPerf.
| Profil zasilania | Wynik grafiki | Wynik fizyki | Wynik łączny |
| Tryb wydajności | 40179 | 30534 | 14840 |
| Tryb zrównoważony | 32889 (-18%) | 29923 (-2%) | 13007 (-12%) |
| Tryb baterii | 23401 (-42%) | 27793 (-9%) | 8510 (-42%) |
Zejście do trybu zrównoważonego z trybu wydajności ma dość znaczący wpływ na wydajność graficzną, jak pokazuje nasza tabela wyników Fire Strike powyżej.
| 3DMark Performance rating - Percent | |
| Lenovo ThinkPad P16 Gen 2 -3! | |
| Przeciętny NVIDIA RTX 4000 Ada Generation Laptop -3! | |
| Dell Precision 5690 -3! | |
| HP ZBook Fury 16 G11 | |
| HP ZBook Fury 16 G9 -3! | |
| Dell Precision 5000 5490 -3! | |
| MSI CreatorPro Z16P B12UKST -19! | |
| HP ZBook Power 15 G10 -11! | |
| Asus ExpertBook B6 Flip B6602FC2 -19! | |
| Lenovo ThinkPad P16v G1 AMD -18! | |
| Lenovo ThinkPad P1 G4-20Y4Z9DVUS -19! | |
| Lenovo ThinkPad P16s G2 21K9000CGE -19! | |
| HP ZBook Firefly 16 G9-6B897EA -19! | |
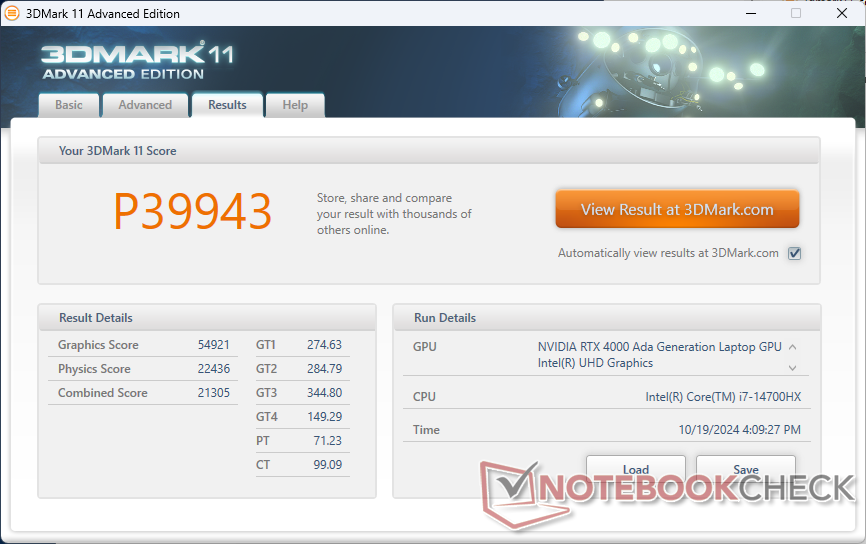
| 3DMark 11 Performance | 39943 pkt. | |
| 3DMark Cloud Gate Standard Score | 61459 pkt. | |
| 3DMark Fire Strike Score | 32984 pkt. | |
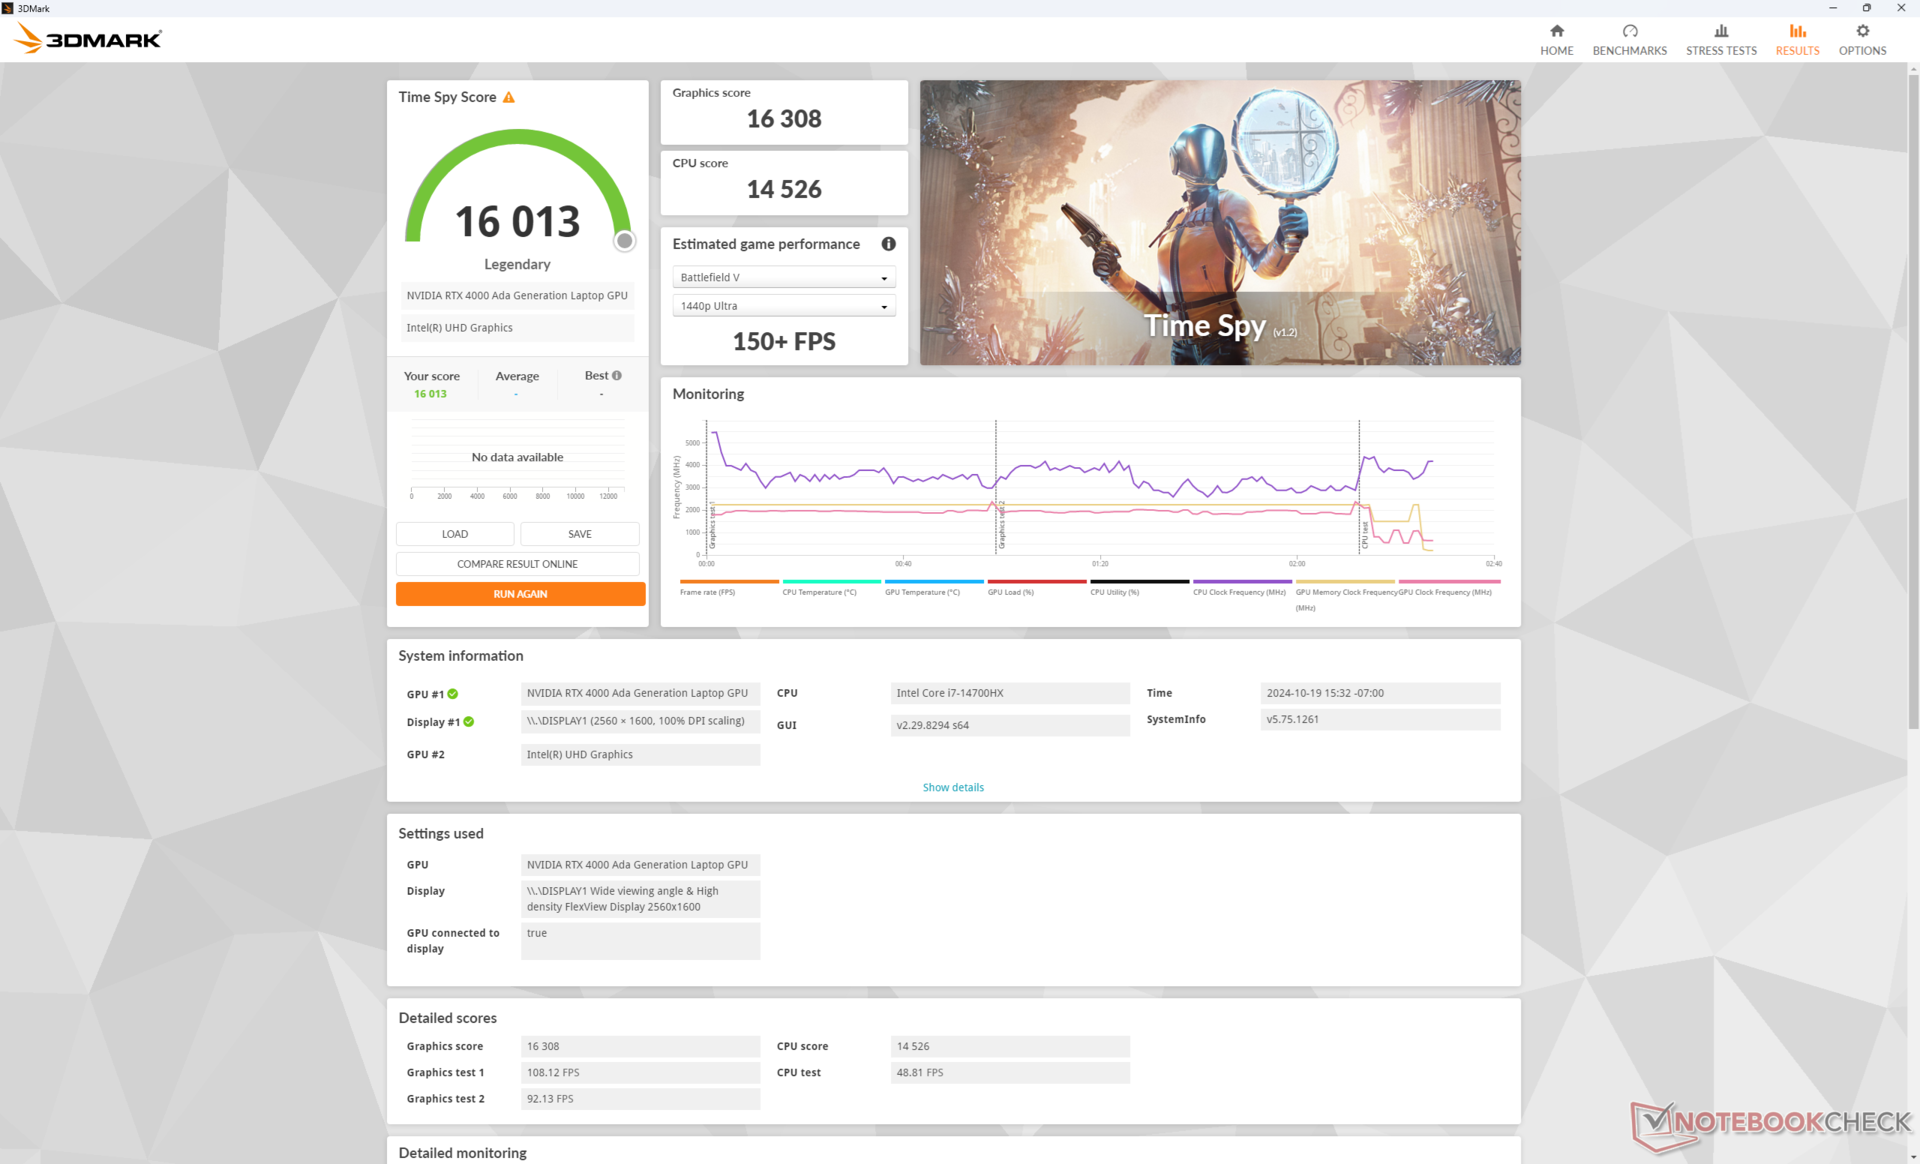
| 3DMark Time Spy Score | 16013 pkt. | |
| 3DMark Steel Nomad Score | 3624 pkt. | |
Pomoc | ||
* ... im mniej tym lepiej
Wydajność w grach
Chociaż RTX 4000 Ada nie jest zoptymalizowana pod kątem gier, to wciąż jest potężnym urządzeniem, zwłaszcza biorąc pod uwagę jej 130 W pułap TGP. Wydajność w grach jest najbardziej zbliżona do wysokiej klasy laptopa do gier działającego na mobilnym GeForce RTX 4080.
| Performance rating - Percent | |
| Lenovo ThinkPad P16 Gen 2 | |
| Dell Precision 5690 -1! | |
| Lenovo ThinkPad P16 G1 RTX A5500 -1! | |
| Lenovo ThinkPad P16 G2 21FA000FGE -1! | |
| HP ZBook Power 16 G11 A | |
| Lenovo ThinkPad P16s G2 21K9000CGE -1! | |
| Baldur's Gate 3 - 1920x1080 Ultra Preset AA:T | |
| Lenovo ThinkPad P16 Gen 2 | |
| Dell Precision 5690 | |
| HP ZBook Power 16 G11 A | |
| GTA V - 1920x1080 Highest AA:4xMSAA + FX AF:16x | |
| Lenovo ThinkPad P16 Gen 2 | |
| Lenovo ThinkPad P16 G1 RTX A5500 | |
| Lenovo ThinkPad P16 G2 21FA000FGE | |
| HP ZBook Power 16 G11 A | |
| Lenovo ThinkPad P16s G2 21K9000CGE | |
| Final Fantasy XV Benchmark - 1920x1080 High Quality | |
| Lenovo ThinkPad P16 Gen 2 | |
| Dell Precision 5690 | |
| Lenovo ThinkPad P16 G1 RTX A5500 | |
| Lenovo ThinkPad P16 G2 21FA000FGE | |
| HP ZBook Power 16 G11 A | |
| Lenovo ThinkPad P16s G2 21K9000CGE | |
| Strange Brigade - 1920x1080 ultra AA:ultra AF:16 | |
| Lenovo ThinkPad P16 Gen 2 | |
| Dell Precision 5690 | |
| Lenovo ThinkPad P16 G1 RTX A5500 | |
| Lenovo ThinkPad P16 G2 21FA000FGE | |
| HP ZBook Power 16 G11 A | |
| Lenovo ThinkPad P16s G2 21K9000CGE | |
| Dota 2 Reborn - 1920x1080 ultra (3/3) best looking | |
| Lenovo ThinkPad P16 Gen 2 | |
| Lenovo ThinkPad P16 G1 RTX A5500 | |
| Lenovo ThinkPad P16 G2 21FA000FGE | |
| Dell Precision 5690 | |
| HP ZBook Power 16 G11 A | |
| Lenovo ThinkPad P16s G2 21K9000CGE | |
| Baldur's Gate 3 | |
| 1920x1080 High Preset AA:T | |
| Lenovo ThinkPad P16 Gen 2 | |
| Przeciętny NVIDIA RTX 4000 Ada Generation Laptop (n=1) | |
| Dell Precision 5690 | |
| HP ZBook Fury 16 G11 | |
| Dell Precision 5000 5490 | |
| 1920x1080 Ultra Preset AA:T | |
| Lenovo ThinkPad P16 Gen 2 | |
| Przeciętny NVIDIA RTX 4000 Ada Generation Laptop (n=1) | |
| Dell Precision 5690 | |
| HP ZBook Fury 16 G11 | |
| Dell Precision 5000 5490 | |
| 2560x1440 Ultra Preset AA:T | |
| Dell Precision 5690 | |
| Lenovo ThinkPad P16 Gen 2 | |
| Przeciętny NVIDIA RTX 4000 Ada Generation Laptop (n=1) | |
| HP ZBook Fury 16 G11 | |
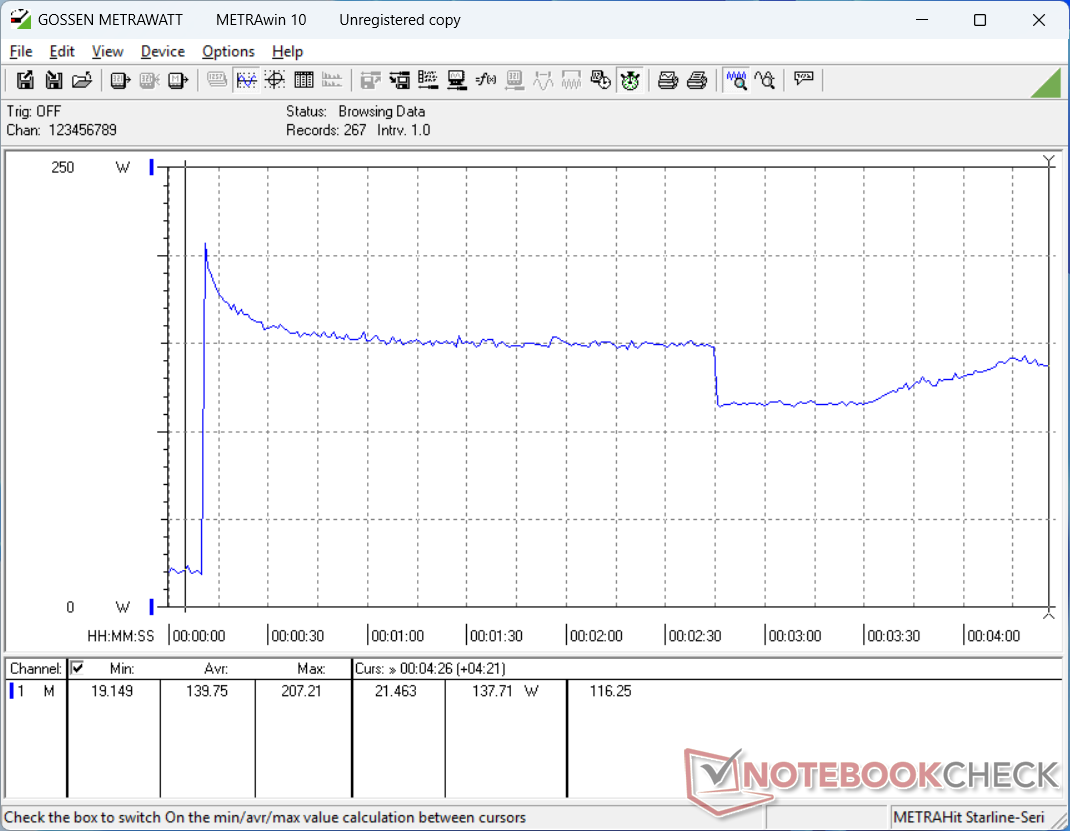
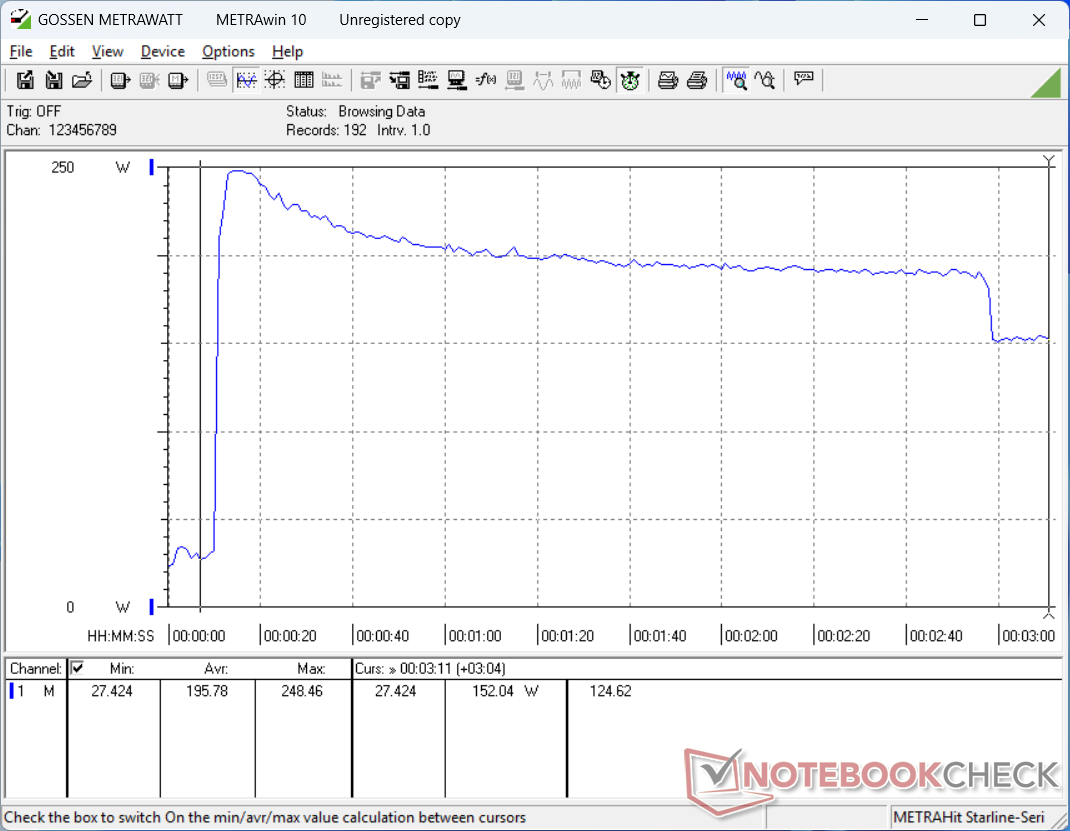
Niestety, podczas uruchamiania Cyberpunk 2077 występuje niewielki spadek wydajności. Liczba klatek na sekundę spadła z ~103 do ~96 po zaledwie kilku minutach bezczynności w grze, a wyniki nie poprawiły się po powtórzeniu testów. Sugeruje to, że GPU mógłby potencjalnie skorzystać z bardziej wydajnego rozwiązania chłodzącego.
Cyberpunk 2077 ultra FPS Chart
| low | med. | high | ultra | QHD | |
|---|---|---|---|---|---|
| GTA V (2015) | 185.8 | 183.9 | 179.4 | 125.6 | 118.7 |
| Dota 2 Reborn (2015) | 215.4 | 189.7 | 185.2 | 164.4 | |
| Final Fantasy XV Benchmark (2018) | 207 | 185.3 | 150 | 119.5 | |
| X-Plane 11.11 (2018) | 166.8 | 144 | 113.1 | ||
| Far Cry 5 (2018) | 168 | 148 | 138 | 128 | 125 |
| Strange Brigade (2018) | 452 | 372 | 323 | 292 | 210 |
| Tiny Tina's Wonderlands (2022) | 275.4 | 232.6 | 171.4 | 137.1 | 92 |
| F1 22 (2022) | 275 | 264 | 238 | 95.5 | 65.7 |
| Baldur's Gate 3 (2023) | 178.3 | 160.6 | 141.6 | 137 | 90.7 |
| Cyberpunk 2077 (2023) | 129.3 | 115.1 | 108.4 | 98.3 | 68.5 |
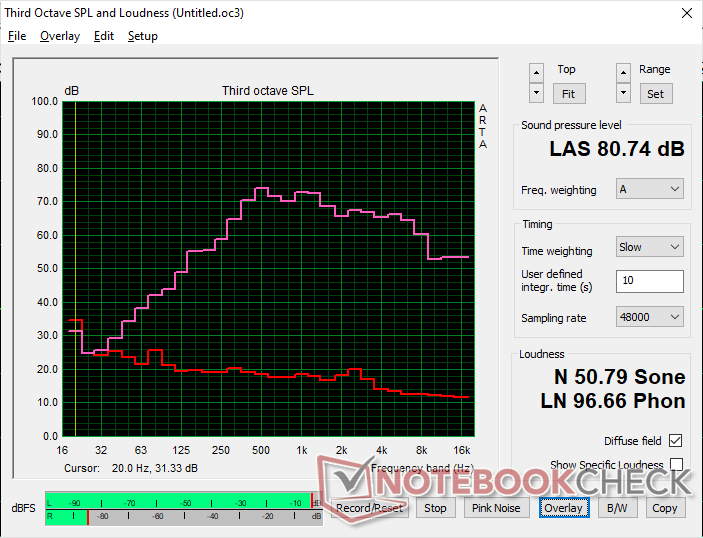
Emisje - głośno i na czele
Hałas systemowy
Wentylatory w naszej jednostce mają tendencję do szybszego zwiększania obrotów i hałasu w porównaniu z naszą mniejszą konfiguracją RTX 2000 Ada. W związku z tym właściciele mogą spodziewać się większego pulsowania wentylatorów i zmian w ich hałasie podczas pracy z różnymi rodzajami obciążeń. Wymagające obciążenia, takie jak gry, spowodowałyby hałas wentylatora na poziomie 53 dB(A), co jest jedną z najgłośniejszych 16-calowych stacji roboczych, jakie testowaliśmy.
Uruchomienie gry Cyberpunk 2077 w trybie zrównoważonym zamiast w trybie wydajności znacznie zmniejszyłoby hałas wentylatora z 52,8 dB(A) do 47,9 dB(A). Odbywa się to jednak kosztem wydajności, o czym pisaliśmy w sekcji Wydajność GPU powyżej.
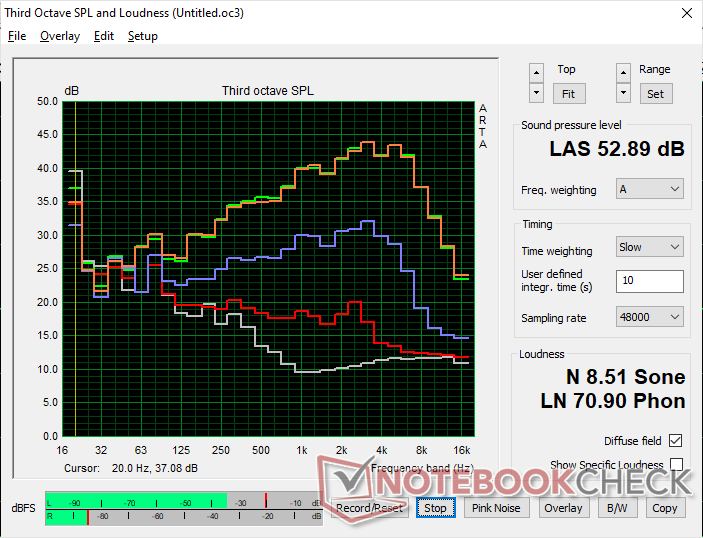
Hałas
| luz |
| 29.1 / 29.1 / 29.1 dB |
| obciążenie |
| 41 / 52.9 dB |
 | ||
30 dB cichy 40 dB(A) słyszalny 50 dB(A) irytujący |
||
min: | ||
| Lenovo ThinkPad P16 Gen 2 RTX 4000 Ada Generation Laptop, i7-14700HX, SK hynix PC801 HFS001TEJ9X162N | Lenovo ThinkPad P16 G2 21FA000FGE RTX 2000 Ada Generation Laptop, i7-13700HX, SK hynix PC801 HFS001TEJ9X162N | Lenovo ThinkPad P16s G2 21K9000CGE Radeon 780M, R7 PRO 7840U, SK hynix PC801 HFS001TEJ9X162N | Lenovo ThinkPad P16 G1 RTX A5500 RTX A5500 Laptop GPU, i9-12950HX, WDC PC SN810 2TB | HP ZBook Power 16 G11 A RTX 2000 Ada Generation Laptop, R7 8845HS, Samsung PM9A1 MZVL22T0HBLB | Dell Precision 5690 RTX 5000 Ada Generation Laptop, Ultra 9 185H, 2x Samsung PM9A1 1TB (RAID 0) | |
|---|---|---|---|---|---|---|
| Noise | 6% | 17% | 17% | 18% | 5% | |
| wyłączone / środowisko * (dB) | 23.9 | 23.5 2% | 22.6 5% | 23.1 3% | 23.5 2% | 23.4 2% |
| Idle Minimum * (dB) | 29.1 | 23.5 19% | 22.6 22% | 23.1 21% | 23.8 18% | 23.6 19% |
| Idle Average * (dB) | 29.1 | 29.2 -0% | 22.6 22% | 23.1 21% | 24.2 17% | 24.9 14% |
| Idle Maximum * (dB) | 29.1 | 29.5 -1% | 22.6 22% | 23.1 21% | 24.2 17% | 30.9 -6% |
| Load Average * (dB) | 41 | 32.7 20% | 37.8 8% | 28.9 30% | 25.4 38% | 40.4 1% |
| Cyberpunk 2077 ultra * (dB) | 52.8 | 43 19% | ||||
| Load Maximum * (dB) | 52.9 | 56.6 -7% | 40.5 23% | 51.4 3% | 45 15% | 51.9 2% |
| Witcher 3 ultra * (dB) | 50.6 | 40.3 | 51.6 | 48.3 |
* ... im mniej tym lepiej
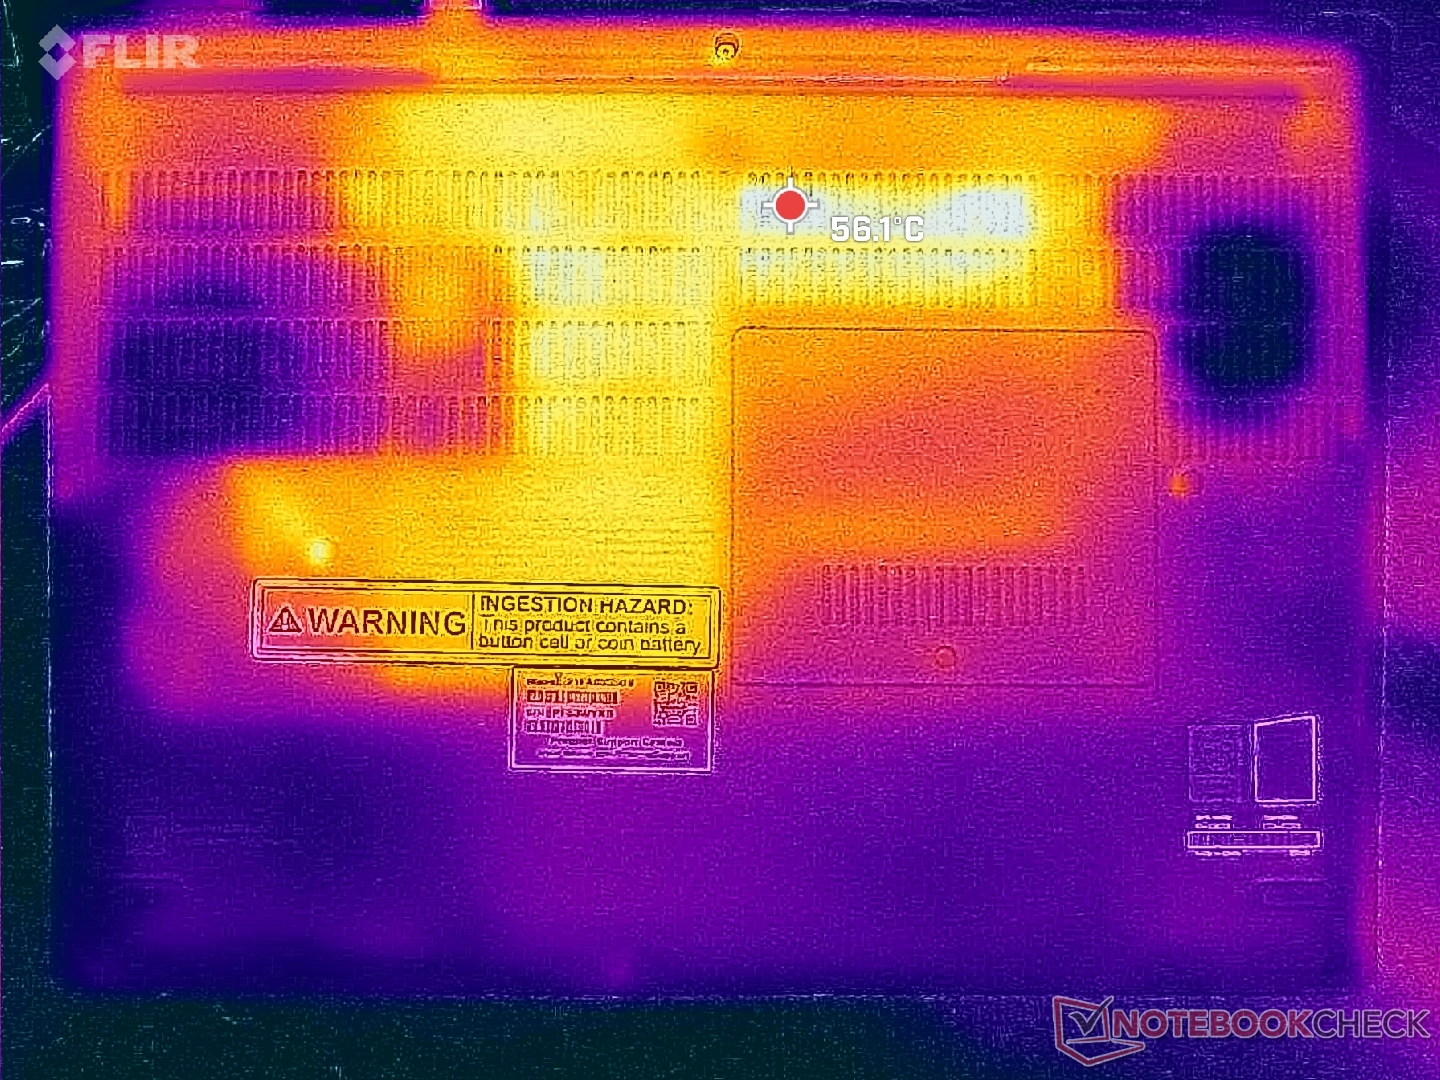
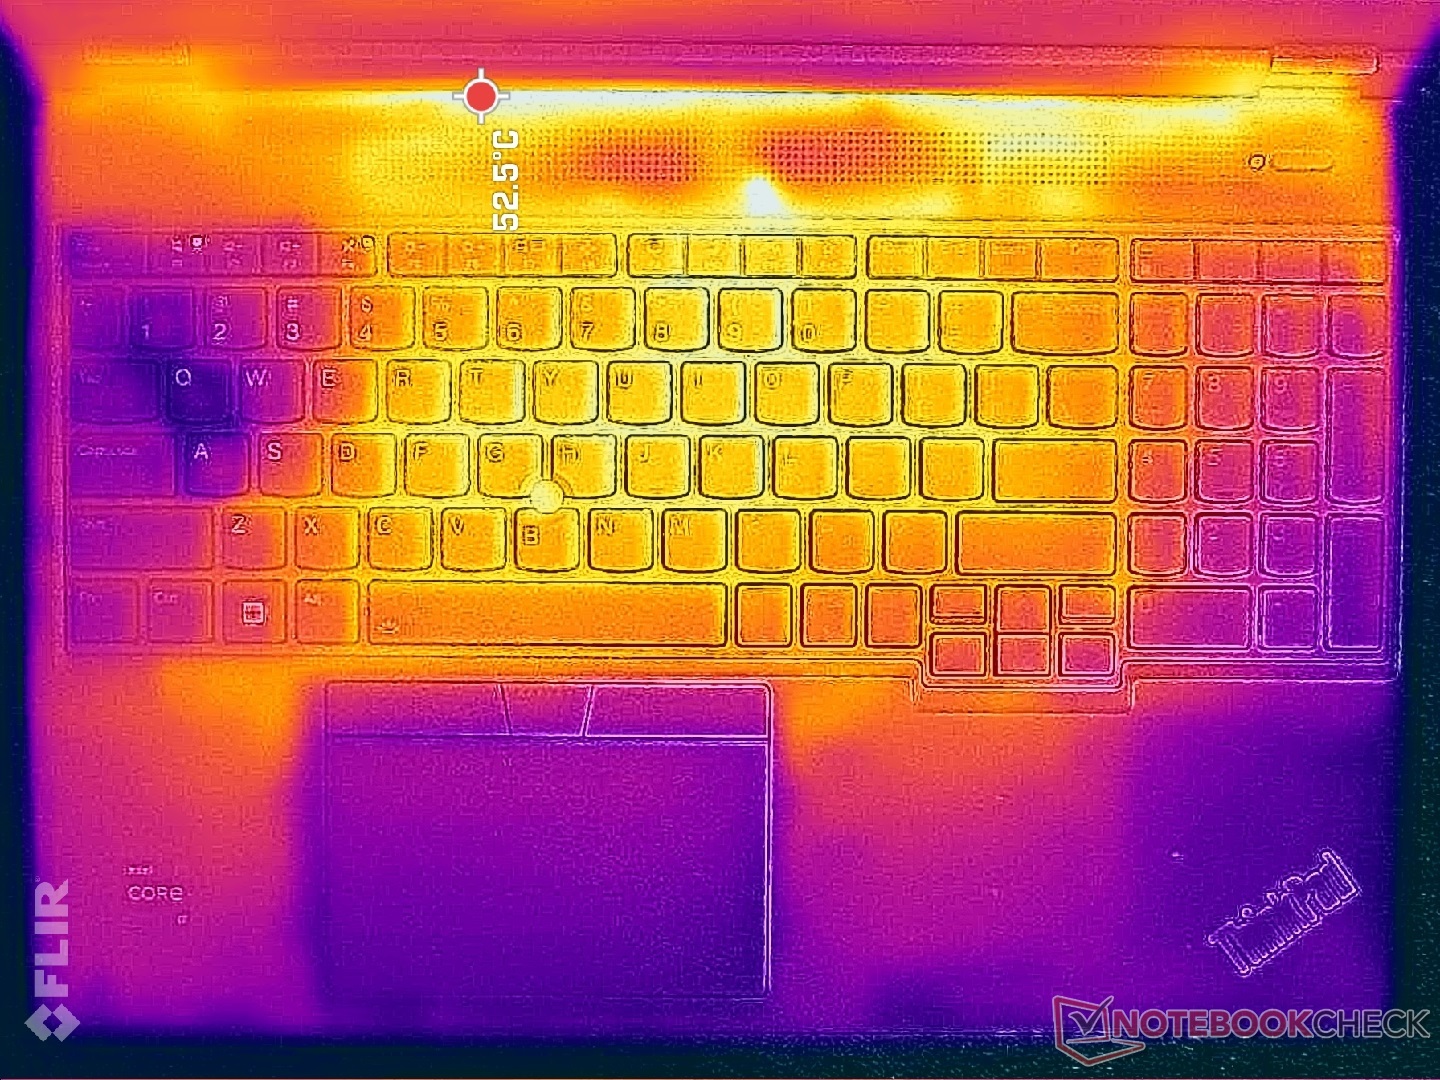
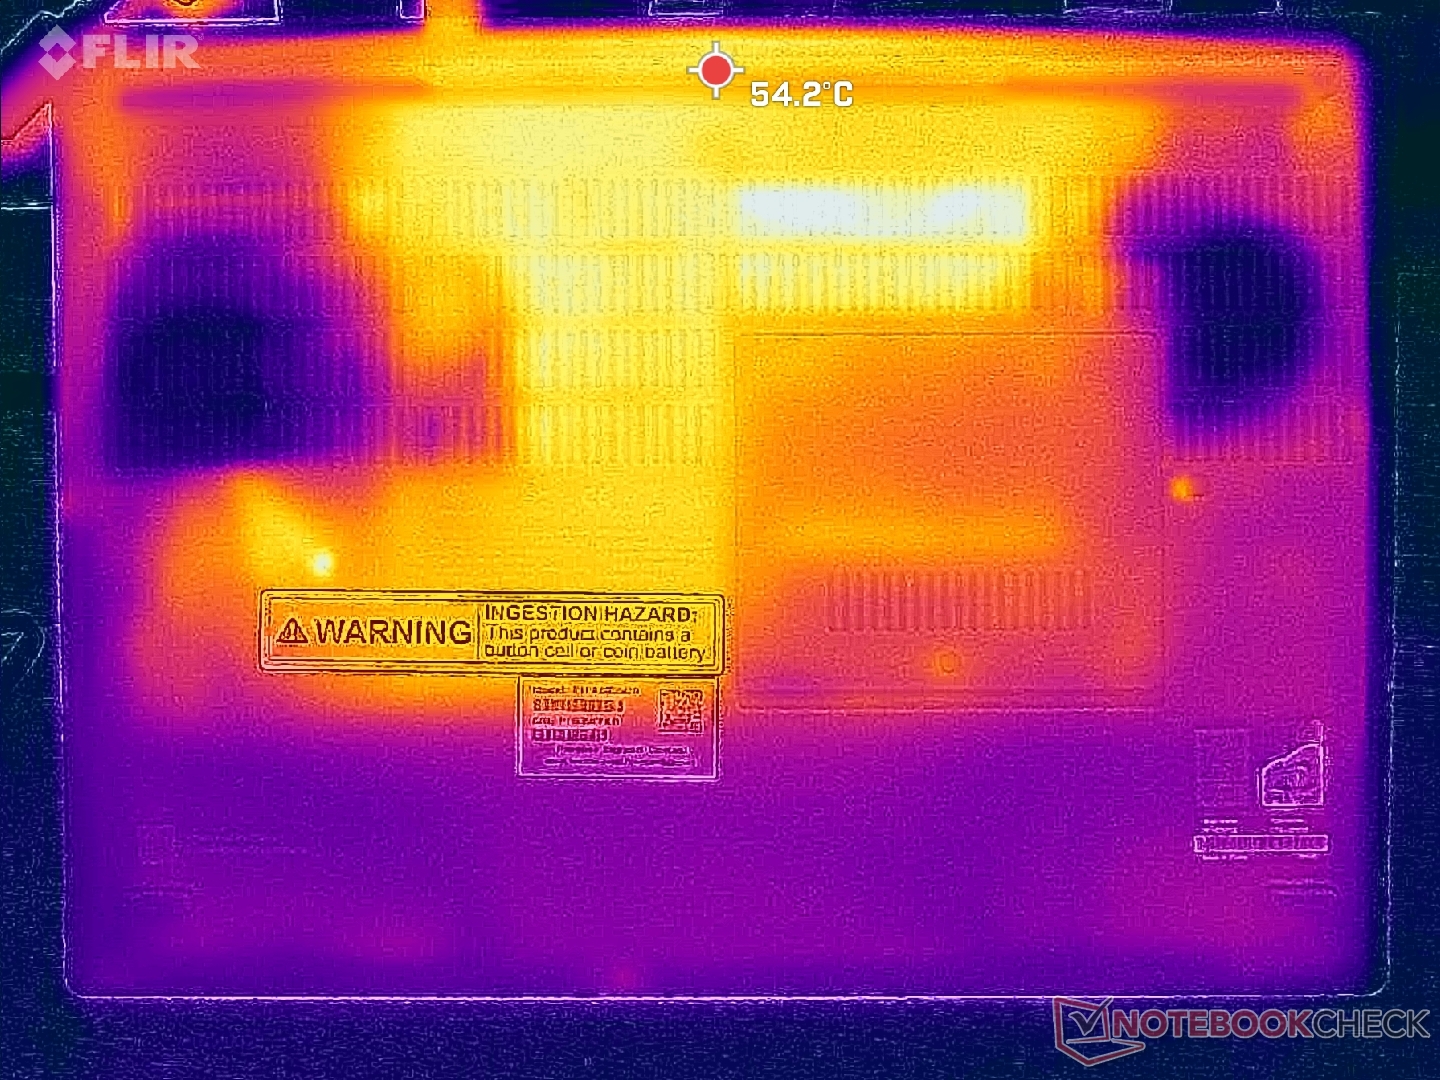
Temperatura
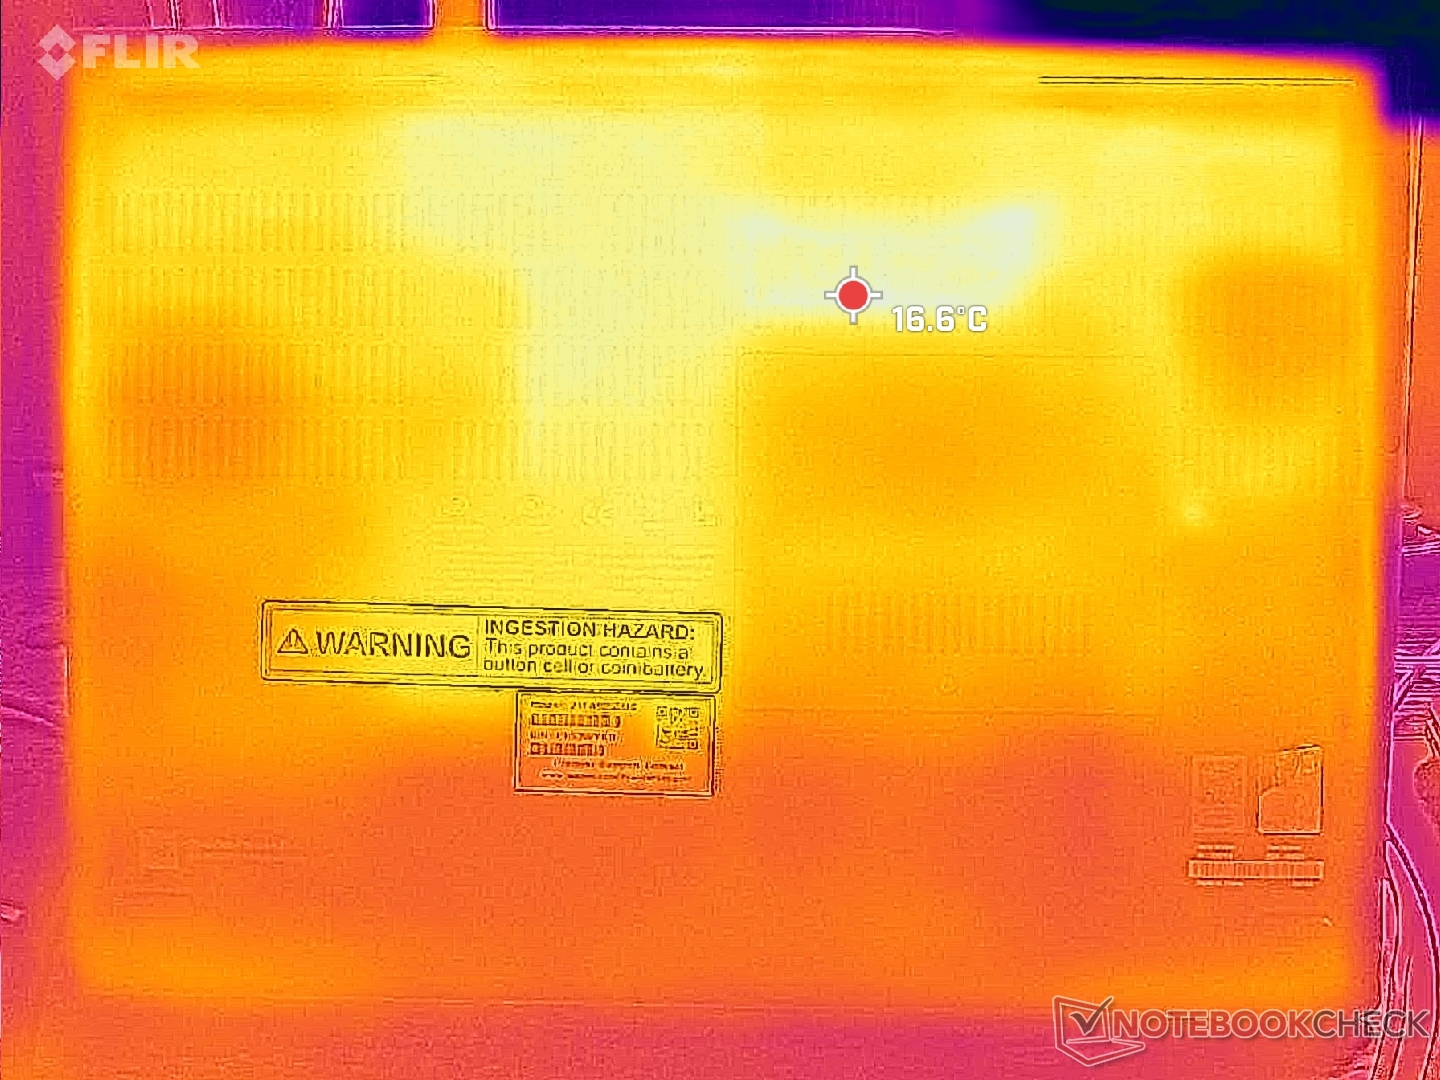
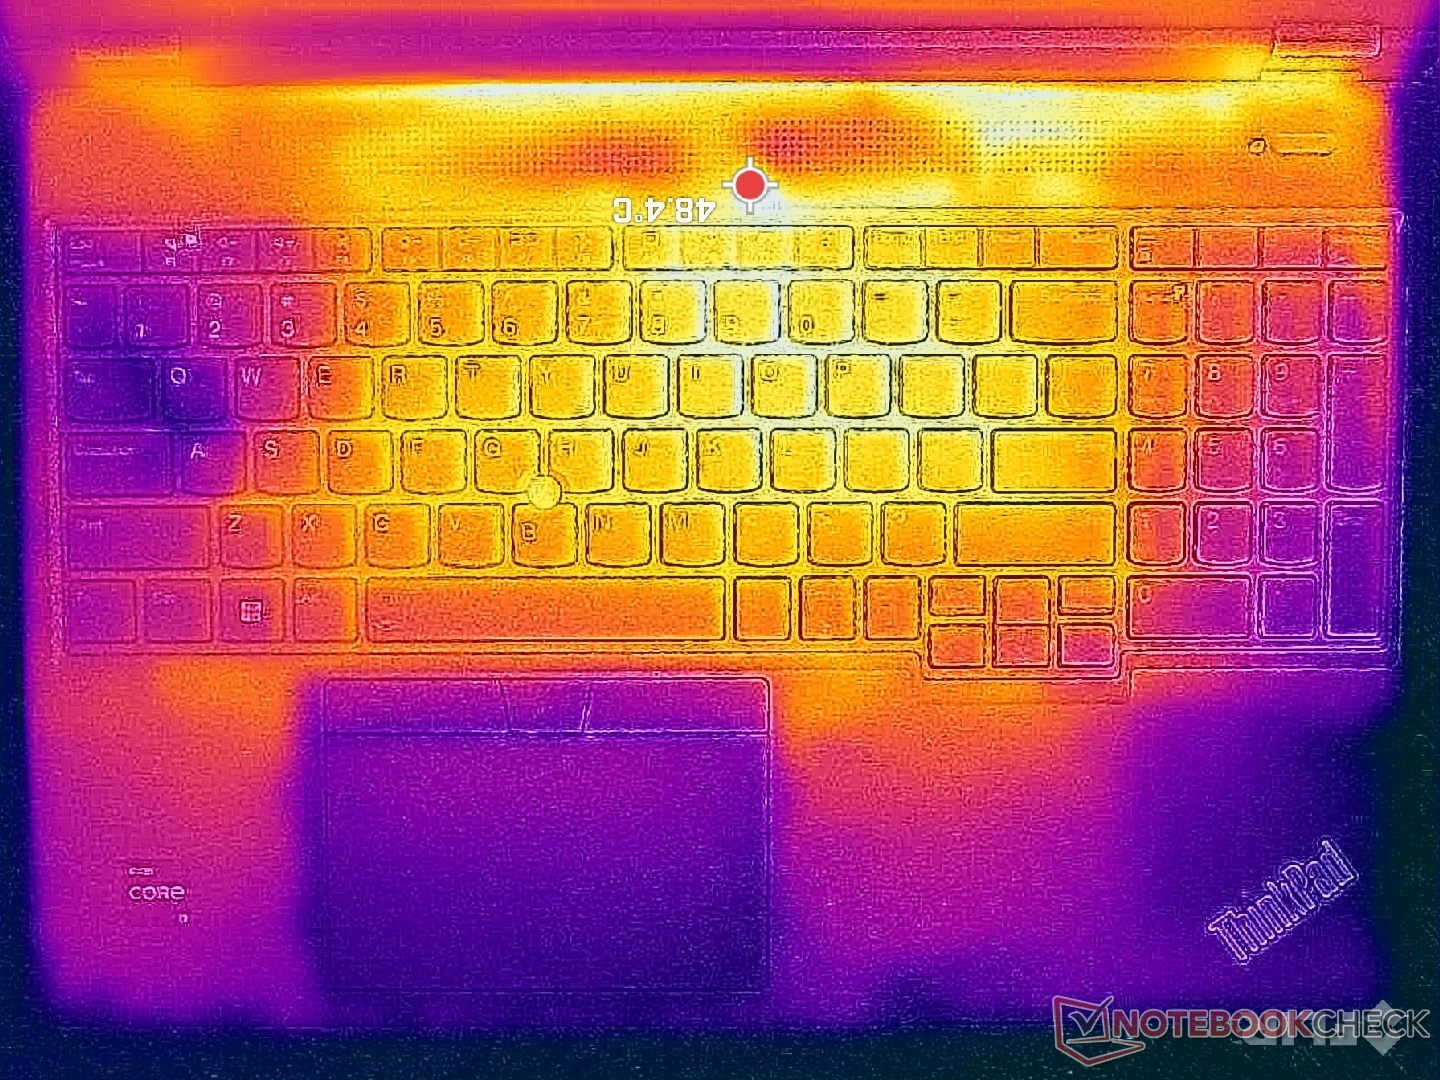
Oczekuje się, że temperatury powierzchni będą wyższe niż w naszej pierwszej jednostce testowej ThinkPad P16 Gen 2 ze względu na bardziej wymagający procesor graficzny RTX 4000 Ada o mocy 130 W, ale różnica jest większa niż oczekiwano. Średnia temperatura na pokrywach C i D może osiągnąć 43 C w porównaniu do zaledwie 32 C na naszej słabiej wyposażonej konfiguracji podczas uruchamiania wymagających obciążeń.
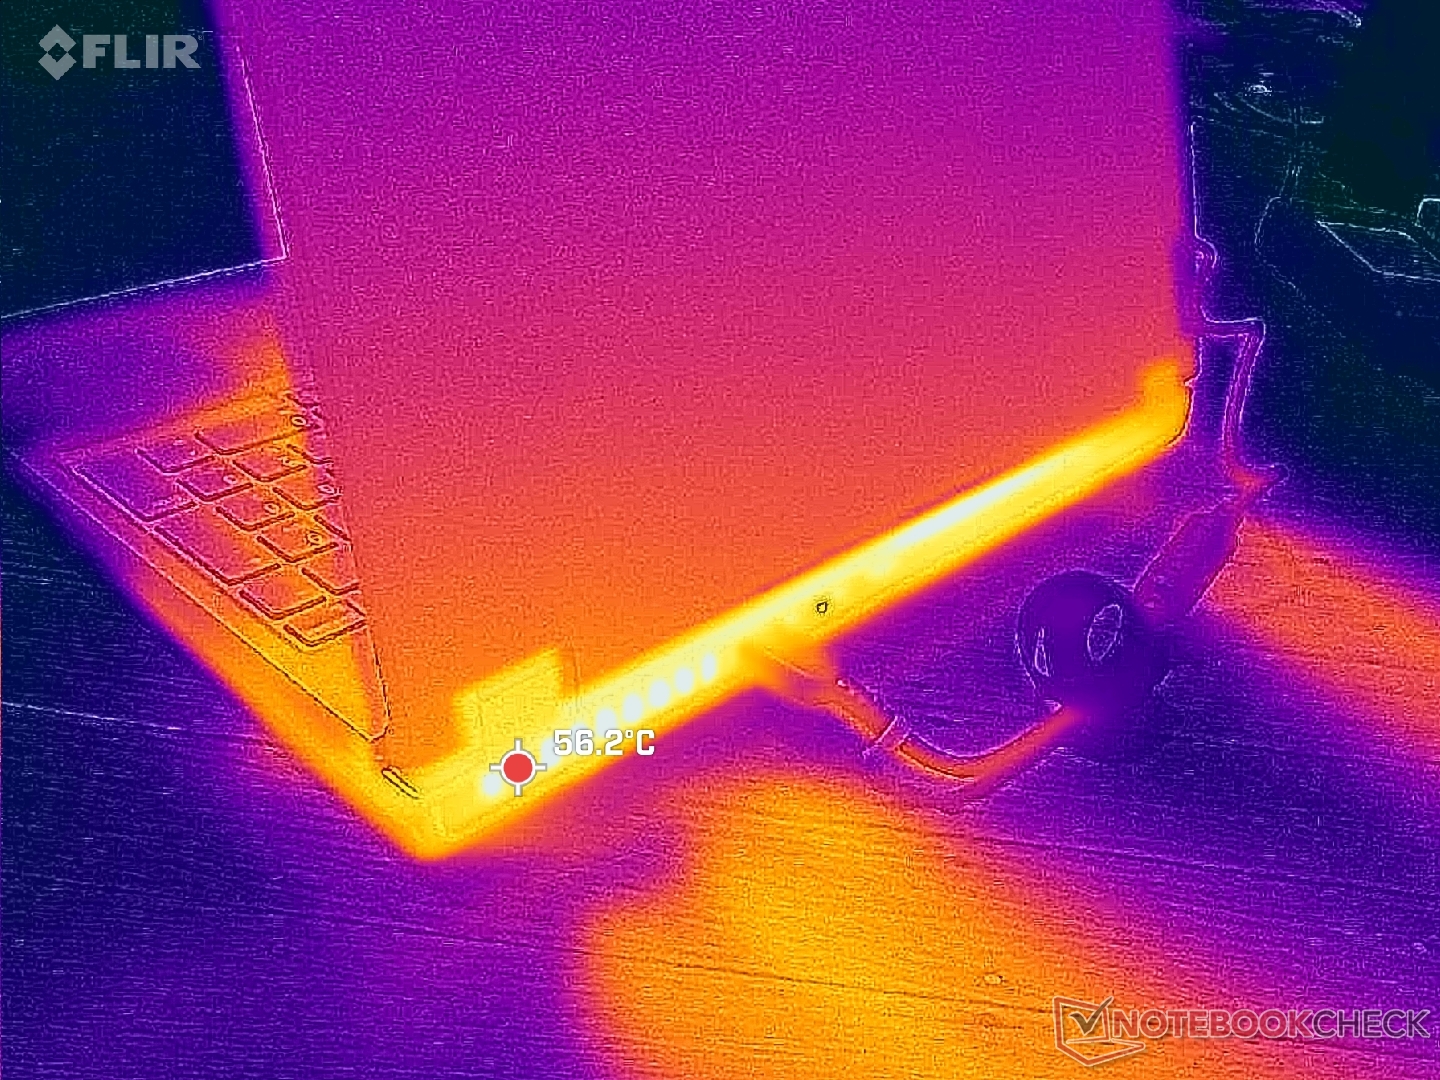
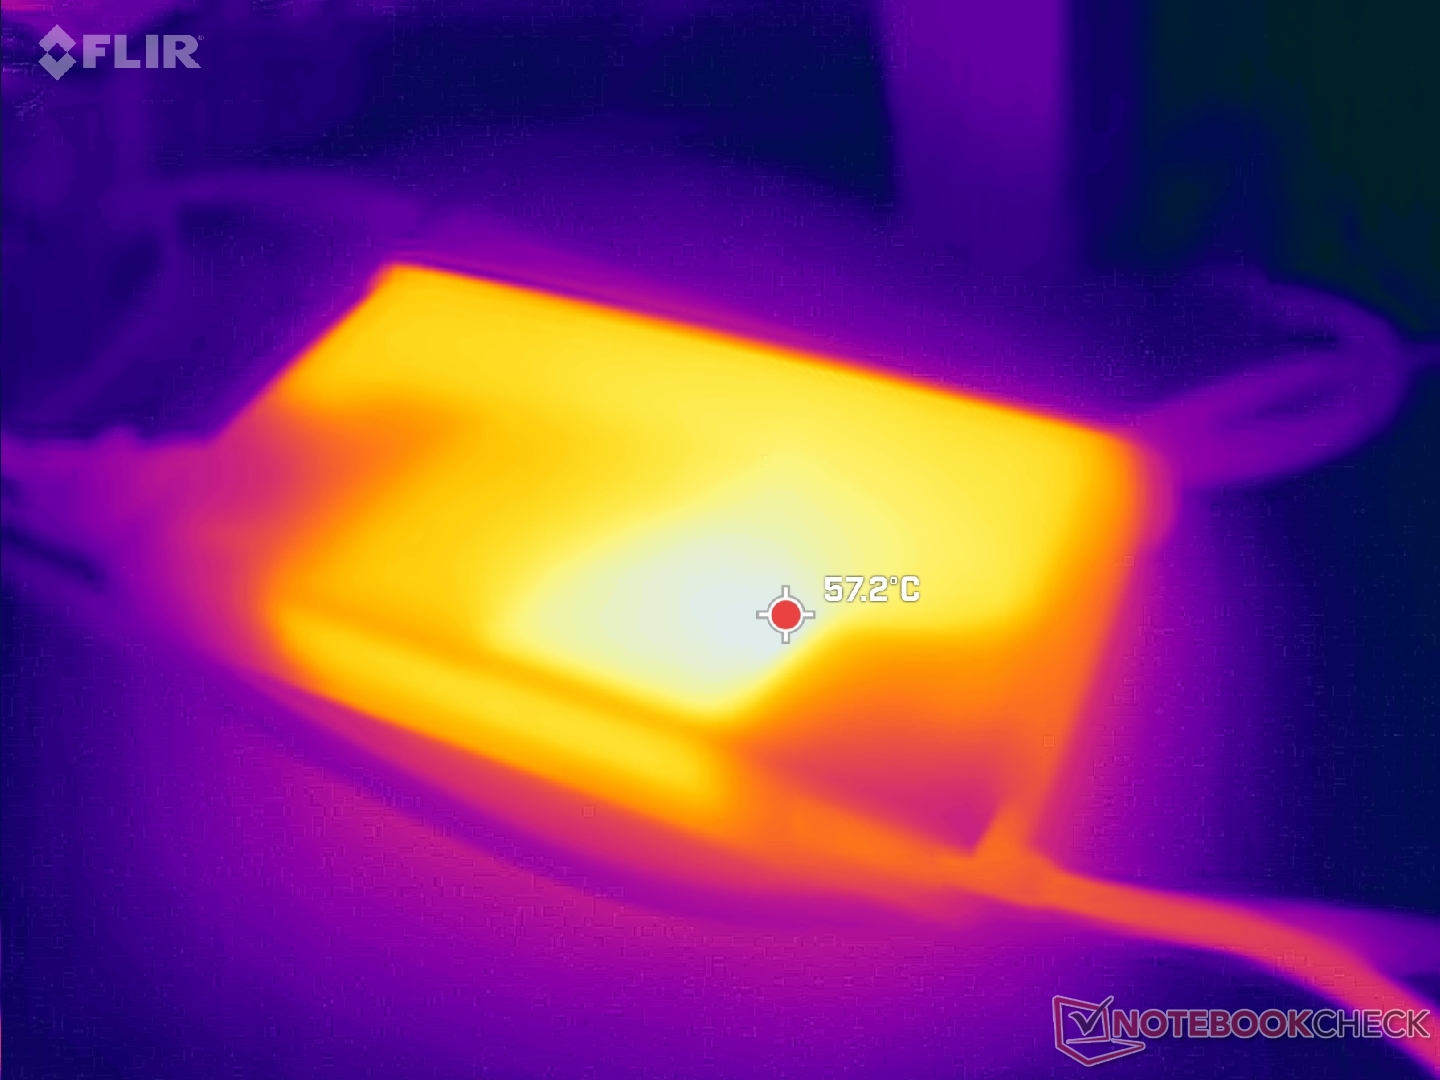
(-) Maksymalna temperatura w górnej części wynosi 46.6 °C / 116 F, w porównaniu do średniej 38.2 °C / 101 F , począwszy od 22.2 do 69.8 °C dla klasy Workstation.
(-) Dno nagrzewa się maksymalnie do 51 °C / 124 F, w porównaniu do średniej 41.1 °C / 106 F
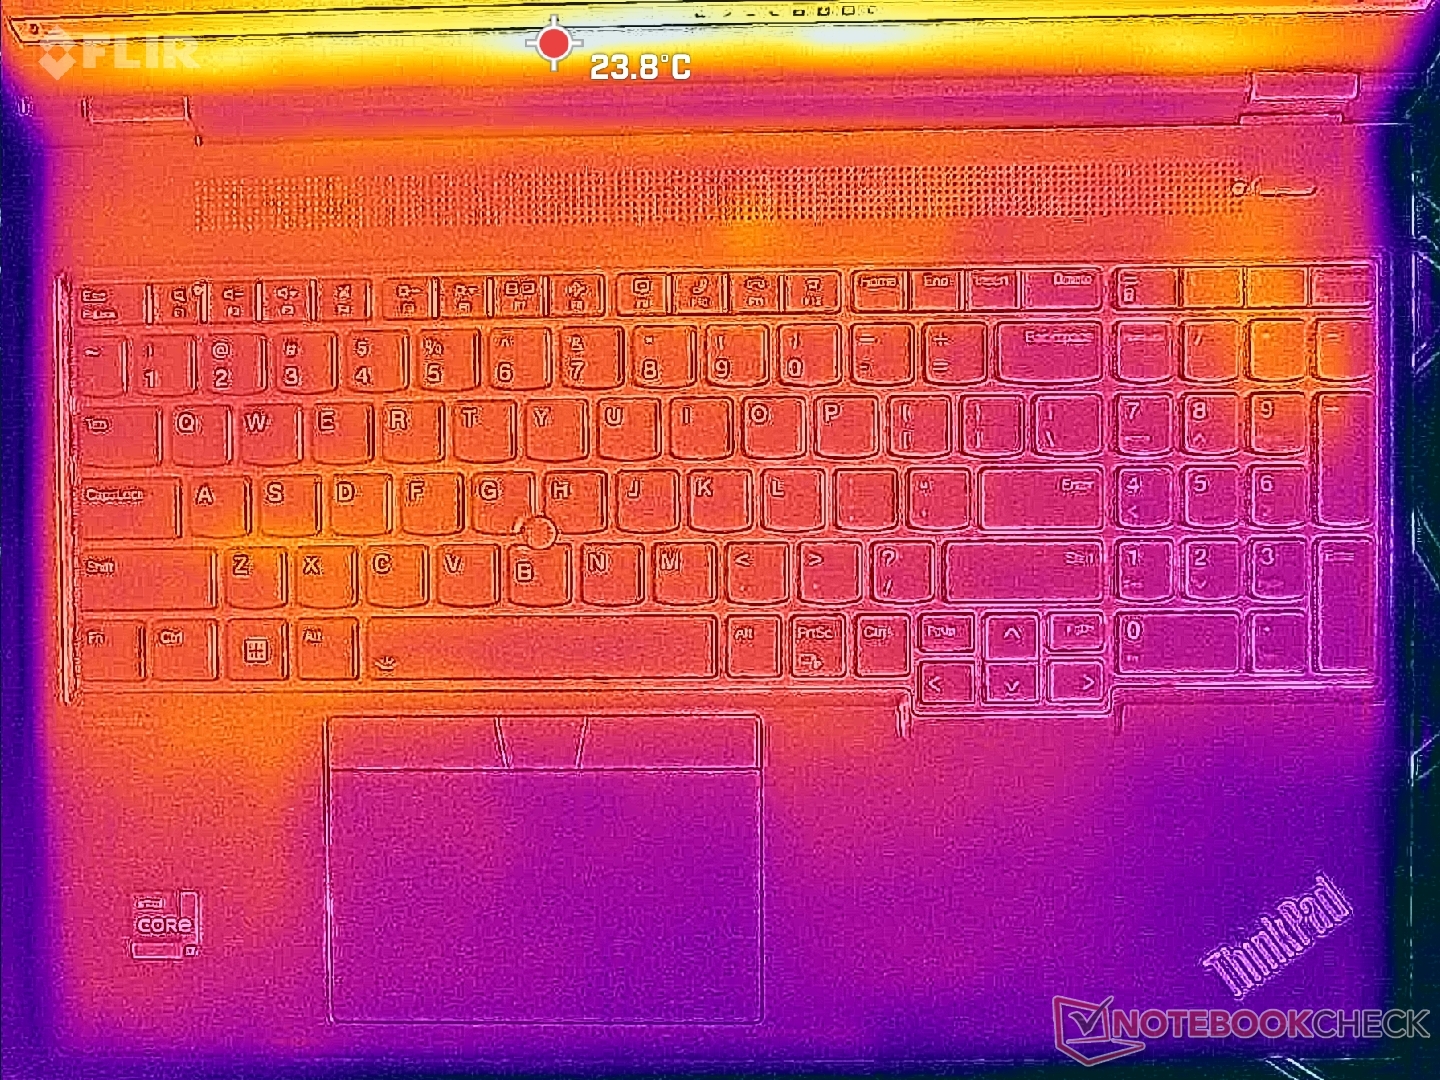
(+) W stanie bezczynności średnia temperatura górnej części wynosi 23.9 °C / 75 F, w porównaniu ze średnią temperaturą urządzenia wynoszącą 32 °C / ### class_avg_f### F.
(-) 3: The average temperature for the upper side is 39.6 °C / 103 F, compared to the average of 32 °C / 90 F for the class Workstation.
(+) Podparcia dłoni i touchpad osiągają maksymalną temperaturę skóry (35.6 °C / 96.1 F) i dlatego nie są gorące.
(-) Średnia temperatura obszaru podparcia dłoni w podobnych urządzeniach wynosiła 27.8 °C / 82 F (-7.8 °C / -14.1 F).
| Lenovo ThinkPad P16 Gen 2 Intel Core i7-14700HX, NVIDIA RTX 4000 Ada Generation Laptop | Lenovo ThinkPad P16 G2 21FA000FGE Intel Core i7-13700HX, NVIDIA RTX 2000 Ada Generation Laptop | Lenovo ThinkPad P16s G2 21K9000CGE AMD Ryzen 7 PRO 7840U, AMD Radeon 780M | Lenovo ThinkPad P16 G1 RTX A5500 Intel Core i9-12950HX, NVIDIA RTX A5500 Laptop GPU | HP ZBook Power 16 G11 A AMD Ryzen 7 8845HS, NVIDIA RTX 2000 Ada Generation Laptop | Dell Precision 5690 Intel Core Ultra 9 185H, NVIDIA RTX 5000 Ada Generation Laptop | |
|---|---|---|---|---|---|---|
| Heat | 3% | -2% | -17% | 6% | -3% | |
| Maximum Upper Side * (°C) | 46.6 | 47.2 -1% | 42.7 8% | 44.8 4% | 40.6 13% | 46.6 -0% |
| Maximum Bottom * (°C) | 51 | 39.5 23% | 47.2 7% | 49.8 2% | 40.6 20% | 33 35% |
| Idle Upper Side * (°C) | 24.8 | 28.1 -13% | 27.8 -12% | 30.6 -23% | 26 -5% | 32.4 -31% |
| Idle Bottom * (°C) | 25.6 | 25.3 1% | 28.4 -11% | 38.6 -51% | 26.6 -4% | 29.4 -15% |
* ... im mniej tym lepiej
Głośniki
Lenovo ThinkPad P16 Gen 2 analiza dźwięku
(±) | głośność głośnika jest średnia, ale dobra (80.7 dB)
Bas 100 - 315 Hz
(±) | zredukowany bas - średnio 10.8% niższy od mediany
(±) | liniowość basu jest średnia (8% delta do poprzedniej częstotliwości)
Średnie 400 - 2000 Hz
(±) | wyższe średnie - średnio 5.4% wyższe niż mediana
(+) | średnie są liniowe (6.2% delta do poprzedniej częstotliwości)
Wysokie 2–16 kHz
(+) | zrównoważone maksima - tylko 3.3% od mediany
(+) | wzloty są liniowe (5.5% delta do poprzedniej częstotliwości)
Ogólnie 100 - 16.000 Hz
(±) | liniowość ogólnego dźwięku jest średnia (15.6% różnicy w stosunku do mediany)
W porównaniu do tej samej klasy
» 35% wszystkich testowanych urządzeń w tej klasie było lepszych, 11% podobnych, 54% gorszych
» Najlepszy miał deltę 7%, średnia wynosiła ###średnia###%, najgorsza wynosiła 35%
W porównaniu do wszystkich testowanych urządzeń
» 23% wszystkich testowanych urządzeń było lepszych, 5% podobnych, 72% gorszych
» Najlepszy miał deltę 4%, średnia wynosiła ###średnia###%, najgorsza wynosiła 134%
Apple MacBook Pro 16 2021 M1 Pro analiza dźwięku
(+) | głośniki mogą odtwarzać stosunkowo głośno (84.7 dB)
Bas 100 - 315 Hz
(+) | dobry bas - tylko 3.8% od mediany
(+) | bas jest liniowy (5.2% delta do poprzedniej częstotliwości)
Średnie 400 - 2000 Hz
(+) | zbalansowane środki średnie - tylko 1.3% od mediany
(+) | średnie są liniowe (2.1% delta do poprzedniej częstotliwości)
Wysokie 2–16 kHz
(+) | zrównoważone maksima - tylko 1.9% od mediany
(+) | wzloty są liniowe (2.7% delta do poprzedniej częstotliwości)
Ogólnie 100 - 16.000 Hz
(+) | ogólny dźwięk jest liniowy (4.6% różnicy w stosunku do mediany)
W porównaniu do tej samej klasy
» 0% wszystkich testowanych urządzeń w tej klasie było lepszych, 0% podobnych, 100% gorszych
» Najlepszy miał deltę 5%, średnia wynosiła ###średnia###%, najgorsza wynosiła 45%
W porównaniu do wszystkich testowanych urządzeń
» 0% wszystkich testowanych urządzeń było lepszych, 0% podobnych, 100% gorszych
» Najlepszy miał deltę 4%, średnia wynosiła ###średnia###%, najgorsza wynosiła 134%
Zarządzanie energią
Zużycie energii
Praca na biegu jałowym na komputerze stacjonarnym może wymagać nawet 25 W w porównaniu do zaledwie 16 W na słabiej wyposażonej konfiguracji RTX 2000. Podczas uruchamiania wymagających obciążeń, takich jak gry, różnica może wynosić nawet 80 W, co oznacza 55-procentowy wzrost zużycia energii. Proszę upewnić się, że korzystasz z bardziej wydajnego zasilacza 230 W, aby w pełni wykorzystać możliwości konfiguracji RTX 4000.
| wyłączony / stan wstrzymania | |
| luz | |
| obciążenie |
|
Legenda:
min: | |
| Lenovo ThinkPad P16 Gen 2 i7-14700HX, RTX 4000 Ada Generation Laptop, SK hynix PC801 HFS001TEJ9X162N, IPS, 2560x1600, 16" | Lenovo ThinkPad P16 G2 21FA000FGE i7-13700HX, RTX 2000 Ada Generation Laptop, SK hynix PC801 HFS001TEJ9X162N, IPS LED, 2560x1600, 16" | Lenovo ThinkPad P16s G2 21K9000CGE R7 PRO 7840U, Radeon 780M, SK hynix PC801 HFS001TEJ9X162N, OLED, 3840x2400, 16" | Lenovo ThinkPad P16 G1 RTX A5500 i9-12950HX, RTX A5500 Laptop GPU, WDC PC SN810 2TB, IPS, 3840x2400, 16" | HP ZBook Power 16 G11 A R7 8845HS, RTX 2000 Ada Generation Laptop, Samsung PM9A1 MZVL22T0HBLB, IPS, 2560x1600, 16" | Dell Precision 5690 Ultra 9 185H, RTX 5000 Ada Generation Laptop, 2x Samsung PM9A1 1TB (RAID 0), OLED, 3840x2400, 16" | |
|---|---|---|---|---|---|---|
| Power Consumption | 7% | 55% | -27% | 47% | 8% | |
| Idle Minimum * (Watt) | 7.9 | 9.3 -18% | 6.1 23% | 7.5 5% | 4.6 42% | 7.9 -0% |
| Idle Average * (Watt) | 13.1 | 14.1 -8% | 6.5 50% | 20.1 -53% | 10 24% | 12 8% |
| Idle Maximum * (Watt) | 24.2 | 15.5 36% | 7 71% | 40 -65% | 10.6 56% | 28.6 -18% |
| Load Average * (Watt) | 127.4 | 133.6 -5% | 56.6 56% | 137 -8% | 60.9 52% | 98.8 22% |
| Cyberpunk 2077 ultra external monitor * (Watt) | 219 | 92.8 58% | ||||
| Cyberpunk 2077 ultra * (Watt) | 225 | 96.8 57% | ||||
| Load Maximum * (Watt) | 248.5 | 179.6 28% | 68.3 73% | 285.9 -15% | 154.8 38% | 174.8 30% |
| Witcher 3 ultra * (Watt) | 144.9 | 61.2 | 208 | 144.5 |
* ... im mniej tym lepiej
Power Consumption Cyberpunk / Stress Test
Power Consumption external Monitor
Żywotność baterii
Czas pracy jest o ponad połowę krótszy od tego, który odnotowaliśmy na słabszej konfiguracji ThinkPad P16 Gen 2, nawet przy ustawieniu trybu zrównoważonego i jasności 150 nitów. Różnicę tę można głównie przypisać brakowi obsługi Advanced Optimus w naszej jednostce RTX 4000 Ada, przez co dyskretny procesor graficzny nigdy nie jest w pełni wyłączony.
Ładowanie od stanu pustego do pełnej pojemności zajmuje około 130 minut, nawet przy włączonym Lenovo Quick Charge.
| Lenovo ThinkPad P16 Gen 2 i7-14700HX, RTX 4000 Ada Generation Laptop, 94 Wh | Lenovo ThinkPad P16 G2 21FA000FGE i7-13700HX, RTX 2000 Ada Generation Laptop, 94 Wh | Lenovo ThinkPad P16s G2 21K9000CGE R7 PRO 7840U, Radeon 780M, 84 Wh | Lenovo ThinkPad P16 G1 RTX A5500 i9-12950HX, RTX A5500 Laptop GPU, 94 Wh | HP ZBook Power 16 G11 A R7 8845HS, RTX 2000 Ada Generation Laptop, 83 Wh | Dell Precision 5690 Ultra 9 185H, RTX 5000 Ada Generation Laptop, 98 Wh | |
|---|---|---|---|---|---|---|
| Czasy pracy | 244% | 324% | 132% | 288% | 268% | |
| WiFi v1.3 (h) | 2.5 | 8.6 244% | 10.6 324% | 5.8 132% | 9.7 288% | 9.2 268% |
| H.264 (h) | 13.3 | |||||
| Load (h) | 1.5 | 1.7 | ||||
| Reader / Idle (h) | 26.1 |
Lenovo ThinkPad P16 Gen 2
- 25/10/2024 v8
Allen Ngo
 Total Sustainability Score:
 Przezroczystość
Wyboru urządzeń do recenzji dokonuje nasza redakcja. Próbka testowa została udostępniona autorowi jako pożyczka od producenta lub sprzedawcy detalicznego na potrzeby tej recenzji. Pożyczkodawca nie miał wpływu na tę recenzję, producent nie otrzymał też kopii tej recenzji przed publikacją. Nie było obowiązku publikowania tej recenzji. Jako niezależna firma medialna, Notebookcheck nie podlega władzy producentów, sprzedawców detalicznych ani wydawców.
Tak testuje Notebookcheck
Każdego roku Notebookcheck niezależnie sprawdza setki laptopów i smartfonów, stosując standardowe procedury, aby zapewnić porównywalność wszystkich wyników. Od około 20 lat stale rozwijamy nasze metody badawcze, ustanawiając przy tym standardy branżowe. W naszych laboratoriach testowych doświadczeni technicy i redaktorzy korzystają z wysokiej jakości sprzętu pomiarowego. Testy te obejmują wieloetapowy proces walidacji. Nasz kompleksowy system ocen opiera się na setkach uzasadnionych pomiarów i benchmarków, co pozwala zachować obiektywizm.
