

Recenzja Lenovo IdeaPad Pro 5 16IMH G9: 90 W GeForce RTX 4050 prawie tak dobry jak RTX 4060

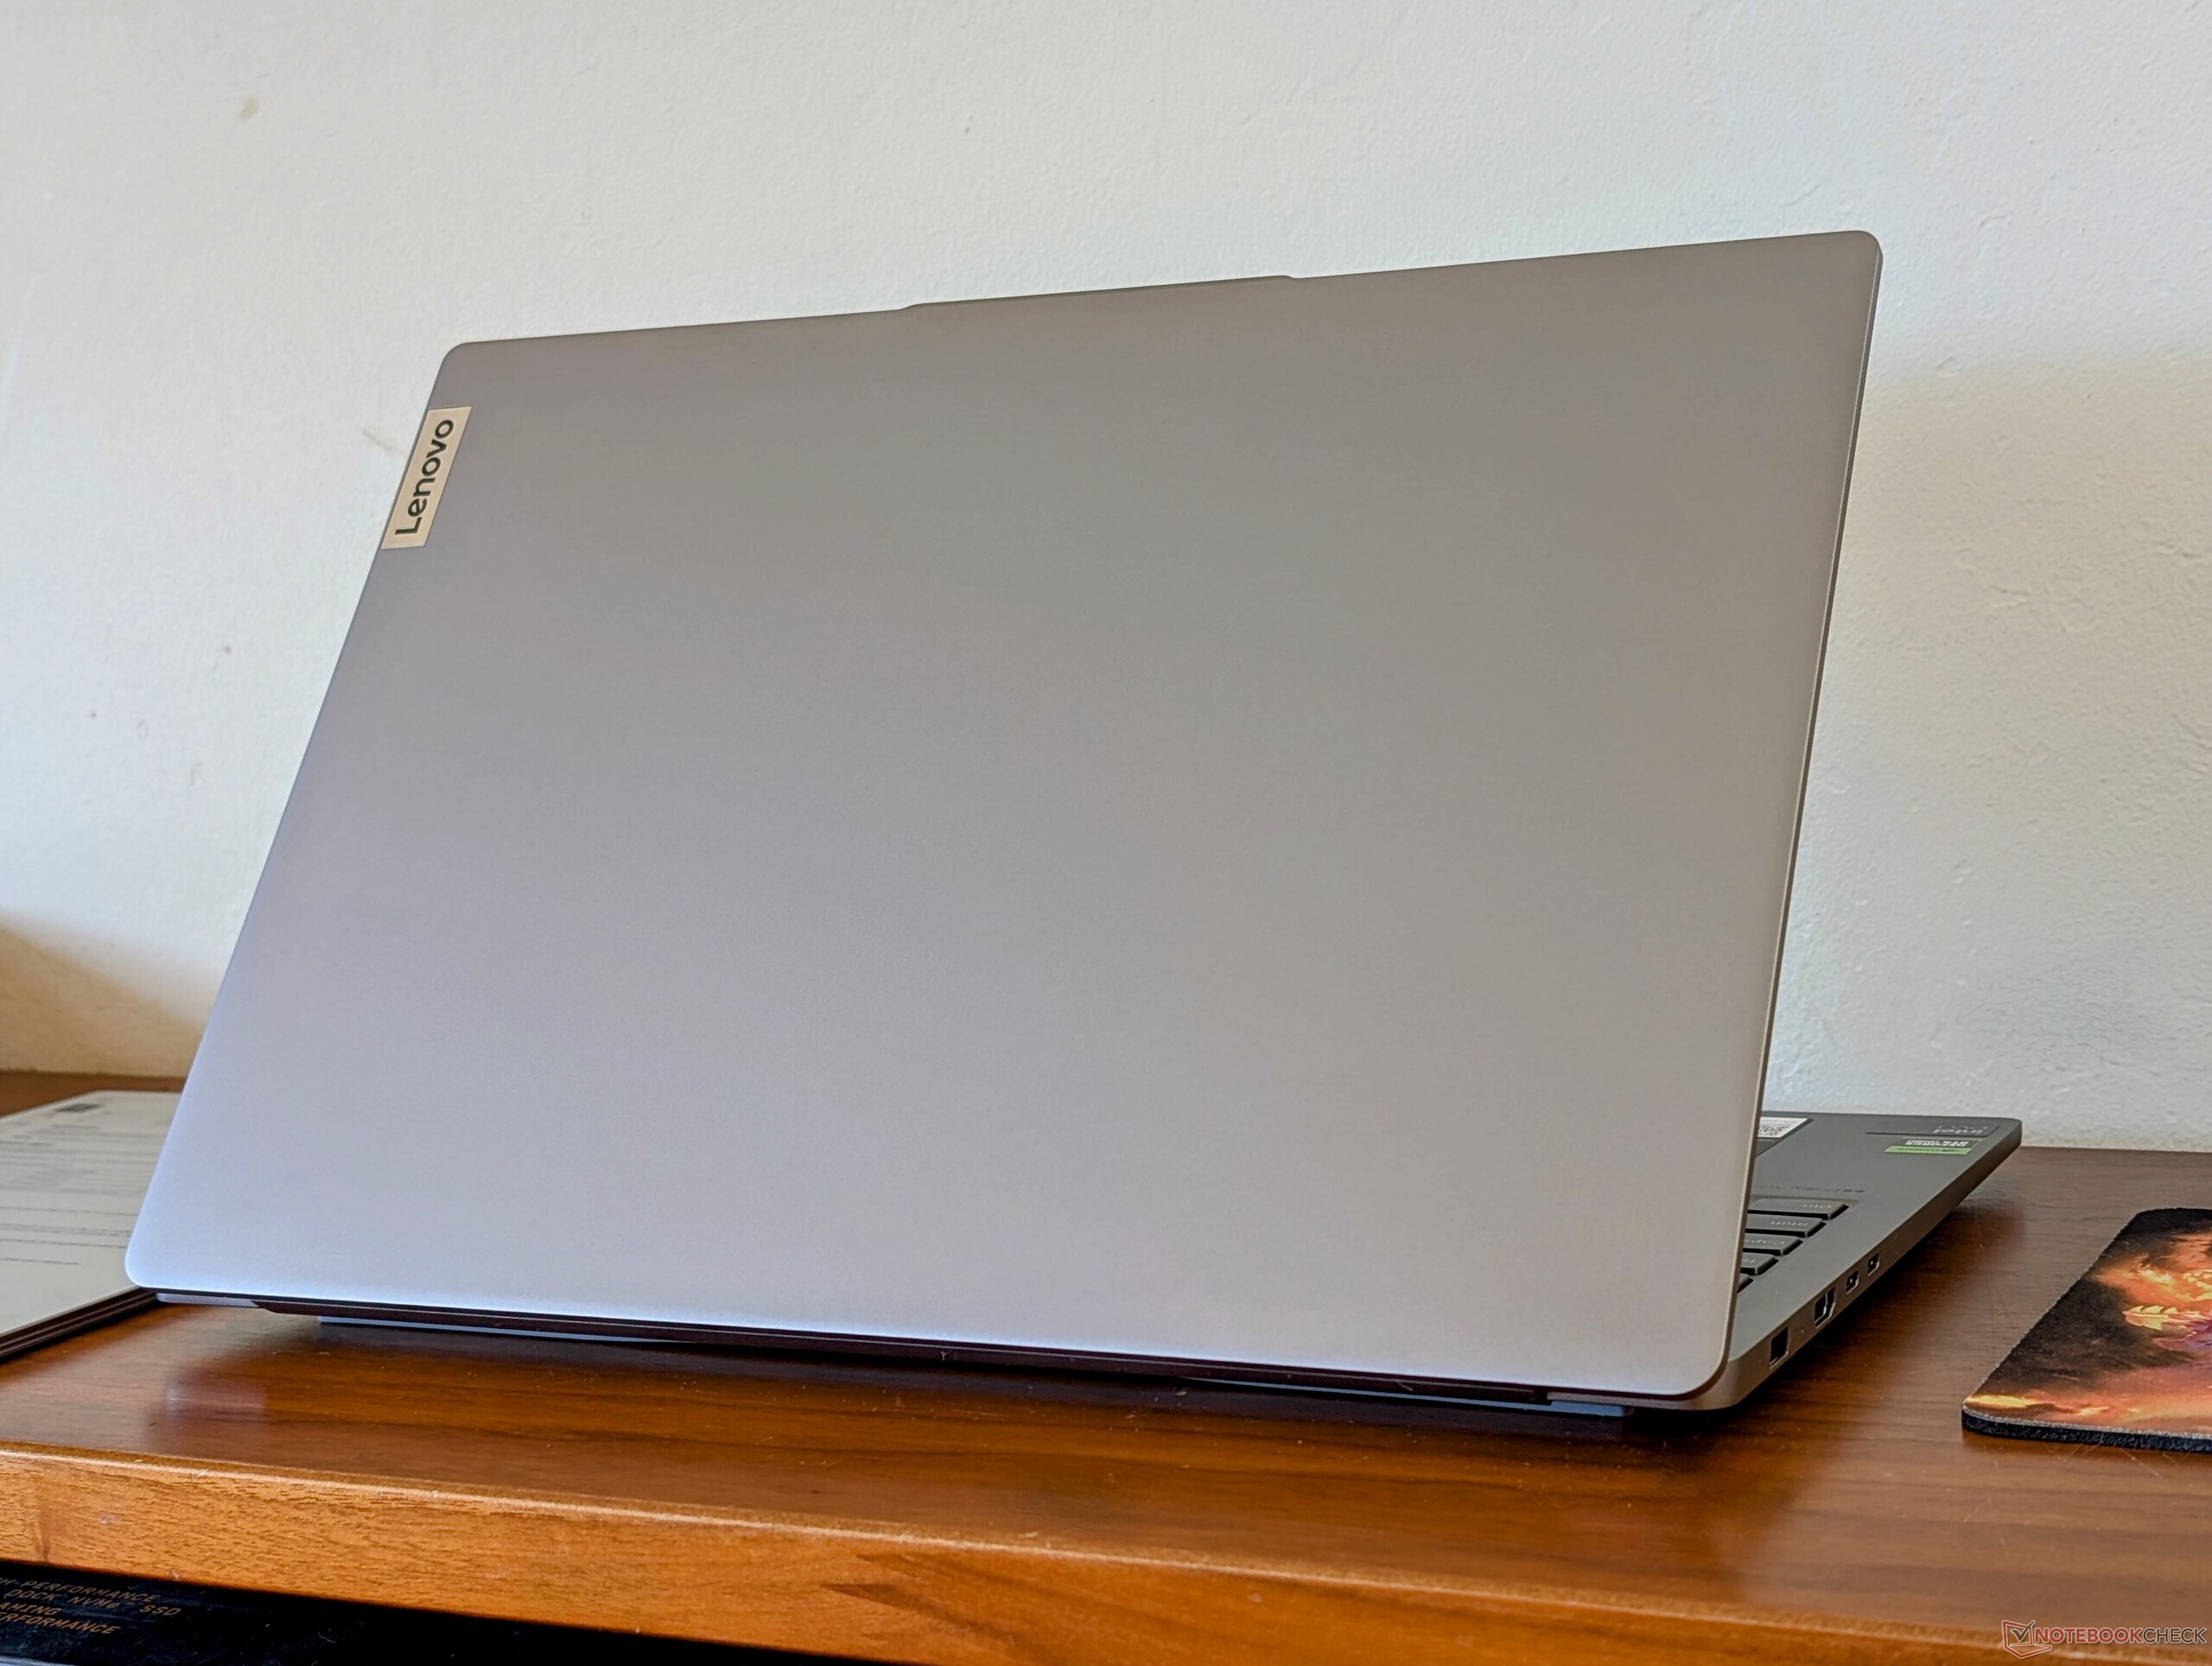
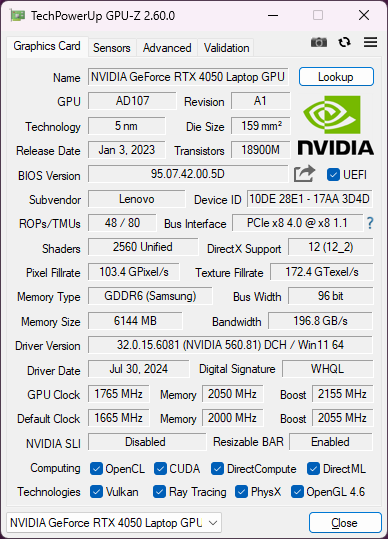
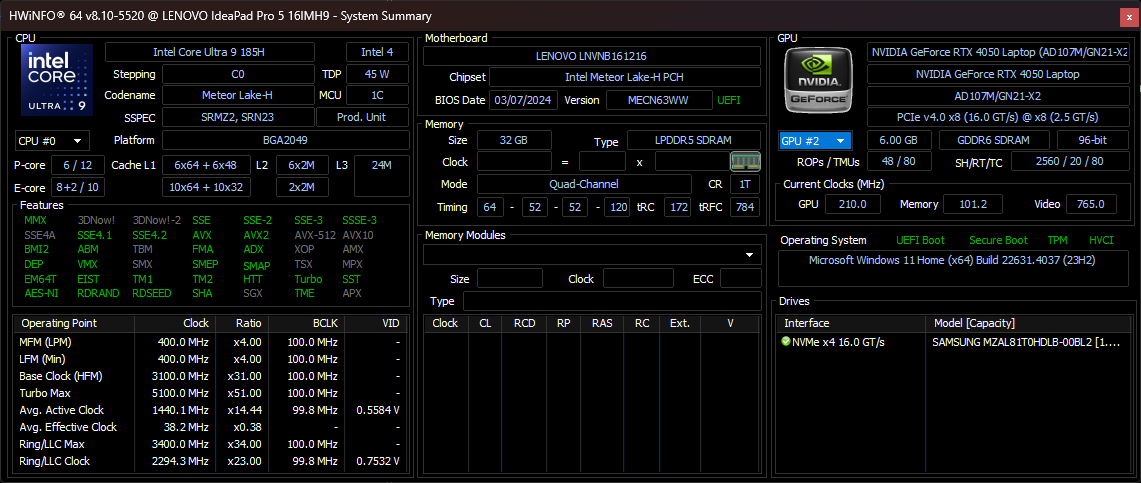
Po niedawnej recenzji tańszego IdeaPad Pro 5 16IMH iGPU i IPS, jesteśmy teraz gotowi do sprawdzenia droższej konfiguracji dGPU i OLED. Nasza konkretna jednostka testowa jest wyposażona w opcje z najwyższej półki, w tym Meteor Lake Core Ultra 9 185H za 1500 USD w sprzedaży detalicznej. Jest to również jeden z niewielu ultracienkich laptopów multimedialnych z 90 W GeForce RTX 4050, ponieważ większość innych w tej kategorii zazwyczaj celuje w niższe pułapy TGP.
IdeaPad Pro 5 16 G9 różni się od flagowego modelu Yoga Pro 9i 16 G9. Ten ostatni oferuje na przykład opcje mini-LED i RTX 4070, które są niedostępne w IdeaPad.
Alternatywy dla IdeaPad Pro 5 16IMH obejmują inne 16-calowe laptopy multimedialne ze średniej i wyższej półki, takie jak Dell Inspiron 16 7640 2-w-1, Asus Zenbook S16, Samsung Galaxy Book4 Ultralub Seria HP Envy. Zalecamy zapoznanie się z naszą istniejącą recenzją iGPU IdeaPad Pro 5 16IMH G9, aby dowiedzieć się więcej o fizycznych cechach tego modelu. Mniejsza, 14-calowa wersja tego modelu jest również dostępna pod nazwą IdeaPad Pro 5 14 G9.
Więcej recenzji Lenovo:
Potencjalni konkurenci w porównaniu
Ocena | Wersja | Data | Model | Waga | Wysokość | Rozmiar | Rezolucja | Cena |
|---|---|---|---|---|---|---|---|---|
| 84.7 % | v8 | 09/2024 | Lenovo IdeaPad Pro 5 16IMH G9 RTX 4050 Ultra 9 185H, NVIDIA GeForce RTX 4050 Laptop GPU | 2 kg | 18.95 mm | 16.00" | 2048x1280 | |
| 87.9 % v7 (old) | v7 (old) | 05/2024 | Lenovo IdeaPad Pro 5 16IMH G9 Ultra 7 155H, Arc 8-Core | 1.9 kg | 17.5 mm | 16.00" | 2560x1600 | |
| 82.1 % | v8 | 07/2024 | Dell Inspiron 16 7640 2-in-1 Ultra 7 155H, Arc 8-Core | 2.1 kg | 18.99 mm | 16.00" | 2560x1600 | |
| 84.7 % | v8 | 07/2024 | Asus Zenbook S 16 UM5606-RK333W Ryzen AI 9 HX 370, Radeon 890M | 1.5 kg | 12.9 mm | 16.00" | 2880x1800 | |
| 87.2 % v7 (old) | v7 (old) | 05/2024 | HP Envy x360 2-in-1 16-ad0097nr R7 8840HS, Radeon 780M | 1.8 kg | 18.3 mm | 16.00" | 2880x1800 | |
| 90.4 % v7 (old) | v7 (old) | 03/2024 | Samsung Galaxy Book4 Ultra Ultra 7 155H, NVIDIA GeForce RTX 4050 Laptop GPU | 1.8 kg | 17 mm | 16.00" | 2880x1800 |
Uwaga: Niedawno zaktualizowaliśmy nasz system oceny i wyniki wersji 8 nie są porównywalne z wynikami wersji 7. Więcej informacji znajdą Państwo tutaj .
Sprawa
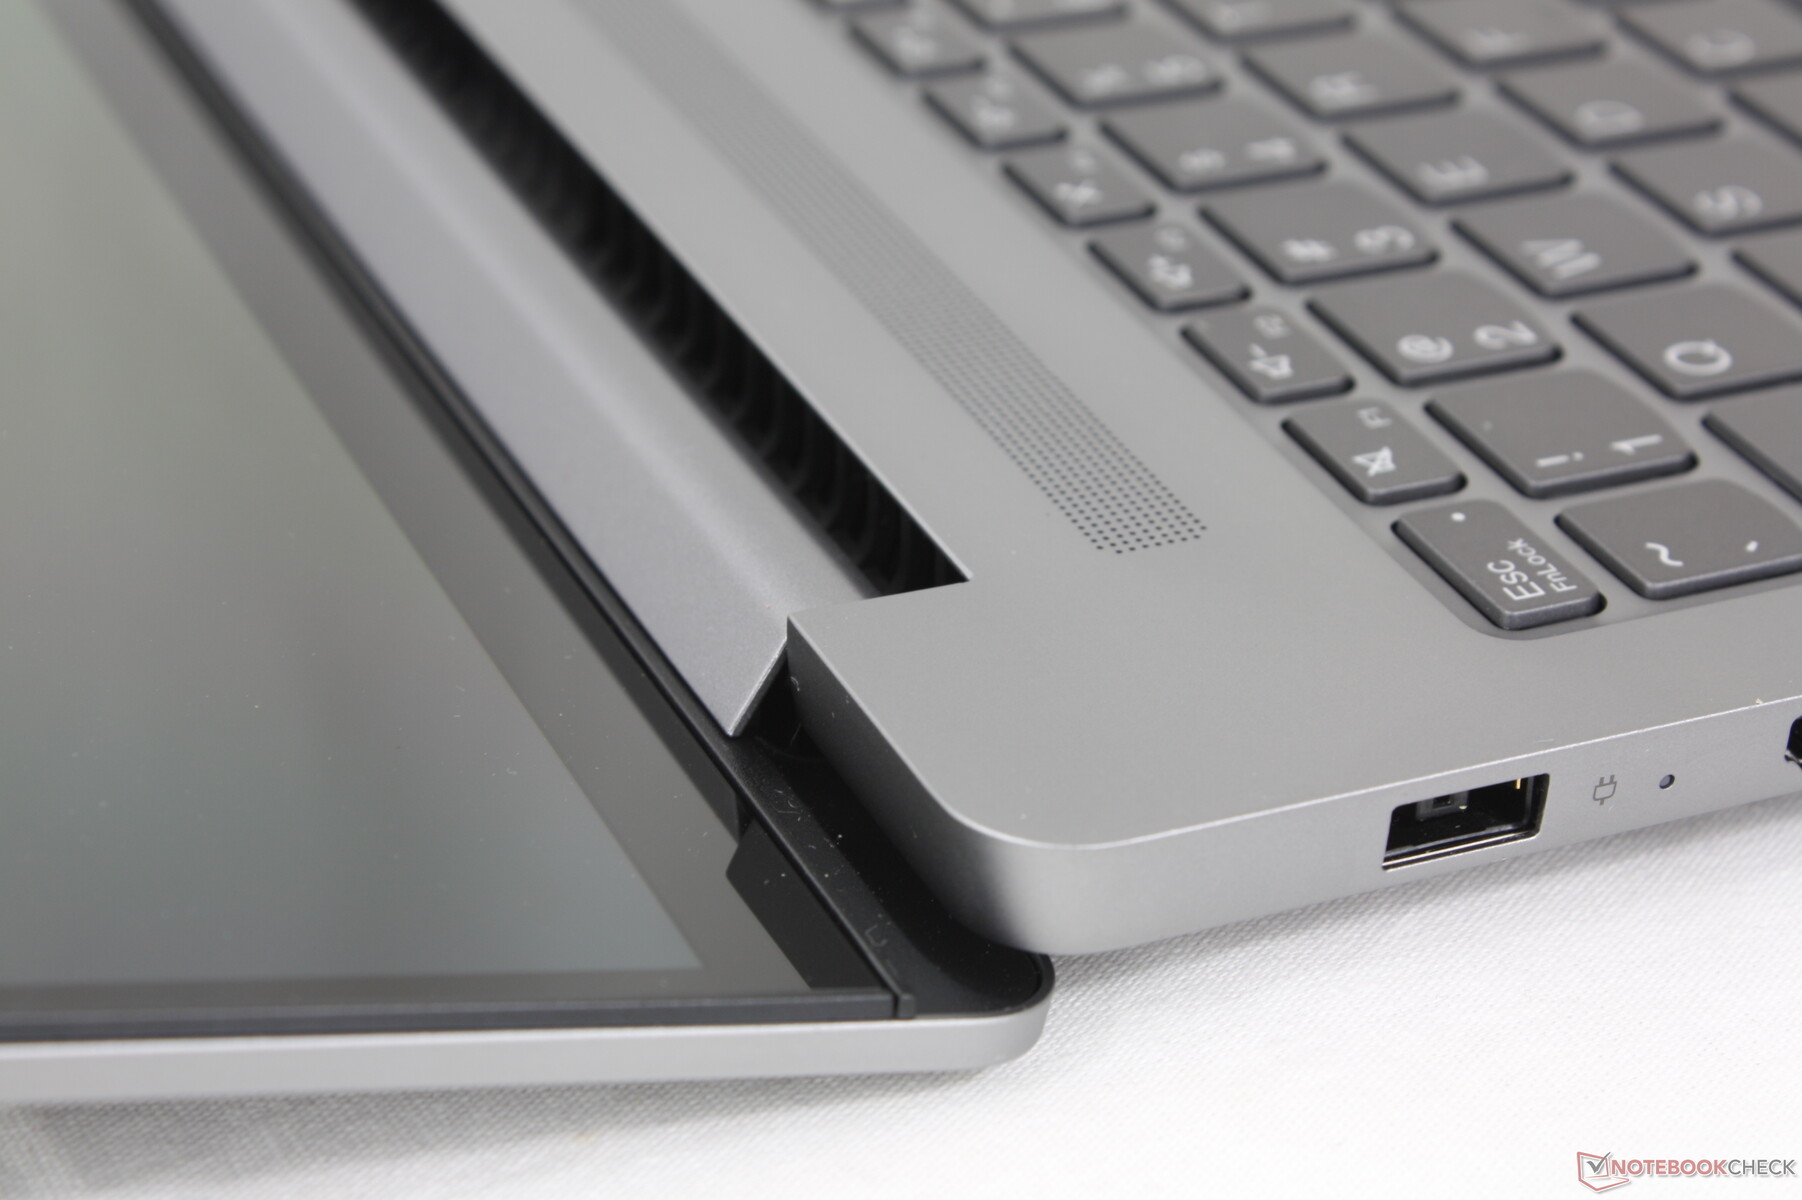
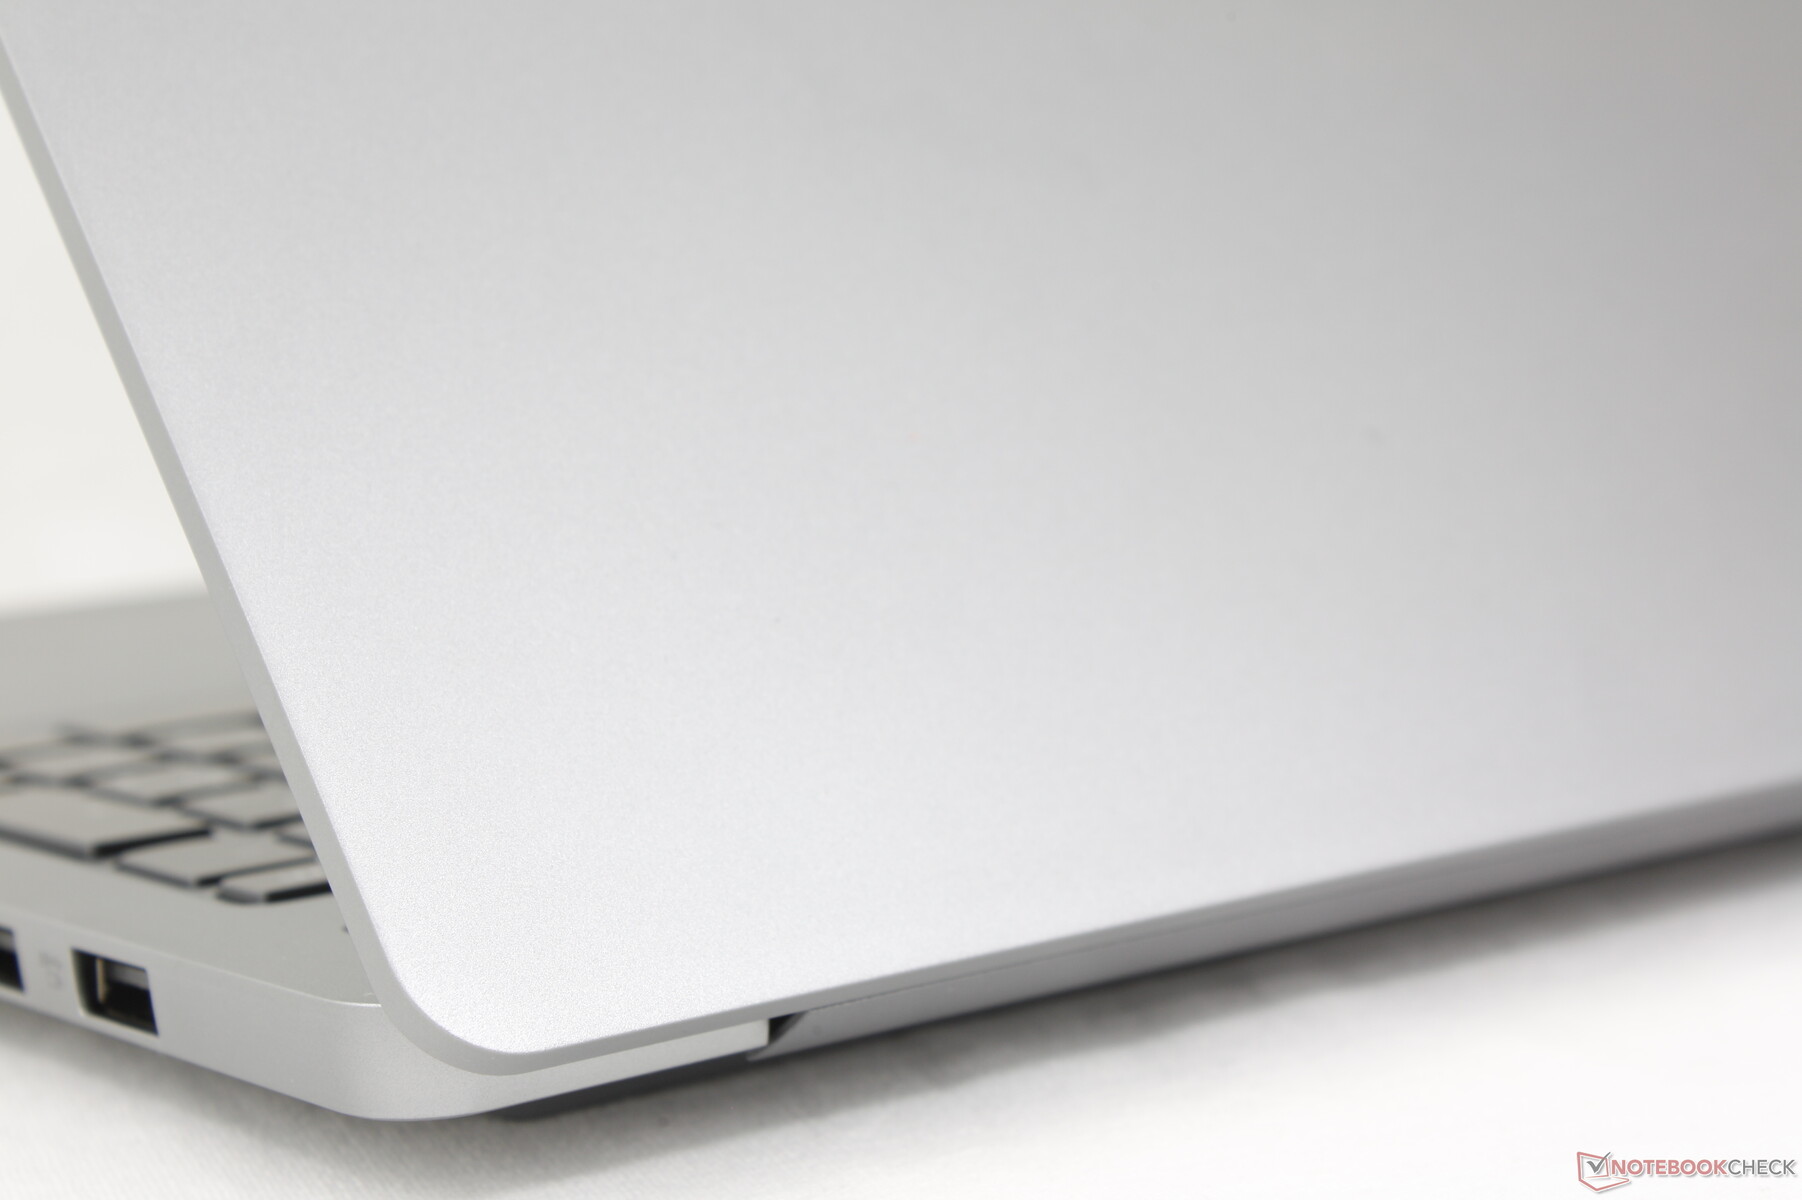
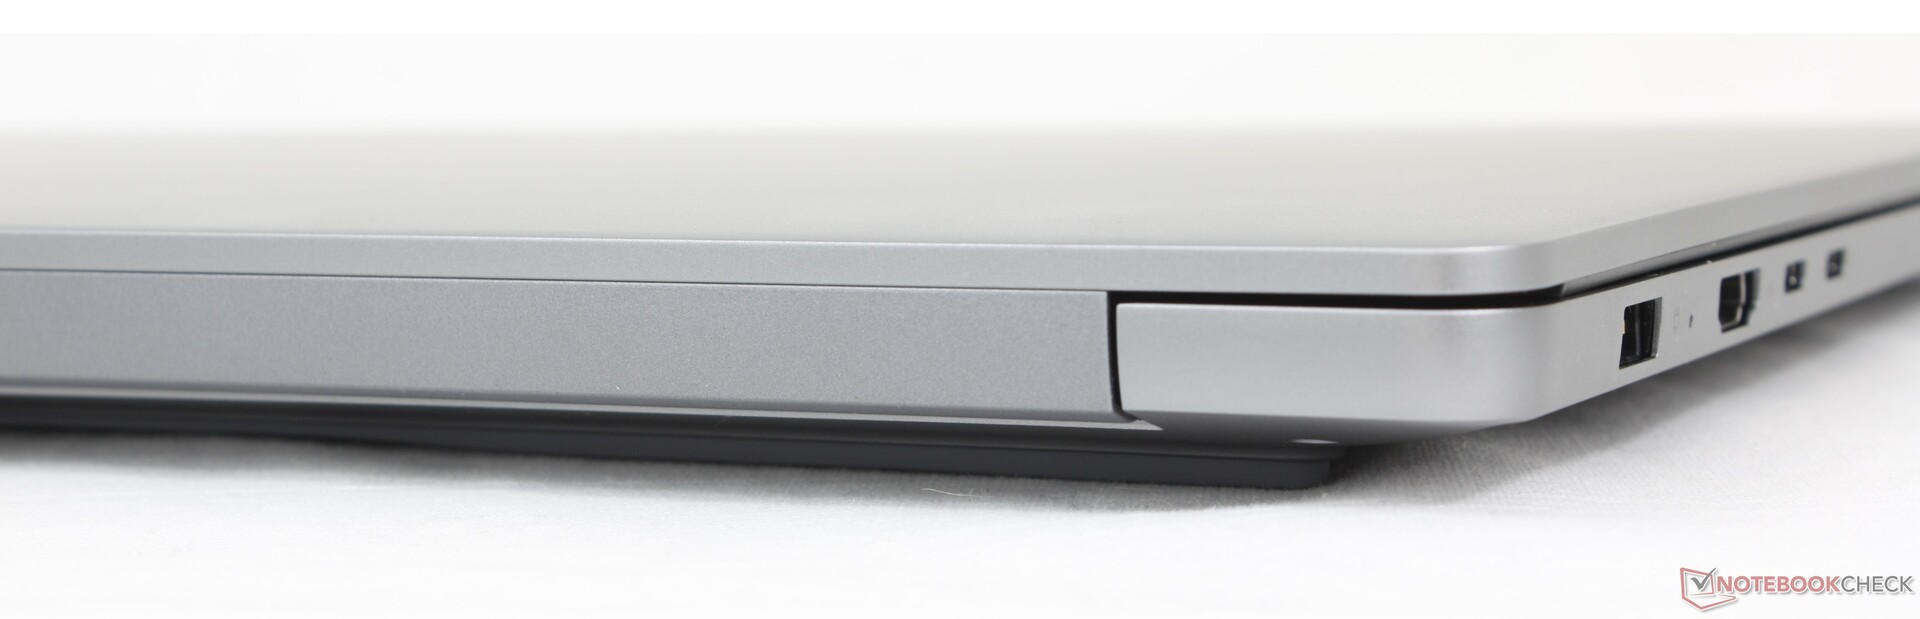
Obudowa zawiera dedykowany port zasilacza sieciowego wzdłuż lewej krawędzi, który służy również jako łatwy sposób wizualnego rozróżnienia między konfiguracjami iGPU i dGPU. GPU i panel OLED dodają około 100 g do całkowitej wagi, więc nasza jednostka nie jest dużo cięższa niż podstawowa opcja iGPU. Wymiary, konstrukcja i materiały pozostały niezmienione.

Łączność
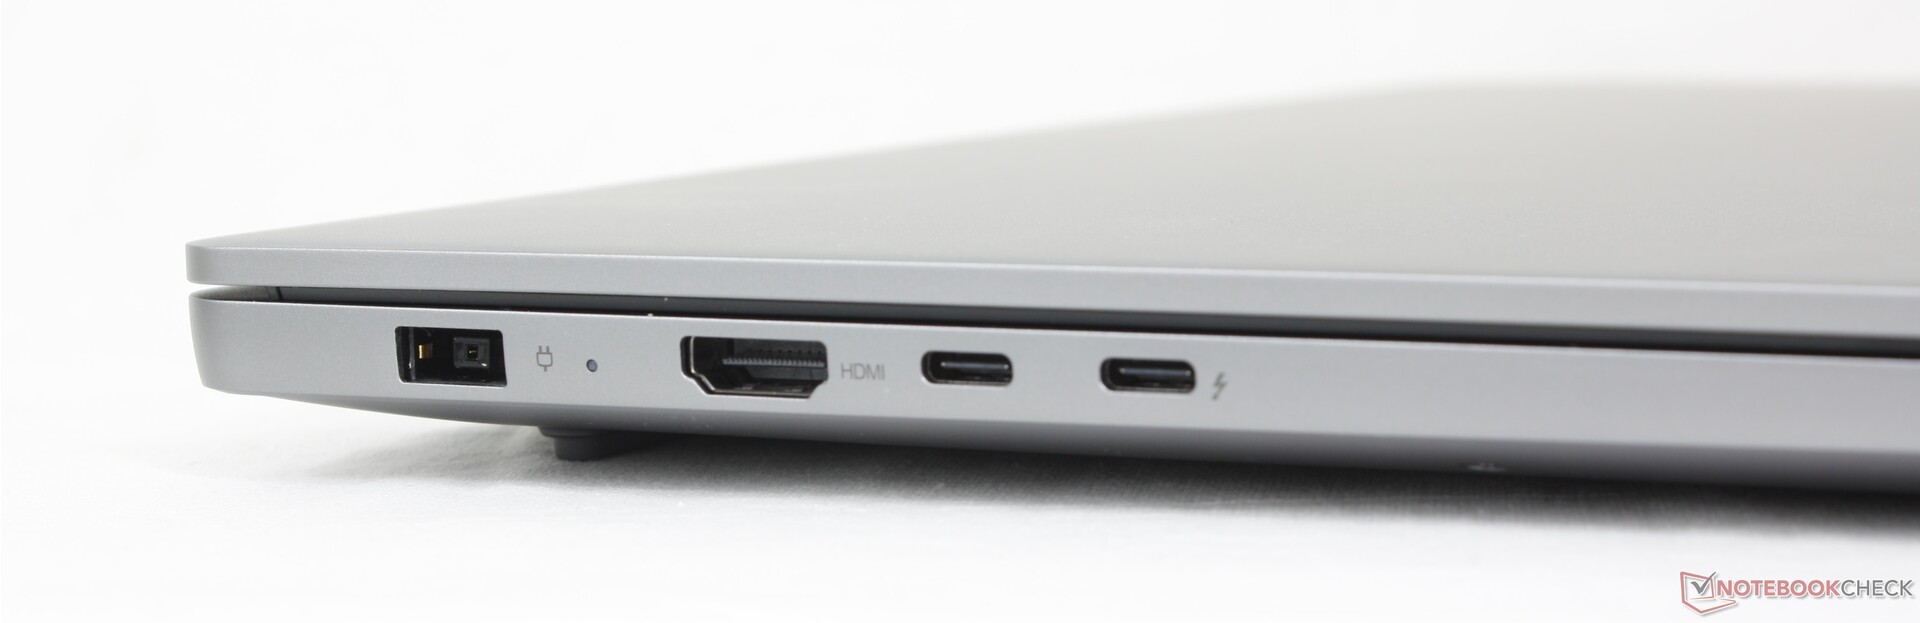
Nasza konfiguracja dGPU obsługuje zarówno uniwersalne ładowanie USB-C, jak i własne ładowanie za pomocą zasilacza sieciowego, w przeciwieństwie do konfiguracji iGPU, która obsługuje tylko to pierwsze. Zasilacz sieciowy jest niezbędny do zasilania procesora Core Ultra H i dyskretnej grafiki Nvidia o mocy 90 W bez uciekania się do niższego pułapu 50 W TGP, co jest podejściem, które Samsung stosuje w swoim Galaxy Book4 Ultra.
Opcje portów są poza tym identyczne jak w Inspiron 16 7640 2-w-1 oferując jednocześnie więcej niż Samsung.
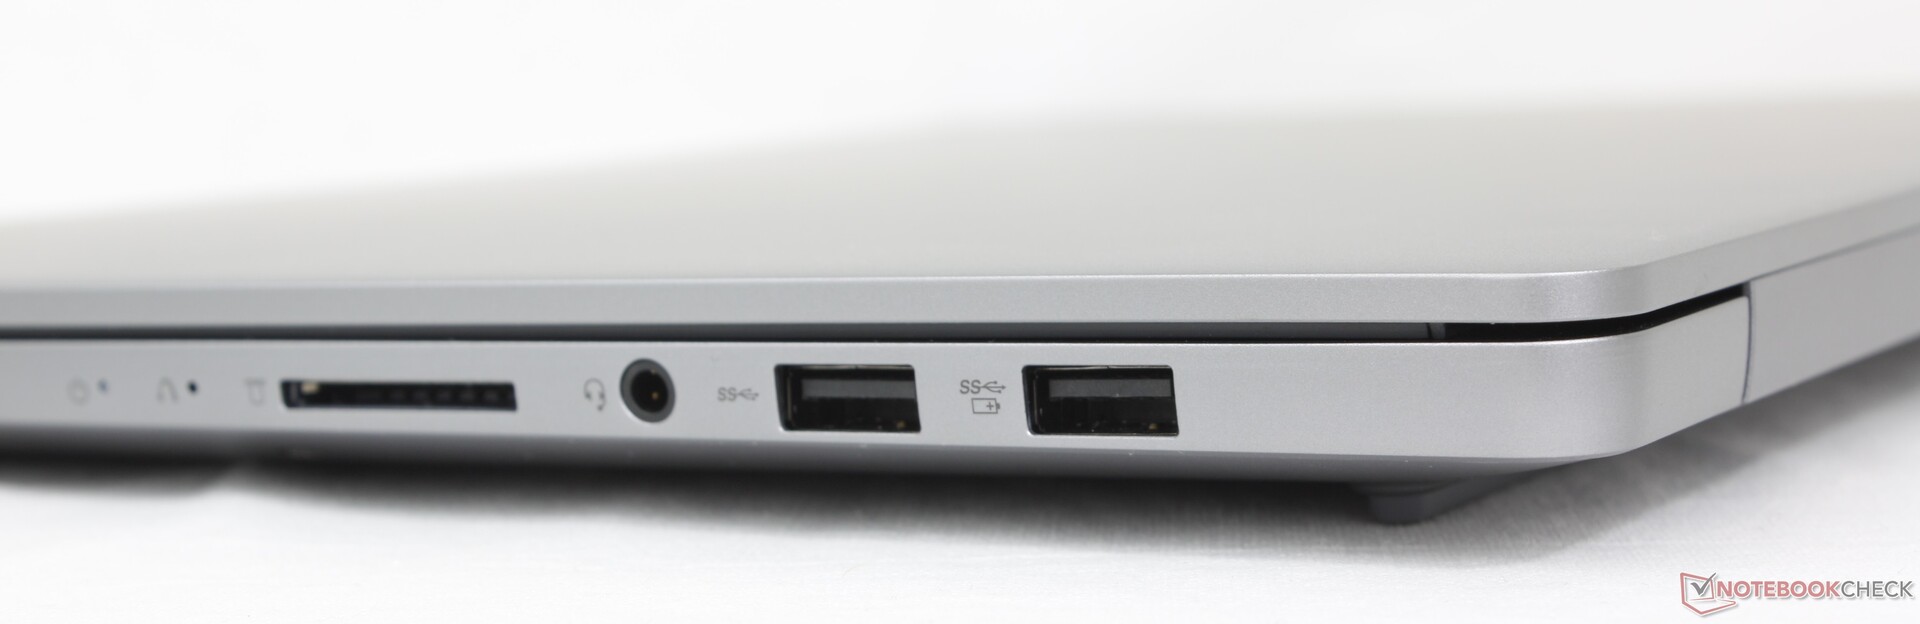
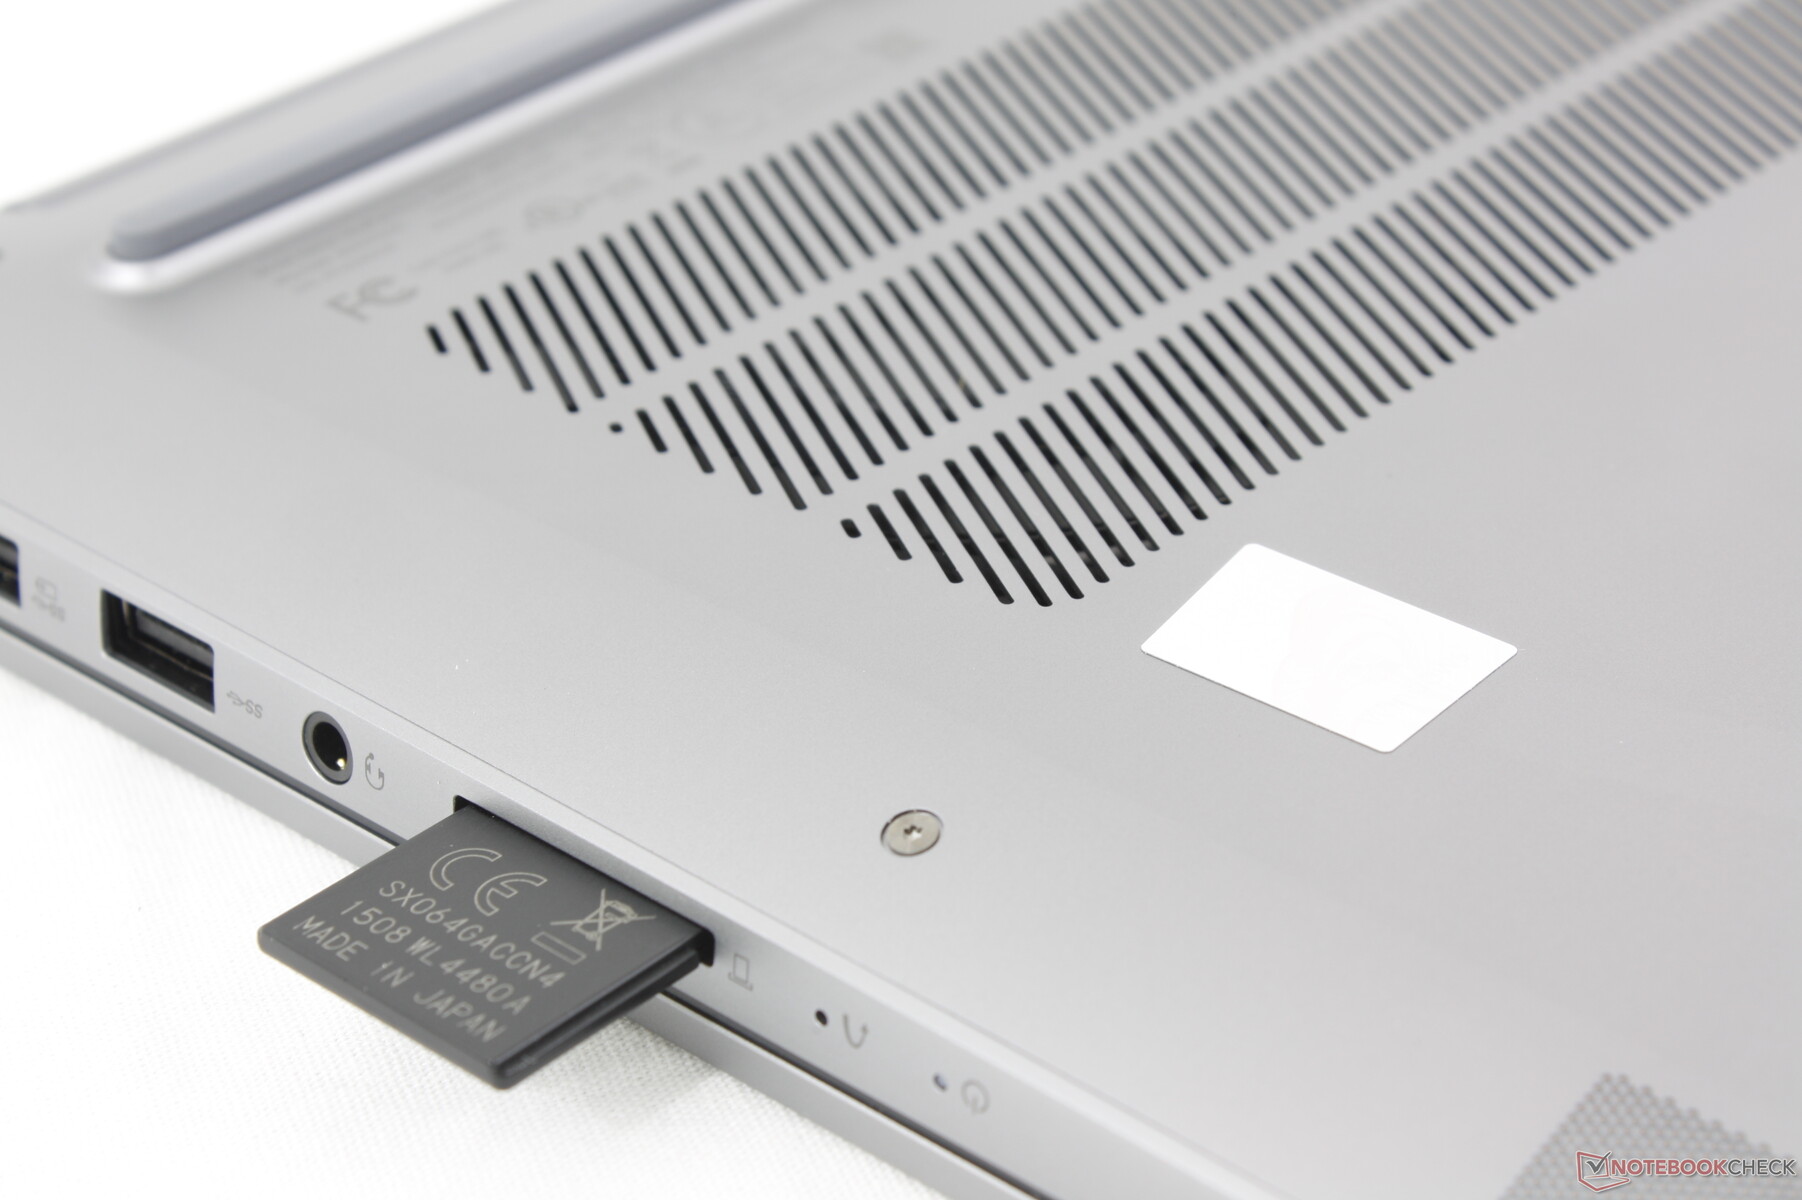
Czytnik kart SD
| SD Card Reader | |
| average JPG Copy Test (av. of 3 runs) | |
| Asus Zenbook S 16 UM5606-RK333W (Angelbird AV Pro V60) | |
| Samsung Galaxy Book4 Ultra (Angelbird AV Pro V60) | |
| Lenovo IdeaPad Pro 5 16IMH G9 RTX 4050 (Toshiba Exceria Pro SDXC 64 GB UHS-II) | |
| Lenovo IdeaPad Pro 5 16IMH G9 (Angelbird AV Pro V60) | |
| Dell Inspiron 16 7640 2-in-1 (Toshiba Exceria Pro SDXC 64 GB UHS-II) | |
| maximum AS SSD Seq Read Test (1GB) | |
| Asus Zenbook S 16 UM5606-RK333W (Angelbird AV Pro V60) | |
| Lenovo IdeaPad Pro 5 16IMH G9 (Angelbird AV Pro V60) | |
| Samsung Galaxy Book4 Ultra (Angelbird AV Pro V60) | |
| Lenovo IdeaPad Pro 5 16IMH G9 RTX 4050 (Toshiba Exceria Pro SDXC 64 GB UHS-II) | |
| Dell Inspiron 16 7640 2-in-1 (Toshiba Exceria Pro SDXC 64 GB UHS-II) | |
Komunikacja
Intel AX211 jest standardowo wyposażony w obsługę Wi-Fi 6E i Bluetooth 5.3. Po sparowaniu z naszym routerem testowym AXE11000 prędkość transferu wynosi ponad 1 Gb/s.
Kamera internetowa
Kamera internetowa 2 MP jest standardowo wyposażona w podczerwień i fizyczną migawkę zapewniającą prywatność.


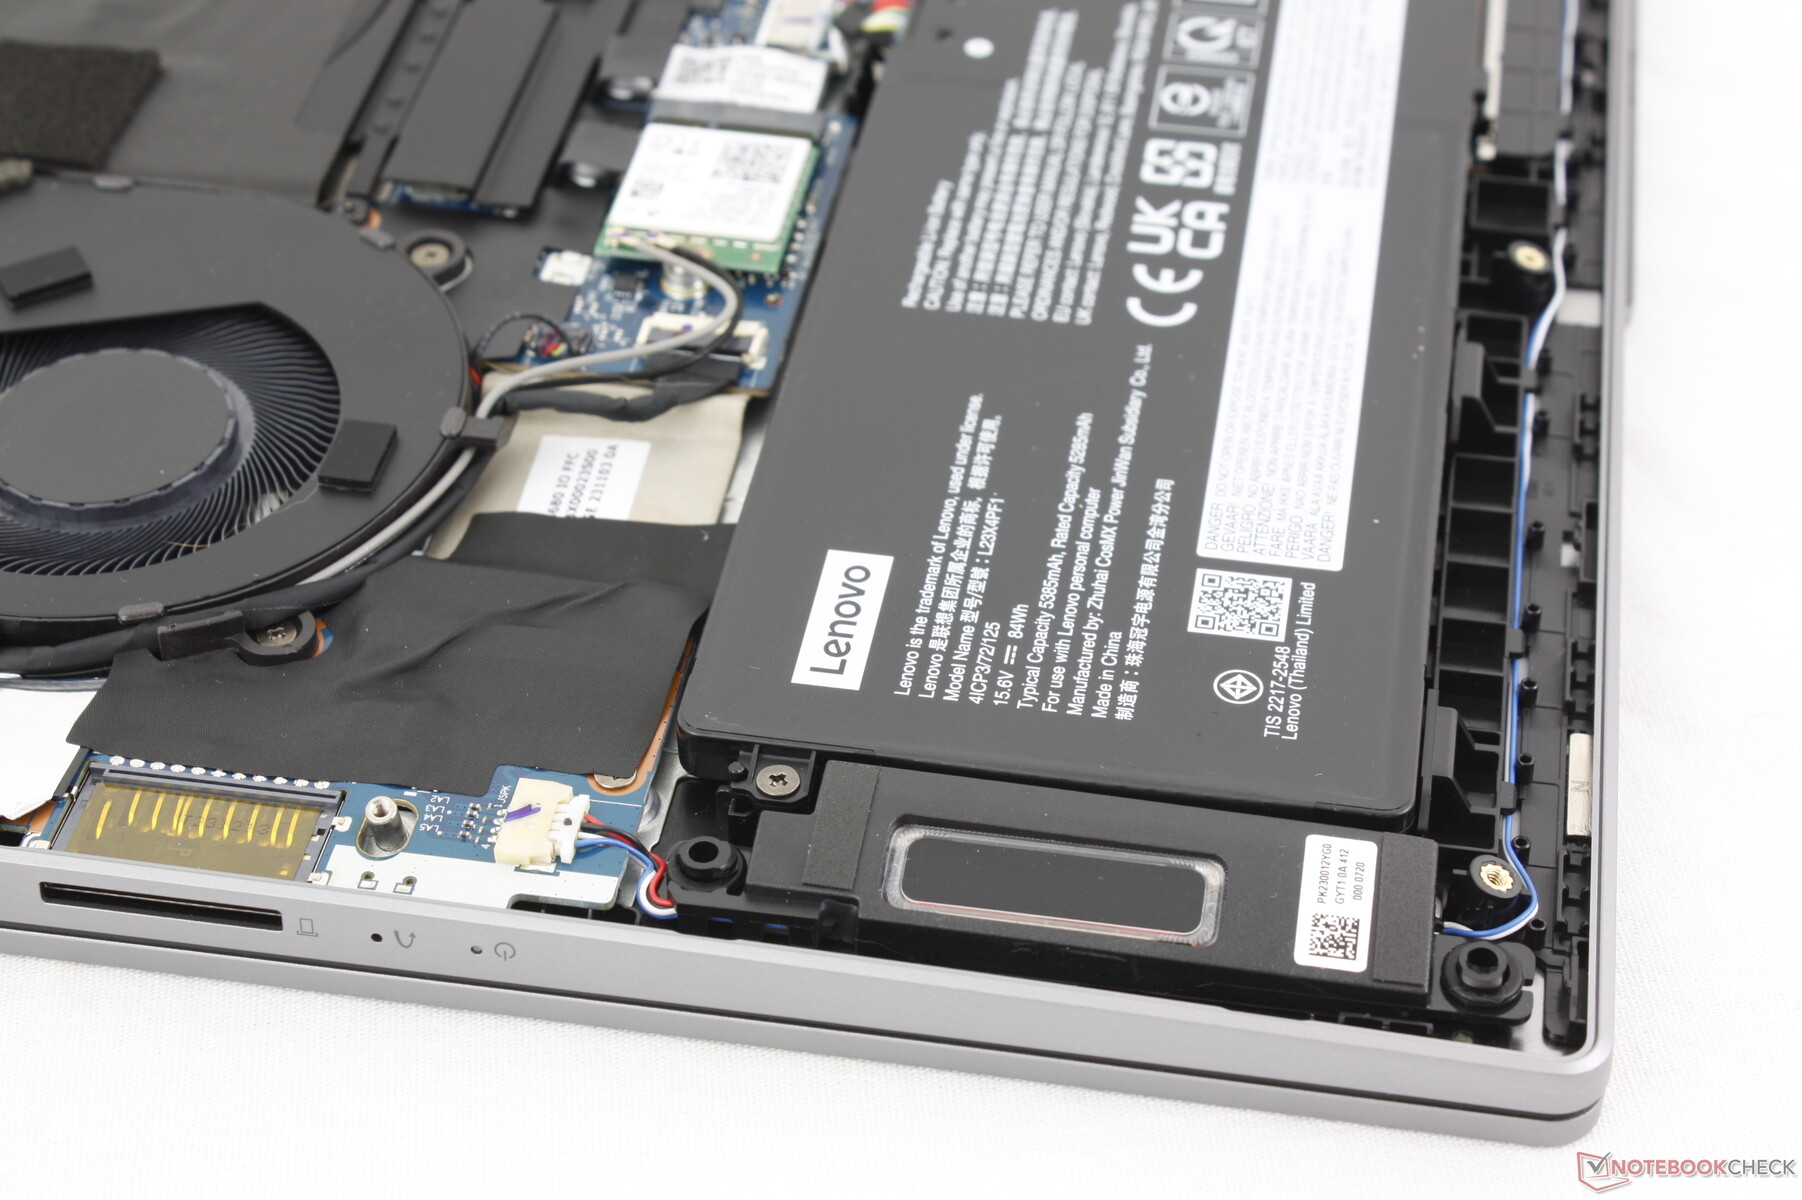
Konserwacja
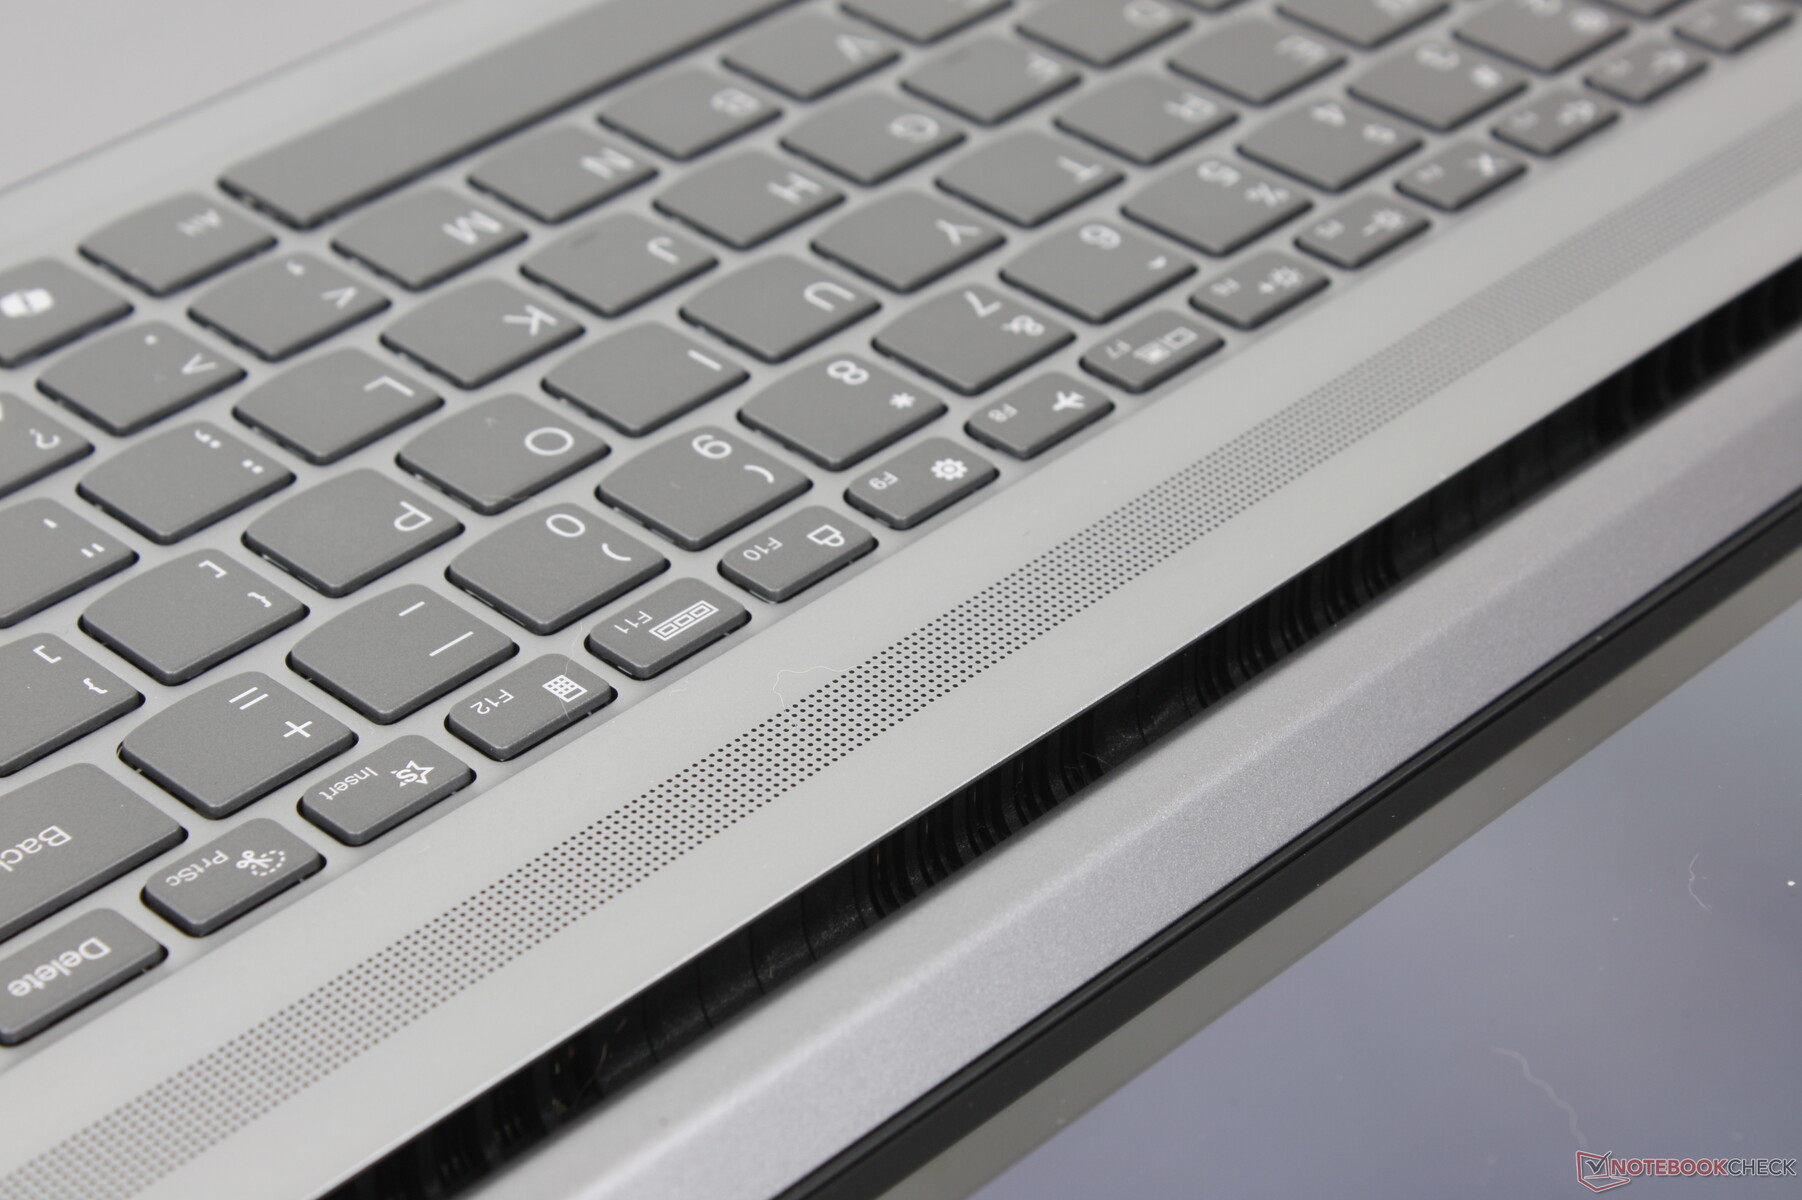
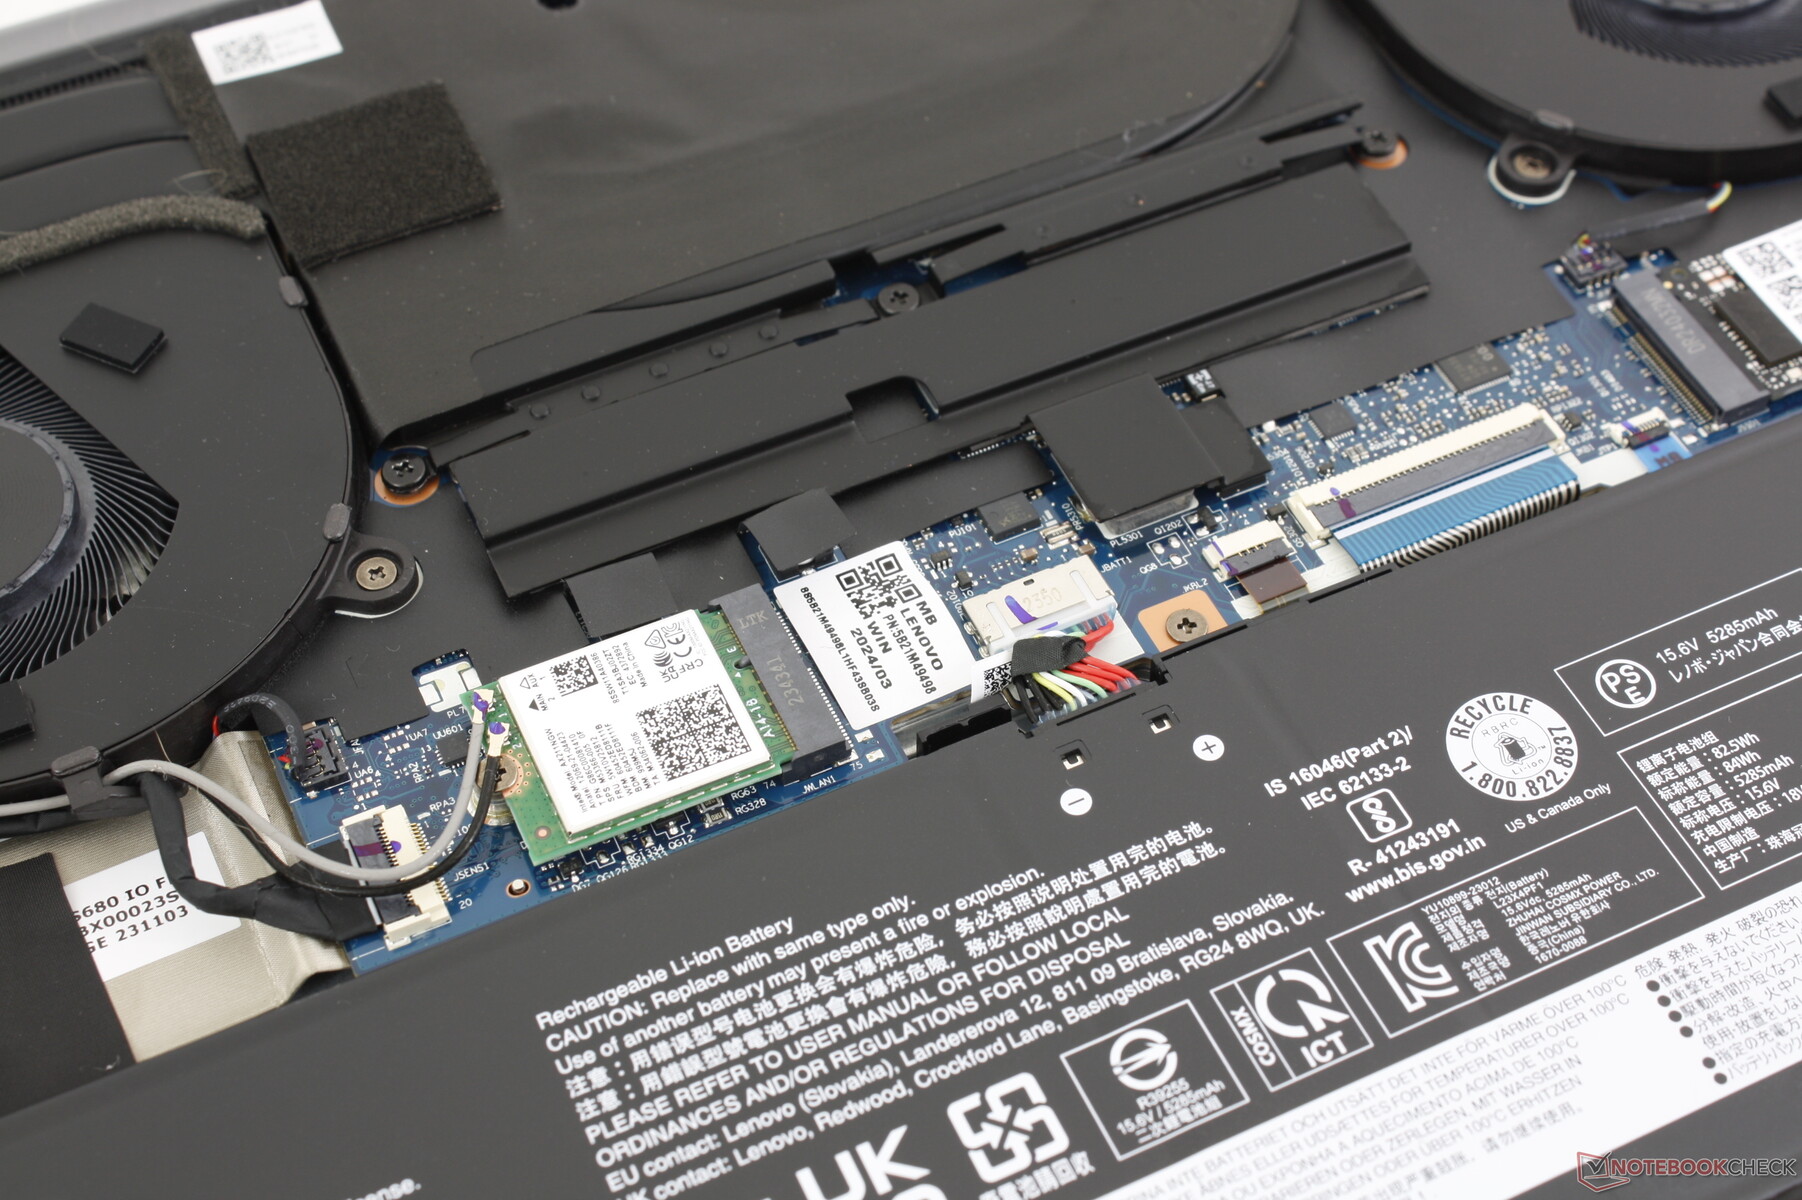
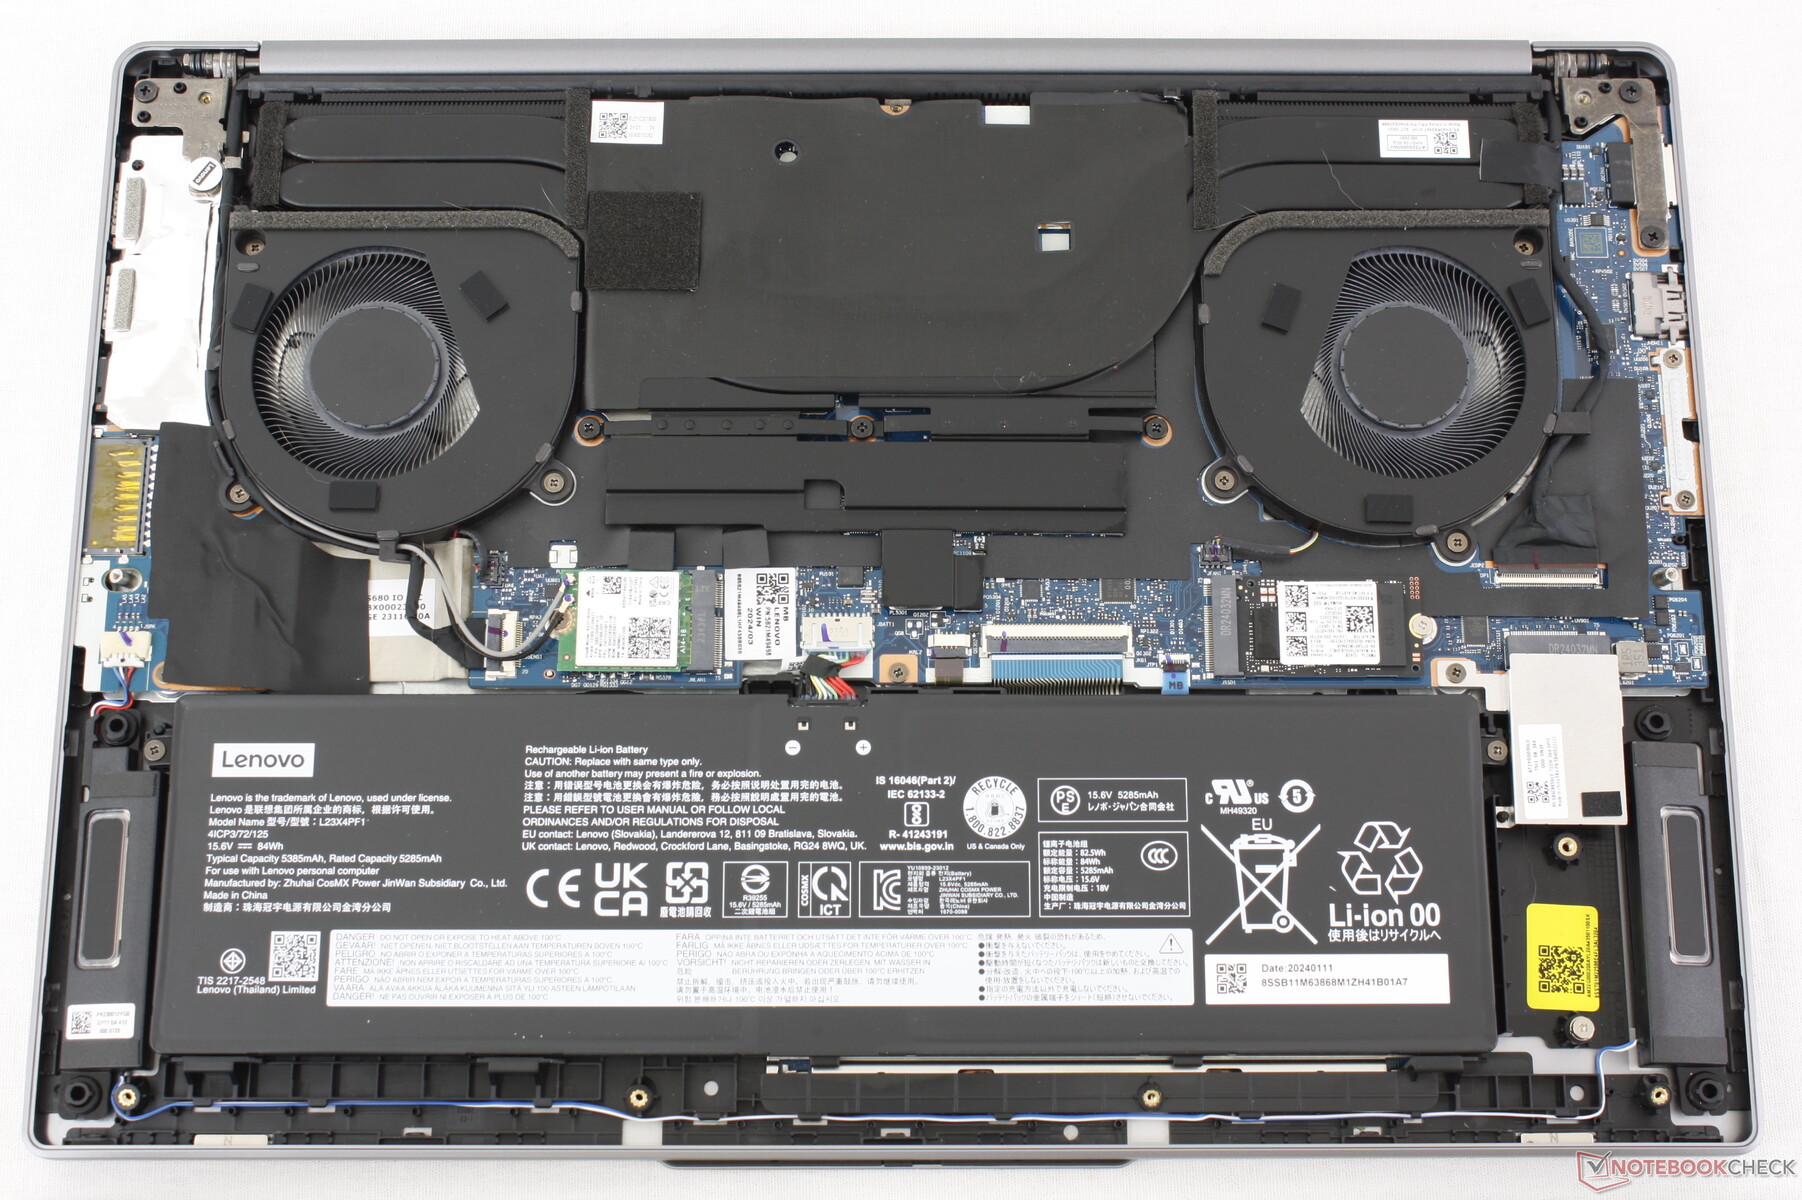
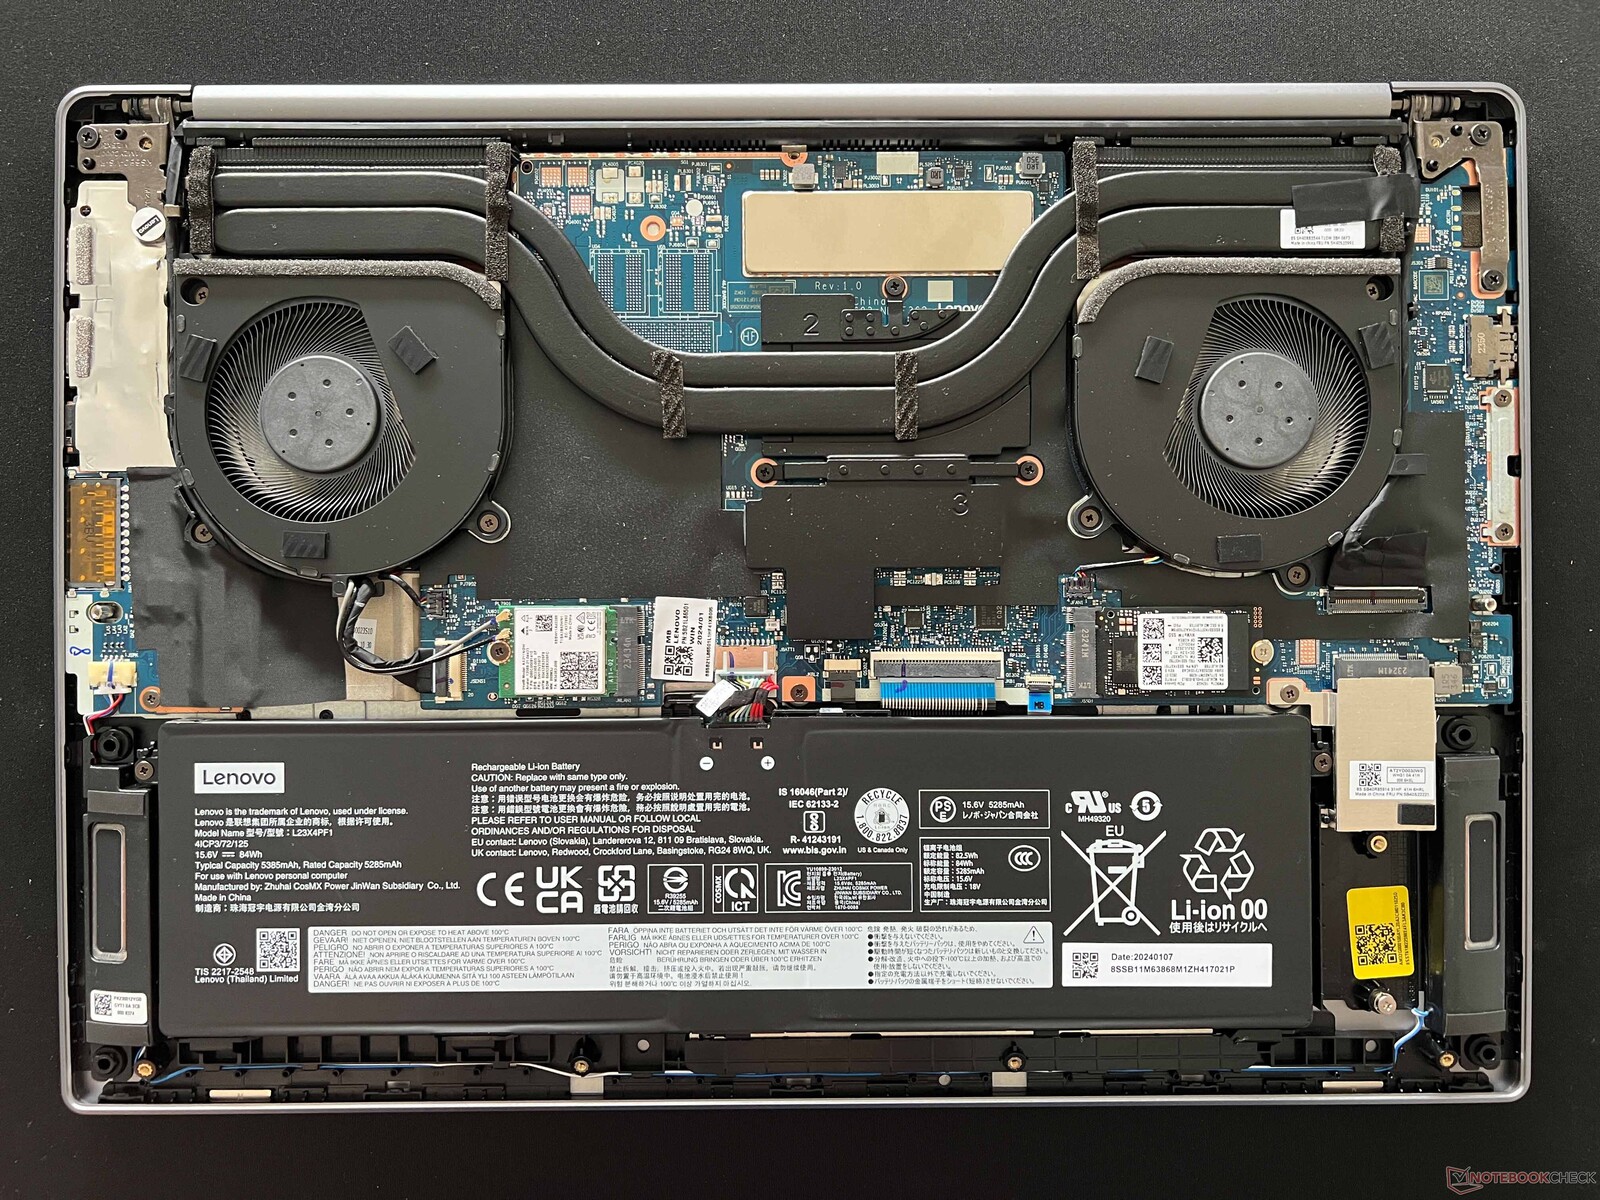
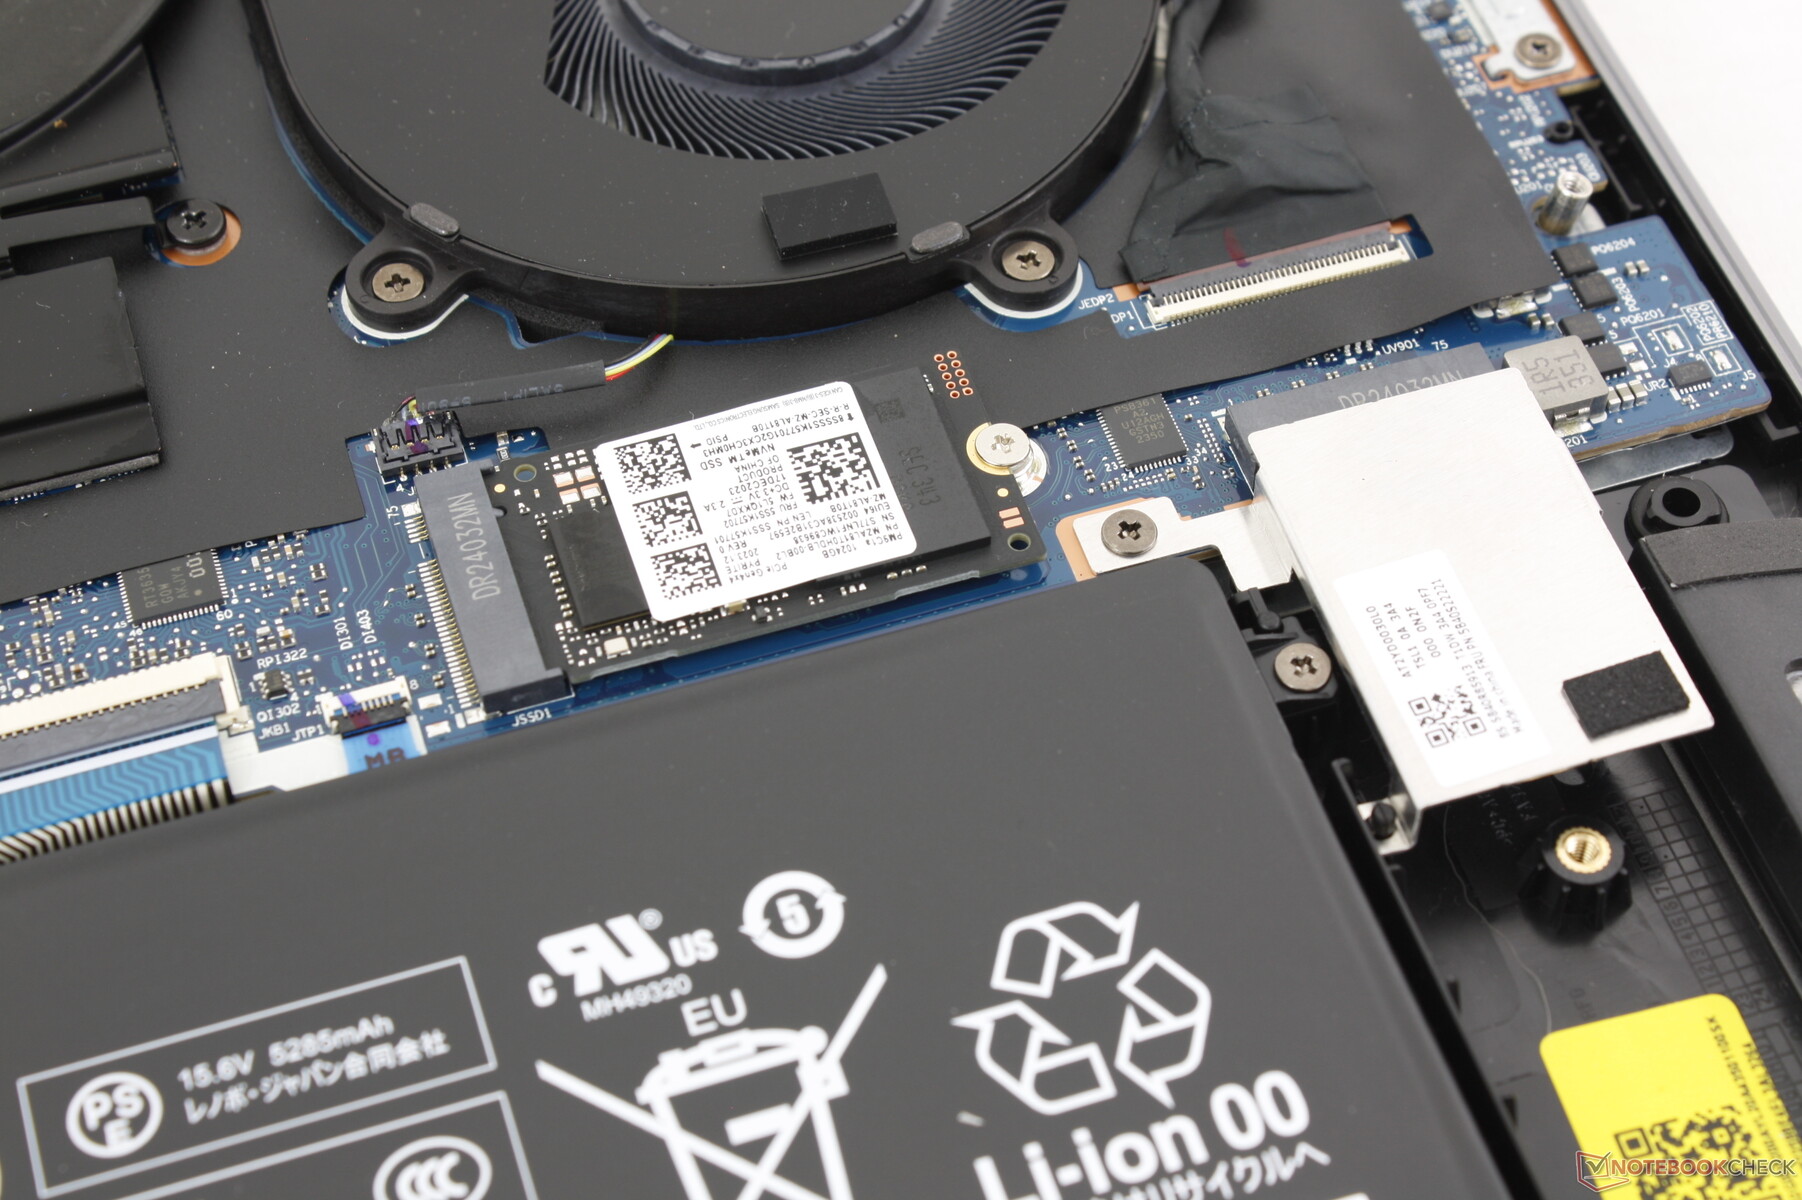
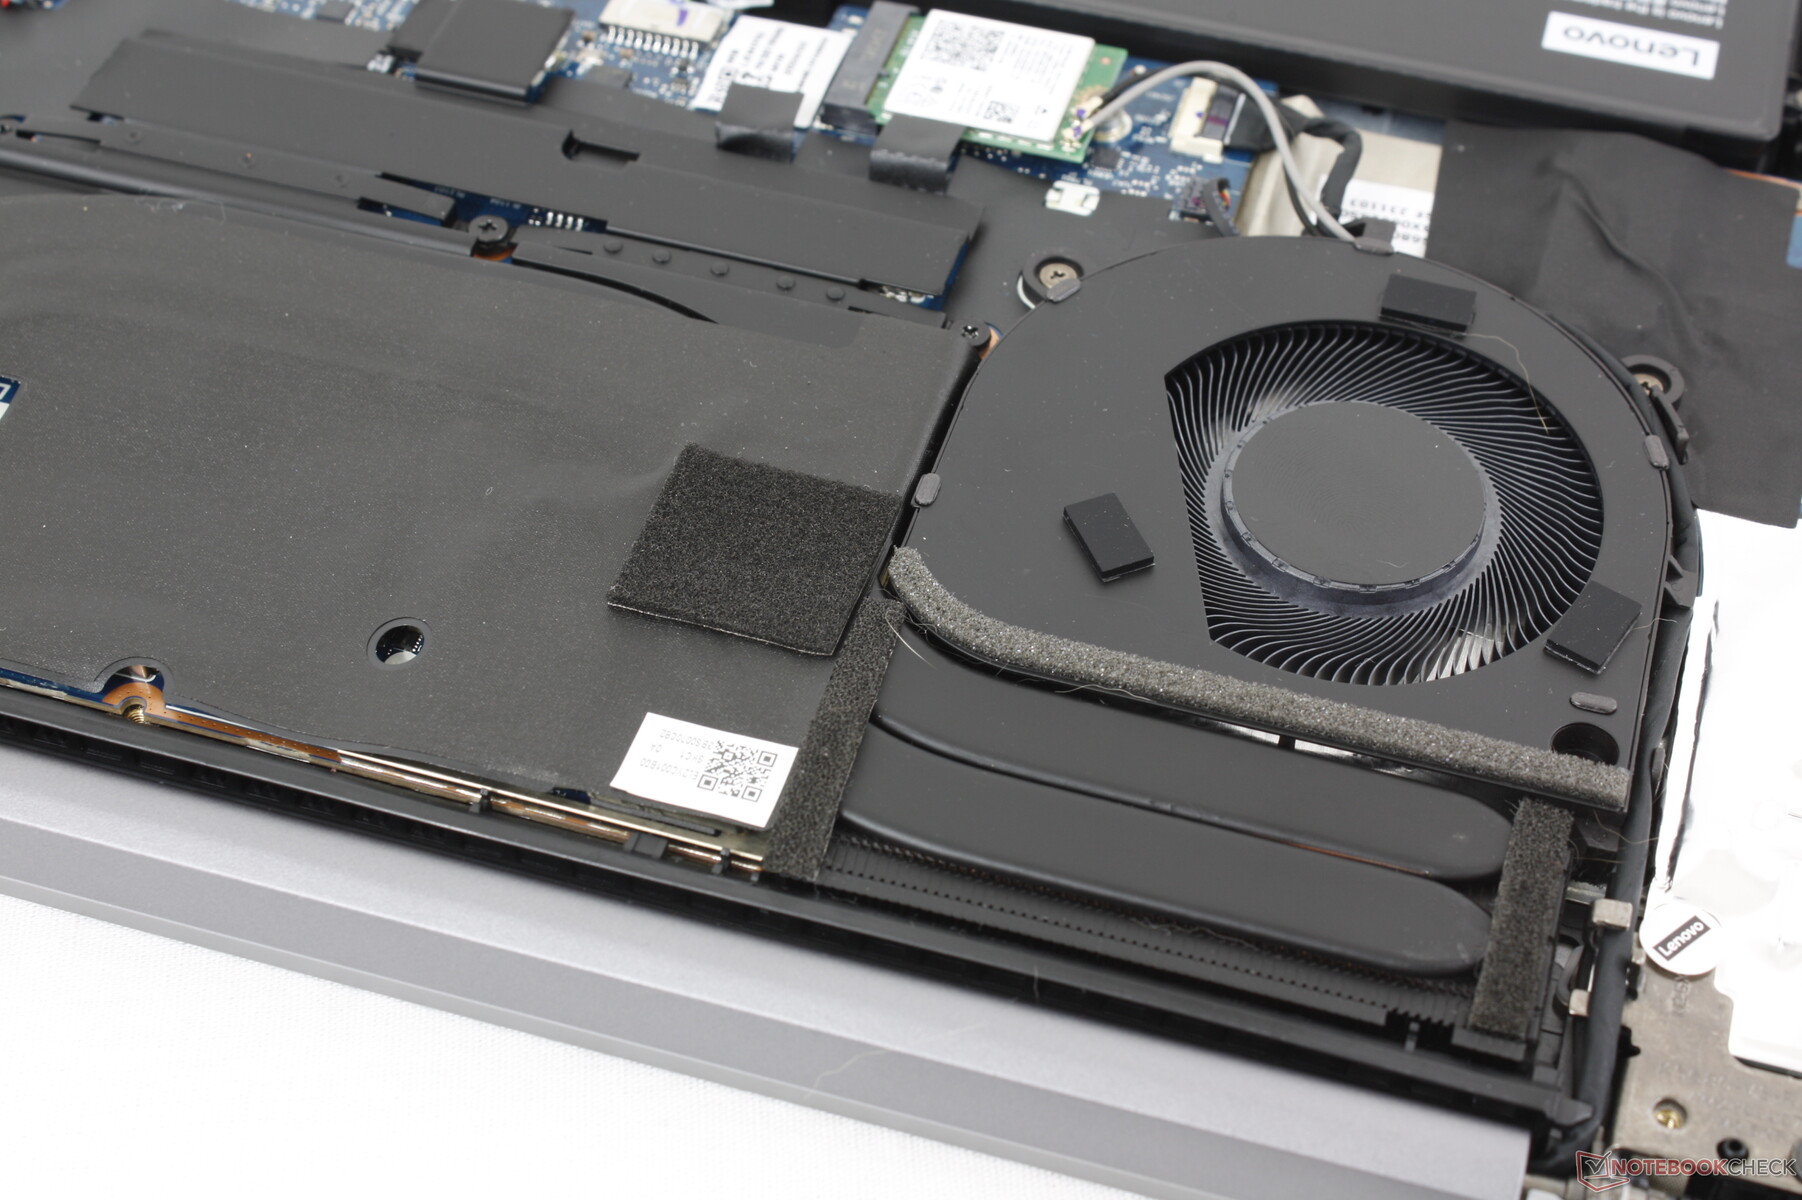
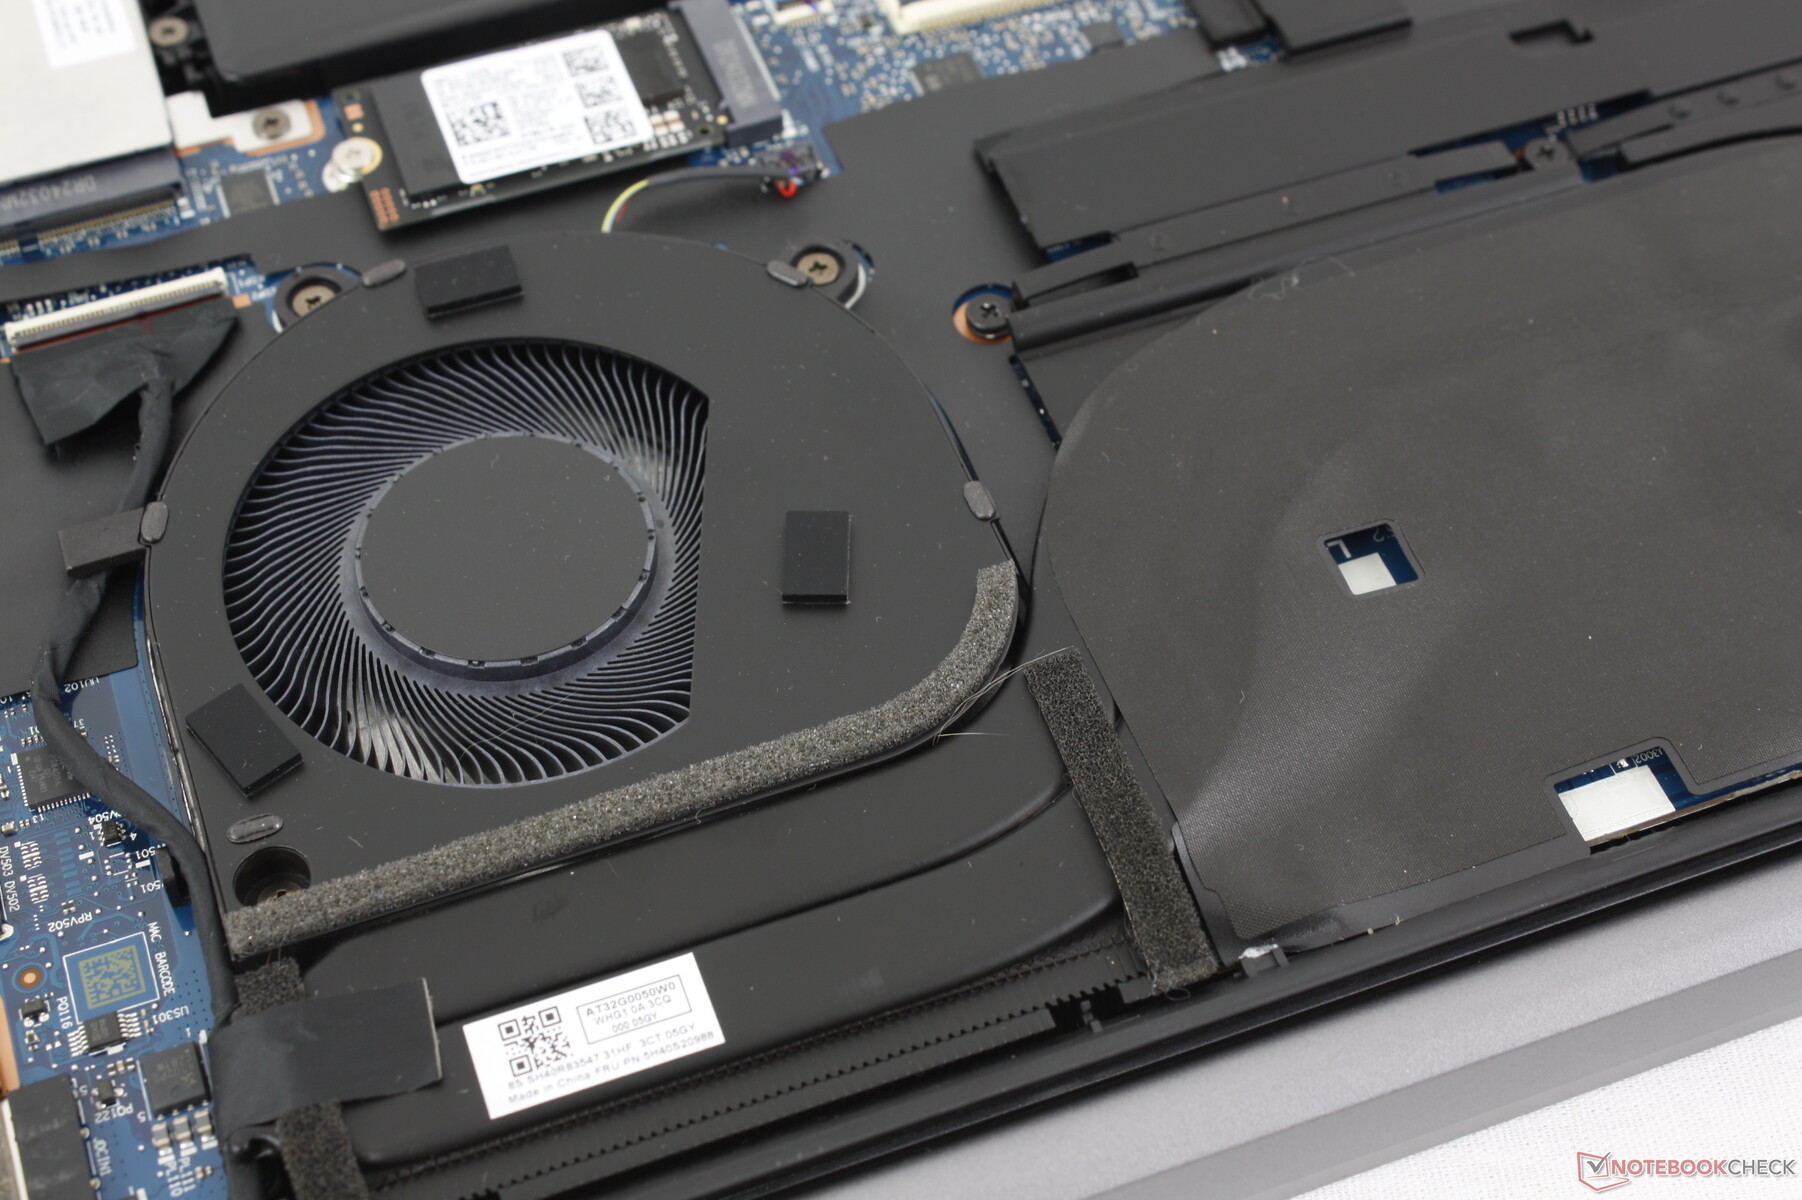
Dolny panel jest zabezpieczony dziewięcioma śrubami Torx dla stosunkowo łatwego serwisowania. Rozwiązanie chłodzące pozostało niezmienione w stosunku do wersji iGPU, pomimo bardziej wymagającego sprzętu, co oznacza, że możemy spodziewać się zarówno głośniejszego hałasu, jak i wyższych temperatur.
Zrównoważony rozwój
Dolna pokrywa składa się w 50 procentach z aluminium pochodzącego z recyklingu, podczas gdy tworzywa sztuczne w opakowaniu w 90 procentach pochodzą z oceanów. Doceniamy również fakt, że oficjalne przewodniki napraw https://pcsupport.lenovo.com/us/en/products/laptops-and-netbooks/5-series/ideapad-pro-5-16imh9/83d4/83d4001hus/document-userguide dla tego modelu są dostępne bezpośrednio od Lenovo jako bezpłatne pliki do pobrania.
Akcesoria i gwarancja
W pudełku detalicznym nie ma żadnych dodatków poza zasilaczem sieciowym i dokumentacją. W przypadku zakupu w Stanach Zjednoczonych obowiązuje standardowa roczna ograniczona gwarancja.
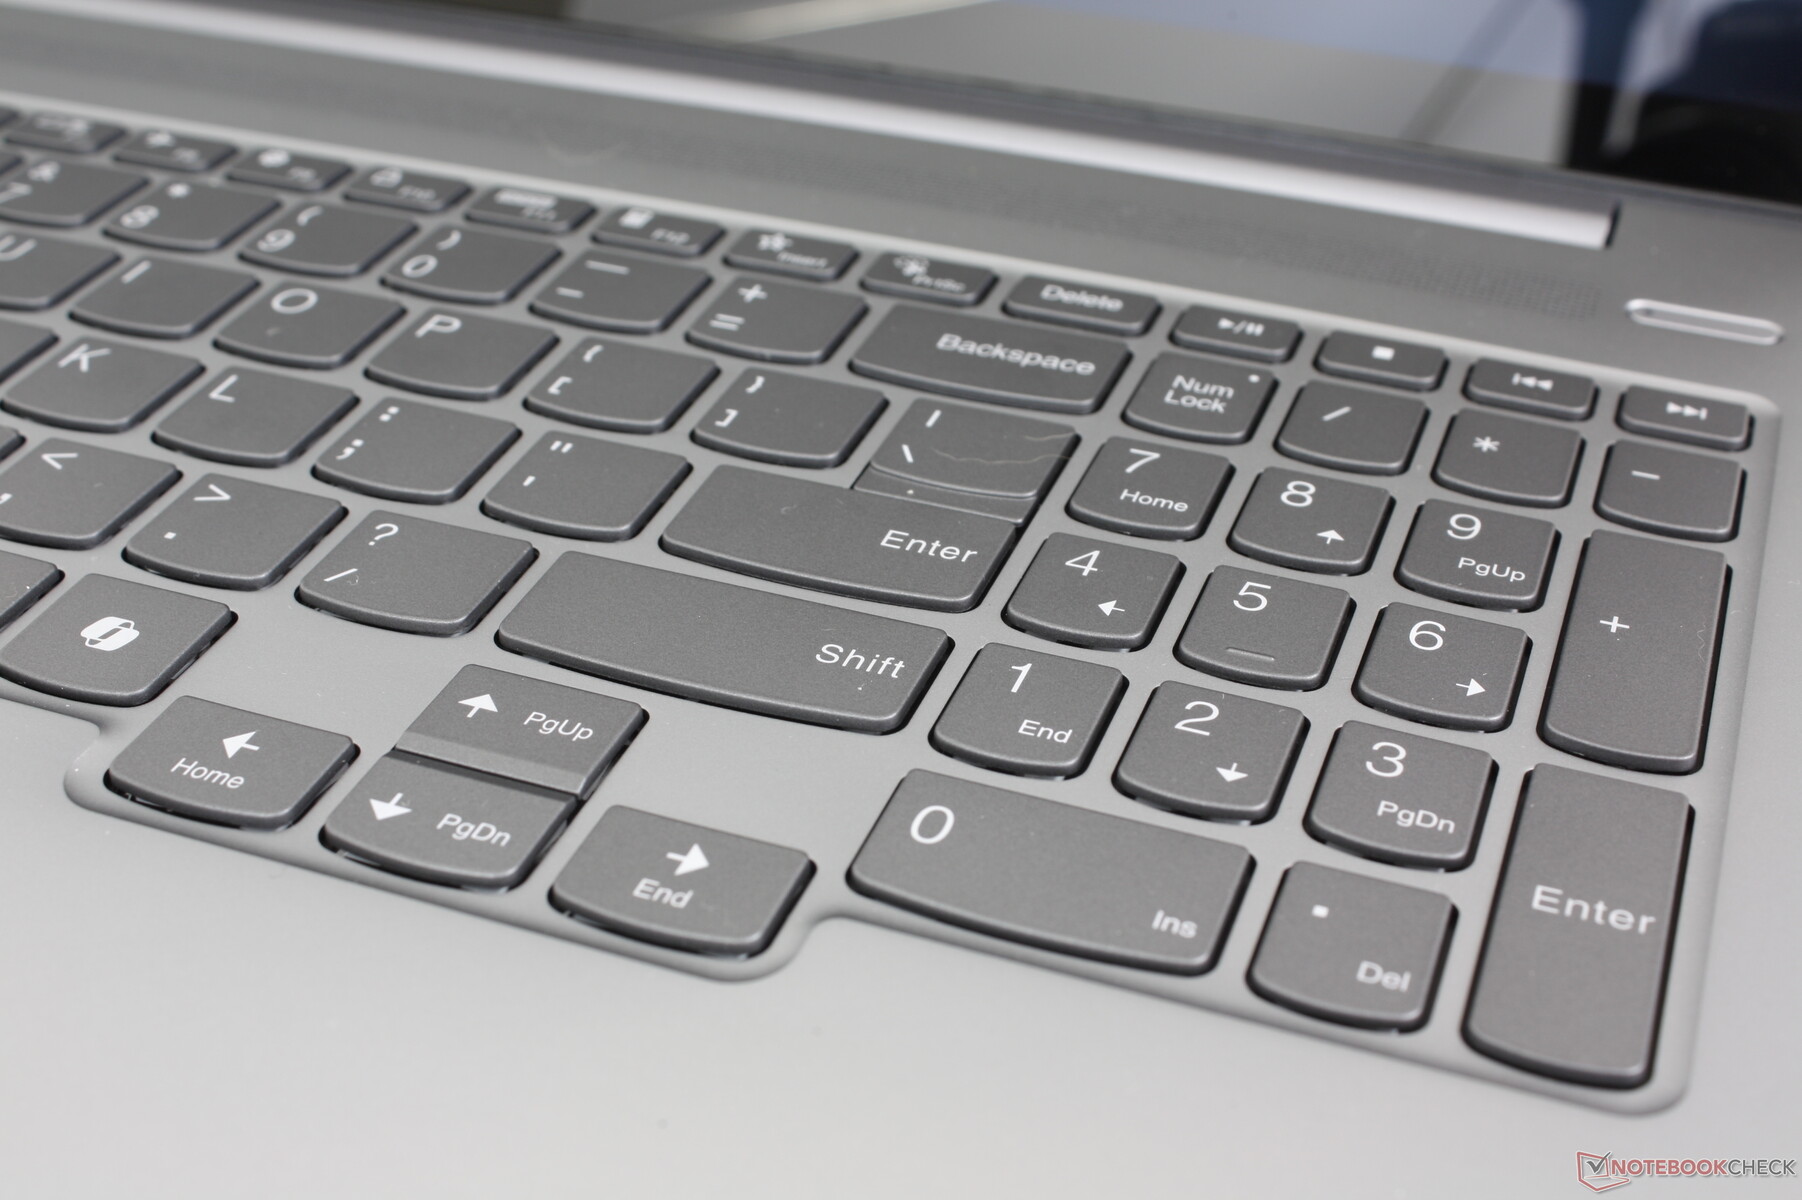
Urządzenia wejściowe
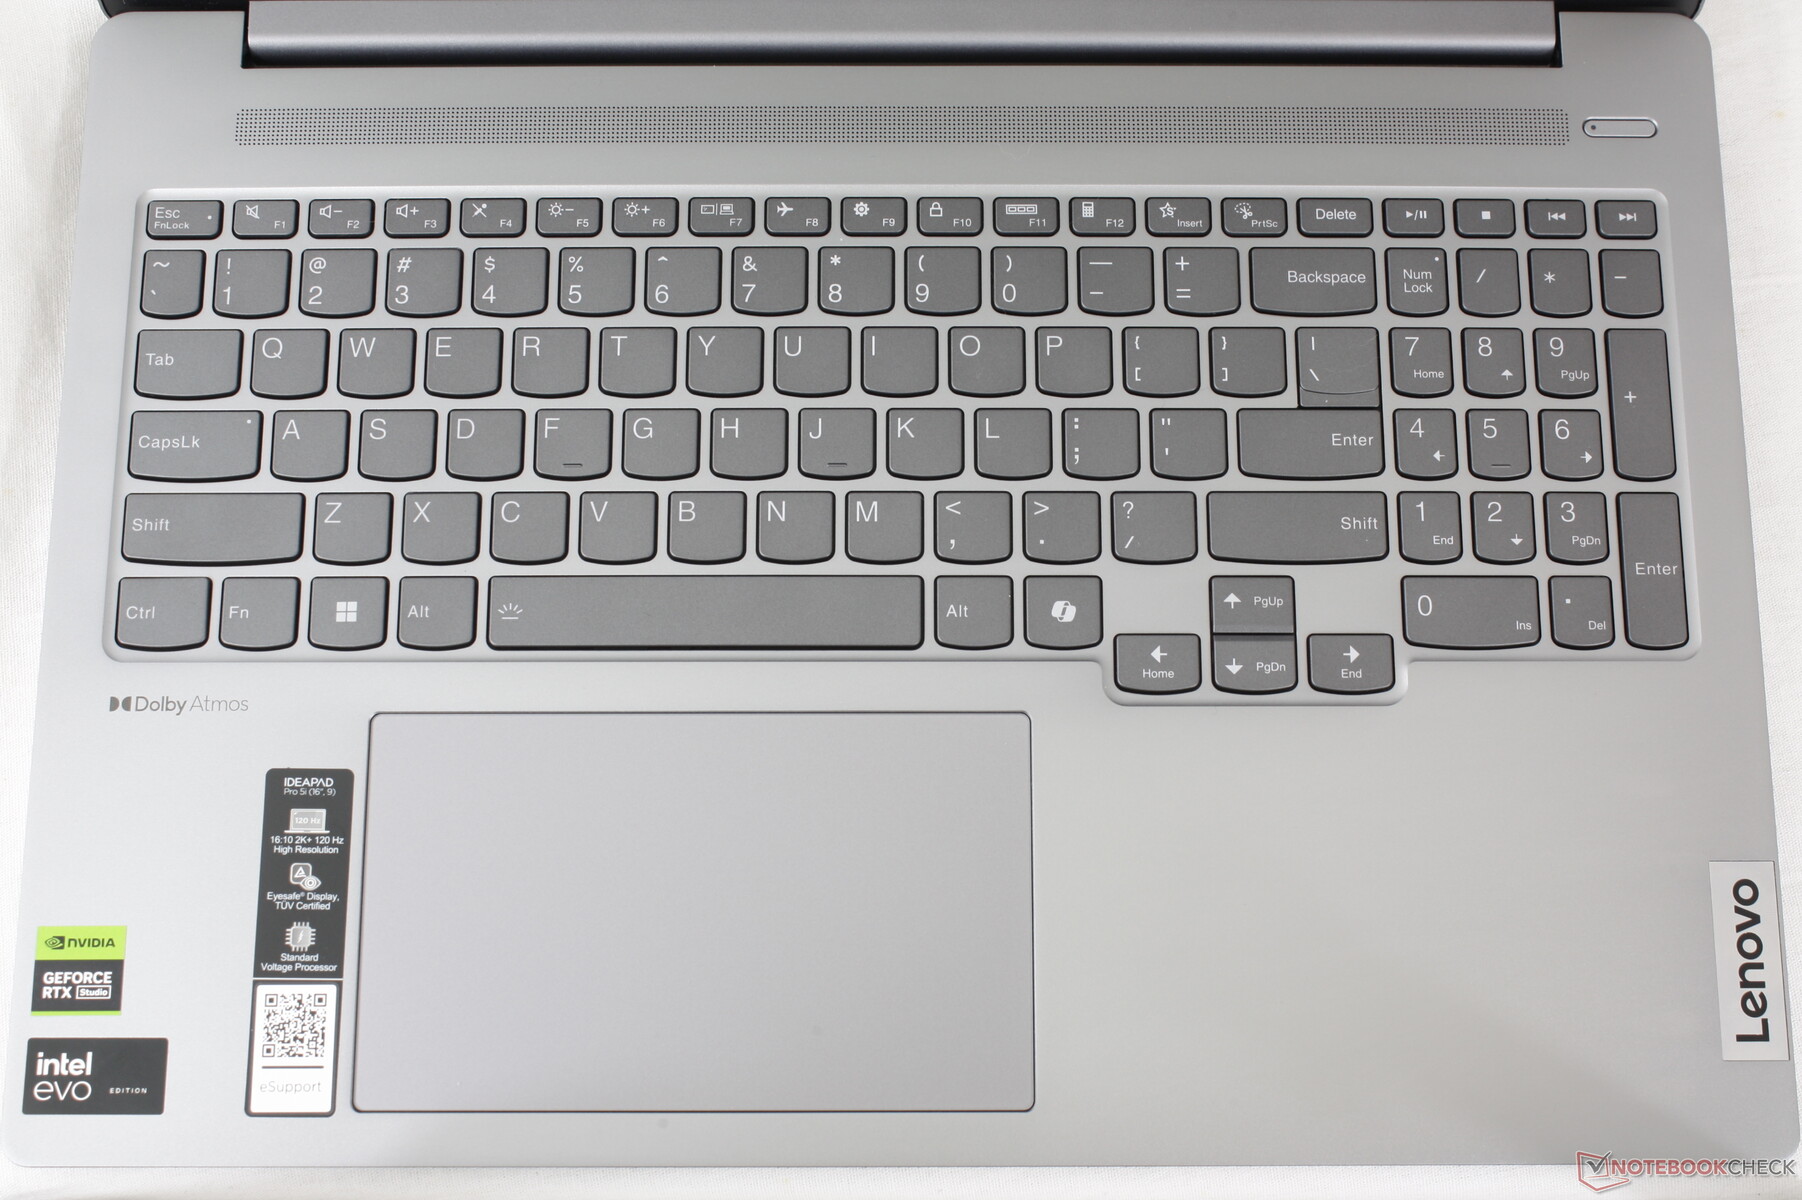
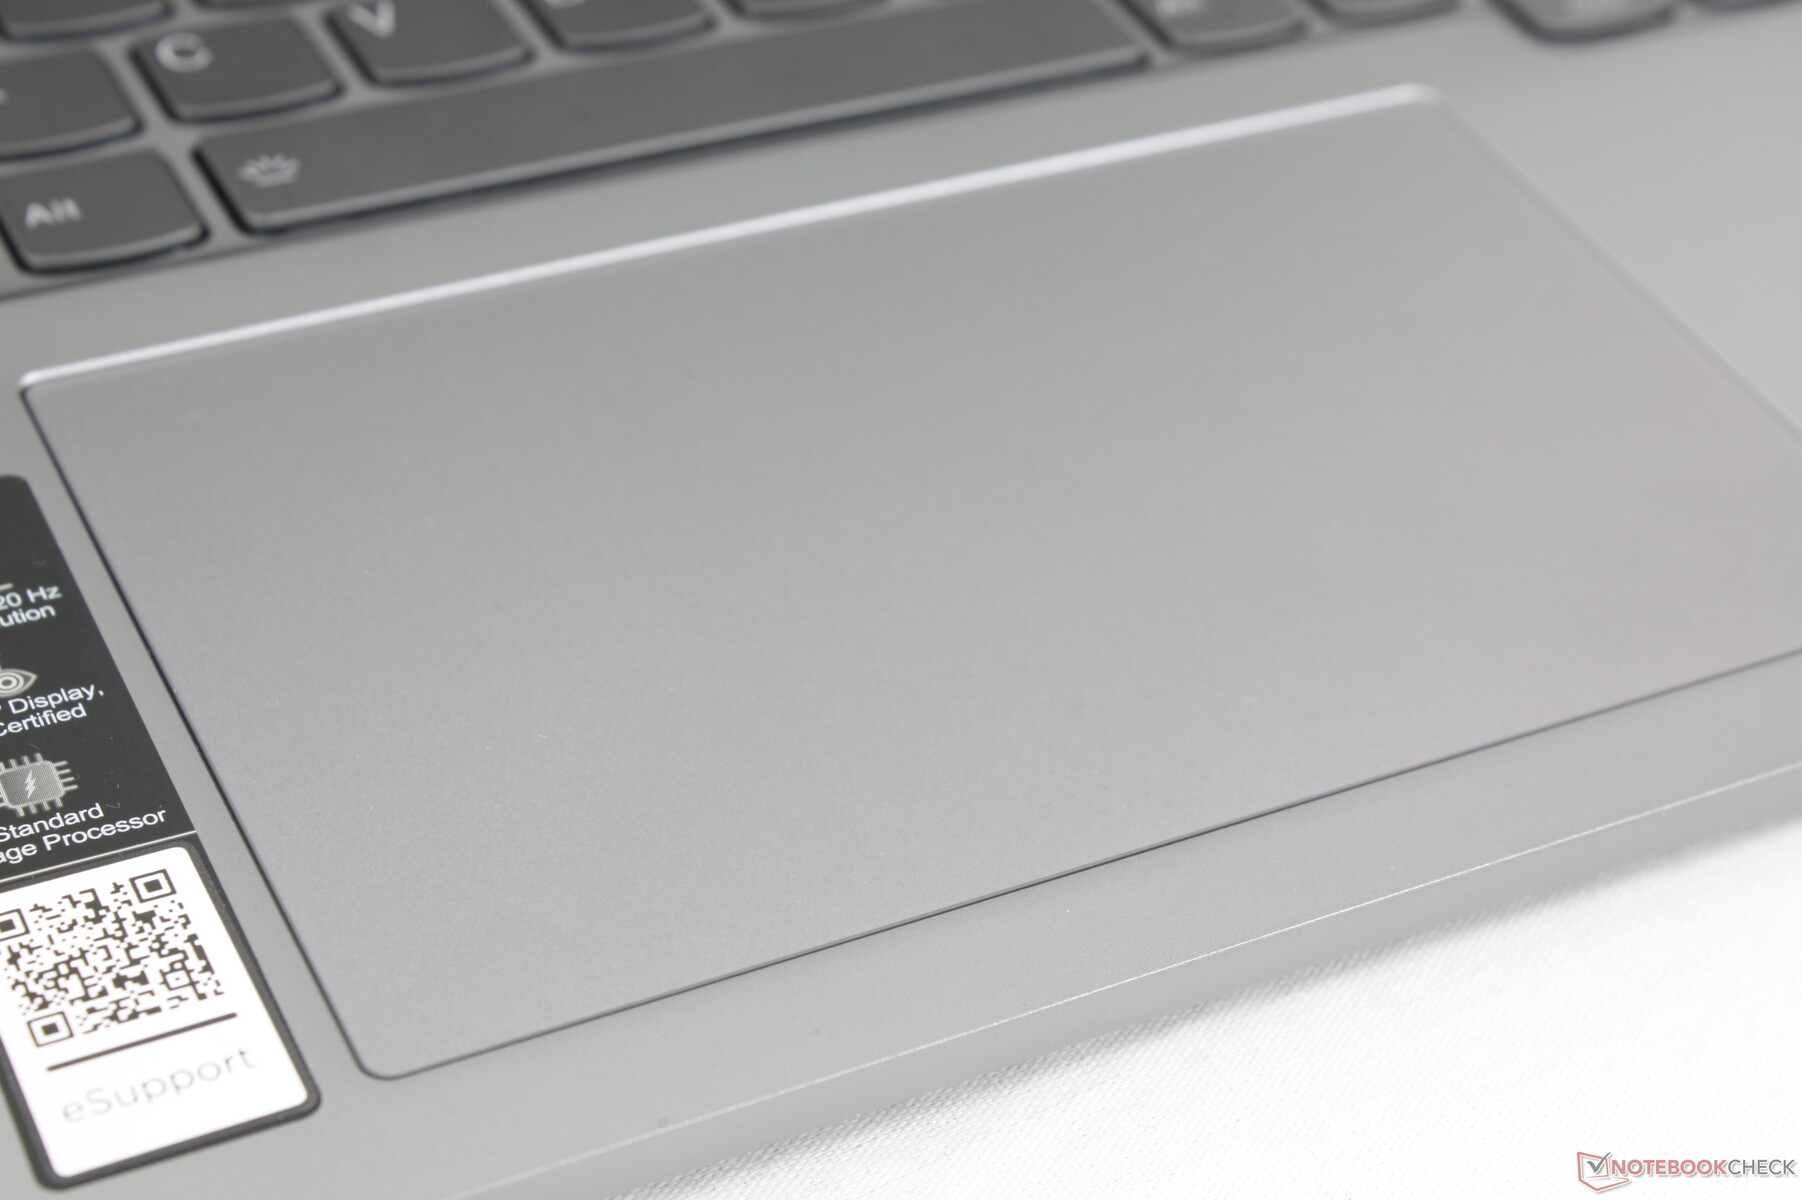
Klawiatura i panel dotykowy
Klawiatury w modelach IdeaPad są płytsze i mają słabsze sprzężenie zwrotne niż klawiatury w modelach ThinkPad. Choć są one użyteczne, wrażenia z pisania są z pewnością krokiem w dół w porównaniu z najlepszymi rozwiązaniami Lenovo, które są bliższe tańszym systemom, nawet w najwyższej konfiguracji za 1500 USD.

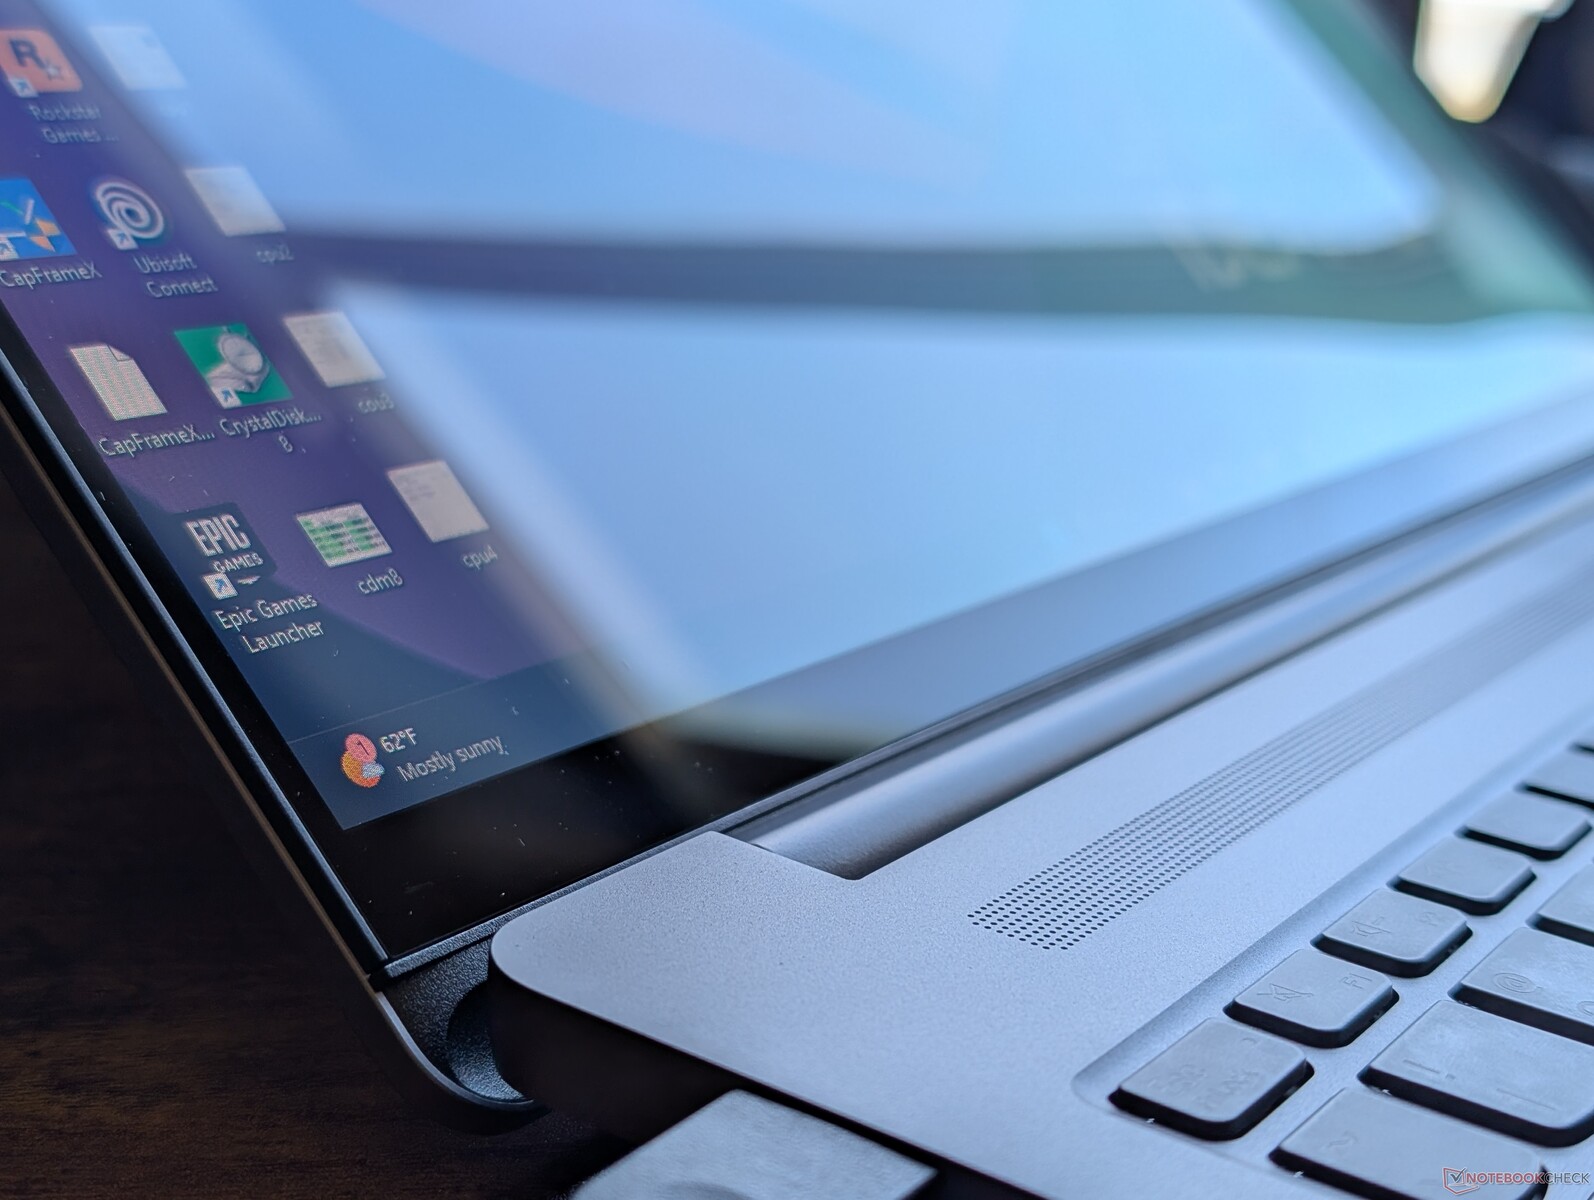
Wyświetlacz - od IPS do OLED

Dostępne są dwie opcje wyświetlania:
- 2560 x 1600, IPS, 120 Hz, bezdotykowy
- 2048 x 1280, OLED, 120 Hz, dotykowy
W przeciwieństwie do większości innych laptopów, opcja OLED niekoniecznie jest tutaj lepsza niż opcja IPS, ponieważ zamienia wyższą natywną rozdzielczość na głębsze kolory i lepszą obsługę HDR. Jeśli Państwa zadania polegają głównie na pracy z arkuszami kalkulacyjnymi lub wielozadaniowości, to panel IPS o wyższej rozdzielczości może okazać się bardziej produktywny. W przypadku zadań takich jak odtwarzanie wideo lub edycja wideo, głębsze kolory i ciemniejszy kontrast OLED mogą poprawić wrażenia.
Rozdzielczość 1280p jest jednak niższa niż w innych 16-calowych laptopach, takich jak Asus Zenbook S 16envy x360 2-in-1 16 czy Galaxy Book4 Ultra, które wyposażone są w panele OLED o rozdzielczości 1800p. Jest to prawdopodobnie zamierzone, aby zachęcić kupujących do rozważenia wyższej klasy serii Yoga Pro 9 16 G9 ale nadal sprawia, że IdeaPad Pro 5 16 G9 jest nieco mniej atrakcyjny w porównaniu do swoich bezpośrednich konkurentów.

| |||||||||||||||||||||||||
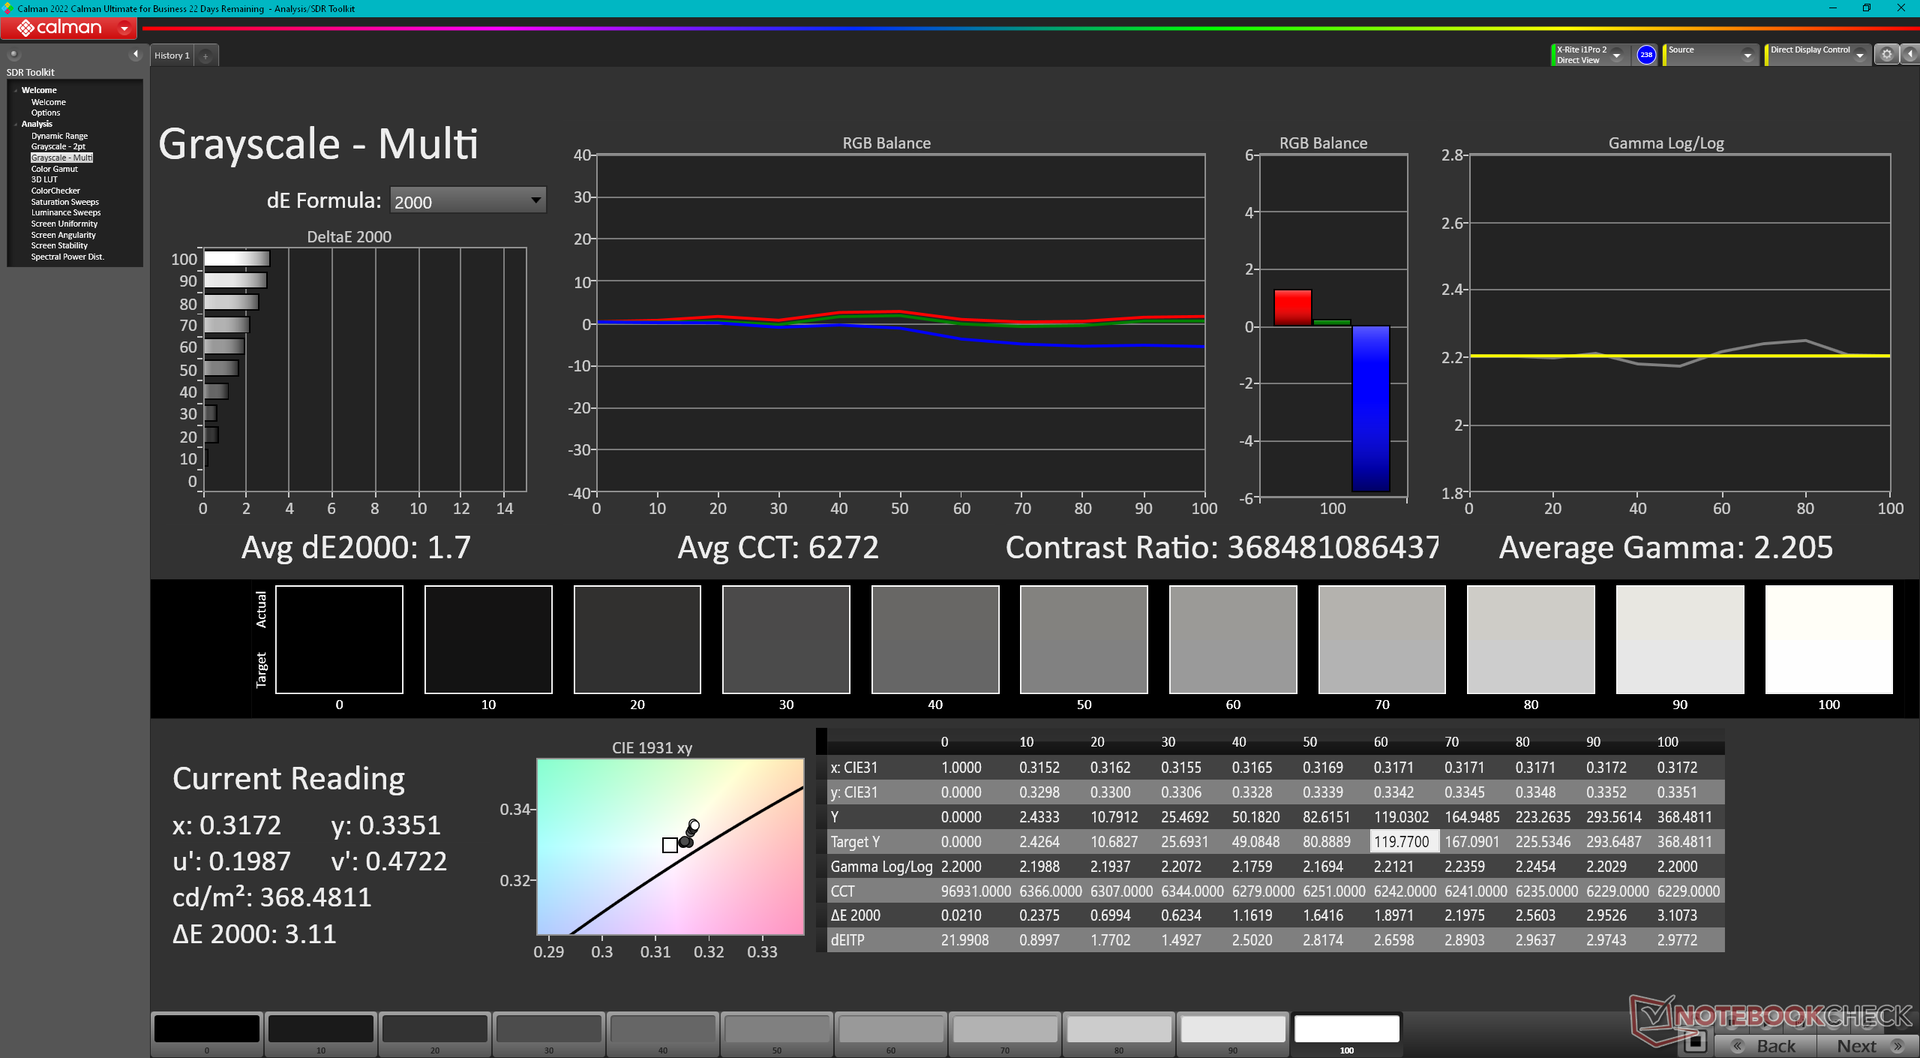
rozświetlenie: 98 %
na akumulatorze: 367.6 cd/m²
kontrast: ∞:1 (czerń: 0 cd/m²)
ΔE Color 4.31 | 0.5-29.43 Ø4.87, calibrated: 1.11
ΔE Greyscale 1.7 | 0.5-98 Ø5.1
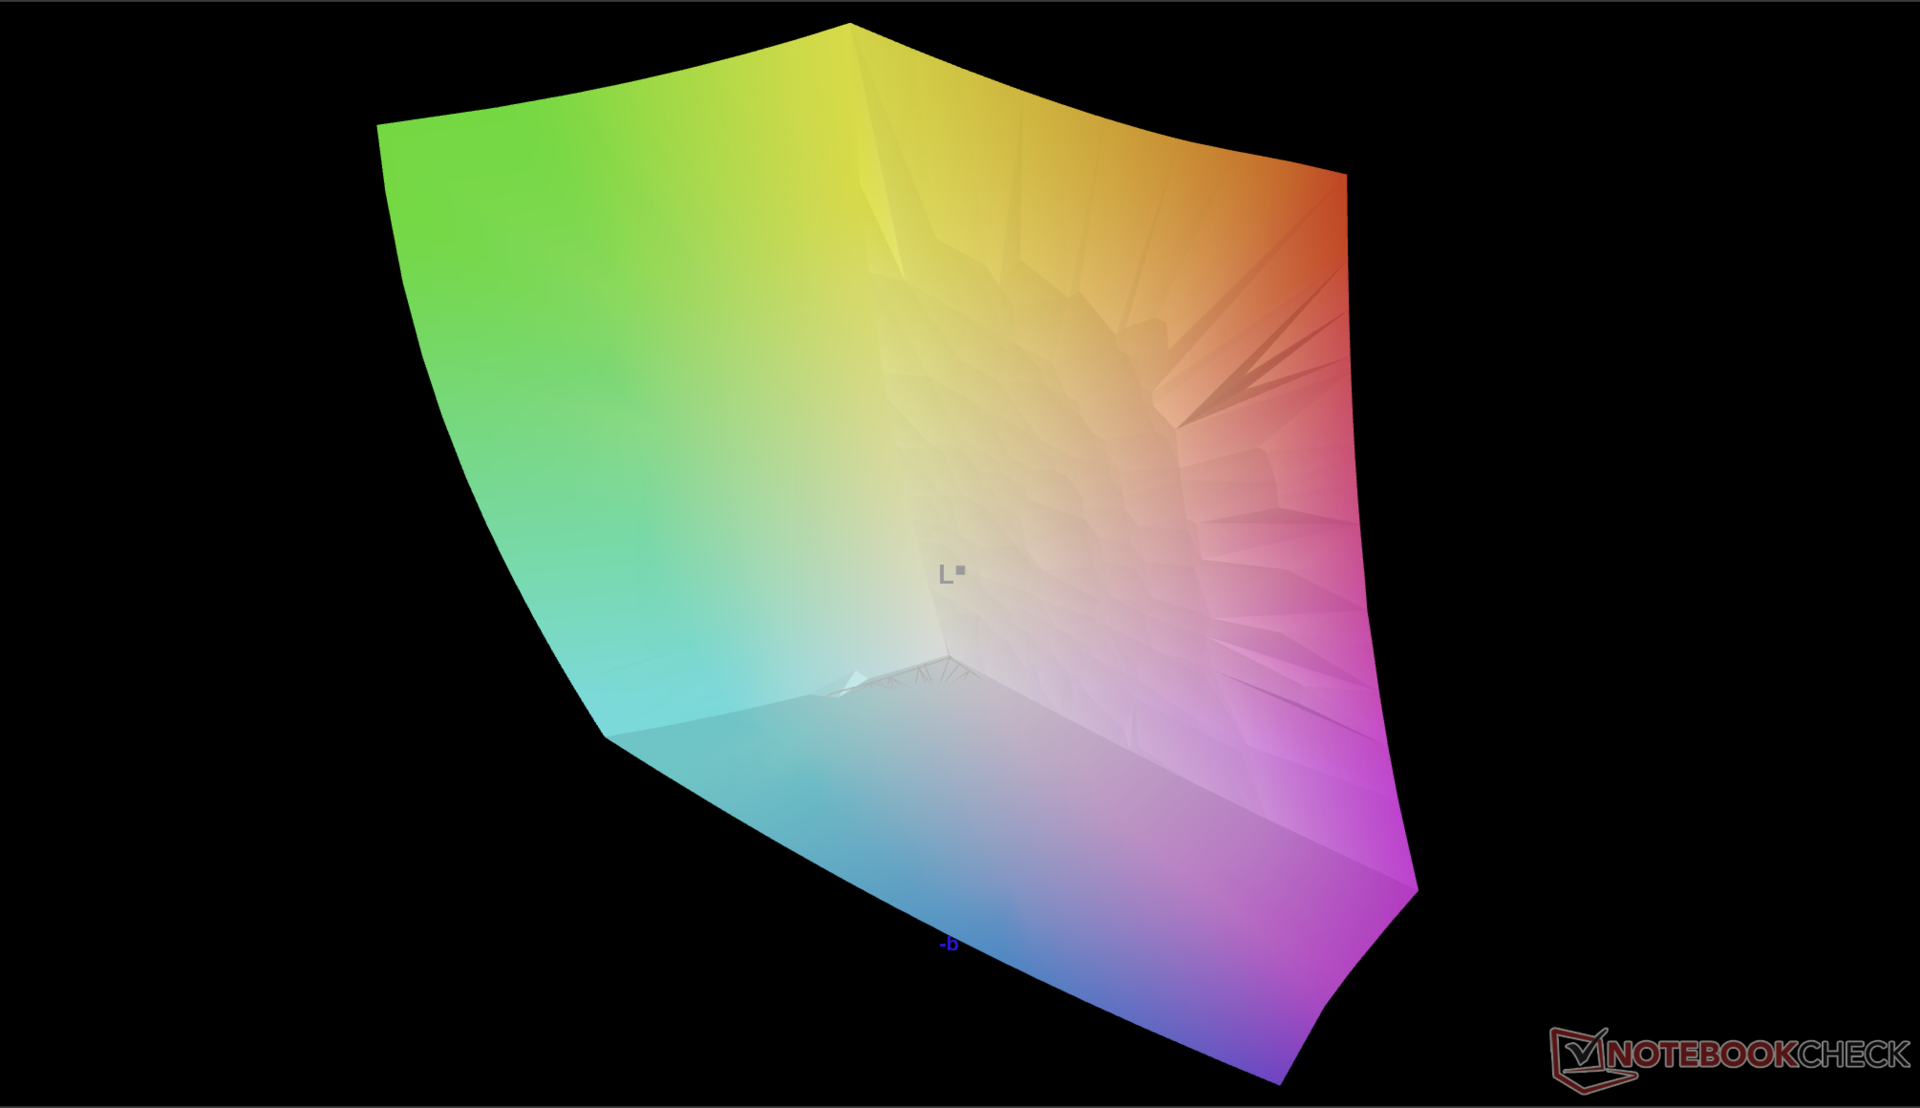
97.8% AdobeRGB 1998 (Argyll 2.2.0 3D)
100% sRGB (Argyll 2.2.0 3D)
99.7% Display P3 (Argyll 2.2.0 3D)
Gamma: 2.2
| Lenovo IdeaPad Pro 5 16IMH G9 RTX 4050 LEN1602K, OLED, 2048x1280, 16", 120 Hz | Lenovo IdeaPad Pro 5 16IMH G9 NE160QDM-NY2, IPS, 2560x1600, 16", 120 Hz | Dell Inspiron 16 7640 2-in-1 AU Optronics B160QAT, Mini-LED, 2560x1600, 16", 90 Hz | Asus Zenbook S 16 UM5606-RK333W ATNA60CL10-0, OLED, 2880x1800, 16", 120 Hz | HP Envy x360 2-in-1 16-ad0097nr Samsung SDC41A6, OLED, 2880x1800, 16", 120 Hz | Samsung Galaxy Book4 Ultra ATNA60CL07-0, OLED, 2880x1800, 16", 120 Hz | |
|---|---|---|---|---|---|---|
| Display | -25% | -2% | -1% | -0% | -4% | |
| Display P3 Coverage | 99.7 | 63.3 -37% | 99.4 0% | 99.9 0% | 99.6 0% | 98.6 -1% |
| sRGB Coverage | 100 | 95.2 -5% | 100 0% | 100 0% | 100 0% | 99.9 0% |
| AdobeRGB 1998 Coverage | 97.8 | 65.3 -33% | 92.5 -5% | 95.6 -2% | 96.5 -1% | 88.5 -10% |
| Response Times | -1708% | -2489% | 46% | 26% | 13% | |
| Response Time Grey 50% / Grey 80% * | 0.58 ? | 15 ? -2486% | 15.4 ? -2555% | 0.56 ? 3% | 0.8 ? -38% | 0.54 ? 7% |
| Response Time Black / White * | 1 ? | 10.3 ? -930% | 60.6 ? -5960% | 0.65 ? 35% | 0.89 ? 11% | 0.69 ? 31% |
| PWM Frequency | 240 ? | 2753.7 ? 1047% | 480 100% | 491.8 ? 105% | 240 ? 0% | |
| Screen | -14% | -21% | 43% | 10% | 20% | |
| Brightness middle | 367.6 | 368 0% | 413 12% | 407 11% | 399.4 9% | 390 6% |
| Brightness | 371 | 368 -1% | 409 10% | 405 9% | 405 9% | 393 6% |
| Brightness Distribution | 98 | 91 -7% | 97 -1% | 97 -1% | 98 0% | 98 0% |
| Black Level * | 0.31 | 0.14 | 0.02 | |||
| Colorchecker dE 2000 * | 4.31 | 2.4 44% | 3.48 19% | 0.6 86% | 4.05 6% | 1.4 68% |
| Colorchecker dE 2000 max. * | 6.85 | 6.5 5% | 6.97 -2% | 1.2 82% | 6.69 2% | 2.7 61% |
| Colorchecker dE 2000 calibrated * | 1.11 | 0.8 28% | 1.02 8% | |||
| Greyscale dE 2000 * | 1.7 | 4.5 -165% | 4.5 -165% | 0.5 71% | 1.1 35% | 2.1 -24% |
| Gamma | 2.2 100% | 2.21 100% | 2.15 102% | 2.2 100% | 2.27 97% | 2.27 97% |
| CCT | 6272 104% | 6324 103% | 6446 101% | 6453 101% | 6419 101% | 6431 101% |
| Contrast | 1187 | 2950 | 20350 | |||
| Całkowita średnia (program / ustawienia) | -582% /
-299% | -837% /
-633% | 29% /
33% | 12% /
11% | 10% /
12% |
* ... im mniej tym lepiej

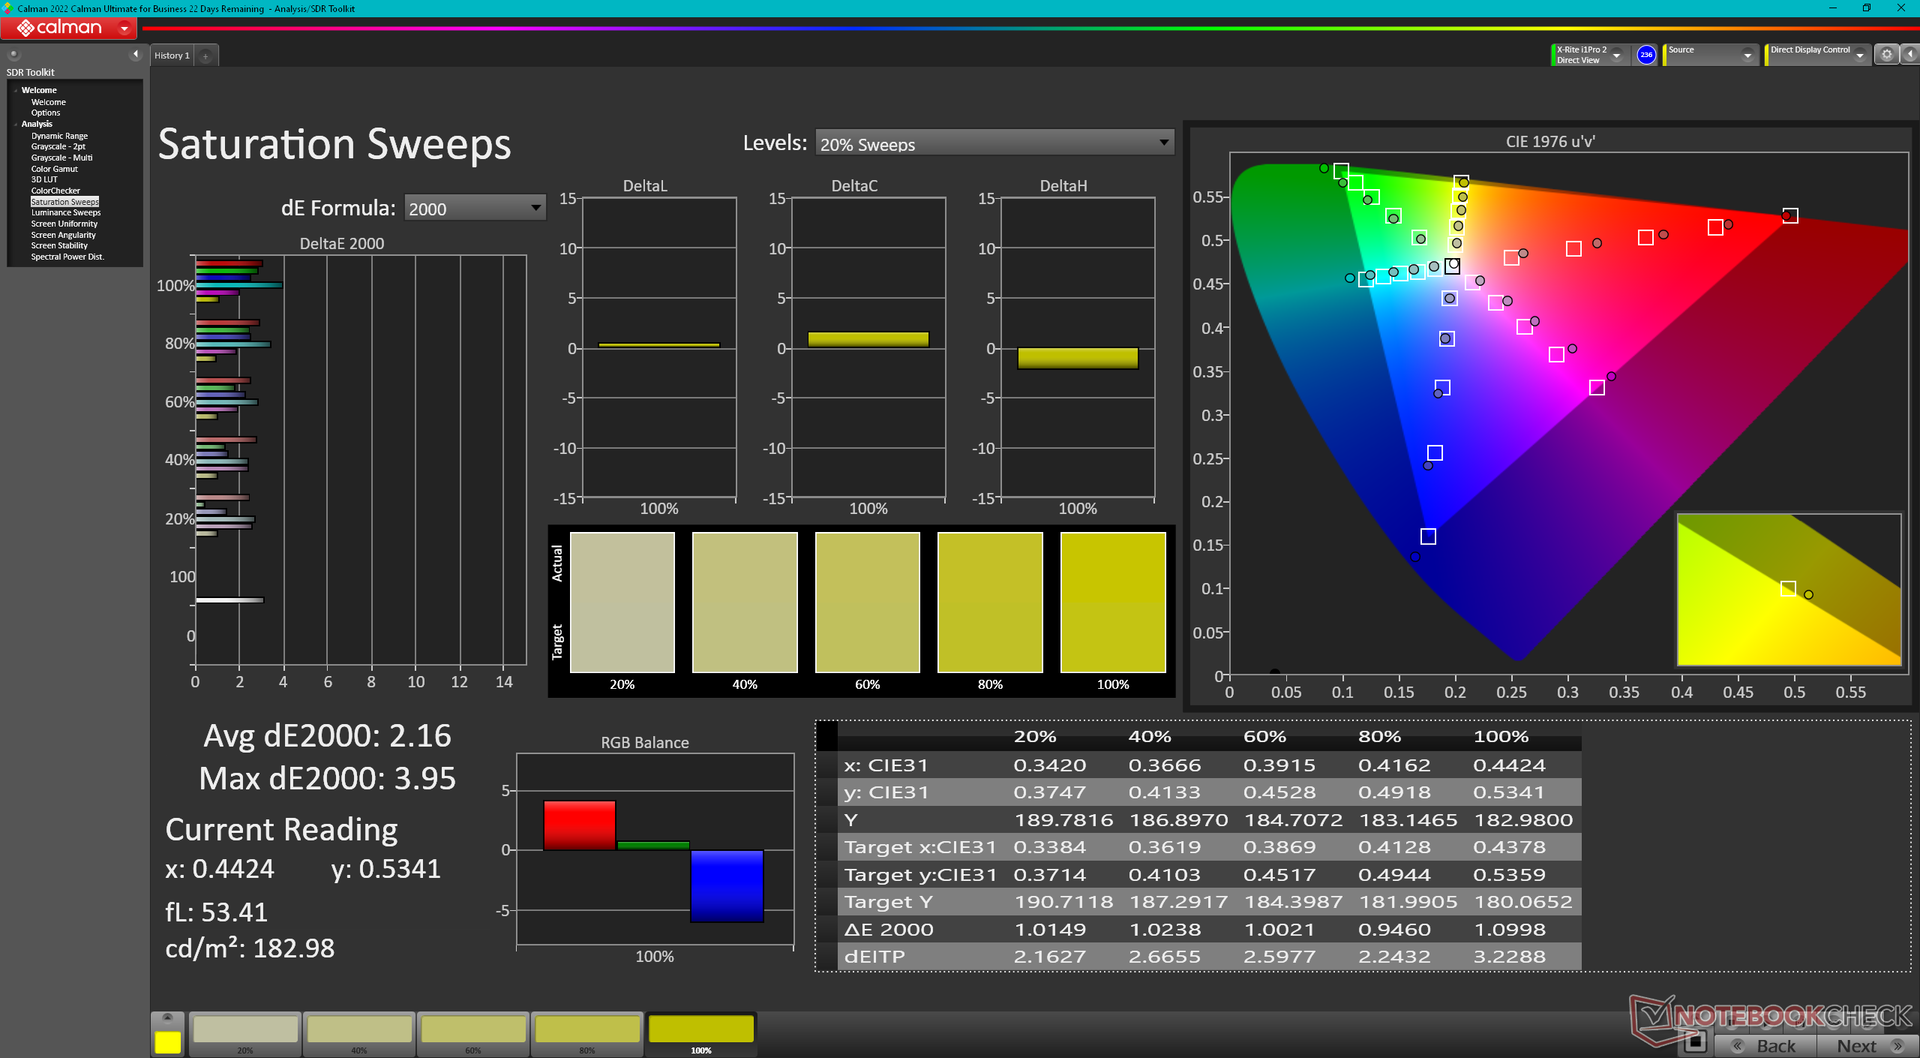
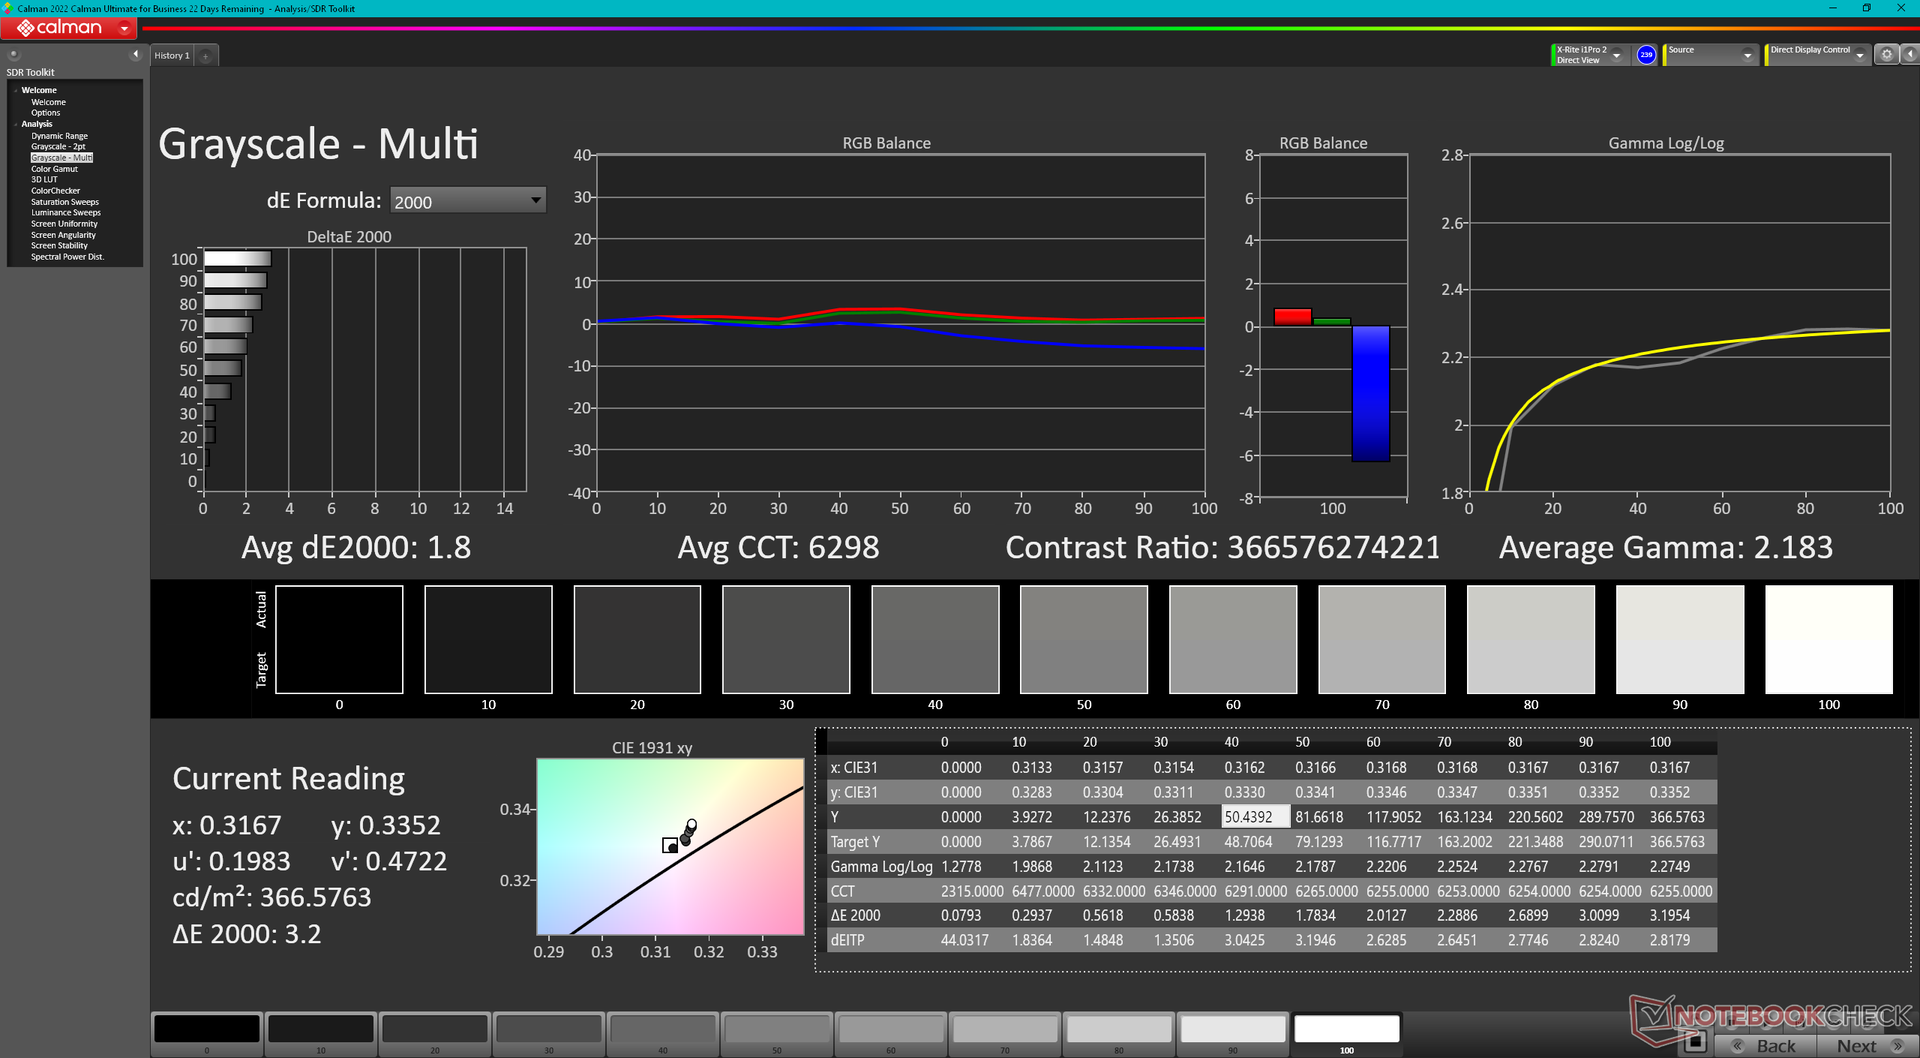
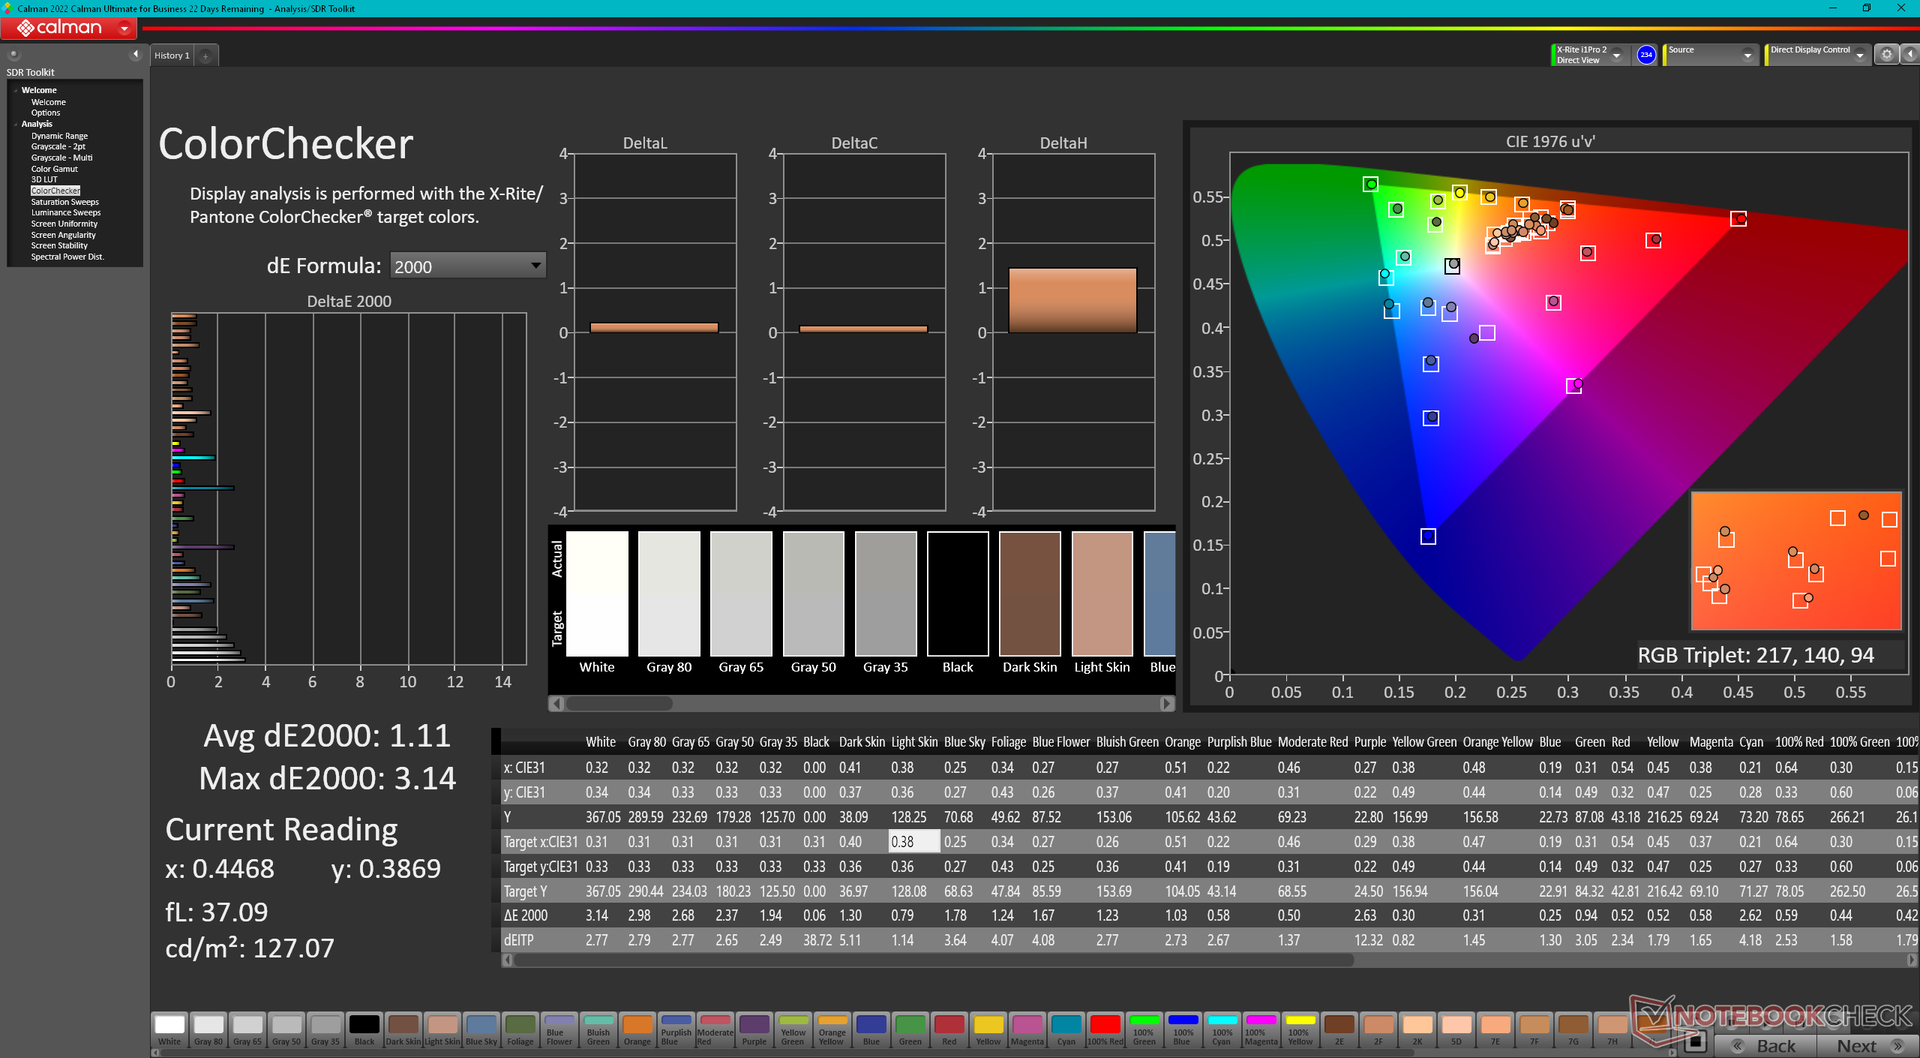
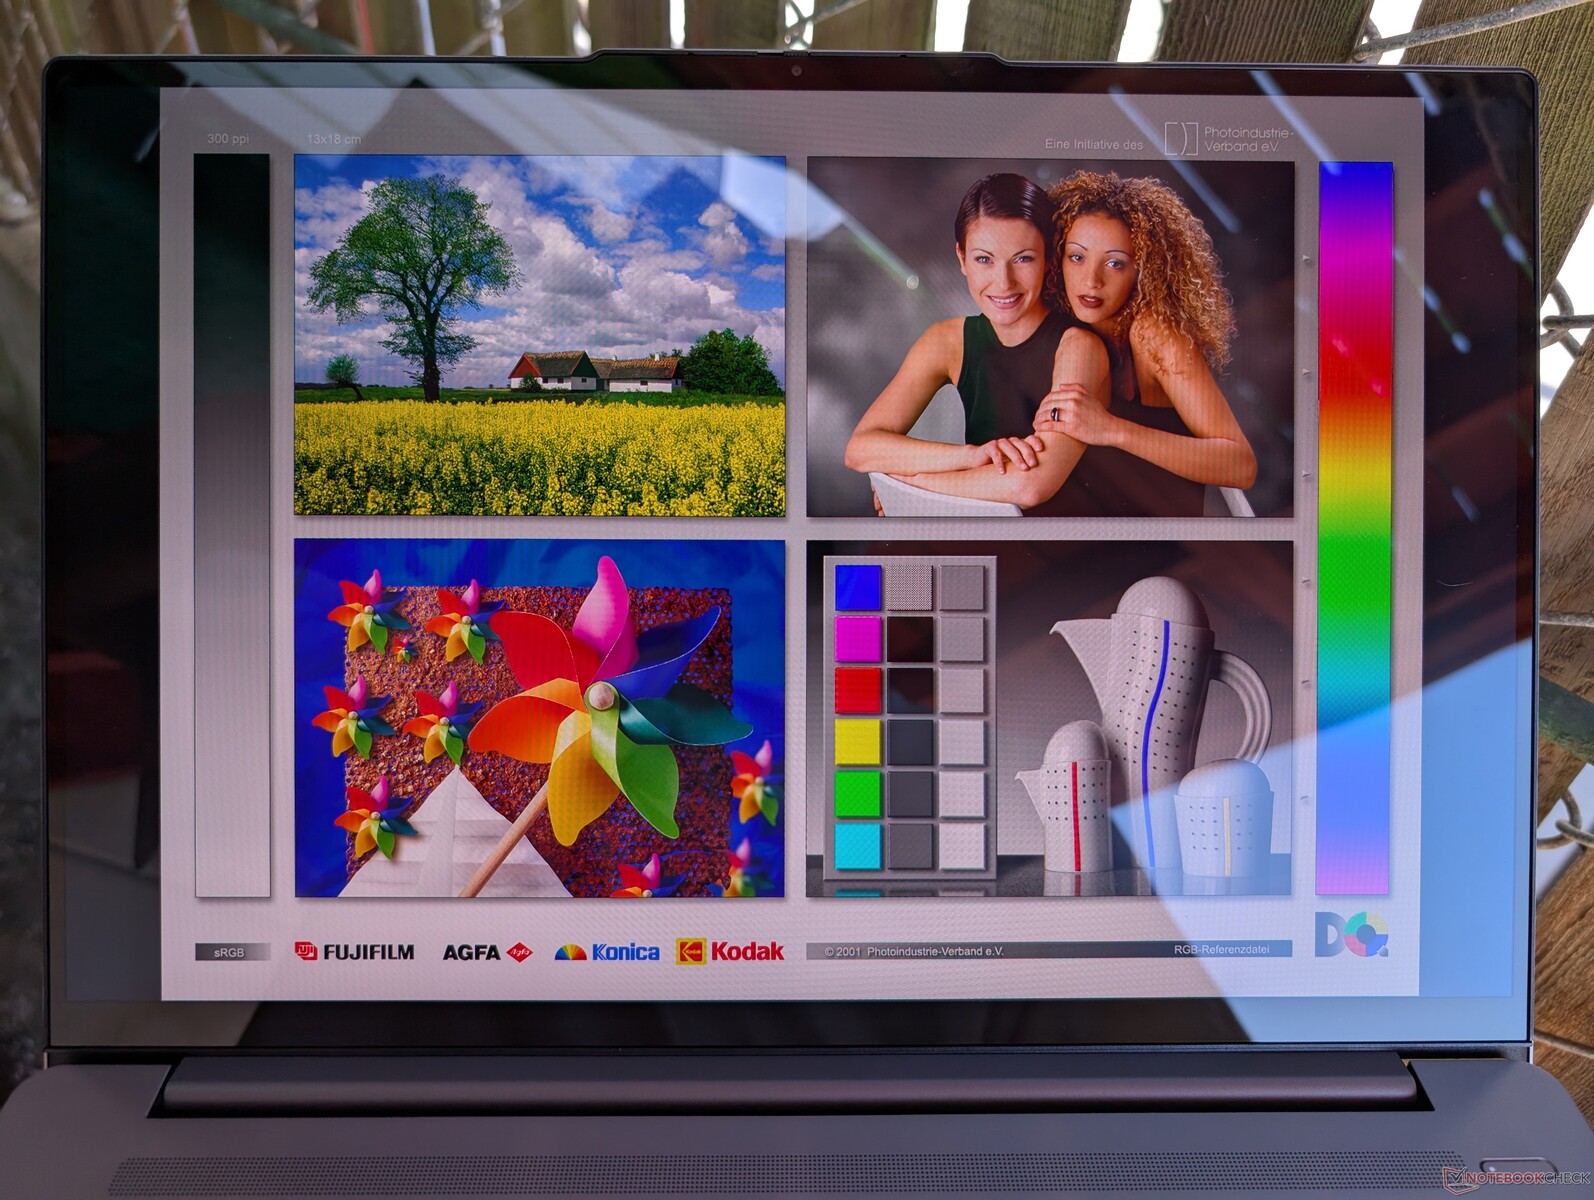
Mimo że wyświetlacz nie został skalibrowany fabrycznie, jego dokładność względem standardu P3 jest przyzwoita, a średnie wartości deltaE dla skali szarości i kolorów wynoszą odpowiednio 1,7 i 4,31.

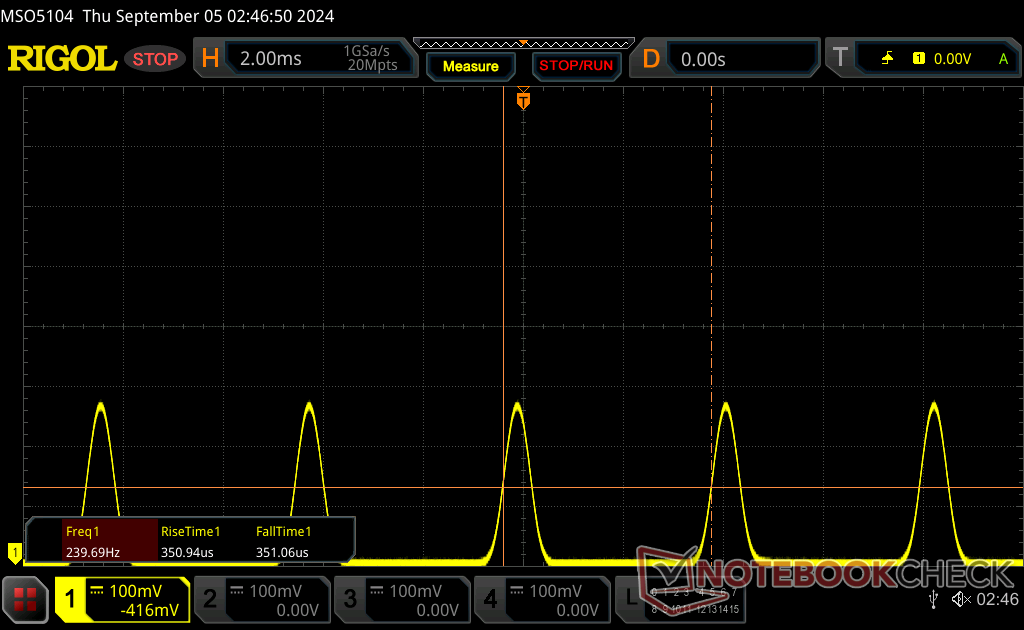
Wyświetl czasy reakcji
| ↔ Czas reakcji od czerni do bieli | ||
|---|---|---|
| 1 ms ... wzrost ↗ i spadek ↘ łącznie | ↗ 0.56 ms wzrost | 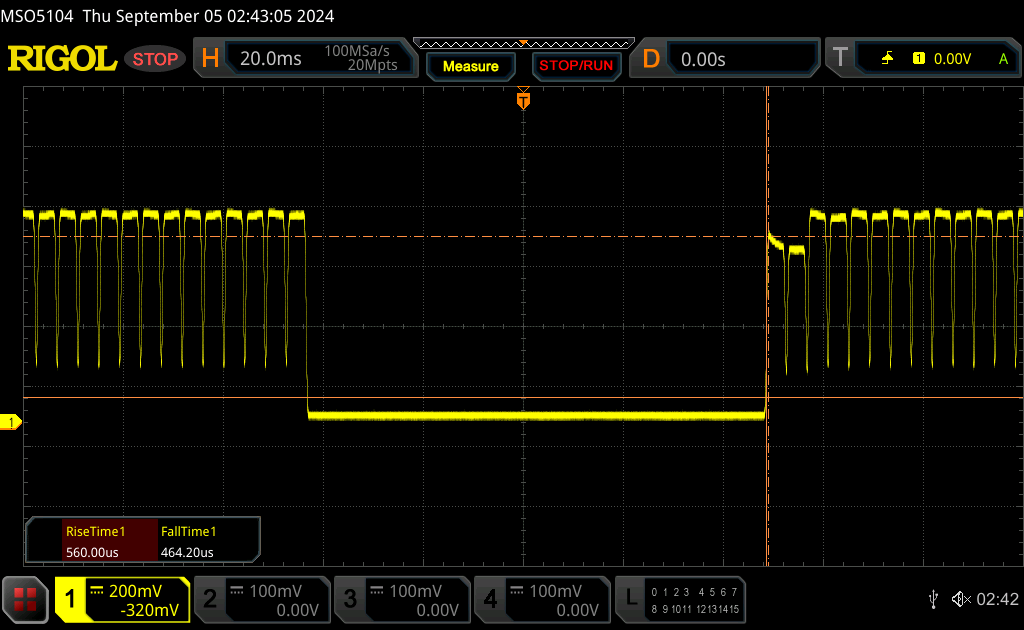 |
| ↘ 0.44 ms upadek | ||
| W naszych testach ekran wykazuje bardzo szybką reakcję i powinien bardzo dobrze nadawać się do szybkich gier. Dla porównania, wszystkie testowane urządzenia wahają się od 0.1 (minimum) do 240 (maksimum) ms. » 2 % wszystkich urządzeń jest lepszych. Oznacza to, że zmierzony czas reakcji jest lepszy od średniej wszystkich testowanych urządzeń (20.8 ms). | ||
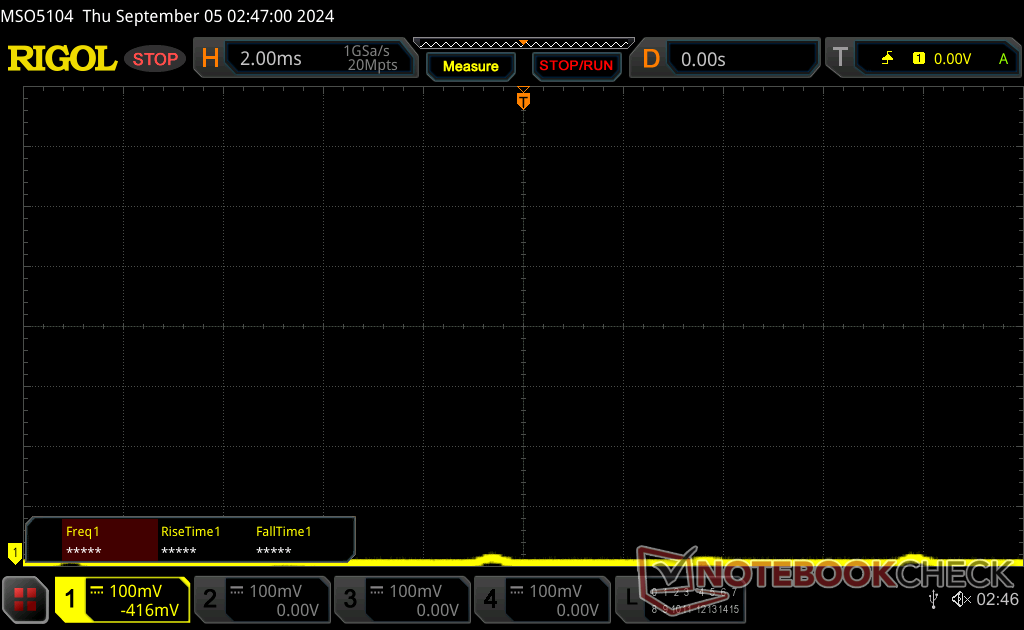
| ↔ Czas reakcji 50% szarości do 80% szarości | ||
| 0.58 ms ... wzrost ↗ i spadek ↘ łącznie | ↗ 0.28 ms wzrost |  |
| ↘ 0.3 ms upadek | ||
| W naszych testach ekran wykazuje bardzo szybką reakcję i powinien bardzo dobrze nadawać się do szybkich gier. Dla porównania, wszystkie testowane urządzenia wahają się od 0.165 (minimum) do 636 (maksimum) ms. » 1 % wszystkich urządzeń jest lepszych. Oznacza to, że zmierzony czas reakcji jest lepszy od średniej wszystkich testowanych urządzeń (32.5 ms). | ||
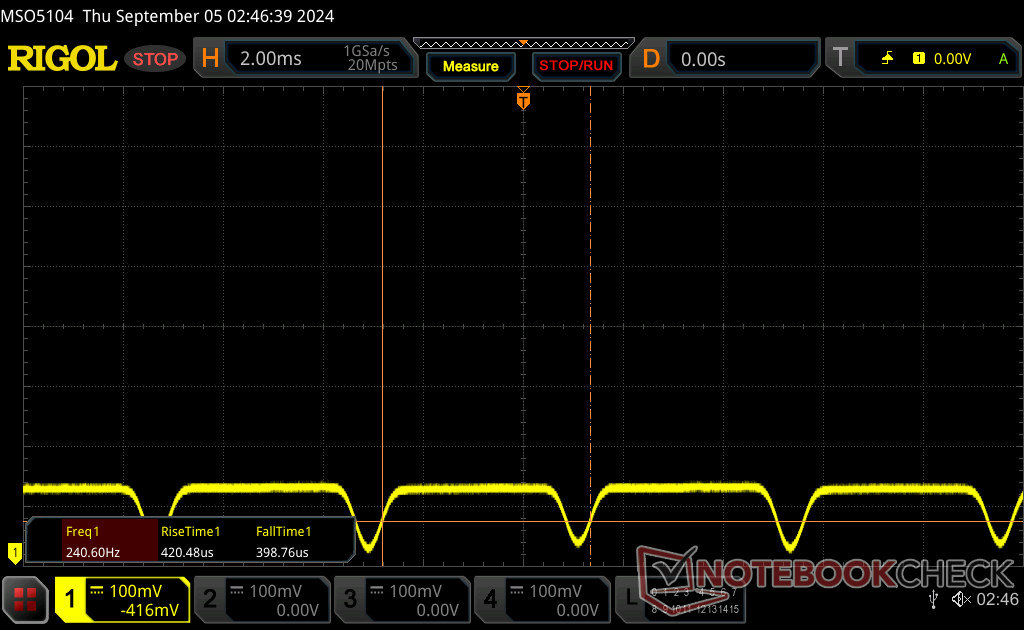
Migotanie ekranu / PWM (modulacja szerokości impulsu)
| Wykryto migotanie ekranu/wykryto PWM | 240 Hz Amplitude: 38 % | ≤ 100 % ustawienia jasności | 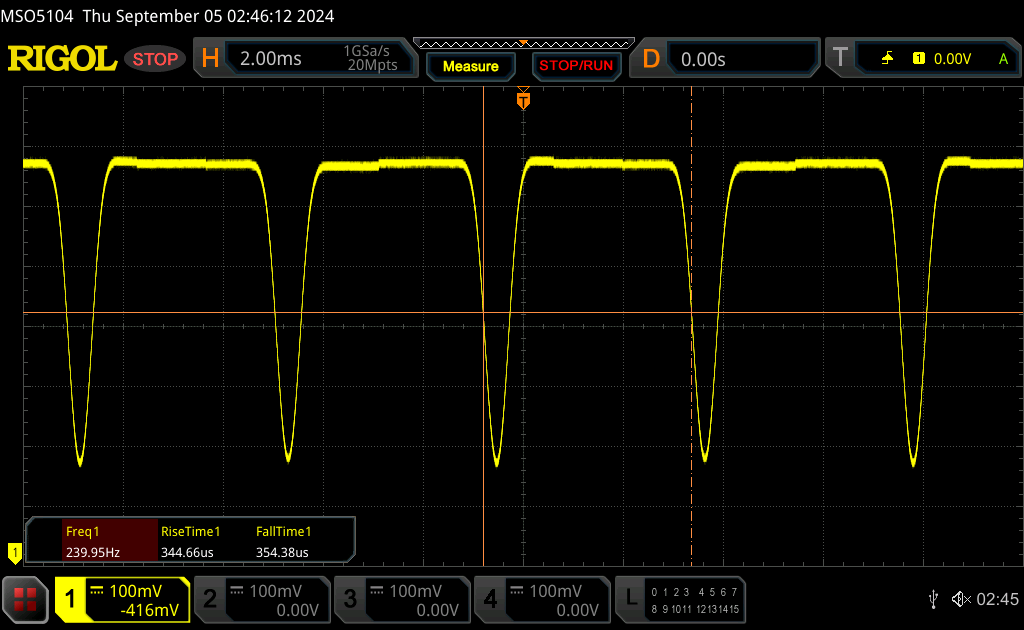 |
Podświetlenie wyświetlacza miga z częstotliwością 240 Hz (najgorszy przypadek, np. przy użyciu PWM) Wykryto migotanie przy ustawieniu jasności 100 % i poniżej. Powyżej tego ustawienia jasności nie powinno być żadnego migotania ani PWM. Częstotliwość 240 Hz jest stosunkowo niska, więc wrażliwi użytkownicy prawdopodobnie zauważą migotanie i odczują zmęczenie oczu przy podanym ustawieniu jasności i poniżej. Dla porównania: 53 % wszystkich testowanych urządzeń nie używa PWM do przyciemniania wyświetlacza. Jeśli wykryto PWM, zmierzono średnio 8516 (minimum: 5 - maksimum: 343500) Hz. | |||
Częstotliwość modulacji szerokości impulsu 240 Hz jest wykrywalna i spójna na wszystkich poziomach jasności.
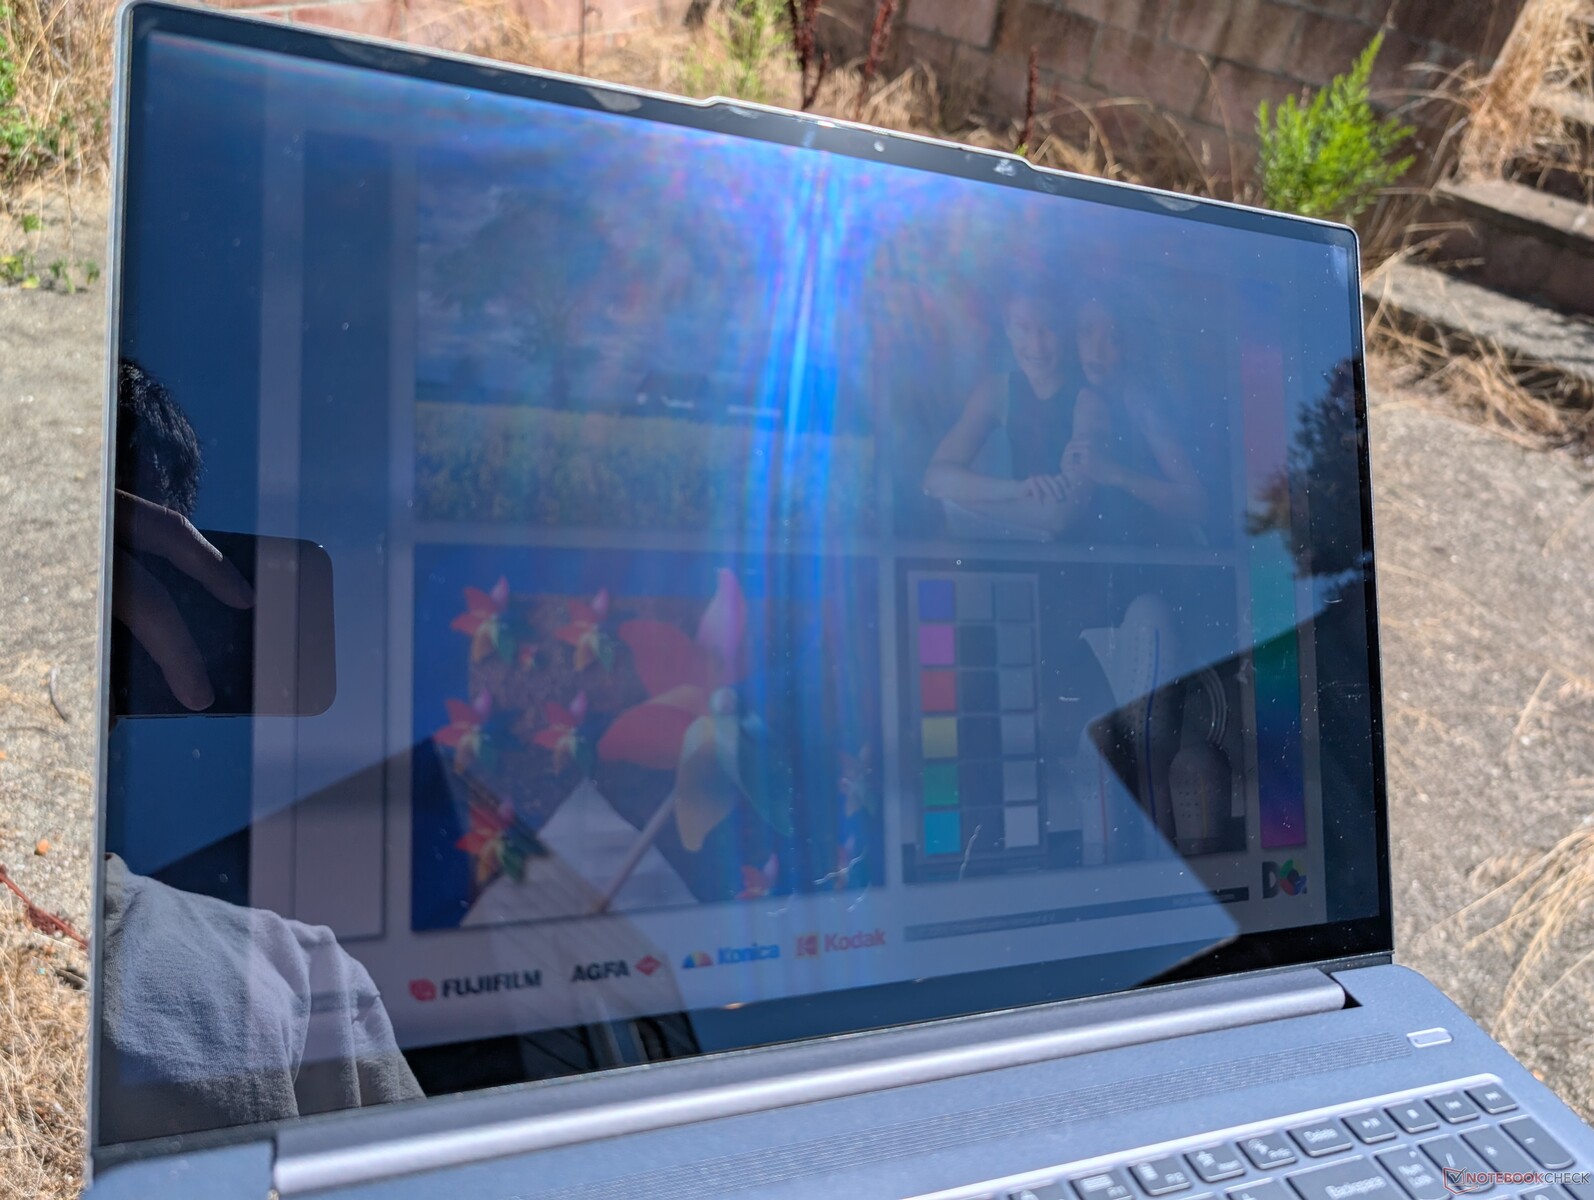
Opcja OLED niekoniecznie jest lepsza do oglądania na zewnątrz niż opcja IPS, ponieważ ich maksymalne poziomy jasności są mniej więcej takie same. Jeśli już, konfiguracja OLED jest gorsza ze względu na błyszczącą nakładkę, podczas gdy konfiguracja IPS jest matowa, aby zmniejszyć odblaski.

Wydajność - Core Ultra 9 to potęga
Warunki testowania
Przed uruchomieniem poniższych testów porównawczych ustawiliśmy zarówno system Windows, jak i Lenovo Vantage na tryb wydajności. Obsługiwany jest tylko Optimus 1.0 bez opcji G-Sync, MUX lub Windows VRR.

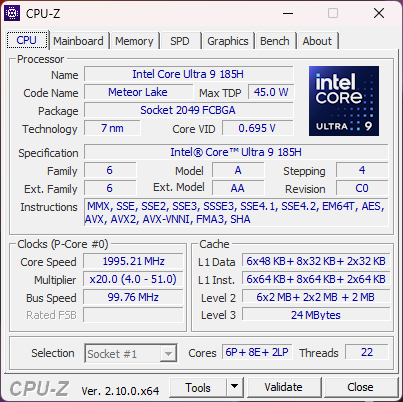
Procesor
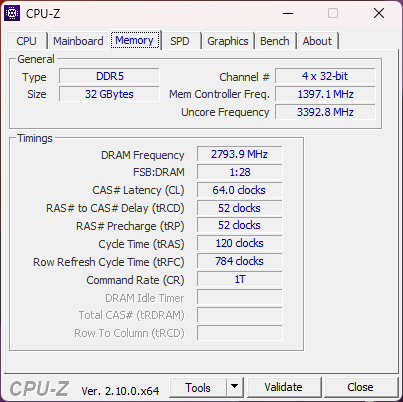
Dostępne są trzy opcje procesorów Meteor Lake: Core Ultra 5 125H, Core Ultra 7 155Hi Core Ultra 9 185H. Przeskok z Core Ultra 5 na Core Ultra 7 zapewnia znaczący 80-procentowy wzrost wydajności, podczas gdy przeskok z Core Ultra 7 na Core Ultra 9 dodaje tylko kolejne 5 do 10 procent, co jest praktycznie niezauważalne w większości scenariuszy użytkowania. Tym samym, o ile nie chcą Państwo za wszelką cenę uzyskać najlepszych z najlepszych, to opcja Core Ultra 7 będzie wystarczająca dla zdecydowanej większości użytkowników, zwłaszcza że nadal jest szybsza niż większość innych opcji w tej kategorii wielkości.
Surowa wydajność wyprzedza konkurencyjne procesory AMD, w tym Ryzen 7 8840HS i najnowszy Ryzen AI 9 HX 370. Seria Raptor Lake Core i7 HX może być jeszcze szybsza, ale procesorom tym brakuje zintegrowanej jednostki NPU do akceleracji kompatybilnych zadań AI. Proszę zauważyć, że Co-Pilot Plus nie jest niestety kompatybilny z procesorami Meteor Lake.
Cinebench R15 Multi Loop
Cinebench R23: Multi Core | Single Core
Cinebench R20: CPU (Multi Core) | CPU (Single Core)
Cinebench R15: CPU Multi 64Bit | CPU Single 64Bit
Blender: v2.79 BMW27 CPU
7-Zip 18.03: 7z b 4 | 7z b 4 -mmt1
Geekbench 6.4: Multi-Core | Single-Core
Geekbench 5.5: Multi-Core | Single-Core
HWBOT x265 Benchmark v2.2: 4k Preset
LibreOffice : 20 Documents To PDF
R Benchmark 2.5: Overall mean
* ... im mniej tym lepiej
AIDA64: FP32 Ray-Trace | FPU Julia | CPU SHA3 | CPU Queen | FPU SinJulia | FPU Mandel | CPU AES | CPU ZLib | FP64 Ray-Trace | CPU PhotoWorxx
| Performance Rating | |
| Asus Zenbook S 16 UM5606-RK333W | |
| Lenovo IdeaPad Pro 5 16IMH G9 RTX 4050 | |
| Lenovo IdeaPad Pro 5 16IMH G9 | |
| Przeciętny Intel Core Ultra 9 185H | |
| HP Envy x360 2-in-1 16-ad0097nr | |
| Dell Inspiron 16 7640 2-in-1 | |
| Samsung Galaxy Book4 Ultra | |
| AIDA64 / FP32 Ray-Trace | |
| Asus Zenbook S 16 UM5606-RK333W | |
| HP Envy x360 2-in-1 16-ad0097nr | |
| Lenovo IdeaPad Pro 5 16IMH G9 RTX 4050 | |
| Lenovo IdeaPad Pro 5 16IMH G9 | |
| Przeciętny Intel Core Ultra 9 185H (9220 - 18676, n=19) | |
| Dell Inspiron 16 7640 2-in-1 | |
| Samsung Galaxy Book4 Ultra | |
| AIDA64 / FPU Julia | |
| Asus Zenbook S 16 UM5606-RK333W | |
| Lenovo IdeaPad Pro 5 16IMH G9 RTX 4050 | |
| Lenovo IdeaPad Pro 5 16IMH G9 | |
| Przeciętny Intel Core Ultra 9 185H (48865 - 96463, n=19) | |
| HP Envy x360 2-in-1 16-ad0097nr | |
| Dell Inspiron 16 7640 2-in-1 | |
| Samsung Galaxy Book4 Ultra | |
| AIDA64 / CPU SHA3 | |
| Asus Zenbook S 16 UM5606-RK333W | |
| Lenovo IdeaPad Pro 5 16IMH G9 RTX 4050 | |
| Przeciętny Intel Core Ultra 9 185H (2394 - 4534, n=19) | |
| Lenovo IdeaPad Pro 5 16IMH G9 | |
| HP Envy x360 2-in-1 16-ad0097nr | |
| Dell Inspiron 16 7640 2-in-1 | |
| Samsung Galaxy Book4 Ultra | |
| AIDA64 / CPU Queen | |
| HP Envy x360 2-in-1 16-ad0097nr | |
| Lenovo IdeaPad Pro 5 16IMH G9 RTX 4050 | |
| Przeciętny Intel Core Ultra 9 185H (66785 - 95241, n=19) | |
| Dell Inspiron 16 7640 2-in-1 | |
| Lenovo IdeaPad Pro 5 16IMH G9 | |
| Asus Zenbook S 16 UM5606-RK333W | |
| Samsung Galaxy Book4 Ultra | |
| AIDA64 / FPU SinJulia | |
| Asus Zenbook S 16 UM5606-RK333W | |
| HP Envy x360 2-in-1 16-ad0097nr | |
| Lenovo IdeaPad Pro 5 16IMH G9 RTX 4050 | |
| Lenovo IdeaPad Pro 5 16IMH G9 | |
| Przeciętny Intel Core Ultra 9 185H (7255 - 11392, n=19) | |
| Dell Inspiron 16 7640 2-in-1 | |
| Samsung Galaxy Book4 Ultra | |
| AIDA64 / FPU Mandel | |
| Asus Zenbook S 16 UM5606-RK333W | |
| Lenovo IdeaPad Pro 5 16IMH G9 RTX 4050 | |
| HP Envy x360 2-in-1 16-ad0097nr | |
| Lenovo IdeaPad Pro 5 16IMH G9 | |
| Przeciętny Intel Core Ultra 9 185H (24004 - 48020, n=19) | |
| Dell Inspiron 16 7640 2-in-1 | |
| Samsung Galaxy Book4 Ultra | |
| AIDA64 / CPU AES | |
| Przeciętny Intel Core Ultra 9 185H (53116 - 154066, n=19) | |
| Lenovo IdeaPad Pro 5 16IMH G9 RTX 4050 | |
| Lenovo IdeaPad Pro 5 16IMH G9 | |
| Dell Inspiron 16 7640 2-in-1 | |
| HP Envy x360 2-in-1 16-ad0097nr | |
| Samsung Galaxy Book4 Ultra | |
| Asus Zenbook S 16 UM5606-RK333W | |
| AIDA64 / CPU ZLib | |
| Lenovo IdeaPad Pro 5 16IMH G9 RTX 4050 | |
| Przeciętny Intel Core Ultra 9 185H (678 - 1341, n=19) | |
| Lenovo IdeaPad Pro 5 16IMH G9 | |
| Asus Zenbook S 16 UM5606-RK333W | |
| Dell Inspiron 16 7640 2-in-1 | |
| Samsung Galaxy Book4 Ultra | |
| HP Envy x360 2-in-1 16-ad0097nr | |
| AIDA64 / FP64 Ray-Trace | |
| Asus Zenbook S 16 UM5606-RK333W | |
| HP Envy x360 2-in-1 16-ad0097nr | |
| Lenovo IdeaPad Pro 5 16IMH G9 RTX 4050 | |
| Lenovo IdeaPad Pro 5 16IMH G9 | |
| Przeciętny Intel Core Ultra 9 185H (4428 - 10078, n=19) | |
| Dell Inspiron 16 7640 2-in-1 | |
| Samsung Galaxy Book4 Ultra | |
| AIDA64 / CPU PhotoWorxx | |
| Lenovo IdeaPad Pro 5 16IMH G9 | |
| Lenovo IdeaPad Pro 5 16IMH G9 RTX 4050 | |
| Samsung Galaxy Book4 Ultra | |
| Asus Zenbook S 16 UM5606-RK333W | |
| Przeciętny Intel Core Ultra 9 185H (44547 - 53918, n=19) | |
| Dell Inspiron 16 7640 2-in-1 | |
| HP Envy x360 2-in-1 16-ad0097nr | |
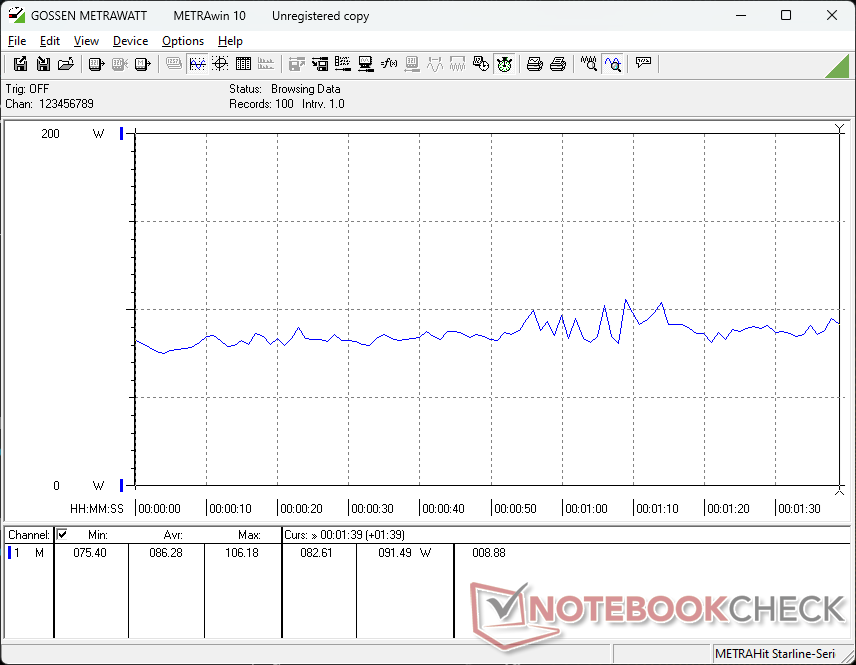
Test warunków skrajnych
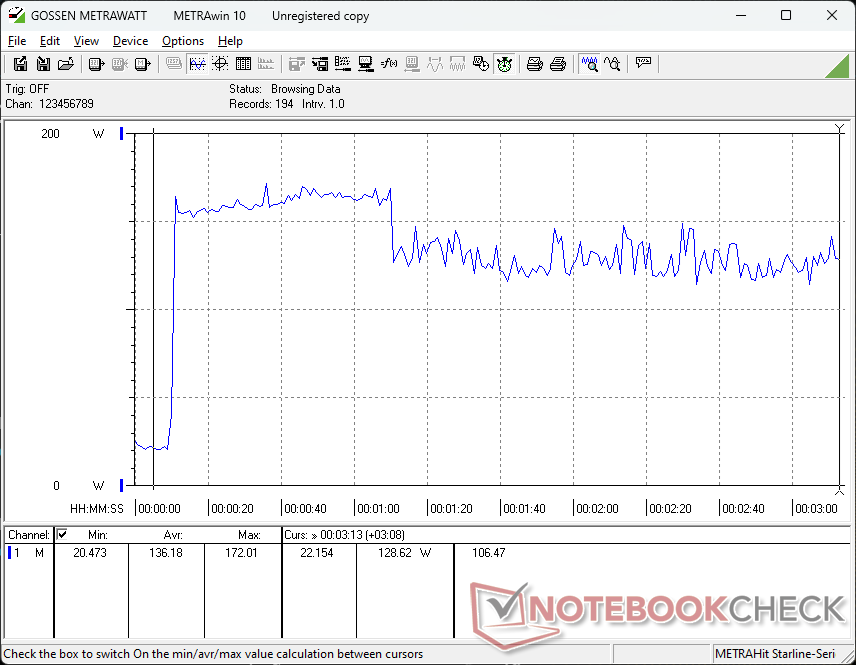
Procesor zwiększyłby taktowanie do 3,2 GHz, 81 W i 94 C podczas inicjowania stresu Prime95. Po około minucie taktowanie spadło do 2,8 GHz i 65 W, aby utrzymać nieco niższą temperaturę rdzenia na poziomie 87 C. Wysoki zakres 80 C jest nadal bardzo ciepły, co sugeruje, że wydajność procesora byłaby prawdopodobnie wyższa, gdyby obudowa była nieco większa i wyposażona w bardziej wydajne rozwiązanie chłodzące.
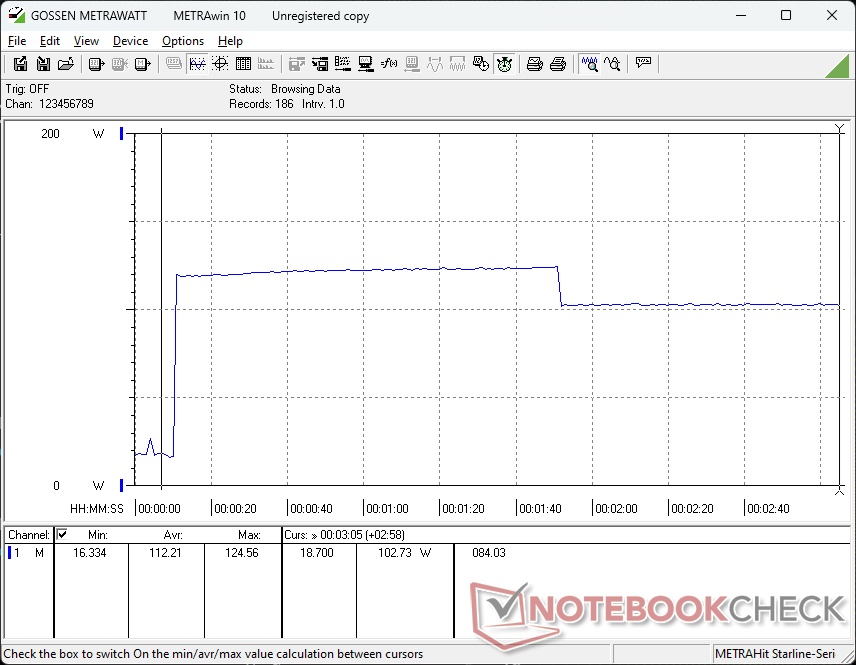
GPU ustabilizowałoby się przy 2595 MHz, 82 C i 80 W podczas uruchamiania Cyberpunk 2077, aby reprezentować typowe obciążenia w grach w porównaniu do zaledwie 71 C i 75 C na Spectre x360 16 lub Lenovo LOQ 15odpowiednio, każdy z tym samym GPU RTX 4050. Ogólnie wyższe temperatury pracy nie są niczym zaskakującym, biorąc pod uwagę cienką konstrukcję obudowy, procesor z serii Core Ultra H i stosunkowo wysoki docelowy poziom 90 W TGP.
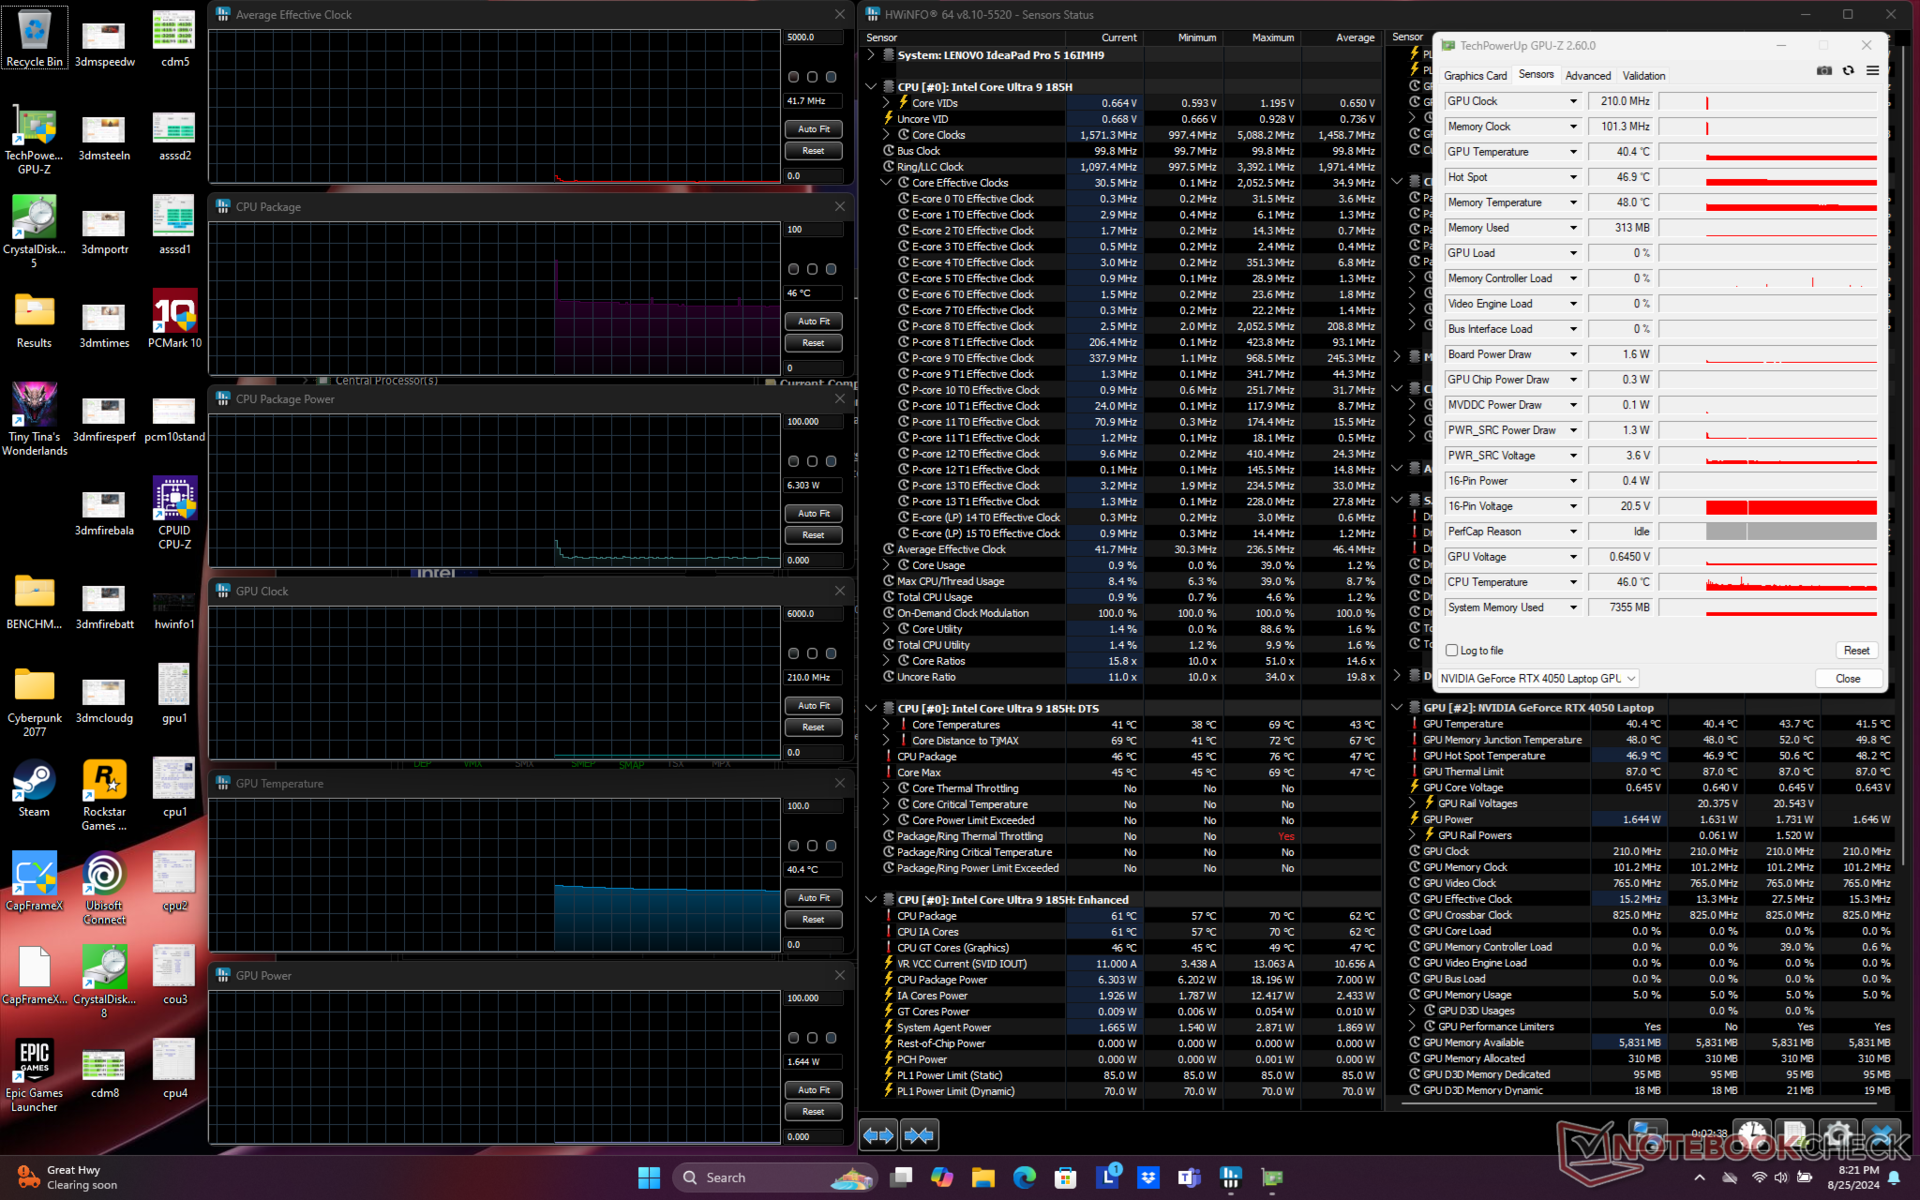
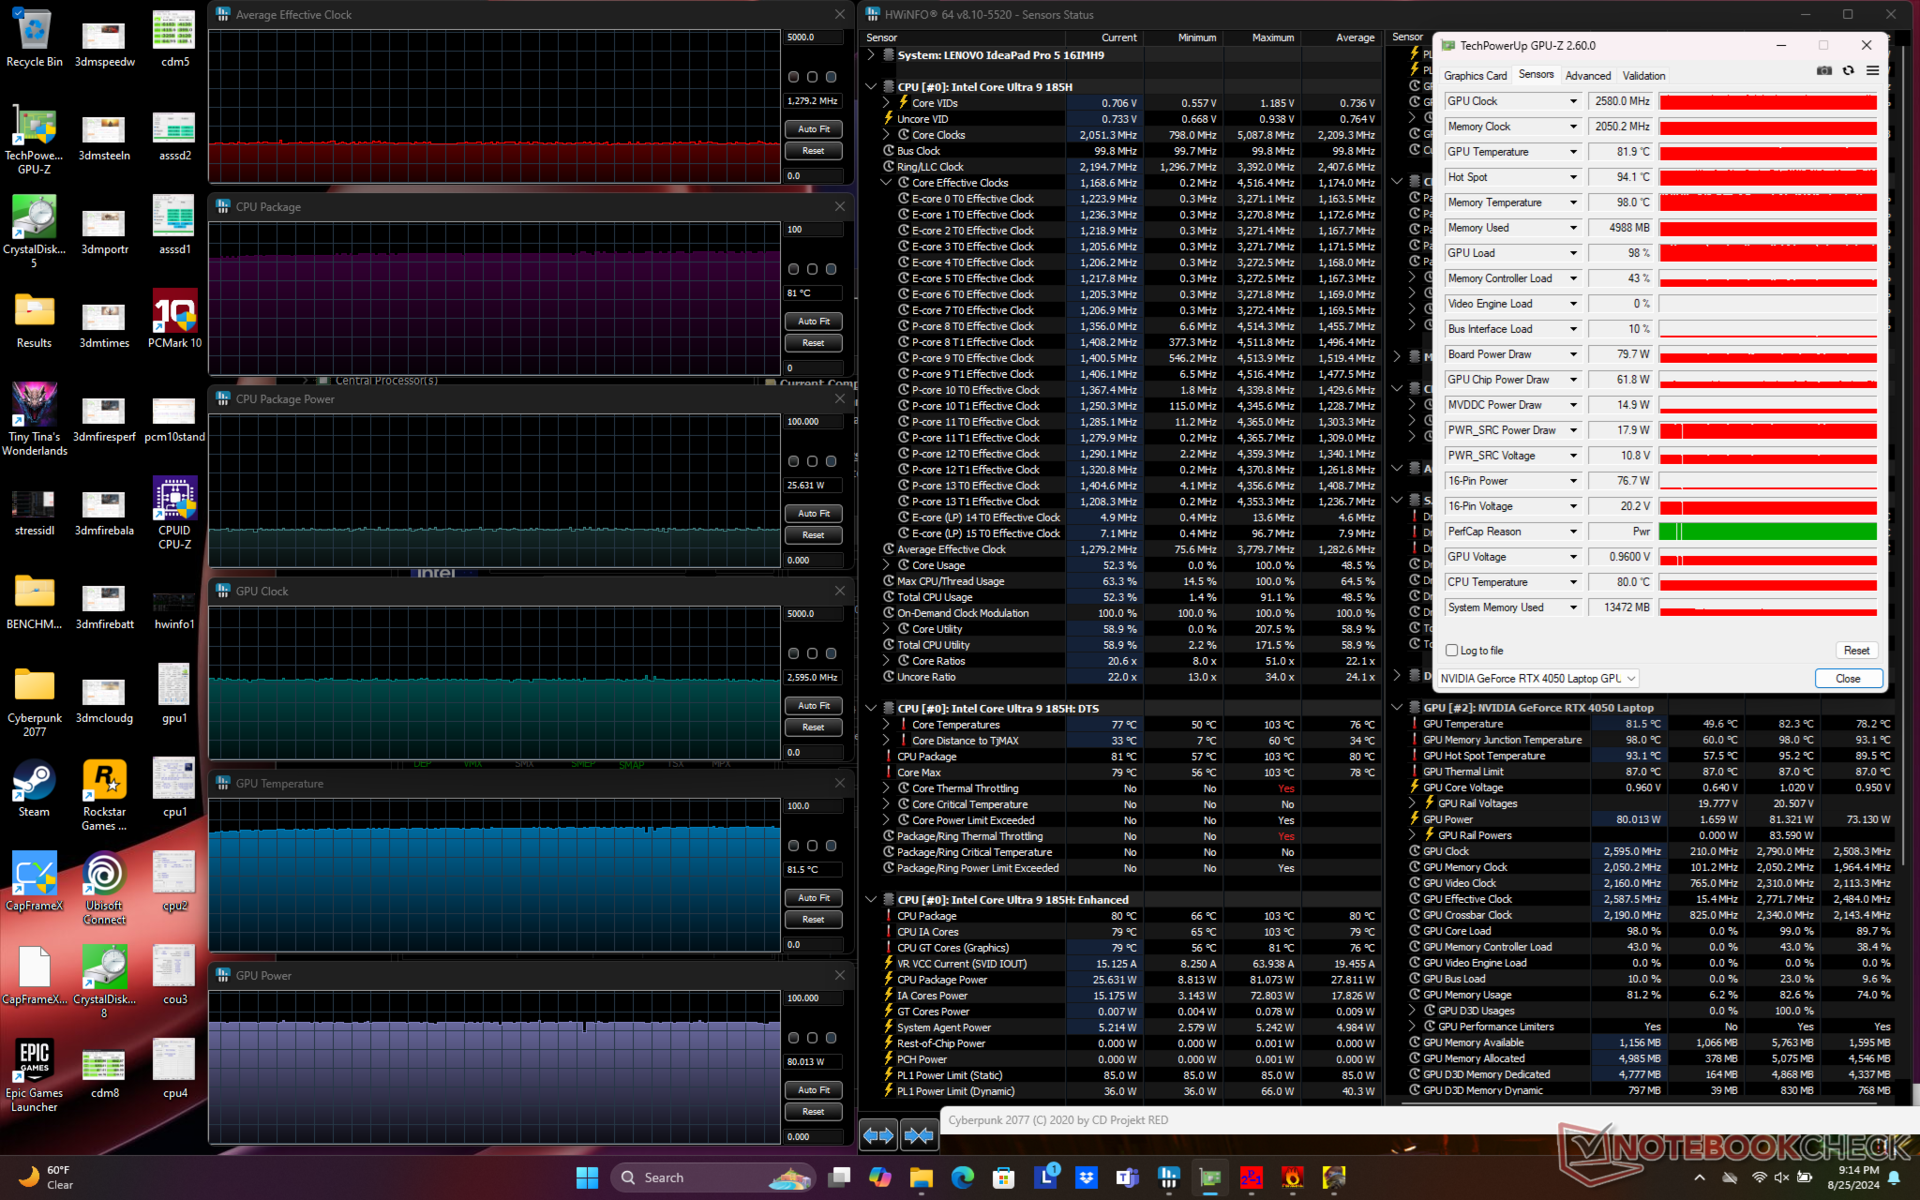
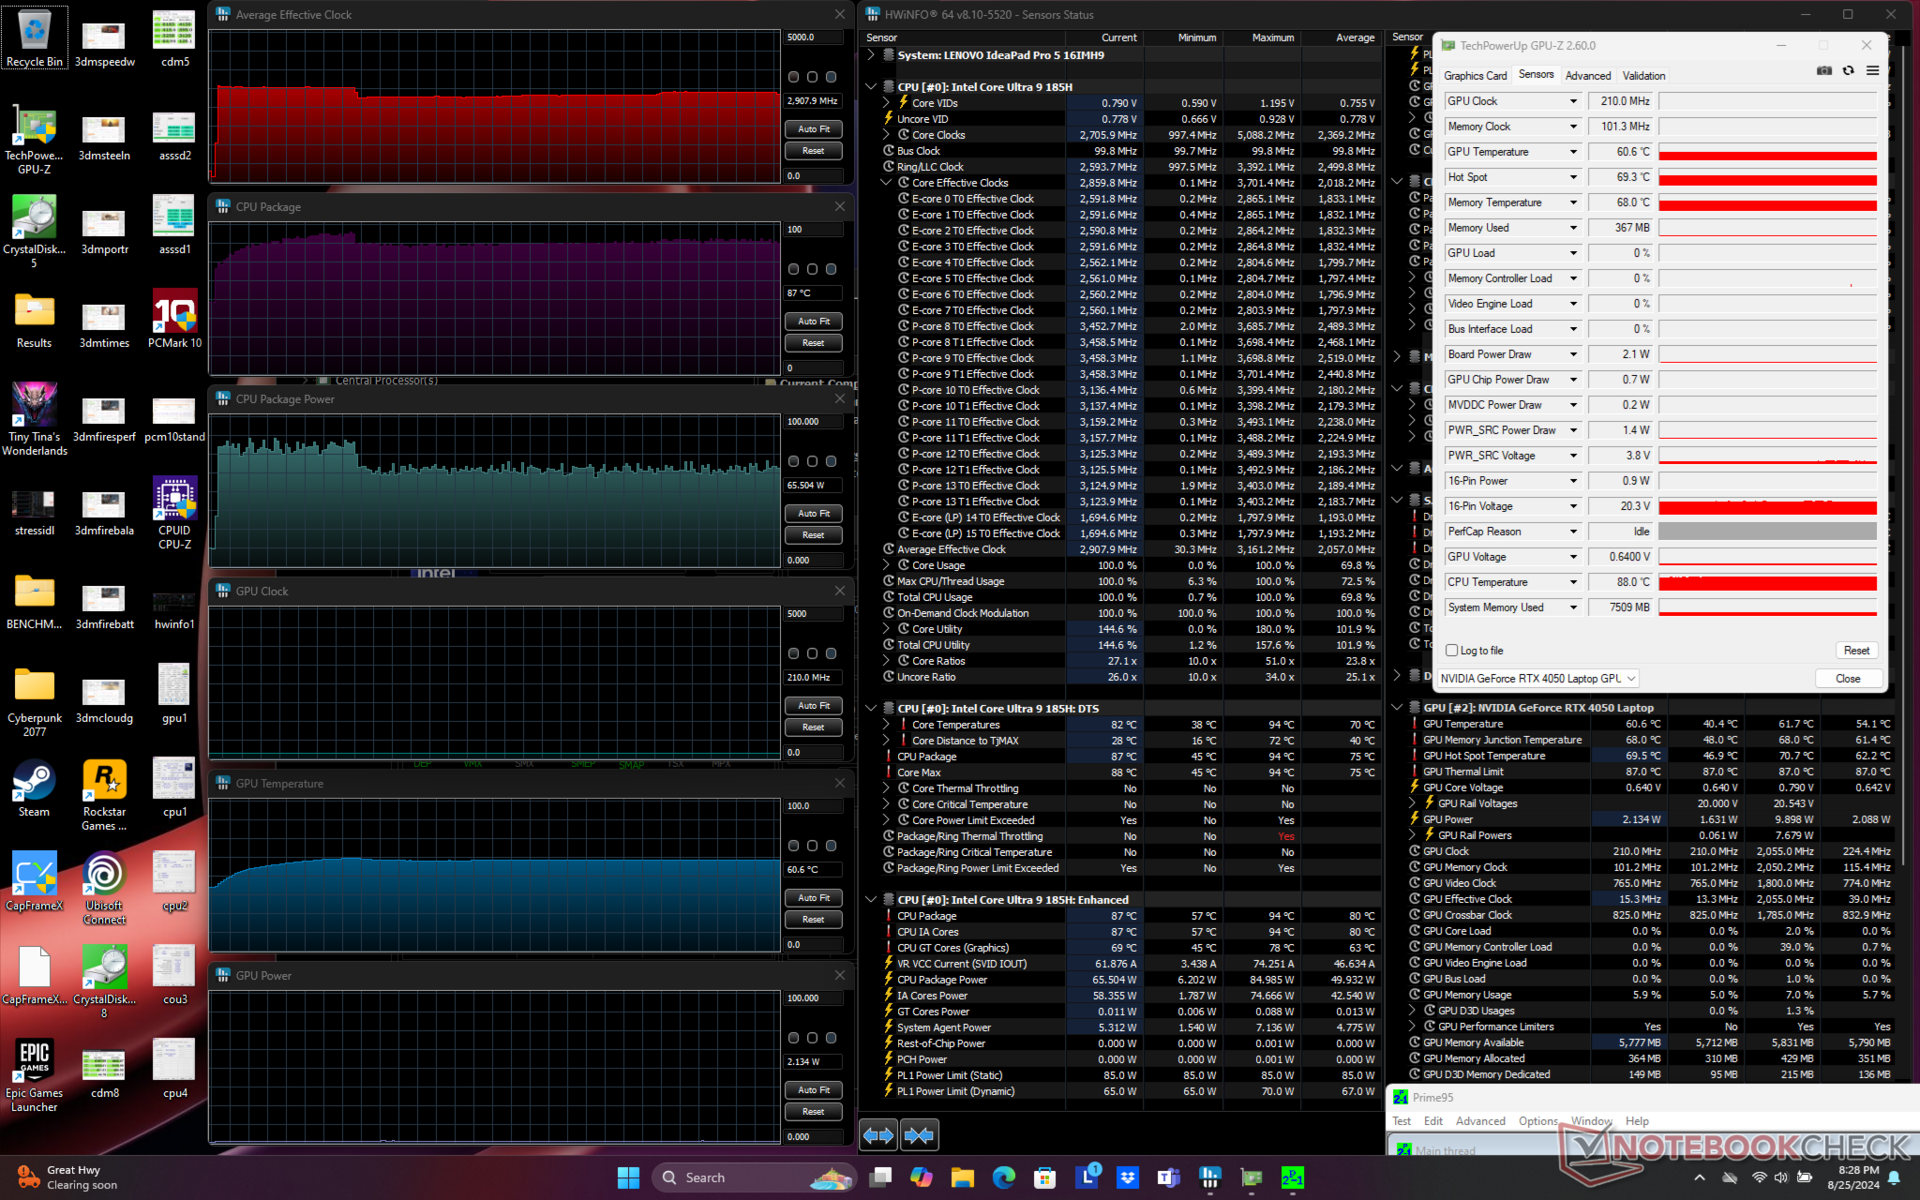
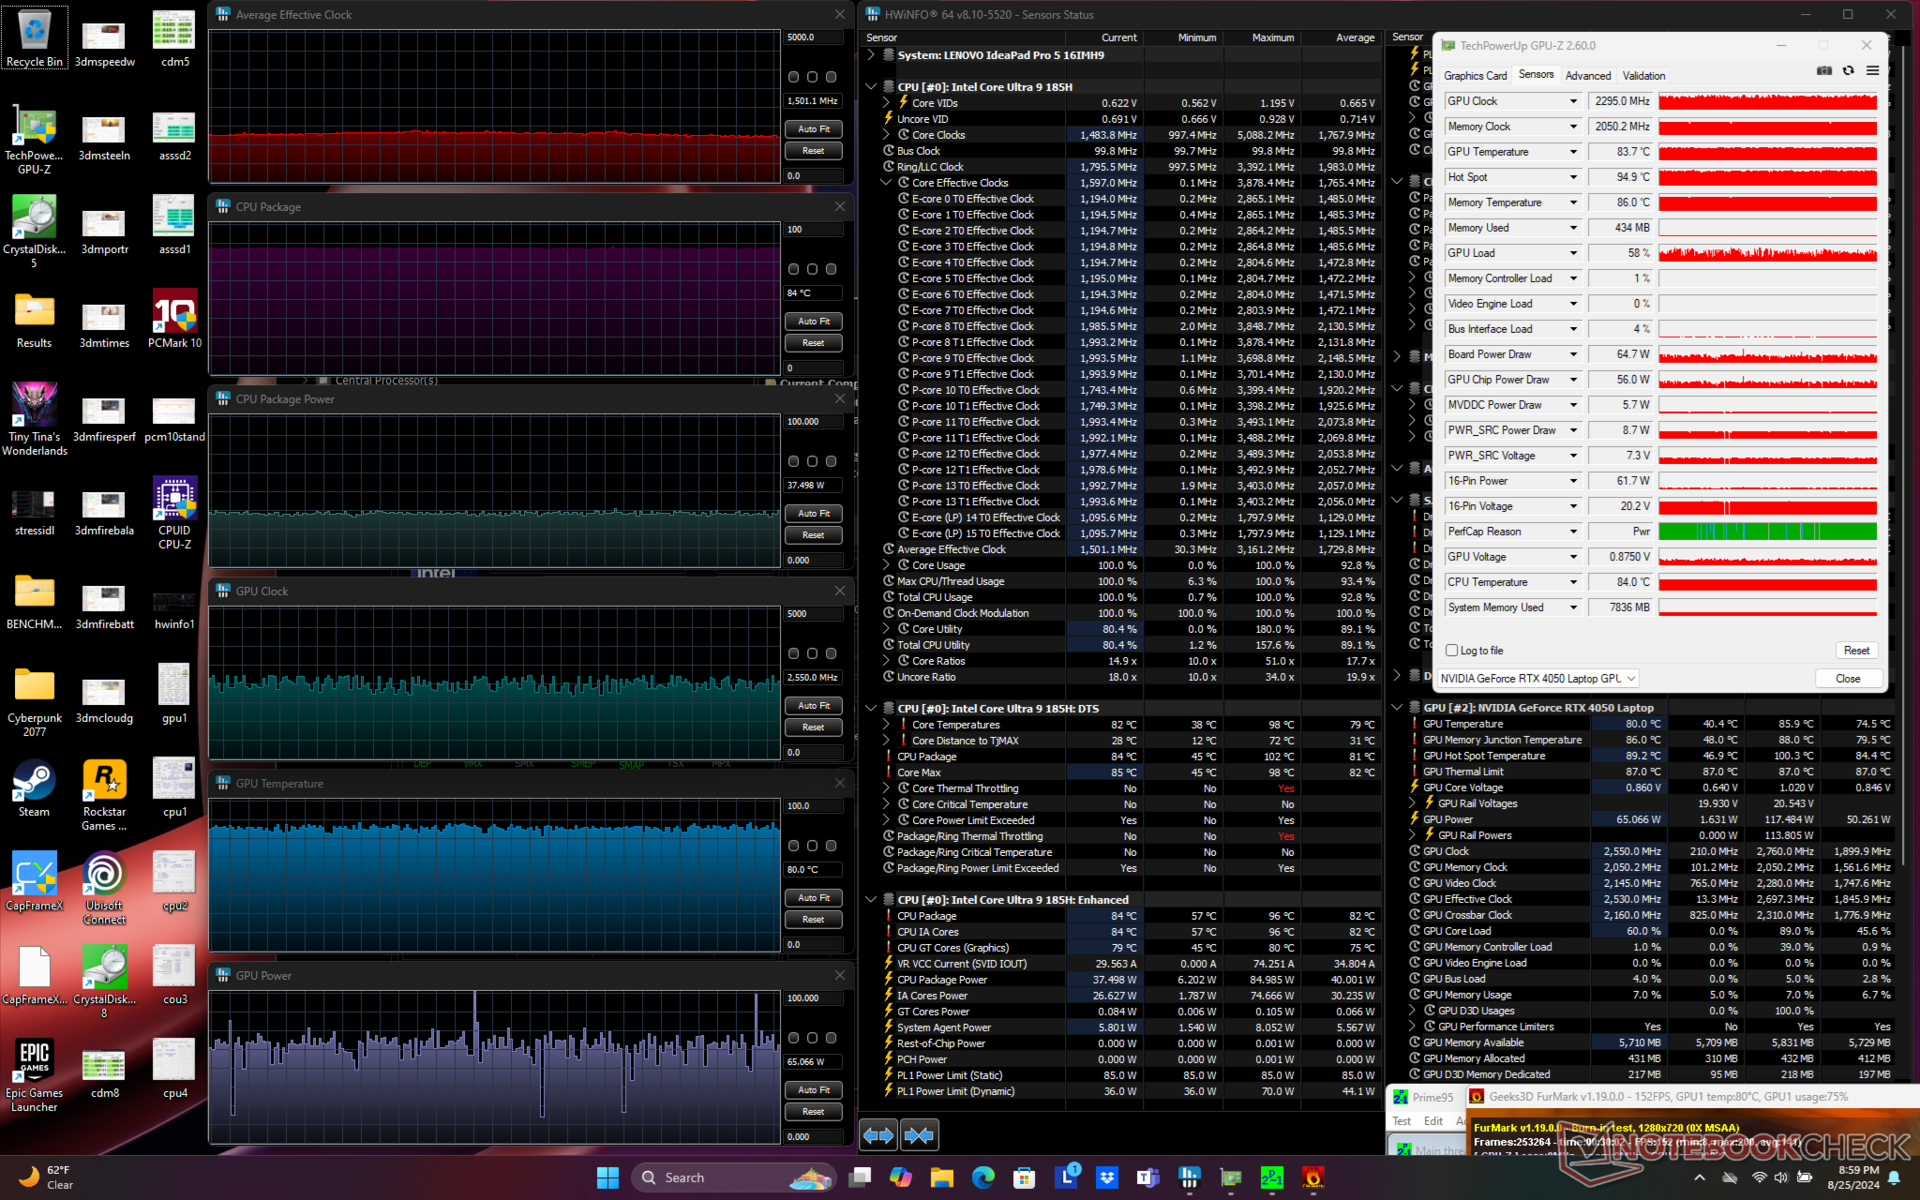
| Średnie taktowanie CPU (GHz) | Taktowanie GPU (MHz) | Średnia temperatura CPU (°C) | Średnia temperatura GPU (°C) | |
| System w stanie spoczynku | -- | -- | 46 | 40 |
| Prime95 Stress | 2.9 | -- | 87 | 61 |
| Prime95 + FurMark Stress | 1.5 | 2295 - 2550 | 84 | 80 |
| Cyberpunk 2077 Stress | 1.3 | 2580 | 81 | 82 |
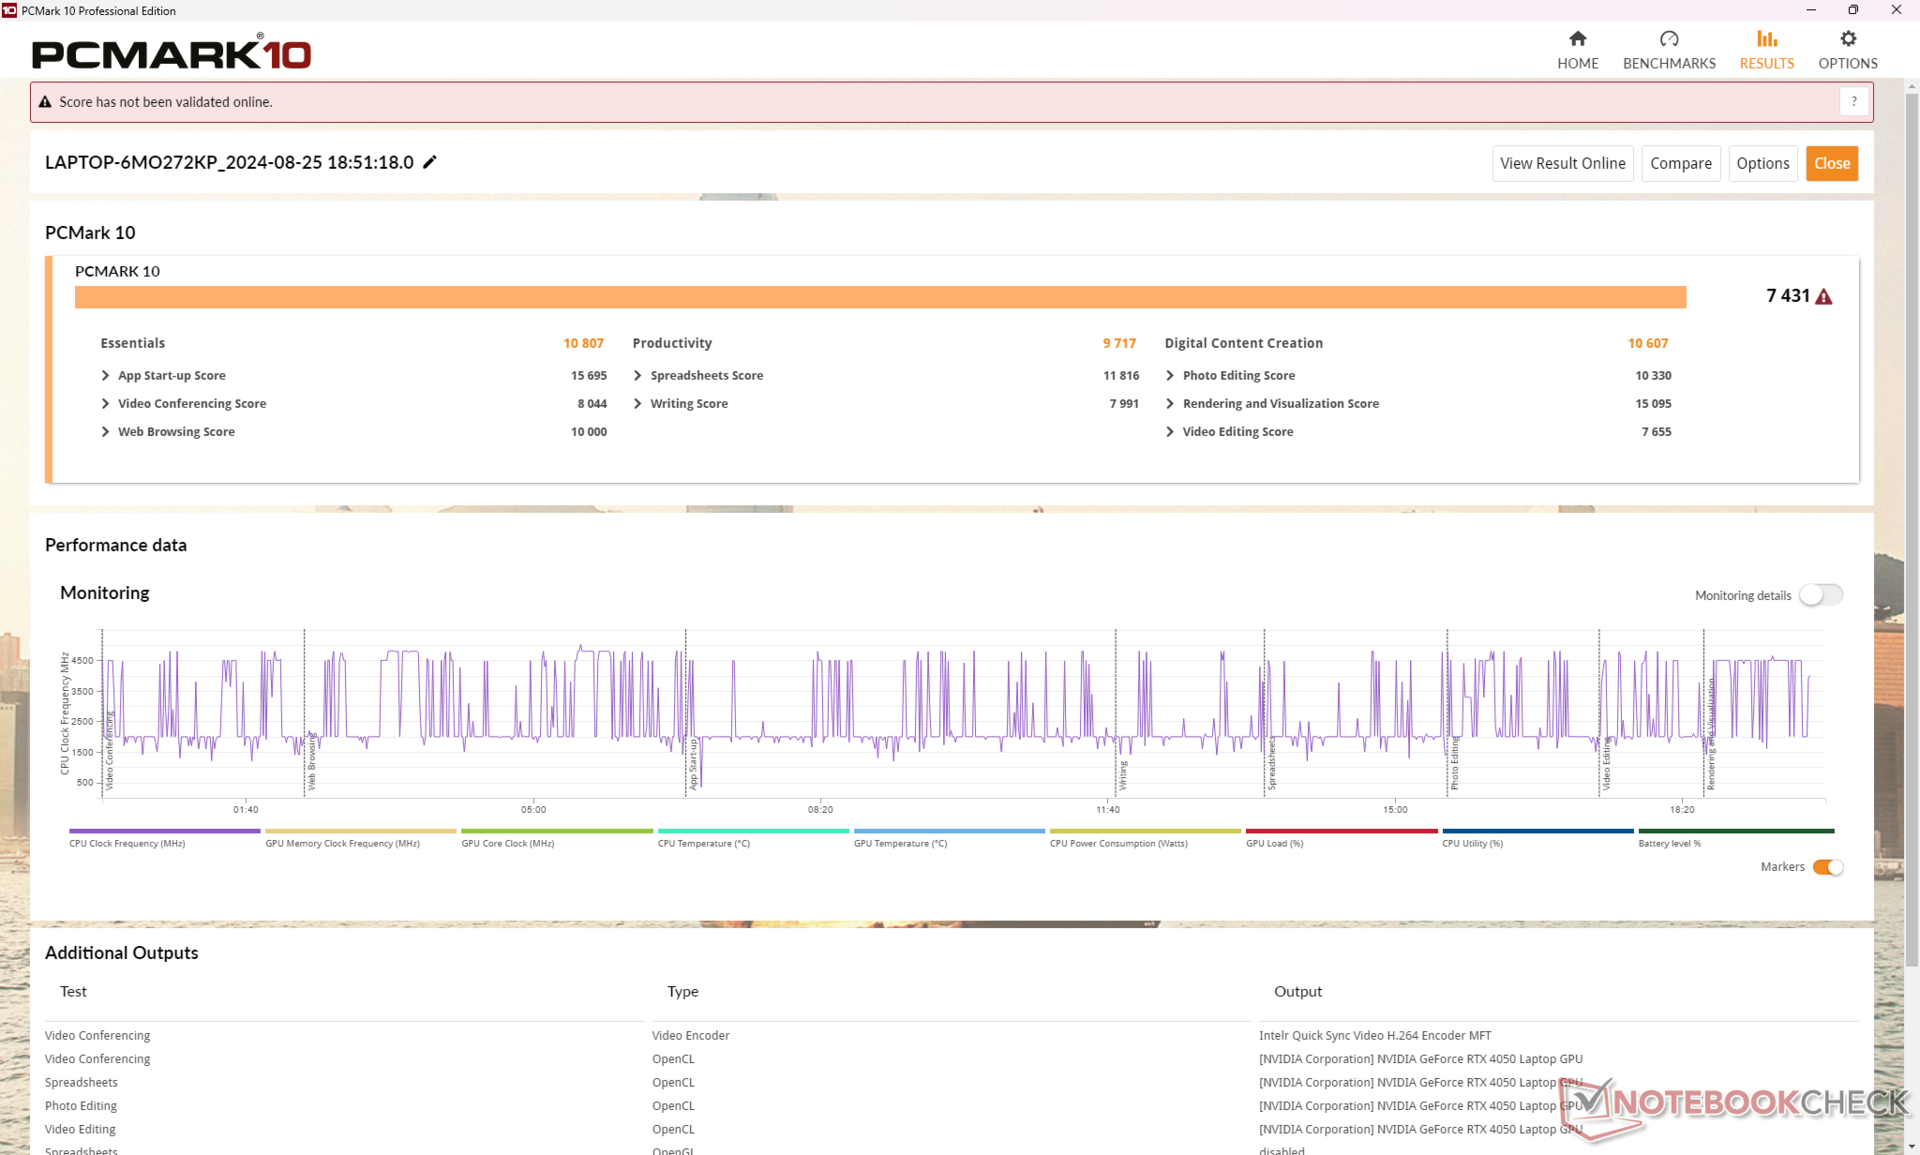
Wydajność systemu
Wyniki PCMark są zgodne z innymi 16-calowymi laptopami multimedialnymi z wolniejszą zintegrowaną grafiką. Benchmark PCMark 10 generalnie słabo radzi sobie z rozróżnianiem laptopów z dGPU i iGPU, zwłaszcza jeśli MUX nie jest obsługiwany.
CrossMark: Overall | Productivity | Creativity | Responsiveness
WebXPRT 3: Overall
WebXPRT 4: Overall
Mozilla Kraken 1.1: Total
| PCMark 10 / Score | |
| Przeciętny Intel Core Ultra 9 185H, NVIDIA GeForce RTX 4050 Laptop GPU (7431 - 7846, n=2) | |
| Asus Zenbook S 16 UM5606-RK333W | |
| Lenovo IdeaPad Pro 5 16IMH G9 RTX 4050 | |
| Lenovo IdeaPad Pro 5 16IMH G9 | |
| Dell Inspiron 16 7640 2-in-1 | |
| Samsung Galaxy Book4 Ultra | |
| HP Envy x360 2-in-1 16-ad0097nr | |
| PCMark 10 / Essentials | |
| Lenovo IdeaPad Pro 5 16IMH G9 | |
| Dell Inspiron 16 7640 2-in-1 | |
| Asus Zenbook S 16 UM5606-RK333W | |
| Lenovo IdeaPad Pro 5 16IMH G9 RTX 4050 | |
| Przeciętny Intel Core Ultra 9 185H, NVIDIA GeForce RTX 4050 Laptop GPU (10672 - 10807, n=2) | |
| HP Envy x360 2-in-1 16-ad0097nr | |
| Samsung Galaxy Book4 Ultra | |
| PCMark 10 / Productivity | |
| Asus Zenbook S 16 UM5606-RK333W | |
| HP Envy x360 2-in-1 16-ad0097nr | |
| Przeciętny Intel Core Ultra 9 185H, NVIDIA GeForce RTX 4050 Laptop GPU (9717 - 9986, n=2) | |
| Lenovo IdeaPad Pro 5 16IMH G9 RTX 4050 | |
| Samsung Galaxy Book4 Ultra | |
| Lenovo IdeaPad Pro 5 16IMH G9 | |
| Dell Inspiron 16 7640 2-in-1 | |
| PCMark 10 / Digital Content Creation | |
| Przeciętny Intel Core Ultra 9 185H, NVIDIA GeForce RTX 4050 Laptop GPU (10607 - 12301, n=2) | |
| Lenovo IdeaPad Pro 5 16IMH G9 RTX 4050 | |
| Lenovo IdeaPad Pro 5 16IMH G9 | |
| Asus Zenbook S 16 UM5606-RK333W | |
| Dell Inspiron 16 7640 2-in-1 | |
| Samsung Galaxy Book4 Ultra | |
| HP Envy x360 2-in-1 16-ad0097nr | |
| CrossMark / Overall | |
| Przeciętny Intel Core Ultra 9 185H, NVIDIA GeForce RTX 4050 Laptop GPU (1790 - 1811, n=2) | |
| Lenovo IdeaPad Pro 5 16IMH G9 RTX 4050 | |
| Asus Zenbook S 16 UM5606-RK333W | |
| Samsung Galaxy Book4 Ultra | |
| Dell Inspiron 16 7640 2-in-1 | |
| HP Envy x360 2-in-1 16-ad0097nr | |
| Lenovo IdeaPad Pro 5 16IMH G9 | |
| CrossMark / Productivity | |
| Przeciętny Intel Core Ultra 9 185H, NVIDIA GeForce RTX 4050 Laptop GPU (1700 - 1717, n=2) | |
| Lenovo IdeaPad Pro 5 16IMH G9 RTX 4050 | |
| Samsung Galaxy Book4 Ultra | |
| Dell Inspiron 16 7640 2-in-1 | |
| Asus Zenbook S 16 UM5606-RK333W | |
| HP Envy x360 2-in-1 16-ad0097nr | |
| Lenovo IdeaPad Pro 5 16IMH G9 | |
| CrossMark / Creativity | |
| Lenovo IdeaPad Pro 5 16IMH G9 RTX 4050 | |
| Przeciętny Intel Core Ultra 9 185H, NVIDIA GeForce RTX 4050 Laptop GPU (2037 - 2038, n=2) | |
| Asus Zenbook S 16 UM5606-RK333W | |
| Samsung Galaxy Book4 Ultra | |
| Dell Inspiron 16 7640 2-in-1 | |
| Lenovo IdeaPad Pro 5 16IMH G9 | |
| HP Envy x360 2-in-1 16-ad0097nr | |
| CrossMark / Responsiveness | |
| Samsung Galaxy Book4 Ultra | |
| Przeciętny Intel Core Ultra 9 185H, NVIDIA GeForce RTX 4050 Laptop GPU (1419 - 1493, n=2) | |
| Lenovo IdeaPad Pro 5 16IMH G9 RTX 4050 | |
| Asus Zenbook S 16 UM5606-RK333W | |
| Dell Inspiron 16 7640 2-in-1 | |
| HP Envy x360 2-in-1 16-ad0097nr | |
| Lenovo IdeaPad Pro 5 16IMH G9 | |
| WebXPRT 3 / Overall | |
| Asus Zenbook S 16 UM5606-RK333W | |
| Lenovo IdeaPad Pro 5 16IMH G9 RTX 4050 | |
| HP Envy x360 2-in-1 16-ad0097nr | |
| Przeciętny Intel Core Ultra 9 185H, NVIDIA GeForce RTX 4050 Laptop GPU (293 - 301, n=2) | |
| Lenovo IdeaPad Pro 5 16IMH G9 | |
| Dell Inspiron 16 7640 2-in-1 | |
| Samsung Galaxy Book4 Ultra | |
| WebXPRT 4 / Overall | |
| Lenovo IdeaPad Pro 5 16IMH G9 RTX 4050 | |
| Przeciętny Intel Core Ultra 9 185H, NVIDIA GeForce RTX 4050 Laptop GPU (268 - 271, n=2) | |
| Asus Zenbook S 16 UM5606-RK333W | |
| Lenovo IdeaPad Pro 5 16IMH G9 | |
| Samsung Galaxy Book4 Ultra | |
| Dell Inspiron 16 7640 2-in-1 | |
| HP Envy x360 2-in-1 16-ad0097nr | |
| Mozilla Kraken 1.1 / Total | |
| HP Envy x360 2-in-1 16-ad0097nr | |
| Dell Inspiron 16 7640 2-in-1 | |
| Lenovo IdeaPad Pro 5 16IMH G9 | |
| Przeciętny Intel Core Ultra 9 185H, NVIDIA GeForce RTX 4050 Laptop GPU (498 - 512, n=2) | |
| Lenovo IdeaPad Pro 5 16IMH G9 RTX 4050 | |
| Asus Zenbook S 16 UM5606-RK333W | |
| Samsung Galaxy Book4 Ultra | |
* ... im mniej tym lepiej
| PCMark 10 Score | 7431 pkt. | |
Pomoc | ||
| AIDA64 / Memory Copy | |
| Lenovo IdeaPad Pro 5 16IMH G9 RTX 4050 | |
| Lenovo IdeaPad Pro 5 16IMH G9 | |
| Samsung Galaxy Book4 Ultra | |
| Asus Zenbook S 16 UM5606-RK333W | |
| Przeciętny Intel Core Ultra 9 185H (69929 - 95718, n=19) | |
| Dell Inspiron 16 7640 2-in-1 | |
| HP Envy x360 2-in-1 16-ad0097nr | |
| AIDA64 / Memory Read | |
| Asus Zenbook S 16 UM5606-RK333W | |
| Samsung Galaxy Book4 Ultra | |
| Lenovo IdeaPad Pro 5 16IMH G9 RTX 4050 | |
| Lenovo IdeaPad Pro 5 16IMH G9 | |
| Przeciętny Intel Core Ultra 9 185H (64619 - 87768, n=19) | |
| Dell Inspiron 16 7640 2-in-1 | |
| HP Envy x360 2-in-1 16-ad0097nr | |
| AIDA64 / Memory Write | |
| Asus Zenbook S 16 UM5606-RK333W | |
| HP Envy x360 2-in-1 16-ad0097nr | |
| Dell Inspiron 16 7640 2-in-1 | |
| Lenovo IdeaPad Pro 5 16IMH G9 | |
| Samsung Galaxy Book4 Ultra | |
| Lenovo IdeaPad Pro 5 16IMH G9 RTX 4050 | |
| Przeciętny Intel Core Ultra 9 185H (51114 - 93871, n=19) | |
| AIDA64 / Memory Latency | |
| Przeciętny Intel Core Ultra 9 185H (121.4 - 259, n=19) | |
| Dell Inspiron 16 7640 2-in-1 | |
| Samsung Galaxy Book4 Ultra | |
| Lenovo IdeaPad Pro 5 16IMH G9 | |
| Lenovo IdeaPad Pro 5 16IMH G9 RTX 4050 | |
| HP Envy x360 2-in-1 16-ad0097nr | |
| Asus Zenbook S 16 UM5606-RK333W | |
* ... im mniej tym lepiej
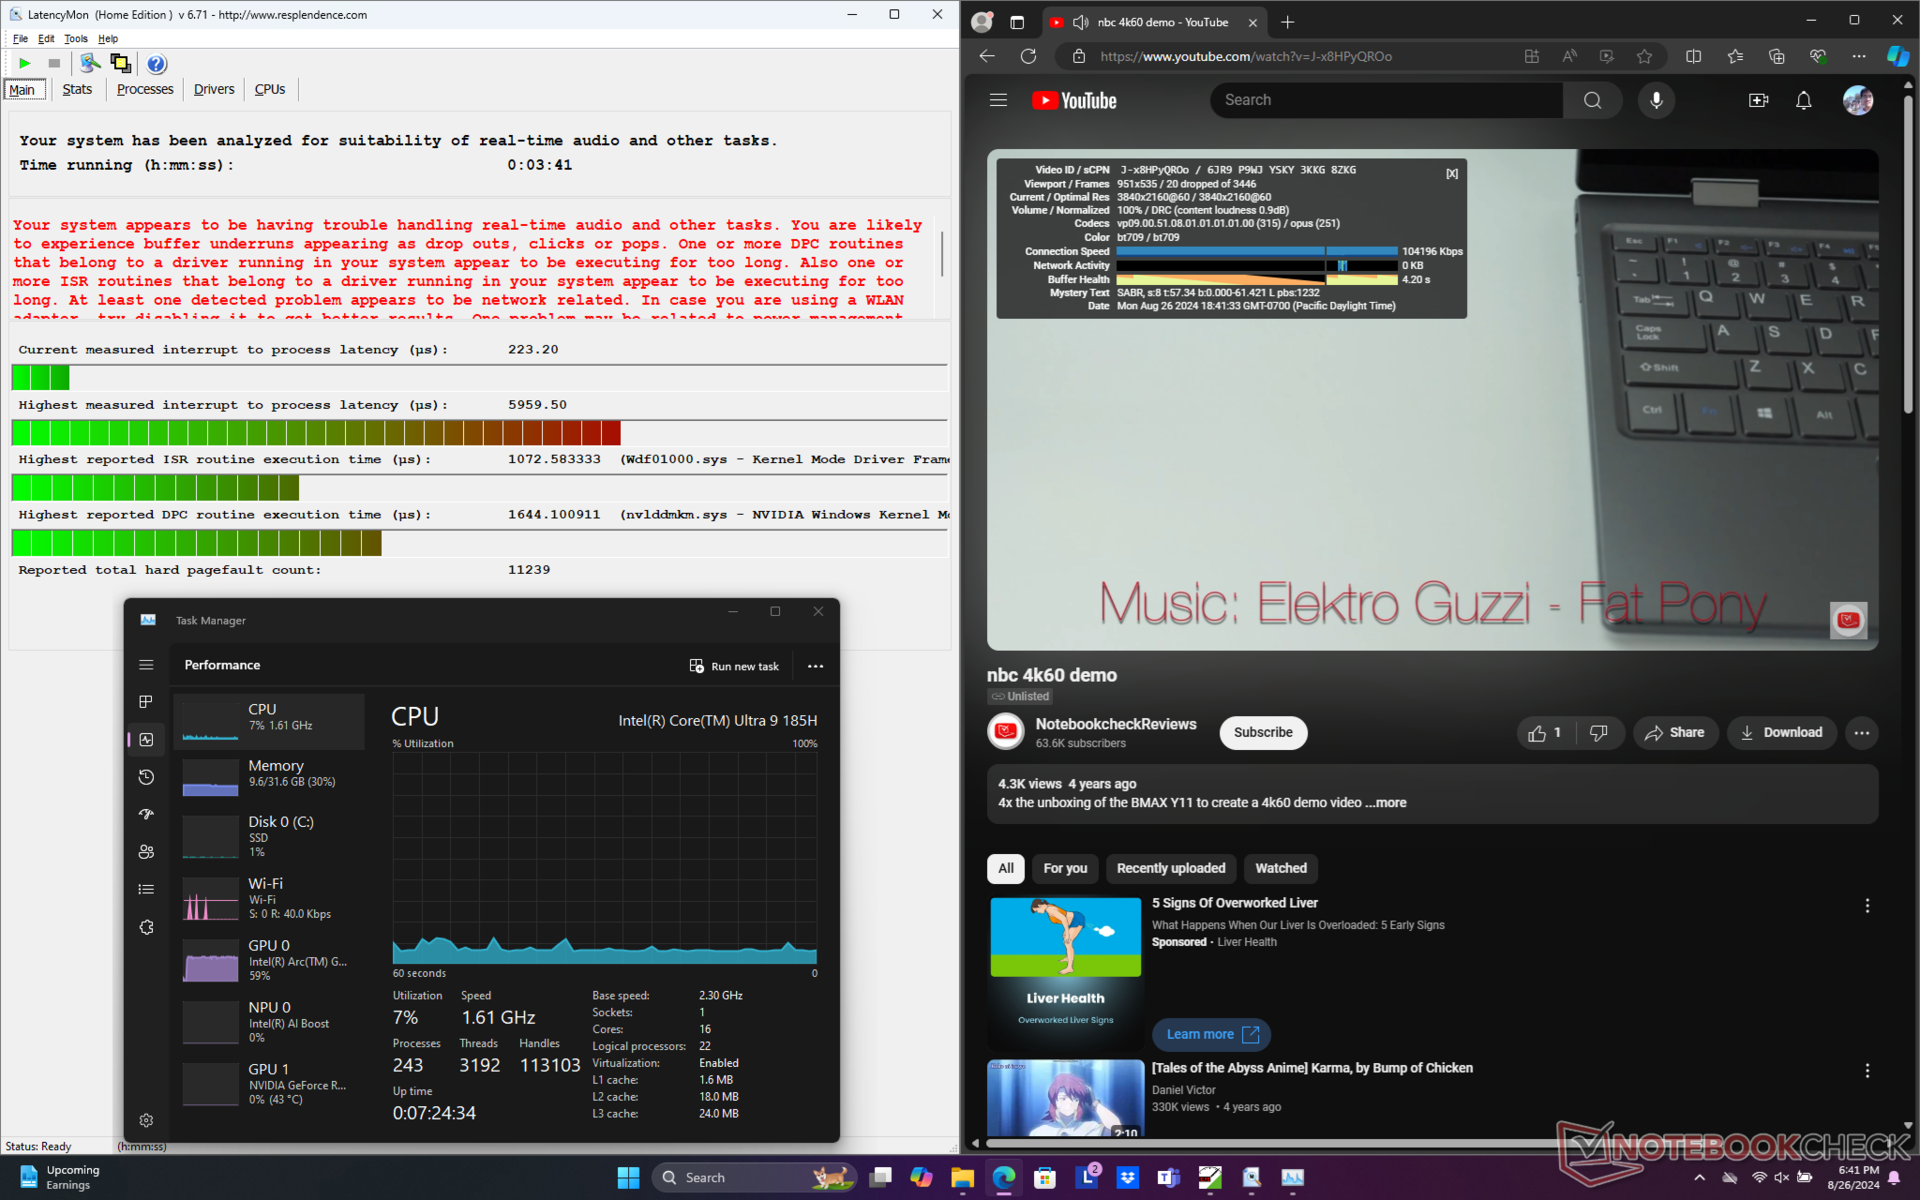
Opóźnienie DPC
LatencyMon ujawnia zarówno problemy z DPC, jak i niedoskonałe odtwarzanie wideo 4K przy 60 FPS. Jesteśmy w stanie zarejestrować 20 spadków klatek w ciągu jednej minuty, które objawiają się jako spadki klatek podczas przesyłania strumieniowego wideo. Jest to rozczarowujące, ponieważ nasza konfiguracja iGPU nie wykazuje żadnych spadków klatek w porównaniu.

| DPC Latencies / LatencyMon - interrupt to process latency (max), Web, Youtube, Prime95 | |
| Lenovo IdeaPad Pro 5 16IMH G9 RTX 4050 | |
| HP Envy x360 2-in-1 16-ad0097nr | |
| Dell Inspiron 16 7640 2-in-1 | |
| Lenovo IdeaPad Pro 5 16IMH G9 | |
| Samsung Galaxy Book4 Ultra | |
* ... im mniej tym lepiej
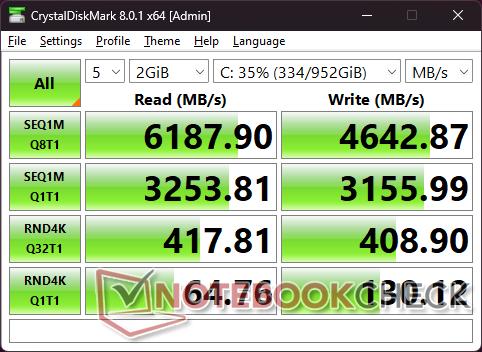
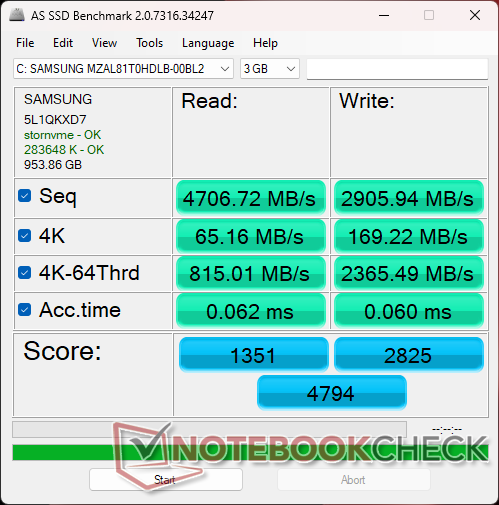
Urządzenia pamięci masowej
System jest dostarczany z tym samym Samsung PM9C1a MZAL81T0HDLB jak w wersji z iGPU. Co ciekawe, wykazuje on również te same osobliwości szybkości transferu, gdzie wydajność skakała z 5100 MB/s do 6100 MB/s po kilku minutach w naszym teście pętli DiskSpd. Większość innych dysków, takich jak Samsung PM9A1 w Galaxy Book4 Ultrapozostała stabilna od początku do końca.
Do głównego dysku SSD dołączona jest podkładka termiczna, która pomaga odprowadzać ciepło do metalowej osłony pod spodem.

* ... im mniej tym lepiej
Disk Throttling: DiskSpd Read Loop, Queue Depth 8
Wydajność GPU - różnica 90 W
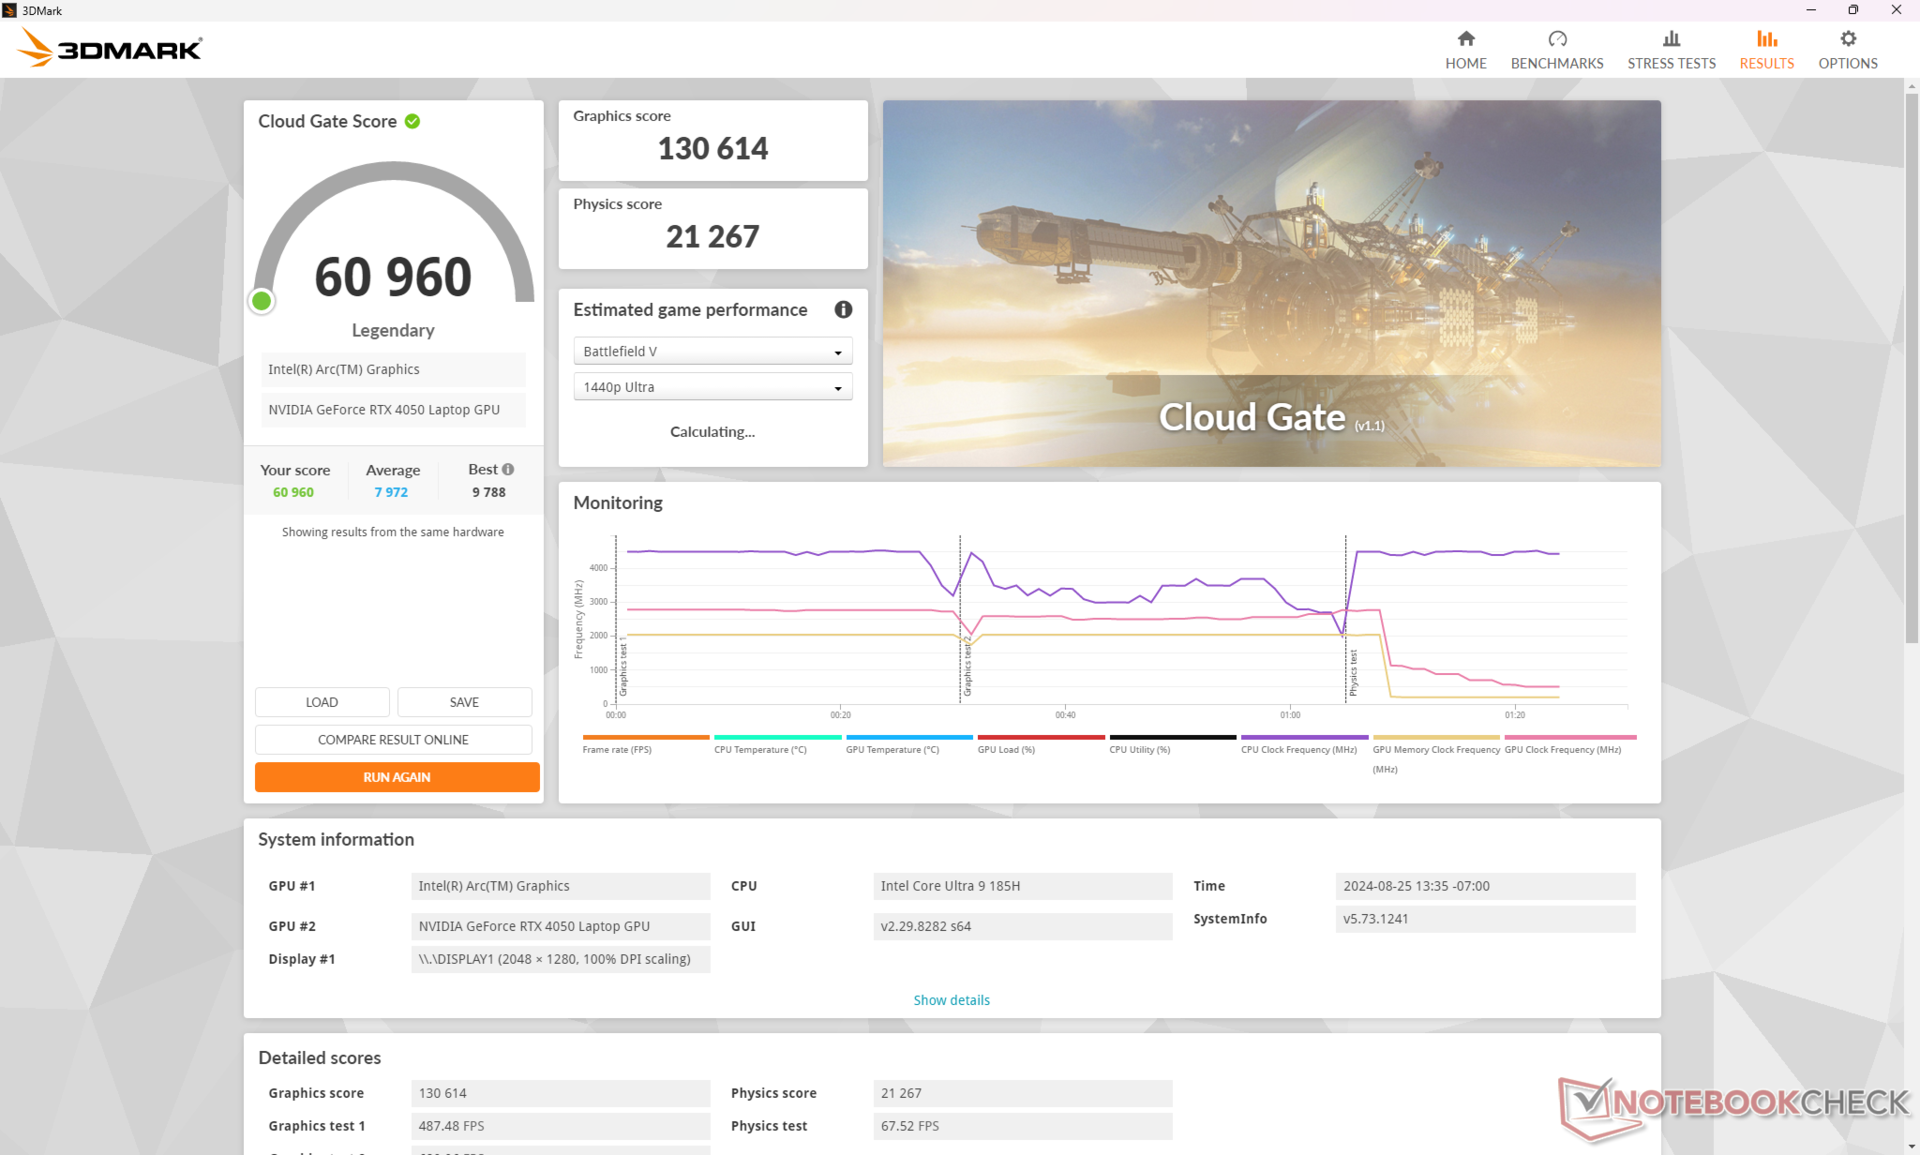
90 W GeForce RTX 4050 GPU osiąga wyższy pułap TGP niż w wielu innych laptopach dla graczy z tą samą opcją GPU. RTX 4050 w Spectre x360 16 i Samsung Galaxy Book3 Ultra 16na przykład, mają niższe wartości TGP wynoszące odpowiednio tylko 55 W i 60 W. W rezultacie GPU w naszym IdeaPad Pro 5 16 G9 może być nawet o 10 procent szybszy niż przeciętny laptop w naszej bazie danych z tym samym GPU RTX 4050. Różnica ta jest wystarczająca, aby konsekwentnie przewyższać nawet 70 W RTX 4060 w konkurencyjnym Inspiron 16 Plus 7640 według benchmarków 3DMark.
Użytkownicy dokonujący aktualizacji ze starszego GeForce RTX 3050która znajdowała się w ostatniej generacji IdeaPad Pro 5 16 G7 lub G8, mogą spodziewać się znacznego wzrostu wydajności o 70 do 80 procent dzięki RTX 4050. Korzyści są większe i wynoszą od 2x do 2,5x w przypadku aktualizacji ze zintegrowanej konfiguracji Arc 8 konfiguracji.
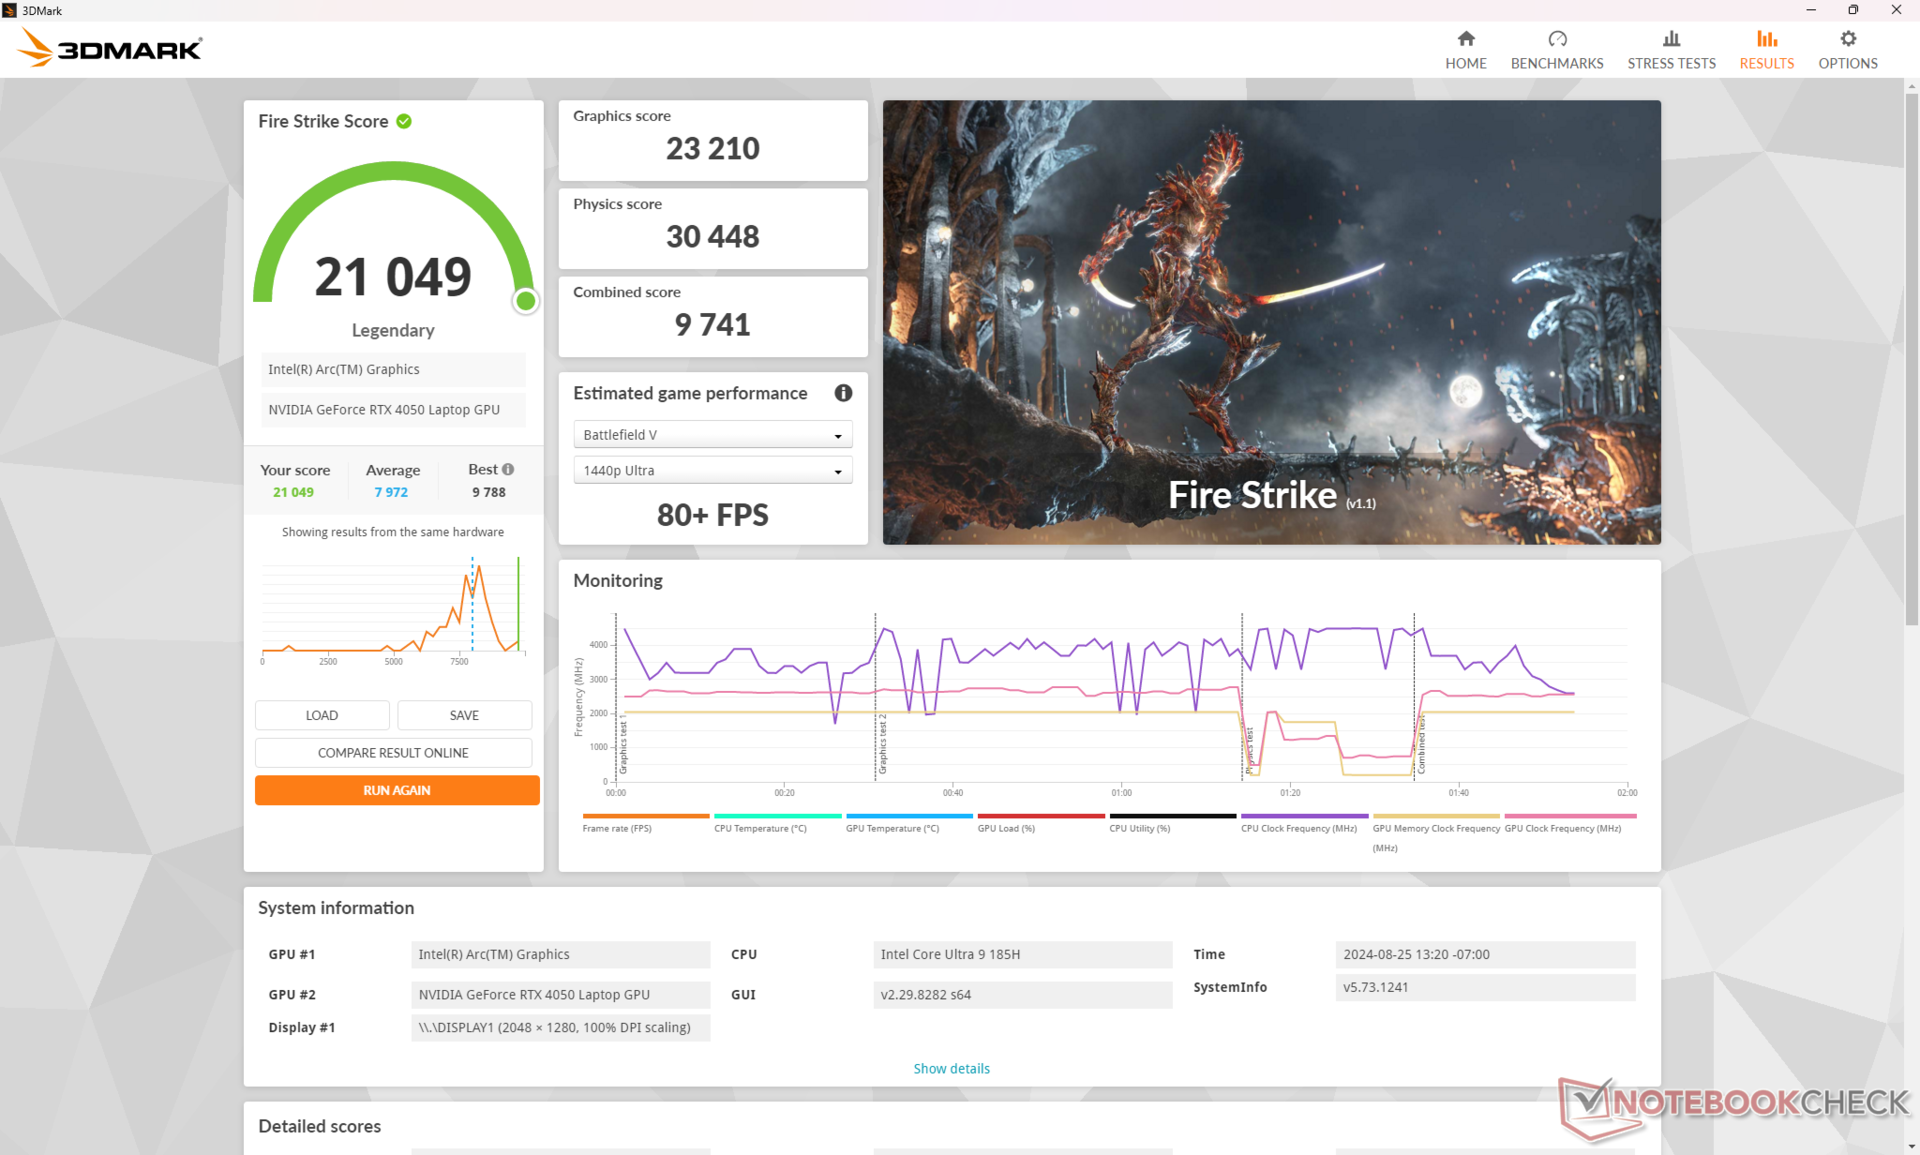
| Profil zasilania | Wynik grafiki | Wynik fizyki | Wynik łączny |
| Tryb wydajności | 23210 | 30448 | 9741 |
| Tryb zrównoważony | 21032 (-9%) | 30008 (-1%) | 8158 (-16%) |
| Zasilanie bateryjne | 19718 (-15%) | 30484 (-0%) | 8216 (-16%) |
Uruchomienie trybu zrównoważonego zamiast trybu wydajności wpływa na wydajność grafiki nawet o 10 procent, podczas gdy wydajność procesora pozostaje względnie taka sama, zgodnie z naszą tabelą wyników Fire Strike powyżej. Praca na zasilaniu bateryjnym nie wpływa na wydajność procesora tak bardzo, jak początkowo oczekiwaliśmy.

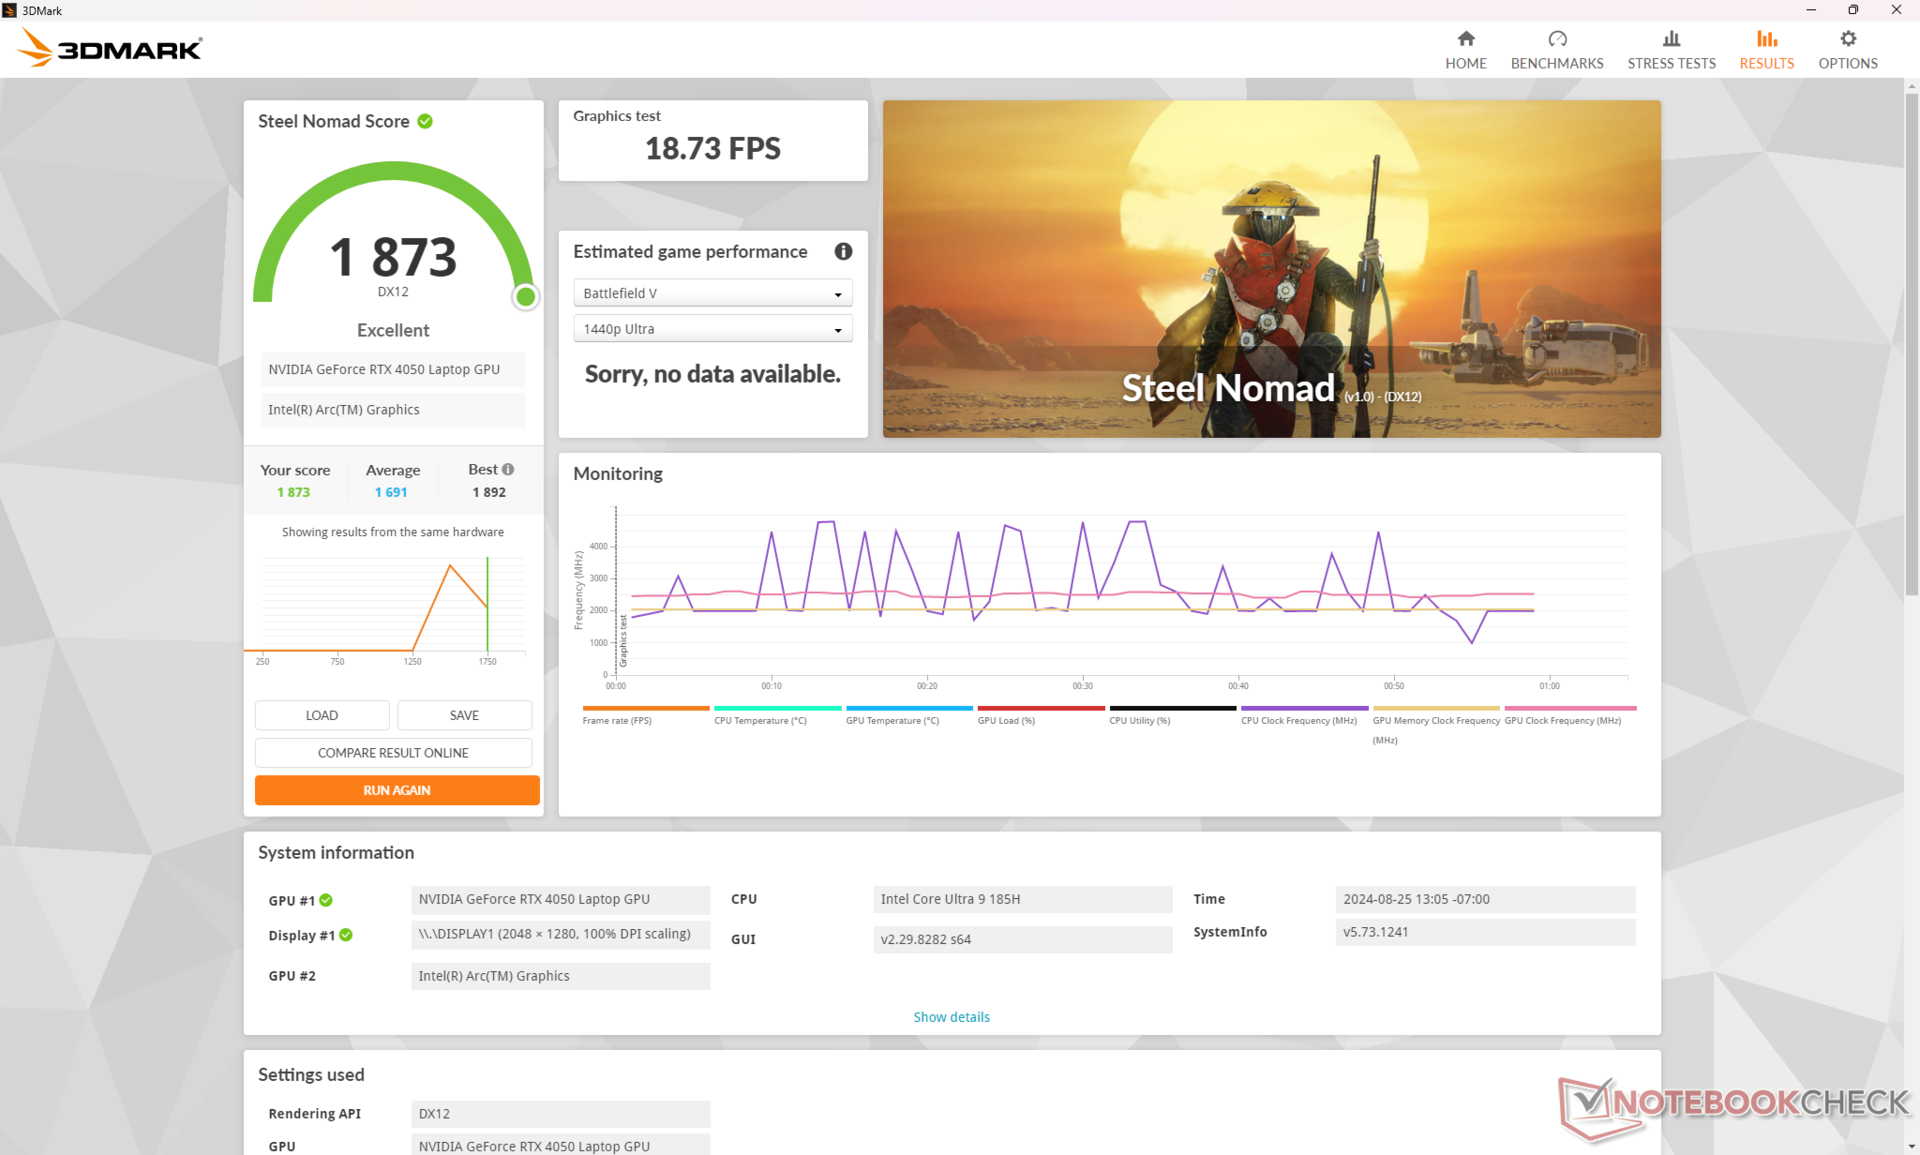
| 3DMark 11 Performance | 27986 pkt. | |
| 3DMark Cloud Gate Standard Score | 60960 pkt. | |
| 3DMark Fire Strike Score | 21049 pkt. | |
| 3DMark Time Spy Score | 8963 pkt. | |
| 3DMark Steel Nomad Score | 1873 pkt. | |
Pomoc | ||
* ... im mniej tym lepiej
Wydajność w grach
Choć nie jest to wyraźnie laptop do gier, 90 W RTX 4050 pozwala Lenovo uruchamiać gry lepiej niż oczekiwano. W rzeczywistości tytuły takie jak Final Fantasy XV, Cyberpunk 2077, Tiny Tina's Wonderlands i inne działają o około 25 do 30 procent szybciej niż na HP Spectre x360 16 z tym samym GPU RTX 4050. Nasz system wyprzedza również Inspiron 16 Plus 7640 i jego 70 W GPU RTX 4060, zgodnie z powyższymi wynikami 3DMark. W tym scenariuszu niższa natywna rozdzielczość panelu OLED jest korzystna dla płynniejszej rozgrywki niż w przypadku panelu IPS 1600p.
| GTA V - 1920x1080 Highest Settings possible AA:4xMSAA + FX AF:16x | |
| Lenovo IdeaPad Pro 5 16IMH G9 RTX 4050 | |
| Samsung Galaxy Book4 Ultra | |
| Asus Zenbook S 16 UM5606-RK333W | |
| Lenovo IdeaPad Pro 5 16IMH G9 | |
| Final Fantasy XV Benchmark - 1920x1080 High Quality | |
| Lenovo IdeaPad Pro 5 16IMH G9 RTX 4050 | |
| Samsung Galaxy Book4 Ultra | |
| Lenovo IdeaPad Pro 5 16IMH G9 | |
| Asus Zenbook S 16 UM5606-RK333W | |
| Dell Inspiron 16 7640 2-in-1 | |
| HP Envy x360 2-in-1 16-ad0097nr | |
| Strange Brigade - 1920x1080 ultra AA:ultra AF:16 | |
| Lenovo IdeaPad Pro 5 16IMH G9 RTX 4050 | |
| Samsung Galaxy Book4 Ultra | |
| Lenovo IdeaPad Pro 5 16IMH G9 | |
| Asus Zenbook S 16 UM5606-RK333W | |
| Dell Inspiron 16 7640 2-in-1 | |
| HP Envy x360 2-in-1 16-ad0097nr | |
| Dota 2 Reborn - 1920x1080 ultra (3/3) best looking | |
| Lenovo IdeaPad Pro 5 16IMH G9 RTX 4050 | |
| Samsung Galaxy Book4 Ultra | |
| Lenovo IdeaPad Pro 5 16IMH G9 | |
| Dell Inspiron 16 7640 2-in-1 | |
| HP Envy x360 2-in-1 16-ad0097nr | |
| Asus Zenbook S 16 UM5606-RK333W | |
Cyberpunk 2077 ultra FPS Chart
| low | med. | high | ultra | |
|---|---|---|---|---|
| GTA V (2015) | 183 | 178.4 | 166.9 | 98.7 |
| Dota 2 Reborn (2015) | 167.2 | 151.9 | 145.9 | 137.4 |
| Final Fantasy XV Benchmark (2018) | 171.3 | 123.3 | 87.8 | |
| X-Plane 11.11 (2018) | 127.7 | 114.1 | 89 | |
| Far Cry 5 (2018) | 155 | 129 | 120 | 113 |
| Strange Brigade (2018) | 411 | 204 | 172.9 | 149.4 |
| Tiny Tina's Wonderlands (2022) | 181.6 | 149.2 | 96 | 74 |
| F1 22 (2022) | 211 | 204 | 156.6 | 54.1 |
| Baldur's Gate 3 (2023) | 110.1 | 91.4 | 81.3 | 78.6 |
| Cyberpunk 2077 2.2 Phantom Liberty (2023) | 103.1 | 82.2 | 69.4 | 59.8 |
Emisje - głośne i gorące pod obciążeniem
Hałas systemowy
Hałas wentylatora pozostaje cichy podczas uruchamiania niewymagających obciążeń, takich jak przeglądarki lub Word, bez irytujących pulsacji lub skoków. Podczas uruchamiania cięższych obciążeń, takich jak 3DMark 06, hałas wentylatora utrzymywał się na stałym poziomie około 26 dB(A) przez większość pierwszej sceny testu porównawczego, po czym ostatecznie wzrósł do prawie 46 dB(A), co jest zbliżone do tego, co zarejestrowaliśmy w konfiguracji iGPU.
Podczas grania hałas wentylatora osiągał szczyt na poziomie nieco ponad 48 dB(A), czyli o kilka decybeli głośniej niż w konfiguracji iGPU. Jest to również głośniejsze niż konkurencyjne 16-calowe laptopy z przyzwoitymi marginesami, w tym inspiron 16 7640 2-w-1 lub Samsung Galaxy Book4 Ultra. Tak więc opcja dGPU niekoniecznie jest głośniejsza niż opcja iGPU, dopóki nie zaczniesz wprowadzać znacznie bardziej wymagających obciążeń.
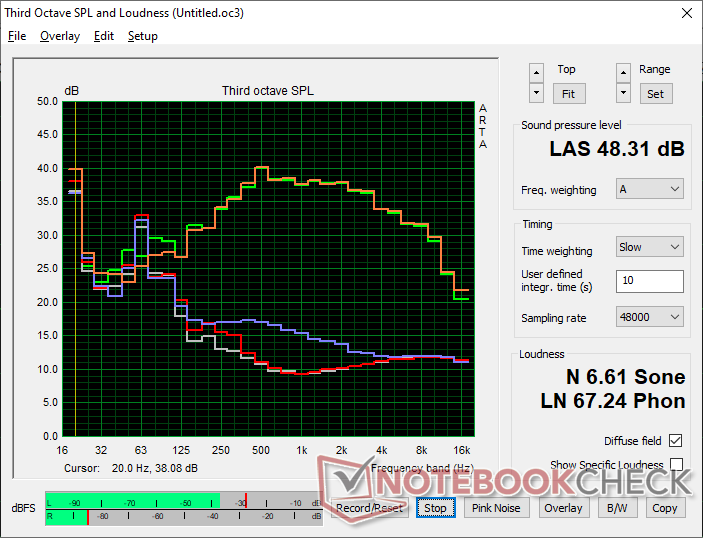
Hałas
| luz |
| 23 / 23.3 / 23.3 dB |
| obciążenie |
| 45.7 / 48.4 dB |
 | ||
30 dB cichy 40 dB(A) słyszalny 50 dB(A) irytujący |
||
min: | ||
| Lenovo IdeaPad Pro 5 16IMH G9 RTX 4050 NVIDIA GeForce RTX 4050 Laptop GPU, Ultra 9 185H, Samsung PM9C1a MZAL81T0HDLB | Lenovo IdeaPad Pro 5 16IMH G9 Arc 8-Core, Ultra 7 155H, Samsung PM9C1a MZAL81T0HDLB | Dell Inspiron 16 7640 2-in-1 Arc 8-Core, Ultra 7 155H, Micron 2550 1TB | Asus Zenbook S 16 UM5606-RK333W Radeon 890M, Ryzen AI 9 HX 370, Micron 2400 MTFDKBA1T0QFM | HP Envy x360 2-in-1 16-ad0097nr Radeon 780M, R7 8840HS, KIOXIA BG5 KBG50ZNV1T02 | Samsung Galaxy Book4 Ultra NVIDIA GeForce RTX 4050 Laptop GPU, Ultra 7 155H, Samsung PM9A1 MZVL2512HCJQ | |
|---|---|---|---|---|---|---|
| Noise | -4% | 1% | 5% | 10% | 2% | |
| wyłączone / środowisko * | 23 | 24.1 -5% | 22.9 -0% | 24.7 -7% | 22.9 -0% | 24.2 -5% |
| Idle Minimum * | 23 | 24.1 -5% | 22.9 -0% | 24.7 -7% | 23 -0% | 24.2 -5% |
| Idle Average * | 23.3 | 24.1 -3% | 22.9 2% | 24.7 -6% | 23 1% | 24.2 -4% |
| Idle Maximum * | 23.3 | 28.2 -21% | 25 -7% | 26.4 -13% | 23 1% | 24.2 -4% |
| Load Average * | 45.7 | 44.4 3% | 45.1 1% | 35.7 22% | 23.8 48% | 37.9 17% |
| Cyberpunk 2077 ultra * | 48.4 | 44.9 7% | 36.8 24% | |||
| Load Maximum * | 48.4 | 44.4 8% | 44.9 7% | 36.8 24% | 43.8 10% | 41.7 14% |
| Witcher 3 ultra * | 36.5 | 43.8 | 41.7 |
* ... im mniej tym lepiej
Temperatura
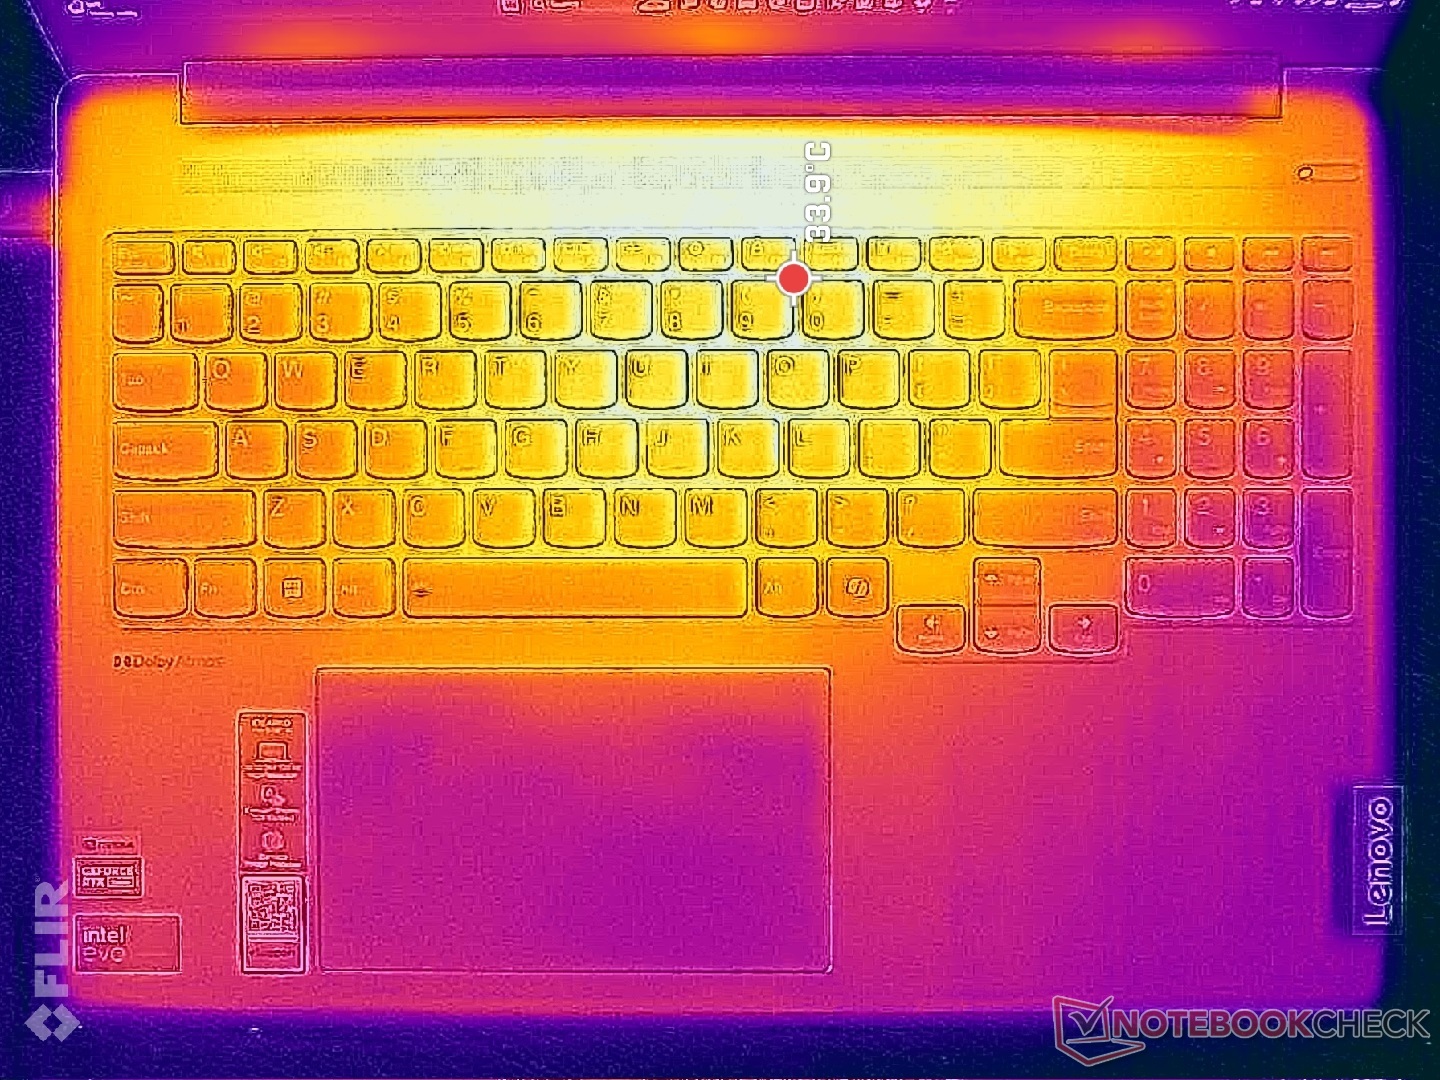
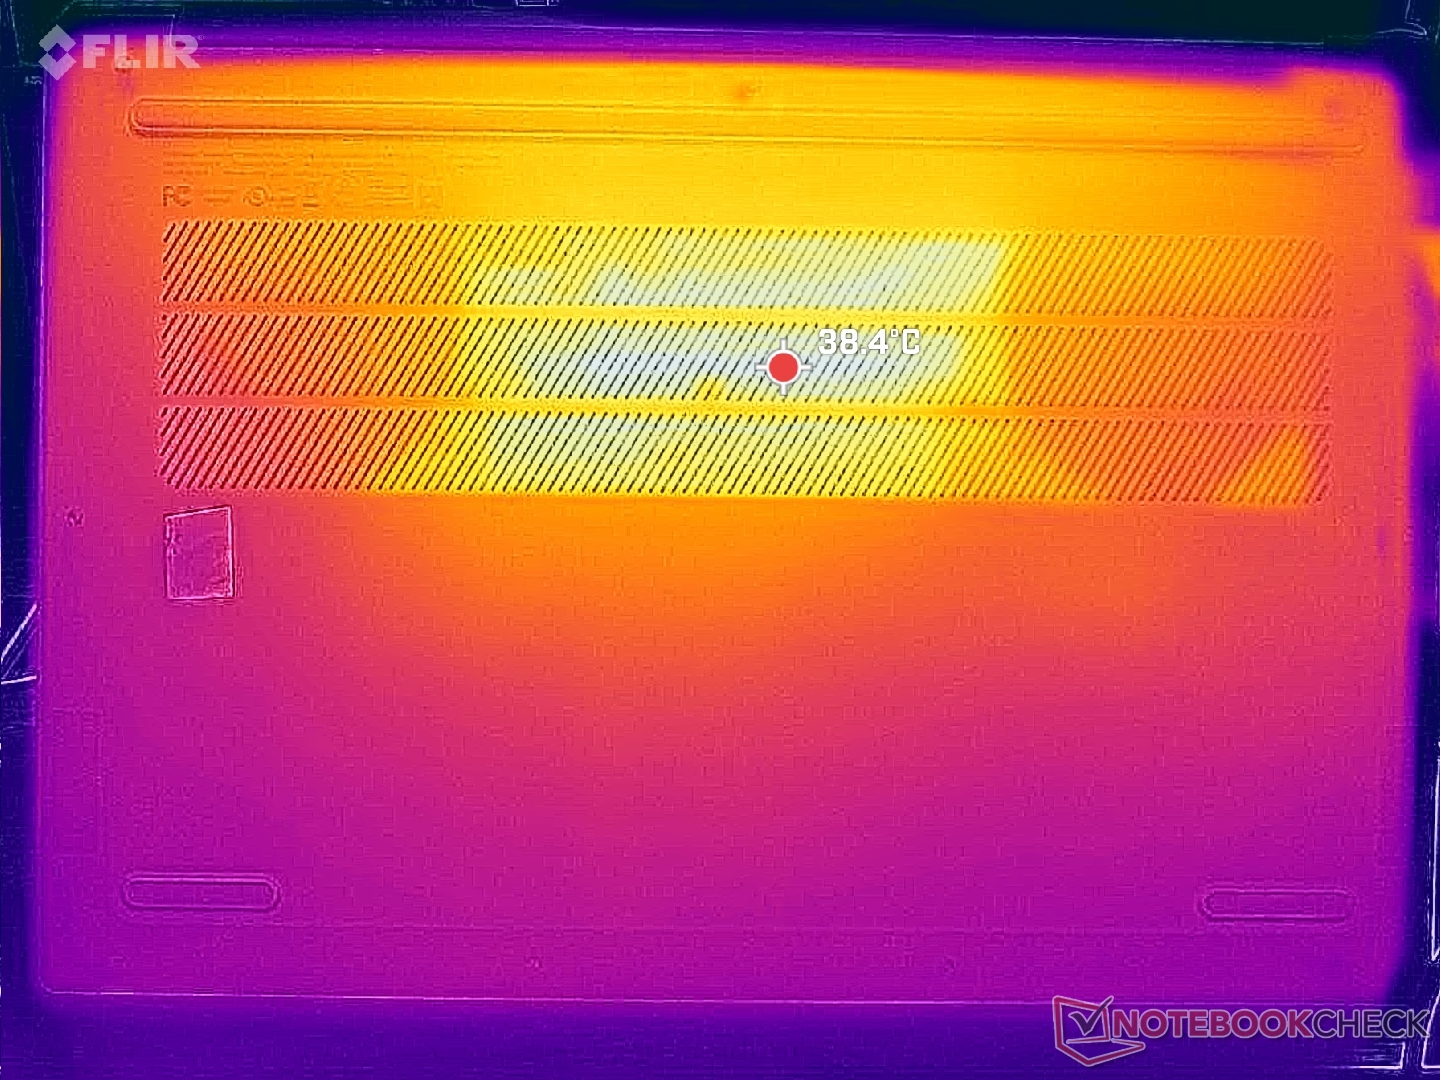
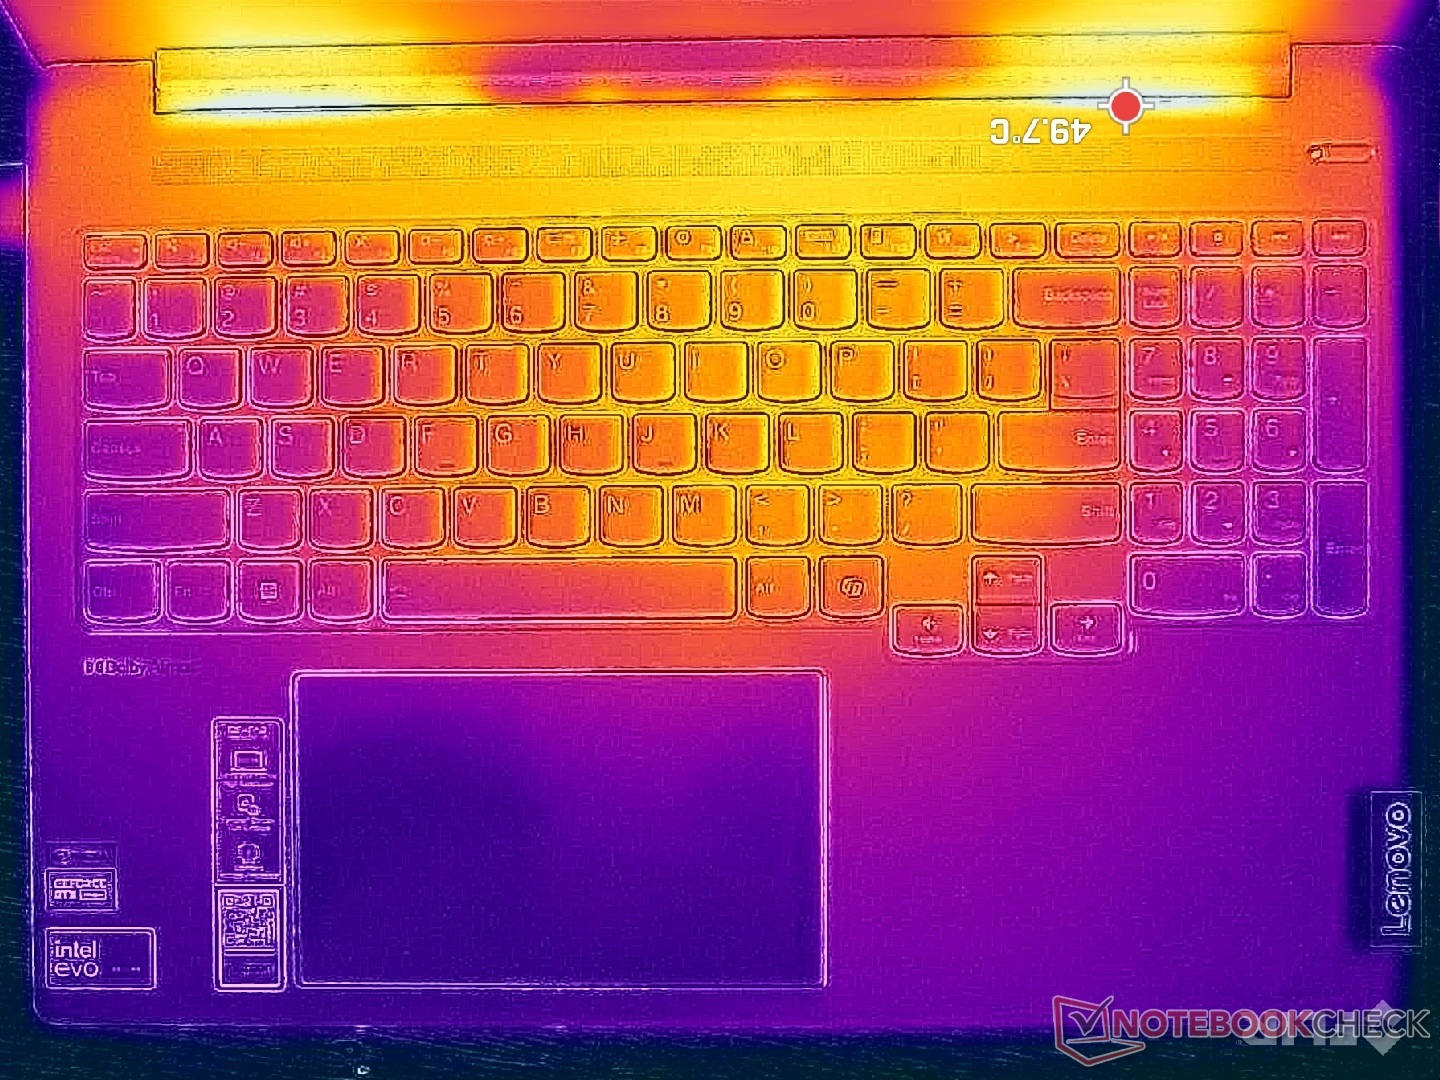
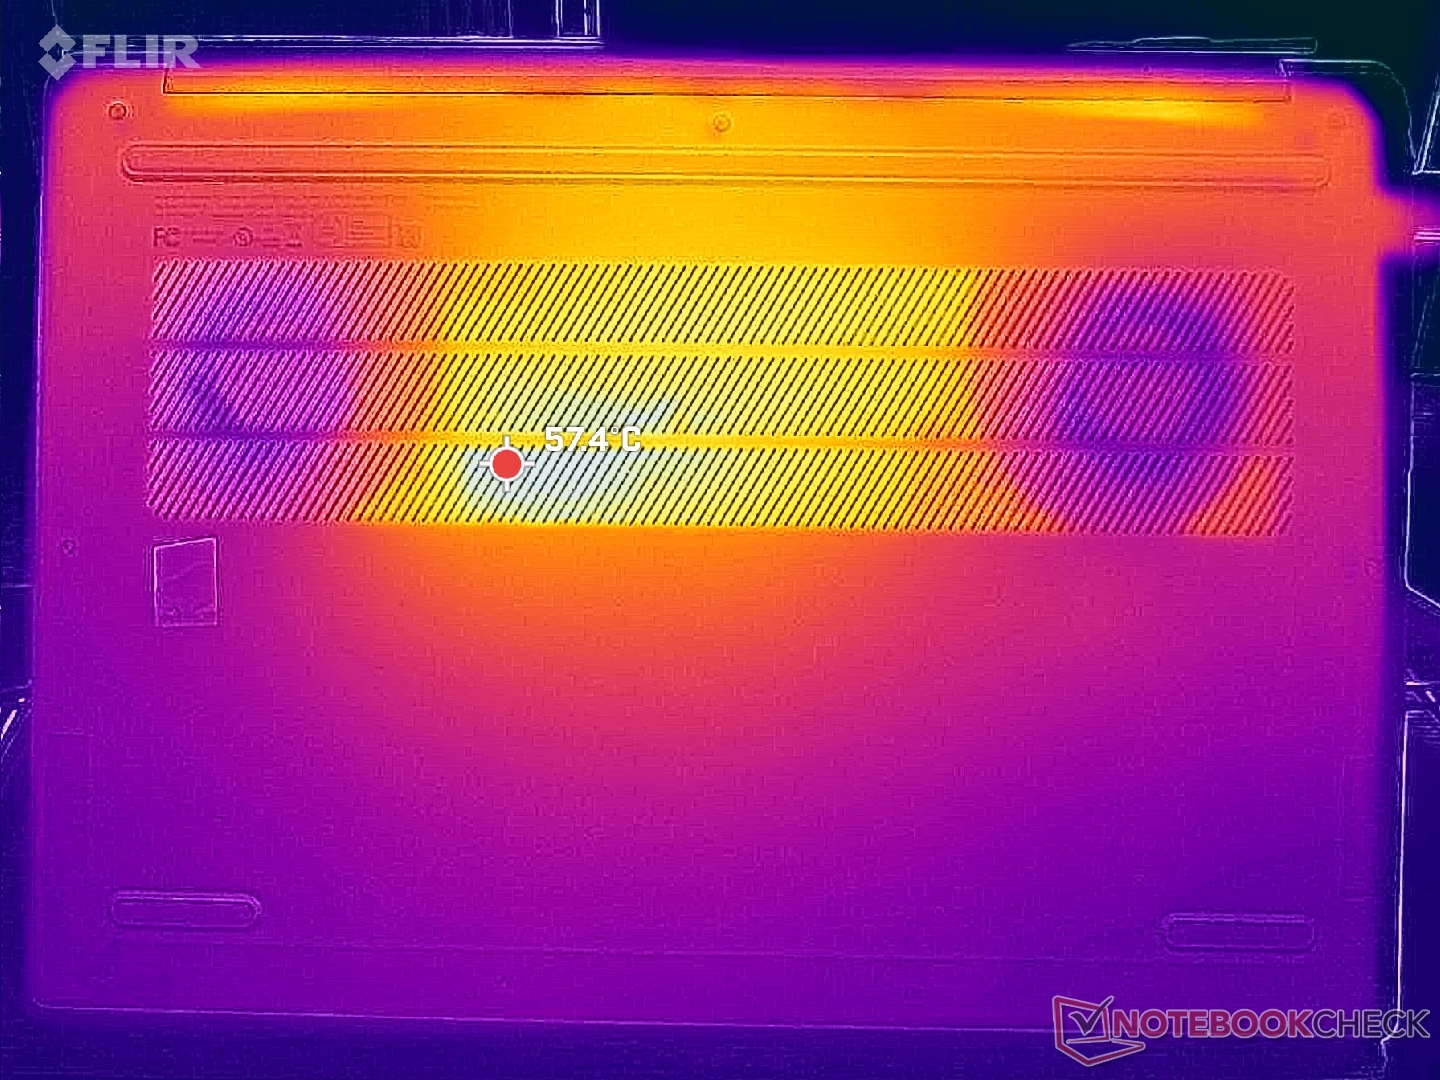
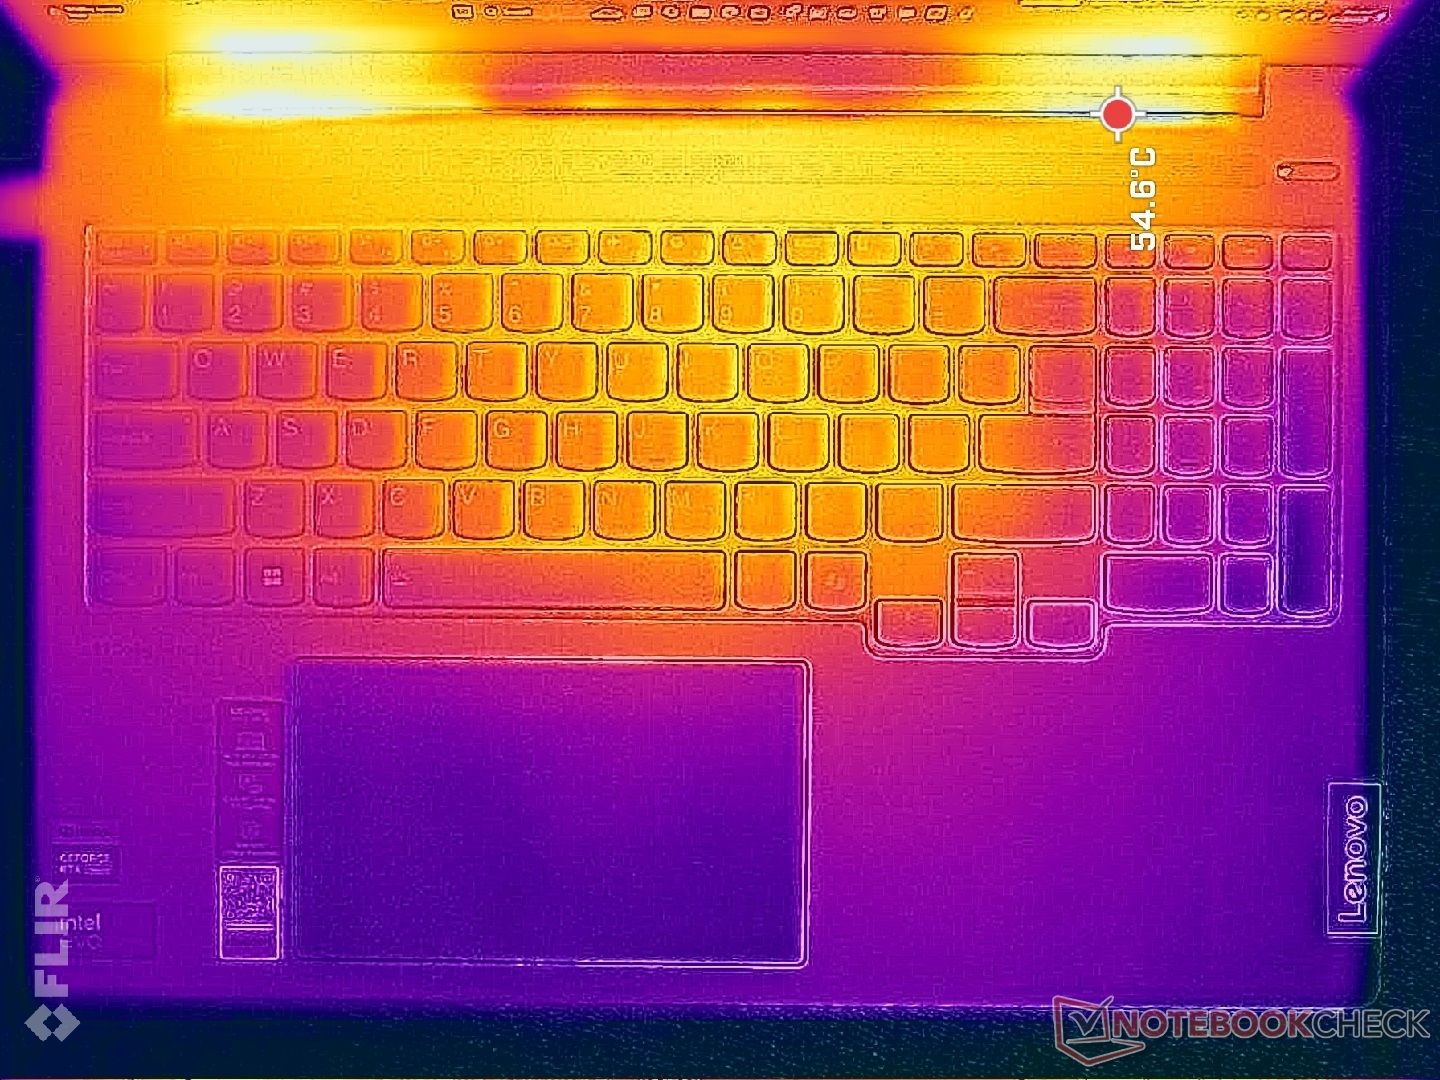
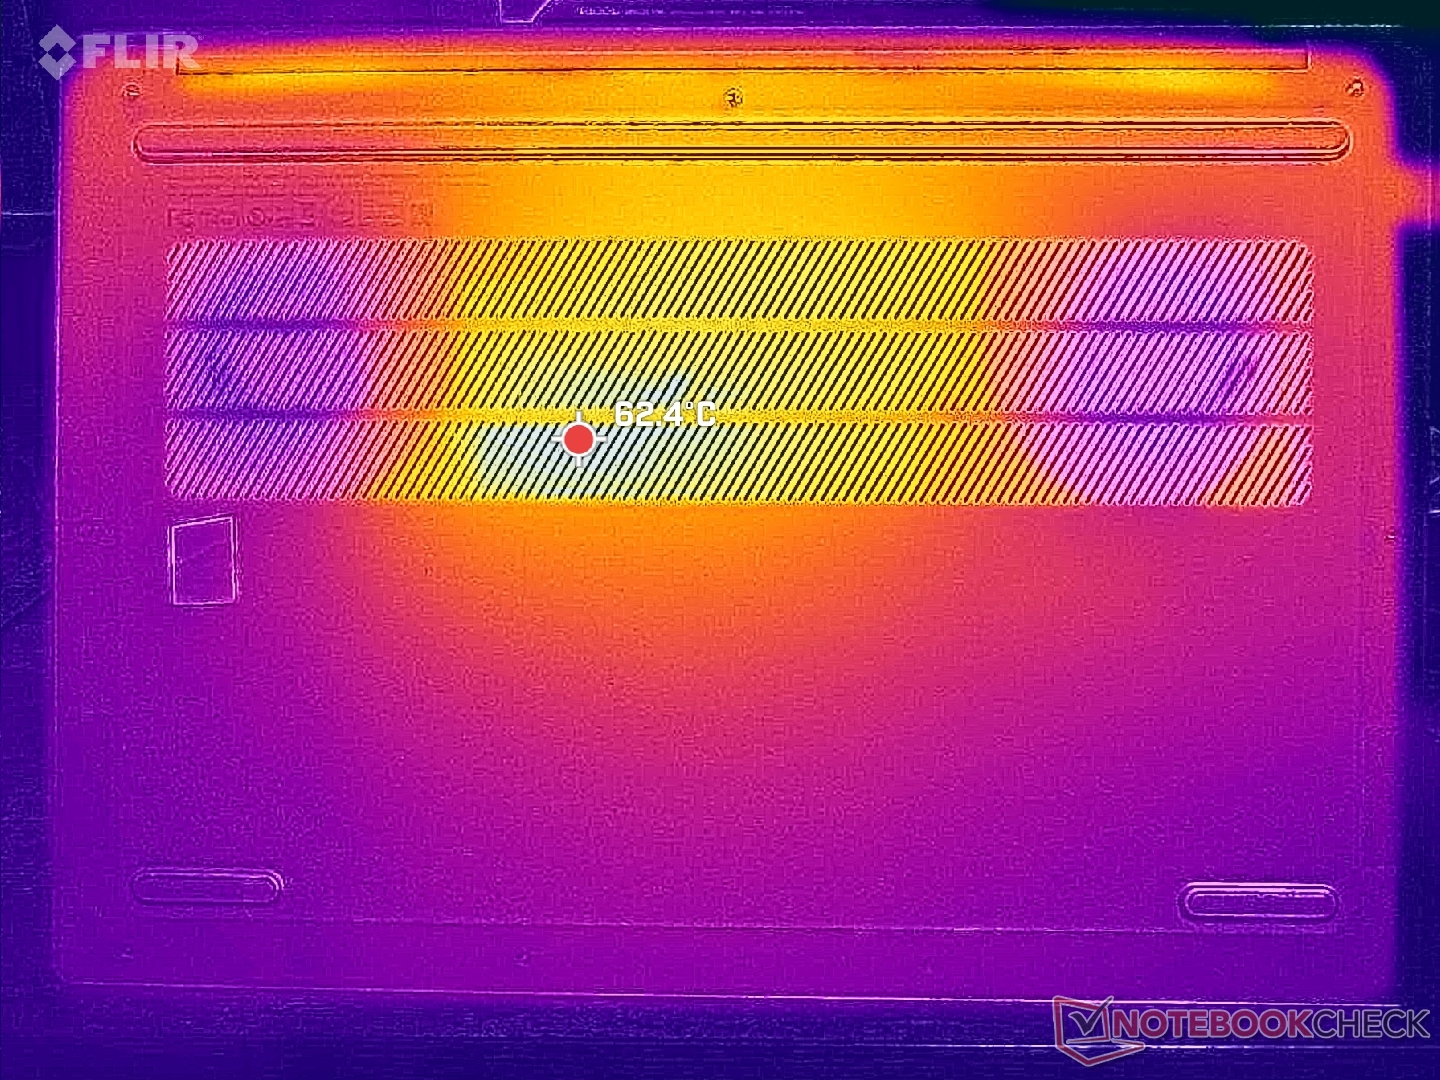
Temperatury powierzchni są zauważalnie wyższe niż w konfiguracji iGPU o ponad kilka stopni, nawet na biegu jałowym. Gorące punkty podczas grania mogą osiągnąć odpowiednio 42 C i 52 C na pokładzie klawiatury i dolnej powierzchni, w porównaniu do zaledwie 32 C i 38 C w wersji iGPU. Gorące punkty znajdują się na szczęście na środku klawiatury, ale zdecydowanie warto uruchamiać wymagające obciążenia na płaskim biurku, gdy tylko jest to możliwe, aby zapewnić optymalny przepływ powietrza.
System działa cieplej niż Galaxy Book4 Ultra, mimo że oba modele są wyposażone w podobne procesory Core Ultra H i opcje GeForce RTX.
(-) Maksymalna temperatura w górnej części wynosi 48.2 °C / 119 F, w porównaniu do średniej 36.9 °C / 98 F , począwszy od 21.1 do 71 °C dla klasy Multimedia.
(-) Dno nagrzewa się maksymalnie do 59.4 °C / 139 F, w porównaniu do średniej 39.2 °C / 103 F
(+) W stanie bezczynności średnia temperatura górnej części wynosi 31.2 °C / 88 F, w porównaniu ze średnią temperaturą urządzenia wynoszącą 31.3 °C / ### class_avg_f### F.
(±) 3: The average temperature for the upper side is 35.7 °C / 96 F, compared to the average of 31.3 °C / 88 F for the class Multimedia.
(+) Podparcia dłoni i touchpad osiągają maksymalną temperaturę skóry (34.4 °C / 93.9 F) i dlatego nie są gorące.
(-) Średnia temperatura obszaru podparcia dłoni w podobnych urządzeniach wynosiła 28.8 °C / 83.8 F (-5.6 °C / -10.1 F).
| Lenovo IdeaPad Pro 5 16IMH G9 RTX 4050 Intel Core Ultra 9 185H, NVIDIA GeForce RTX 4050 Laptop GPU | Lenovo IdeaPad Pro 5 16IMH G9 Intel Core Ultra 7 155H, Intel Arc 8-Core iGPU | Dell Inspiron 16 7640 2-in-1 Intel Core Ultra 7 155H, Intel Arc 8-Core iGPU | Asus Zenbook S 16 UM5606-RK333W AMD Ryzen AI 9 HX 370, AMD Radeon 890M | HP Envy x360 2-in-1 16-ad0097nr AMD Ryzen 7 8840HS, AMD Radeon 780M | Samsung Galaxy Book4 Ultra Intel Core Ultra 7 155H, NVIDIA GeForce RTX 4050 Laptop GPU | |
|---|---|---|---|---|---|---|
| Heat | 28% | 11% | 10% | 18% | 28% | |
| Maximum Upper Side * | 48.2 | 36.3 25% | 46.8 3% | 46.9 3% | 42.6 12% | 38.5 20% |
| Maximum Bottom * | 59.4 | 39.1 34% | 45.6 23% | 53.5 10% | 47.8 20% | 41.2 31% |
| Idle Upper Side * | 34.2 | 24.9 27% | 32.2 6% | 29.5 14% | 27.4 20% | 23.5 31% |
| Idle Bottom * | 34.8 | 26.1 25% | 31.4 10% | 30.2 13% | 27.8 20% | 24.1 31% |
* ... im mniej tym lepiej
Głośniki
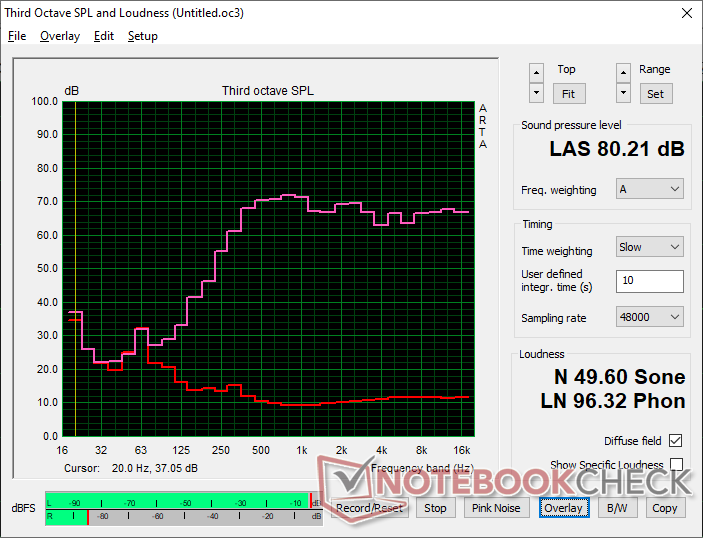
Lenovo IdeaPad Pro 5 16IMH G9 RTX 4050 analiza dźwięku
(±) | głośność głośnika jest średnia, ale dobra (80.2 dB)
Bas 100 - 315 Hz
(-) | prawie brak basu - średnio 22.4% niższa od mediany
(±) | liniowość basu jest średnia (10.3% delta do poprzedniej częstotliwości)
Średnie 400 - 2000 Hz
(+) | zbalansowane środki średnie - tylko 2.7% od mediany
(+) | średnie są liniowe (4% delta do poprzedniej częstotliwości)
Wysokie 2–16 kHz
(+) | zrównoważone maksima - tylko 1.5% od mediany
(+) | wzloty są liniowe (4.1% delta do poprzedniej częstotliwości)
Ogólnie 100 - 16.000 Hz
(+) | ogólny dźwięk jest liniowy (14.3% różnicy w stosunku do mediany)
W porównaniu do tej samej klasy
» 28% wszystkich testowanych urządzeń w tej klasie było lepszych, 5% podobnych, 67% gorszych
» Najlepszy miał deltę 5%, średnia wynosiła ###średnia###%, najgorsza wynosiła 45%
W porównaniu do wszystkich testowanych urządzeń
» 16% wszystkich testowanych urządzeń było lepszych, 4% podobnych, 80% gorszych
» Najlepszy miał deltę 4%, średnia wynosiła ###średnia###%, najgorsza wynosiła 134%
Apple MacBook Pro 16 2021 M1 Pro analiza dźwięku
(+) | głośniki mogą odtwarzać stosunkowo głośno (84.7 dB)
Bas 100 - 315 Hz
(+) | dobry bas - tylko 3.8% od mediany
(+) | bas jest liniowy (5.2% delta do poprzedniej częstotliwości)
Średnie 400 - 2000 Hz
(+) | zbalansowane środki średnie - tylko 1.3% od mediany
(+) | średnie są liniowe (2.1% delta do poprzedniej częstotliwości)
Wysokie 2–16 kHz
(+) | zrównoważone maksima - tylko 1.9% od mediany
(+) | wzloty są liniowe (2.7% delta do poprzedniej częstotliwości)
Ogólnie 100 - 16.000 Hz
(+) | ogólny dźwięk jest liniowy (4.6% różnicy w stosunku do mediany)
W porównaniu do tej samej klasy
» 0% wszystkich testowanych urządzeń w tej klasie było lepszych, 0% podobnych, 100% gorszych
» Najlepszy miał deltę 5%, średnia wynosiła ###średnia###%, najgorsza wynosiła 45%
W porównaniu do wszystkich testowanych urządzeń
» 0% wszystkich testowanych urządzeń było lepszych, 0% podobnych, 100% gorszych
» Najlepszy miał deltę 4%, średnia wynosiła ###średnia###%, najgorsza wynosiła 134%
Zarządzanie energią
Zużycie energii
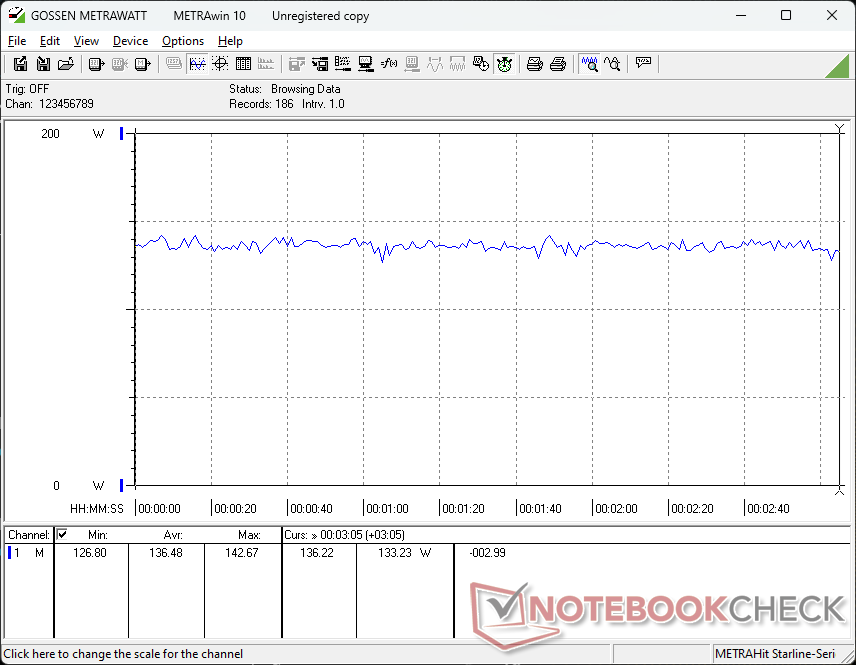
Praca na biegu jałowym na komputerze stacjonarnym wymaga do 15 W w porównaniu do zaledwie 10 W w konfiguracji iGPU, głównie ze względu na panel OLED. W przypadku wymagających obciążeń, takich jak gry, różnica ta wzrasta do 70-80 W. Warto zauważyć, że nasz procesor graficzny RTX 4050 osiąga nieco ponad 80 W podczas grania w porównaniu do zaledwie ~50 W w przypadku Galaxy Book4 Ultra tak więc ogólny pobór mocy jest zauważalnie wyższy na naszym Lenovo, aby był prawie jak podstawowy laptop do gier.
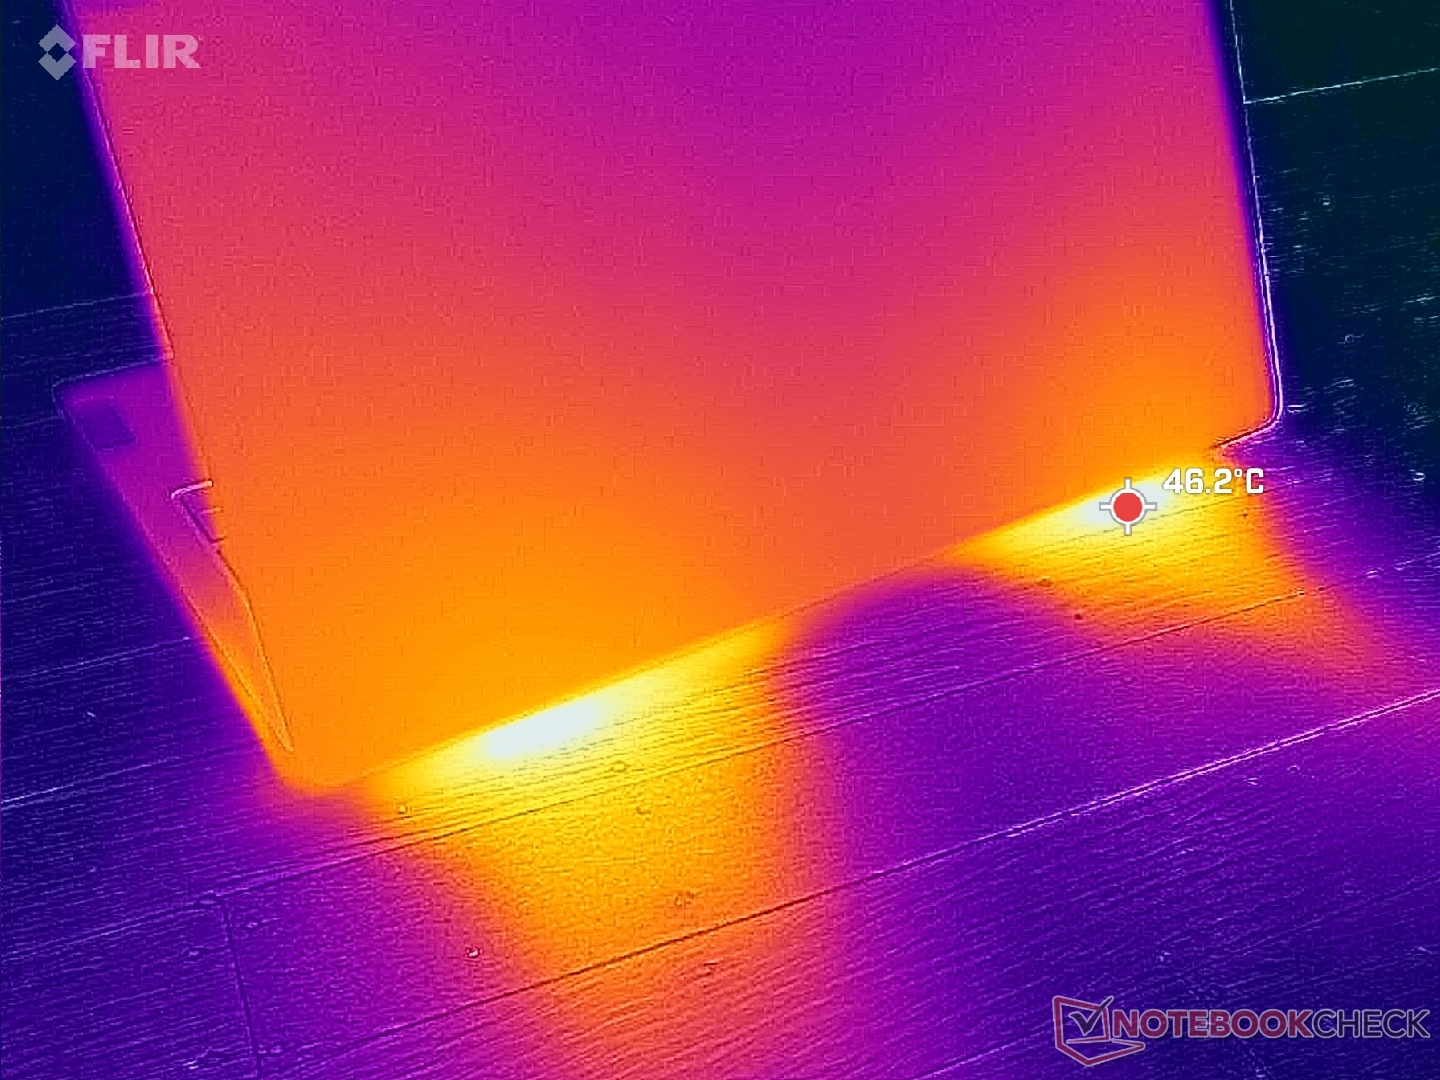
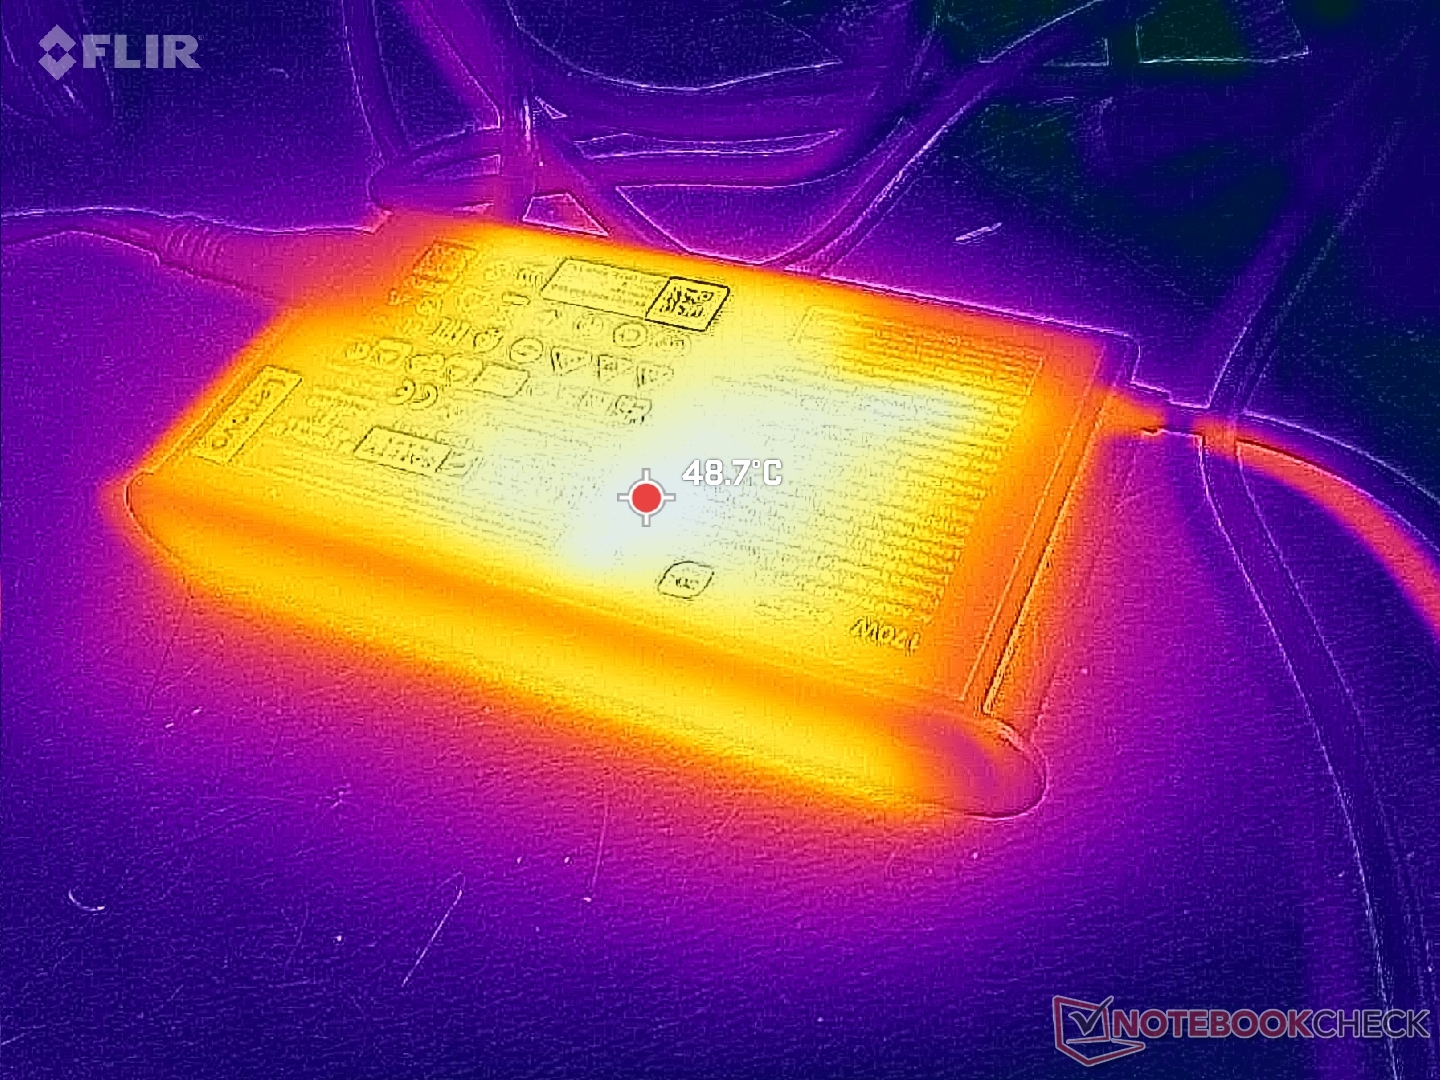
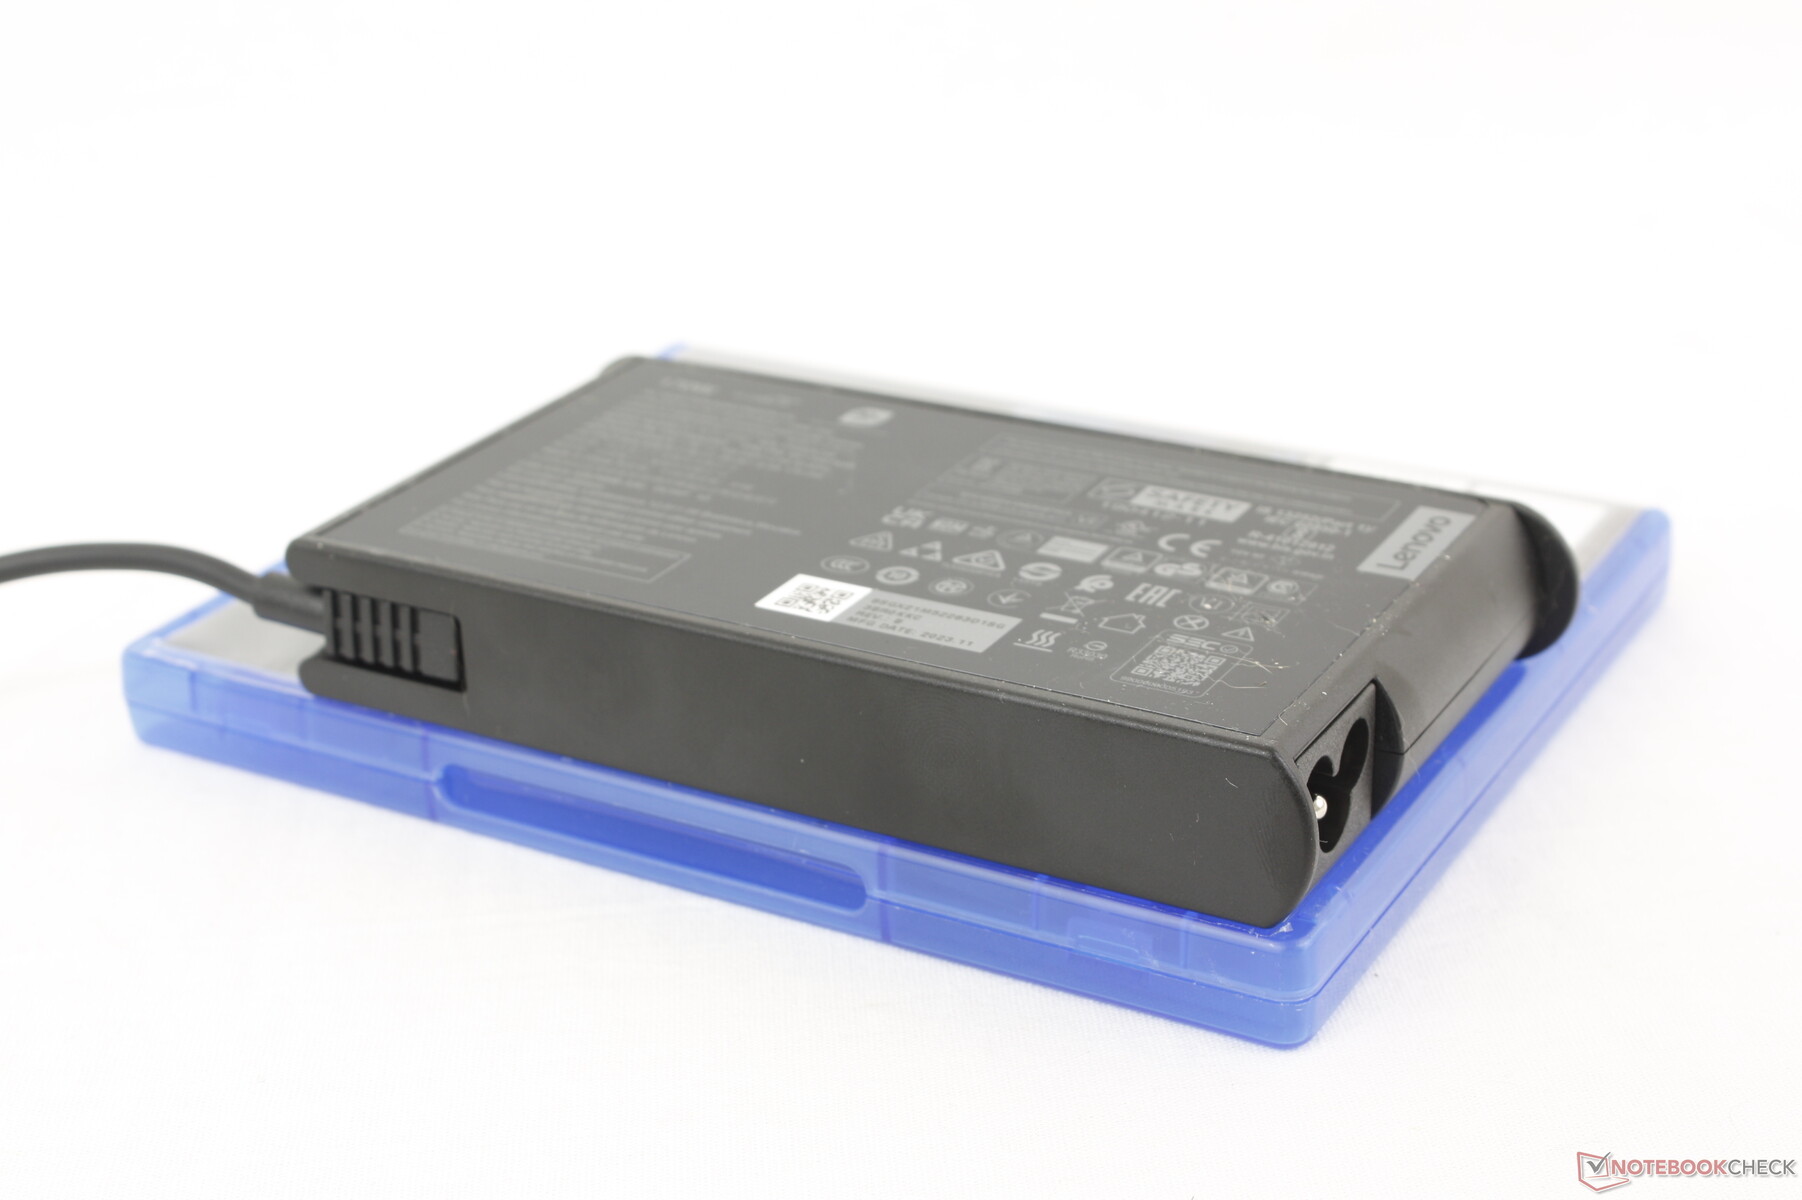
Jesteśmy w stanie zarejestrować tymczasowy maksymalny pobór mocy 172 W ze średniej wielkości (~ 15 x 7,8 x 2,2 cm) zasilacza sieciowego 170 W, gdy procesor i karta graficzna są wykorzystywane w 100 procentach. Zużycie energii podczas grania wahałoby się nieco poniżej 140 W, więc system może nadal jednocześnie ładować się w przyzwoitym tempie, jeśli zajdzie taka potrzeba. Cieszymy się, że system Lenovo obsługuje ładowanie prądem zmiennym typu beczkowego zamiast wyłącznie USB-C, ponieważ niższa moc tego ostatniego poważnie wpłynęłaby na wydajność. Na przykład Galaxy Book4 Ultra obsługuje tylko ładowanie przez USB-C, a mimo to nasz Lenovo konsekwentnie przewyższał Samsunga ze względu na wyższe pułapy mocy.
| wyłączony / stan wstrzymania | |
| luz | |
| obciążenie |
|
Legenda:
min: | |
| Lenovo IdeaPad Pro 5 16IMH G9 RTX 4050 Ultra 9 185H, NVIDIA GeForce RTX 4050 Laptop GPU, Samsung PM9C1a MZAL81T0HDLB, OLED, 2048x1280, 16" | Lenovo IdeaPad Pro 5 16IMH G9 Ultra 7 155H, Arc 8-Core, Samsung PM9C1a MZAL81T0HDLB, IPS, 2560x1600, 16" | Dell Inspiron 16 7640 2-in-1 Ultra 7 155H, Arc 8-Core, Micron 2550 1TB, Mini-LED, 2560x1600, 16" | Asus Zenbook S 16 UM5606-RK333W Ryzen AI 9 HX 370, Radeon 890M, Micron 2400 MTFDKBA1T0QFM, OLED, 2880x1800, 16" | HP Envy x360 2-in-1 16-ad0097nr R7 8840HS, Radeon 780M, KIOXIA BG5 KBG50ZNV1T02, OLED, 2880x1800, 16" | Samsung Galaxy Book4 Ultra Ultra 7 155H, NVIDIA GeForce RTX 4050 Laptop GPU, Samsung PM9A1 MZVL2512HCJQ, OLED, 2880x1800, 16" | |
|---|---|---|---|---|---|---|
| Power Consumption | 21% | 11% | 32% | 26% | 18% | |
| Idle Minimum * | 5.6 | 3.5 37% | 6.1 -9% | 5.4 4% | 5 11% | 4.8 14% |
| Idle Average * | 7.3 | 9.6 -32% | 13.5 -85% | 10.5 -44% | 6.2 15% | 7.5 -3% |
| Idle Maximum * | 14.6 | 9.9 32% | 13.8 5% | 10.9 25% | 14.7 -1% | 7.9 46% |
| Load Average * | 86.3 | 62.7 27% | 63.6 26% | 47.8 45% | 49.9 42% | 79.3 8% |
| Cyberpunk 2077 ultra external monitor * | 135.8 | 64.6 52% | 46.7 66% | |||
| Cyberpunk 2077 ultra * | 136.4 | 67 51% | 49.2 64% | |||
| Load Maximum * | 172 | 101.2 41% | 109.7 36% | 58.6 66% | 65 62% | 125 27% |
| Witcher 3 ultra * | 55.8 | 54.5 | 79.2 |
* ... im mniej tym lepiej
Power Consumption Cyberpunk / Stress Test
Power Consumption external Monitor
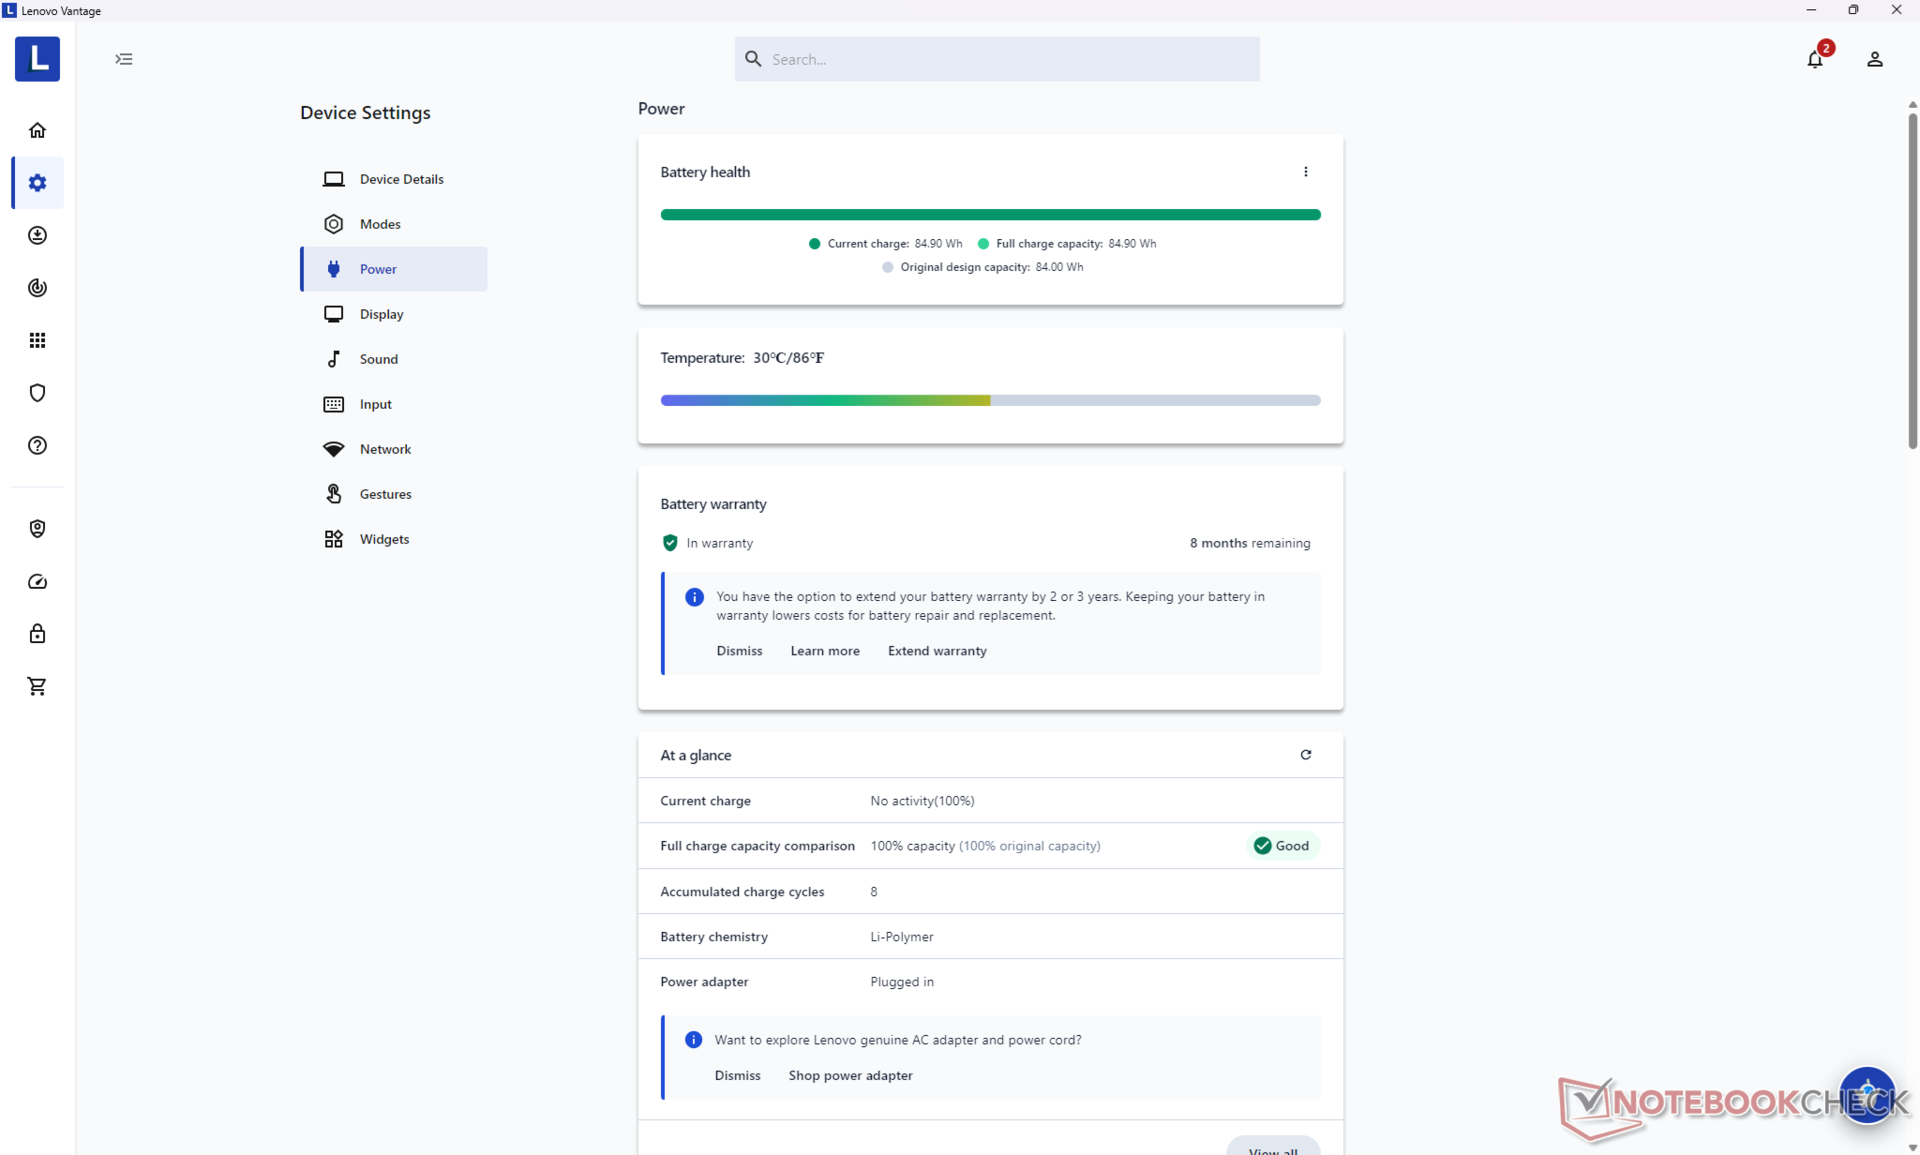
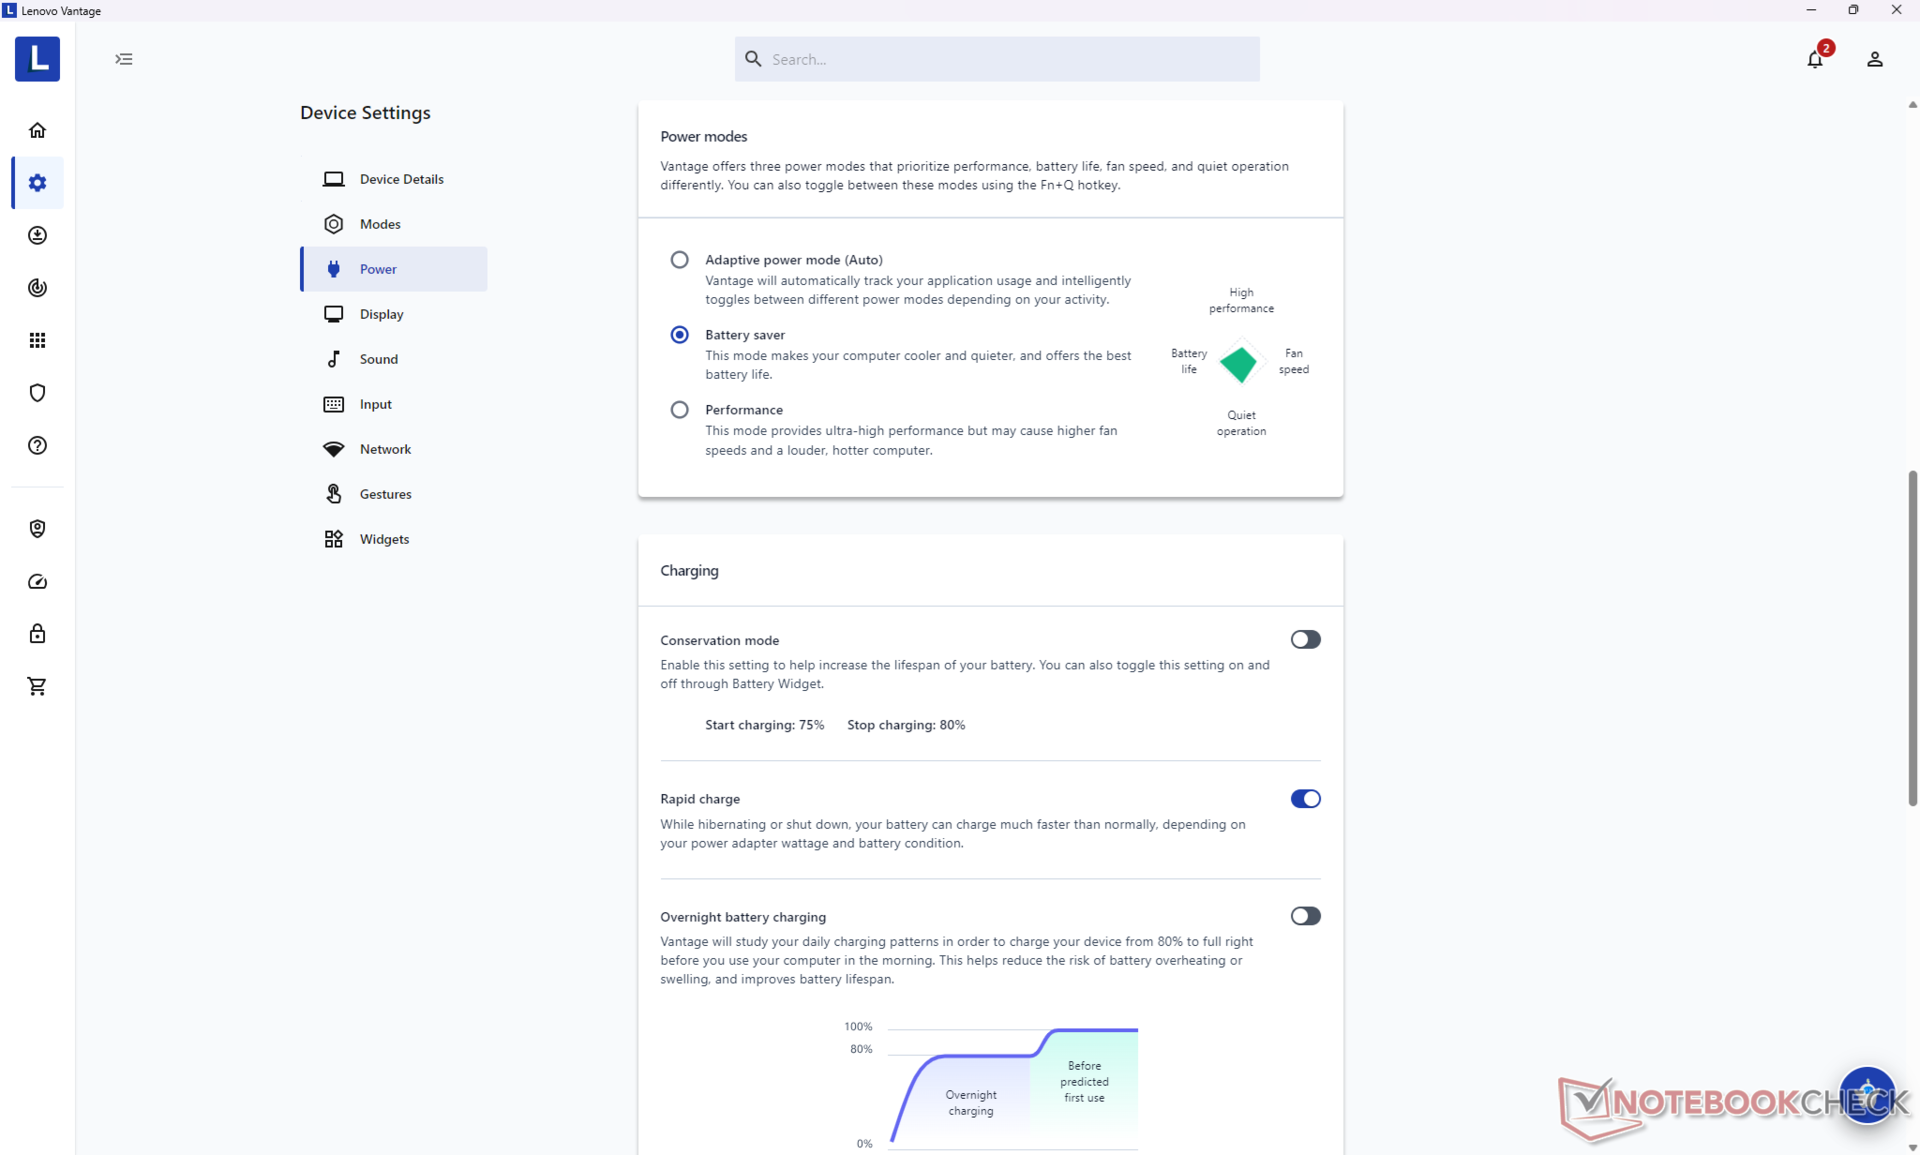
Żywotność baterii
Oczekuje się, że czasy pracy są krótsze niż w przypadku konfiguracji IPS iGPU z powodów wymienionych w sekcji powyżej. Mimo to, 10,5 godziny przeglądania sieci WLAN w świecie rzeczywistym jest nadal dość długie i porównywalne do Inspiron 16 7640 2-w-1 lub Zenbook S 16.
Ładowanie od stanu pustego do pełnej pojemności jest bardzo szybkie i trwa około 60 minut w porównaniu do 90 minut w przypadku większości innych ultrabooków. Ładowanie za pomocą zasilaczy sieciowych USB-C będzie wolniejsze.
| Lenovo IdeaPad Pro 5 16IMH G9 RTX 4050 Ultra 9 185H, NVIDIA GeForce RTX 4050 Laptop GPU, 84 Wh | Lenovo IdeaPad Pro 5 16IMH G9 Ultra 7 155H, Arc 8-Core, 84 Wh | Dell Inspiron 16 7640 2-in-1 Ultra 7 155H, Arc 8-Core, 90 Wh | Asus Zenbook S 16 UM5606-RK333W Ryzen AI 9 HX 370, Radeon 890M, 78 Wh | HP Envy x360 2-in-1 16-ad0097nr R7 8840HS, Radeon 780M, 68 Wh | Samsung Galaxy Book4 Ultra Ultra 7 155H, NVIDIA GeForce RTX 4050 Laptop GPU, 76 Wh | |
|---|---|---|---|---|---|---|
| Czasy pracy | 27% | 30% | 57% | 25% | 30% | |
| Reader / Idle | 1338 | 1310 -2% | 935 -30% | |||
| WiFi v1.3 | 639 | 756 18% | 686 7% | 640 0% | 459 -28% | 656 3% |
| Load | 50 | 68 36% | 93 86% | 107 114% | 116 132% | 78 56% |
| H.264 | 957 | 1204 | 1076 |
Za
Przeciw
Werdykt - dobrze wyważony za 1500 dolarów
Podczas gdy niższa konfiguracja iGPU jest przyzwoitą maszyną multimedialną, wyższa konfiguracja dGPU jest graniczną maszyną do gier. Jego 90 W grafika GeForce RTX 4050 jest szybsza niż w większości innych laptopów multimedialnych, takich jak Samsung Galaxy Book4 Ultra a nawet rywalizuje z wieloma podstawowymi laptopami do gier z grafiką RTX 4060, takimi jak Legion LOQ. System jest całkiem mocny, biorąc pod uwagę cienki profil i nudny, biurowy design.
IdeaPad Pro 5 16 G9 jest szybszy niż się wydaje, gdy jest w pełni skonfigurowany dzięki mocnemu procesorowi graficznemu RTX 4050 o mocy 90 W GeForce.
Cała ta wydajność w tak cienkiej obudowie odbywa się kosztem krótszego czasu pracy na baterii, głośniejszych wentylatorów i wyższych temperatur niż w przypadku niższej klasy opcji iGPU i większości konkurentów w 16-calowej przestrzeni. Lenovo mogło złagodzić te wady, wybierając wolniejszy procesor graficzny o mocy 50 W, ale tak naprawdę podoba nam się, że wybrali wyższy pułap 90 W, aby lepiej odróżnić IdeaPad Pro 5 16 G9 od konkurencji. Nie wyróżnia się szczególnie w pracy biurowej w taki sam sposób jak ThinkPad T16 ani w grach w taki sam sposób jak Legion Pro 5 16ale jest lepszy niż przeciętny w obu przypadkach, aby być dobrym rozwiązaniem do wszystkich zadań.
Cena i dostępność
Costco wysyła teraz lenovo IdeaPad Pro 5i 16 z Core Ultra 9 185H i RTX 4050 w konfiguracji za 1500 USD lub 1350 USD podczas ograniczonej czasowo wyprzedaży.
Uwaga: Niedawno zaktualizowaliśmy nasz system oceny i wyniki wersji 8 nie są porównywalne z wynikami wersji 7. Więcej informacji znajdą Państwo tutaj .
Lenovo IdeaPad Pro 5 16IMH G9 RTX 4050
- 08/09/2024 v8
Allen Ngo
 Total Sustainability Score:
 Przezroczystość
Wyboru urządzeń do recenzji dokonuje nasza redakcja. Próbka testowa została udostępniona autorowi jako pożyczka od producenta lub sprzedawcy detalicznego na potrzeby tej recenzji. Pożyczkodawca nie miał wpływu na tę recenzję, producent nie otrzymał też kopii tej recenzji przed publikacją. Nie było obowiązku publikowania tej recenzji. Nigdy nie przyjmujemy rekompensaty ani płatności w zamian za nasze recenzje. Jako niezależna firma medialna, Notebookcheck nie podlega władzy producentów, sprzedawców detalicznych ani wydawców.
Tak testuje Notebookcheck
Każdego roku Notebookcheck niezależnie sprawdza setki laptopów i smartfonów, stosując standardowe procedury, aby zapewnić porównywalność wszystkich wyników. Od około 20 lat stale rozwijamy nasze metody badawcze, ustanawiając przy tym standardy branżowe. W naszych laboratoriach testowych doświadczeni technicy i redaktorzy korzystają z wysokiej jakości sprzętu pomiarowego. Testy te obejmują wieloetapowy proces walidacji. Nasz kompleksowy system ocen opiera się na setkach uzasadnionych pomiarów i benchmarków, co pozwala zachować obiektywizm.Price comparison

