

Recenzja HP ZBook Power 16 G11 A: Wydajna stacja robocza z procesorem AMD Zen 4

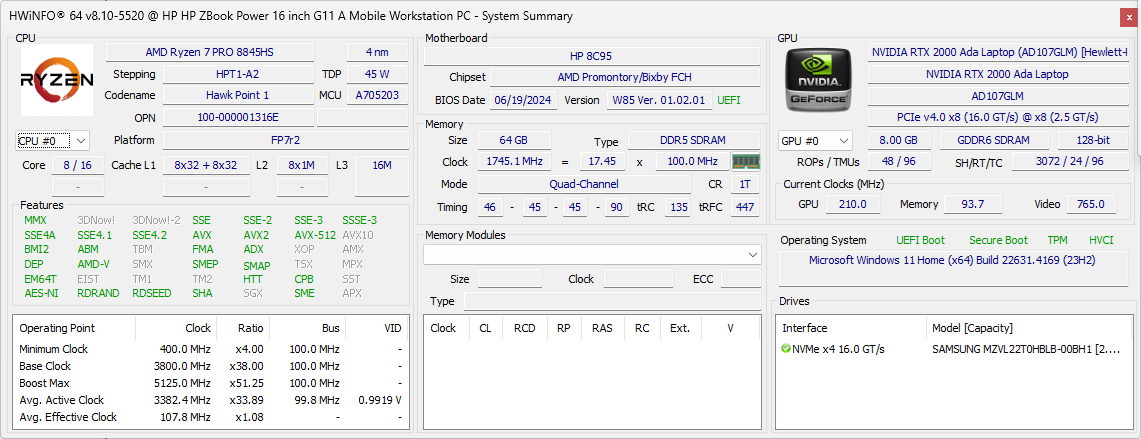
ZBook Power 16 G11 to następca starszego modelu ZBook Power 15 G10 z nowymi procesorami wewnętrznymi i zmianami zewnętrznymi. Jak sama nazwa wskazuje, ZBook Power 16 G11 modernizuje serię, porzucając starą 15,6-calową obudowę na rzecz 16-calowej konstrukcji. Pod względem wydajności plasuje się on pomiędzy niższym modelem ZBook Firefly i wyższym ZBook Fury. Użytkownicy mogą skonfigurować go z procesorami Intel Core Ultra Meteor Lake lub AMD Ryzen Zen 4 i grafiką Nvidia RTX.
Nasza recenzowana jednostka to wyższej klasy konfiguracja AMD (ZBook Power 16 G11 A) z procesorem Ryzen 7 8845HS, układem graficznym RTX 2000 Ada i wyświetlaczem IPS 120 Hz 2560 x 1600p za około 2100 USD. Opcje są bardzo szerokie, od Ryzen 5 8645HS do Ryzen 9 8945HS z wyświetlaczem 1200p i grafiką RTX 1000, RTX 2000 lub RTX 3000. Użytkownicy mogą również zdecydować się na brak oddzielnej grafiki.
Konkurenci w tej dziedzinie obejmują inne 16-calowe stacje robocze, takie jak Dell Precision 5690, MSI CreatorPro Z16Plub Lenovo ThinkPad P16s G2.
Więcej recenzji HP:
Potencjalni konkurenci w porównaniu
Ocena | Wersja | Data | Model | Waga | Wysokość | Rozmiar | Rezolucja | Cena |
|---|---|---|---|---|---|---|---|---|
| 85.4 % | v8 | 10/2024 | HP ZBook Power 16 G11 A R7 8845HS, NVIDIA RTX 2000 Ada Generation Laptop GPU | 2.2 kg | 22.9 mm | 16.00" | 2560x1600 | |
| 88.9 % v7 (old) | v7 (old) | 12/2023 | HP ZBook Power 15 G10 R7 PRO 7840HS, NVIDIA RTX 2000 Ada Generation Laptop GPU | 2 kg | 22.9 mm | 15.60" | 2560x1440 | |
| 85.9 % | v8 | 08/2024 | HP ZBook Fury 16 G11 i9-14900HX, NVIDIA RTX 3500 Ada Generation Laptop GPU | 2.6 kg | 28.5 mm | 16.00" | 3840x2400 | |
| 83.5 % | v8 | 10/2024 | Lenovo ThinkPad P1 Gen 7 21KV001SGE Ultra 7 155H, NVIDIA GeForce RTX 4060 Laptop GPU | 2 kg | 20.5 mm | 16.00" | 2560x1600 | |
| 88.6 % v7 (old) | v7 (old) | 01/2024 | Lenovo ThinkPad P16s G2 21K9000CGE R7 PRO 7840U, Radeon 780M | 1.8 kg | 24.4 mm | 16.00" | 3840x2400 | |
| 88.3 % v7 (old) | v7 (old) | 05/2024 | Dell Precision 5690 Ultra 9 185H, NVIDIA RTX 5000 Ada Generation Laptop GPU | 2.3 kg | 22.17 mm | 16.00" | 3840x2400 |
Uwaga: Niedawno zaktualizowaliśmy nasz system oceny i wyniki wersji 8 nie są porównywalne z wynikami wersji 7. Więcej informacji znajdą Państwo tutaj .
Obudowa - certyfikat MIL-STD 810
HP wykorzystuje podobne szare materiały ze stopu aluminium dla prawie wszystkich swoich modeli ZBook, aby zapewnić poczucie spójności w całej rodzinie. W tym przypadku ZBook Power 16 G11 ma tę samą gładką matową metalową teksturę co ZBook Power 15 G10, ale z powierzchownymi zmianami w obramowaniu klawiatury, zewnętrznym wykończeniu pokrywy i dolnym panelu.
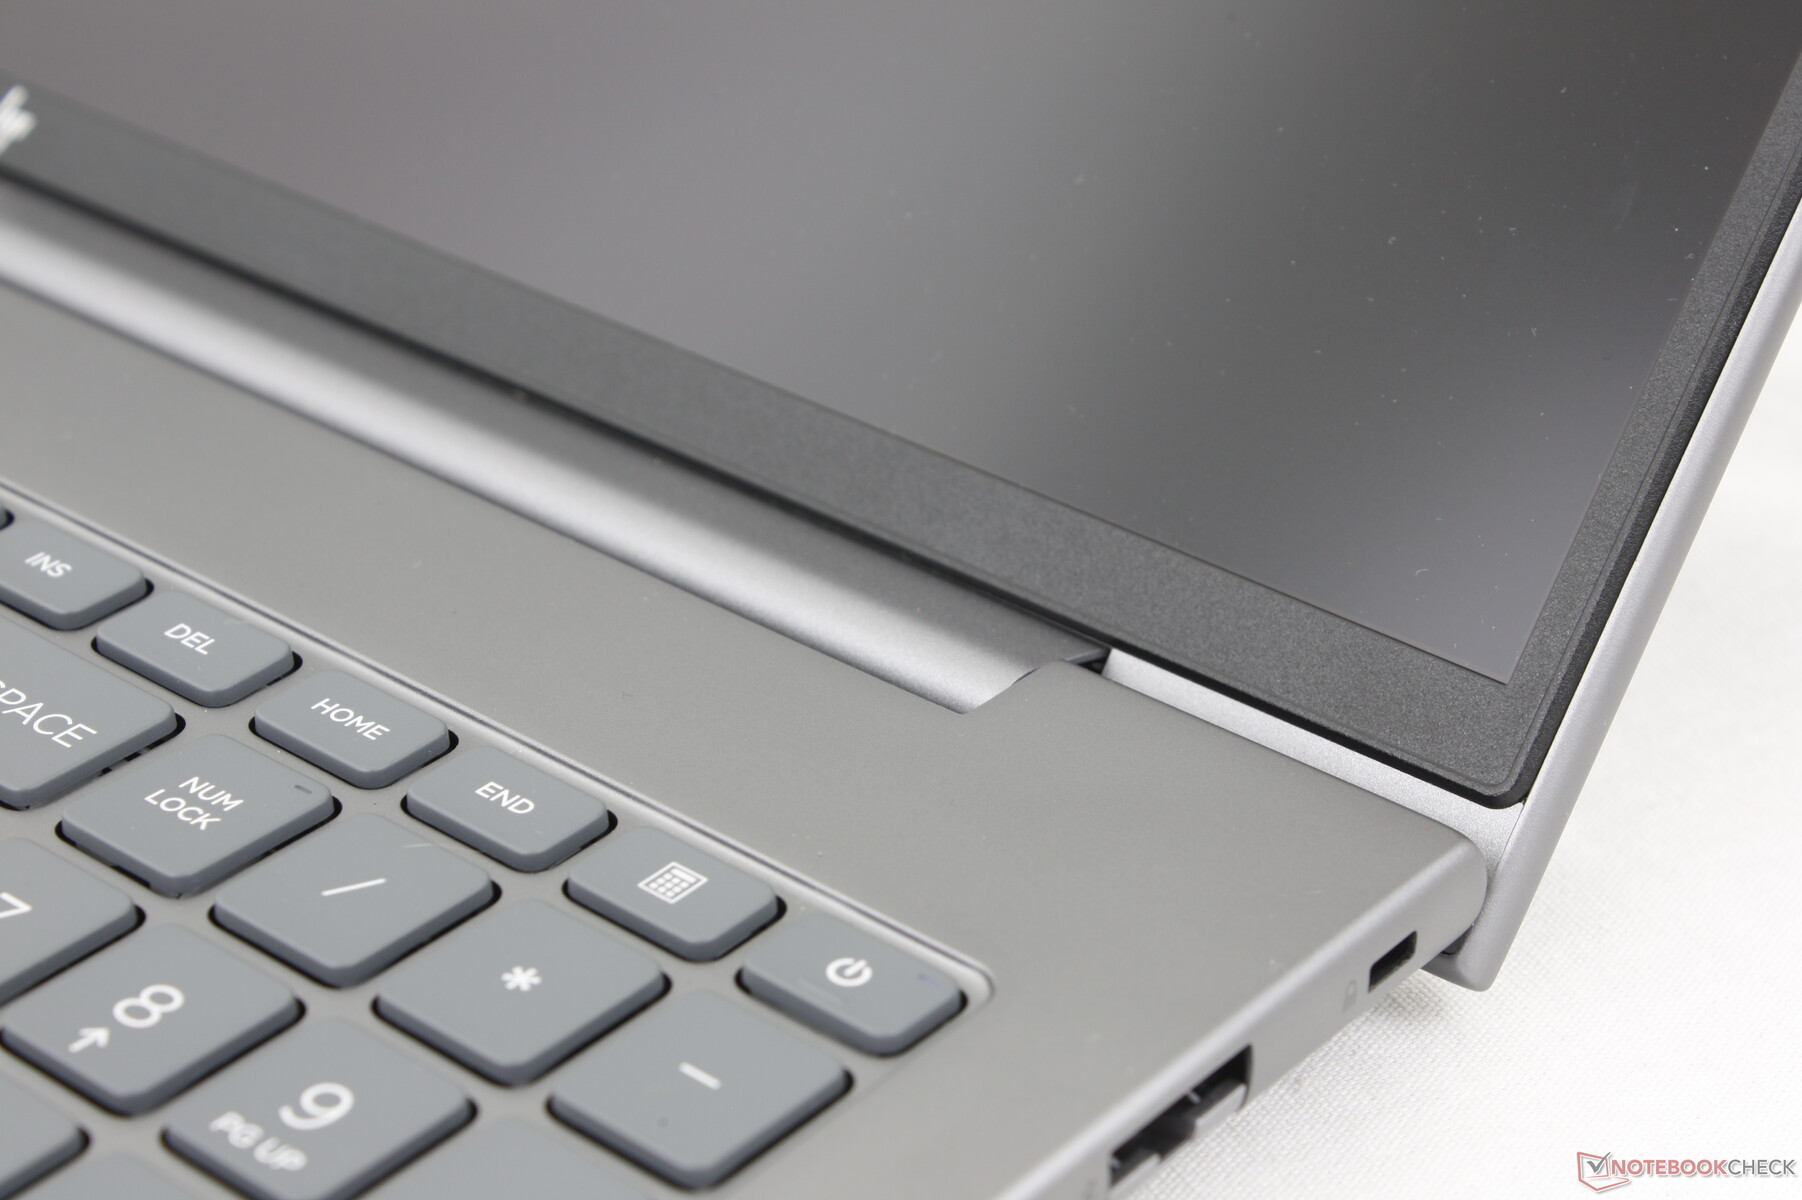
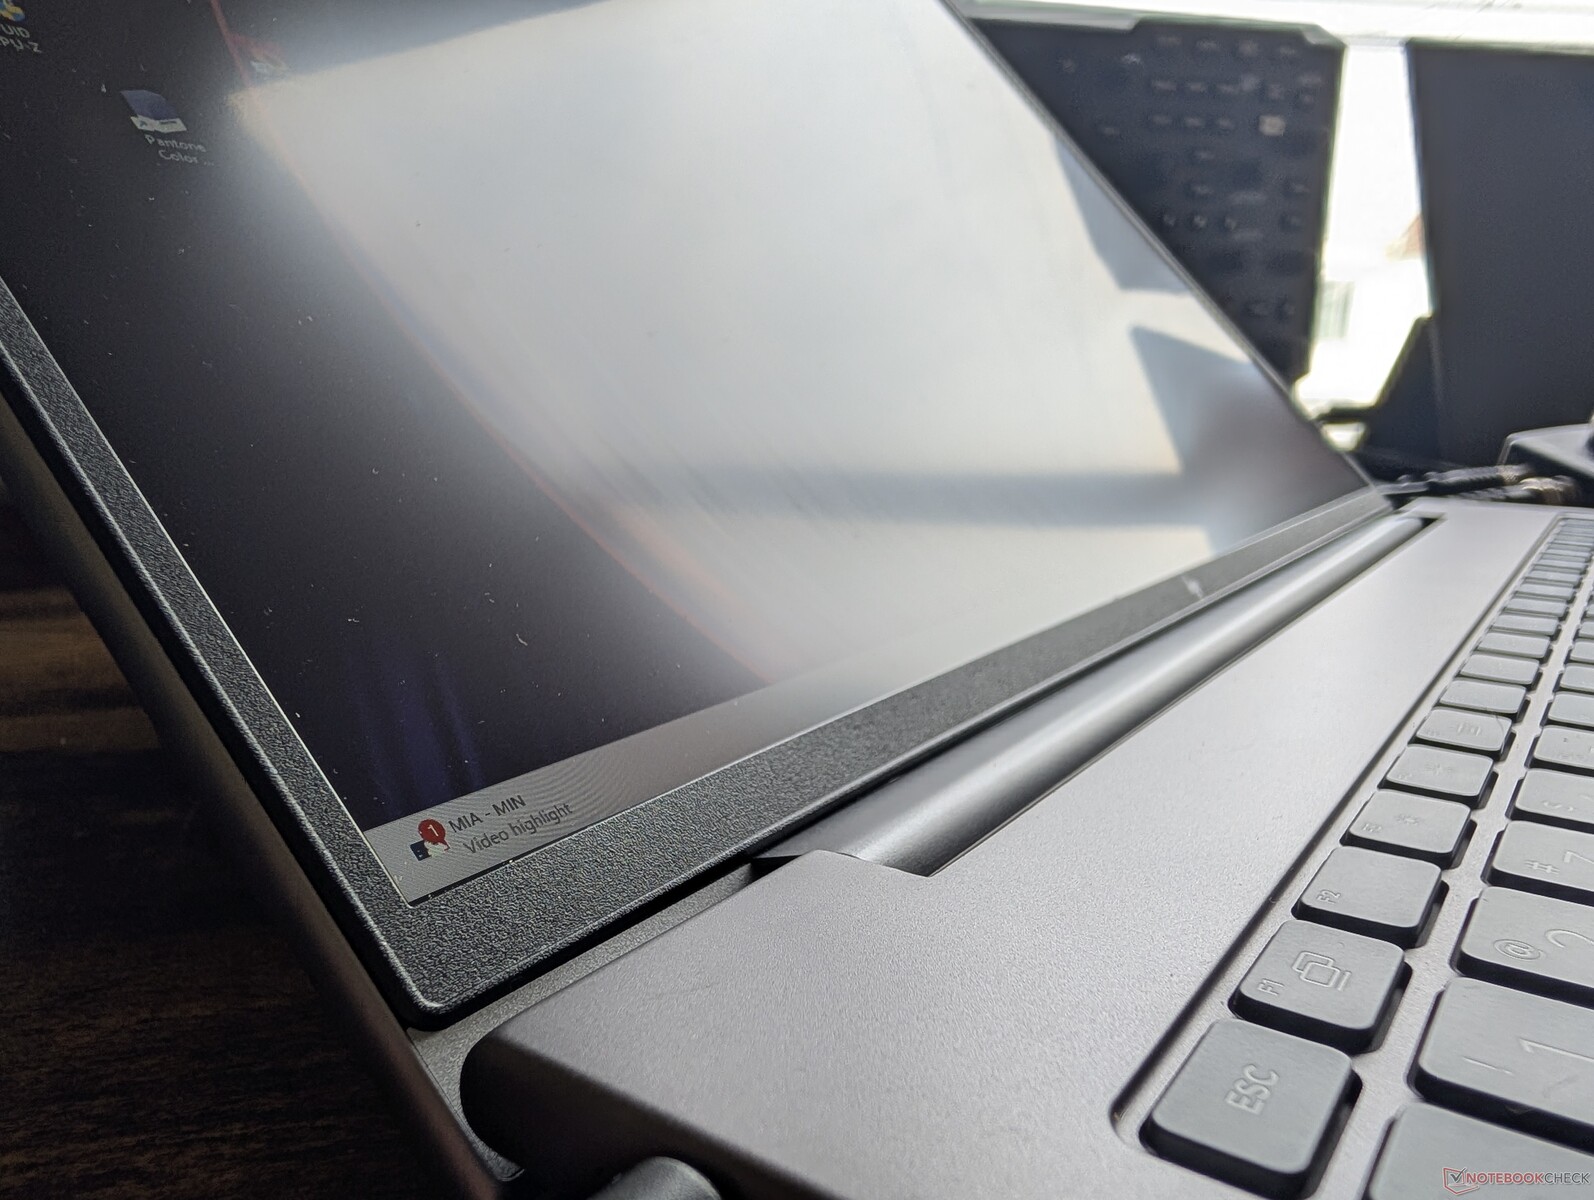
Sztywność obudowy jest doskonała, z minimalnymi ugięciami i wgłębieniami przy próbie skręcenia podstawy. Zawiasy i pokrywa mogłyby być jednak sztywniejsze, zwłaszcza że pokrywa może otworzyć się prawie o pełne 180 stopni, w przeciwieństwie do modelu Precision 5690.
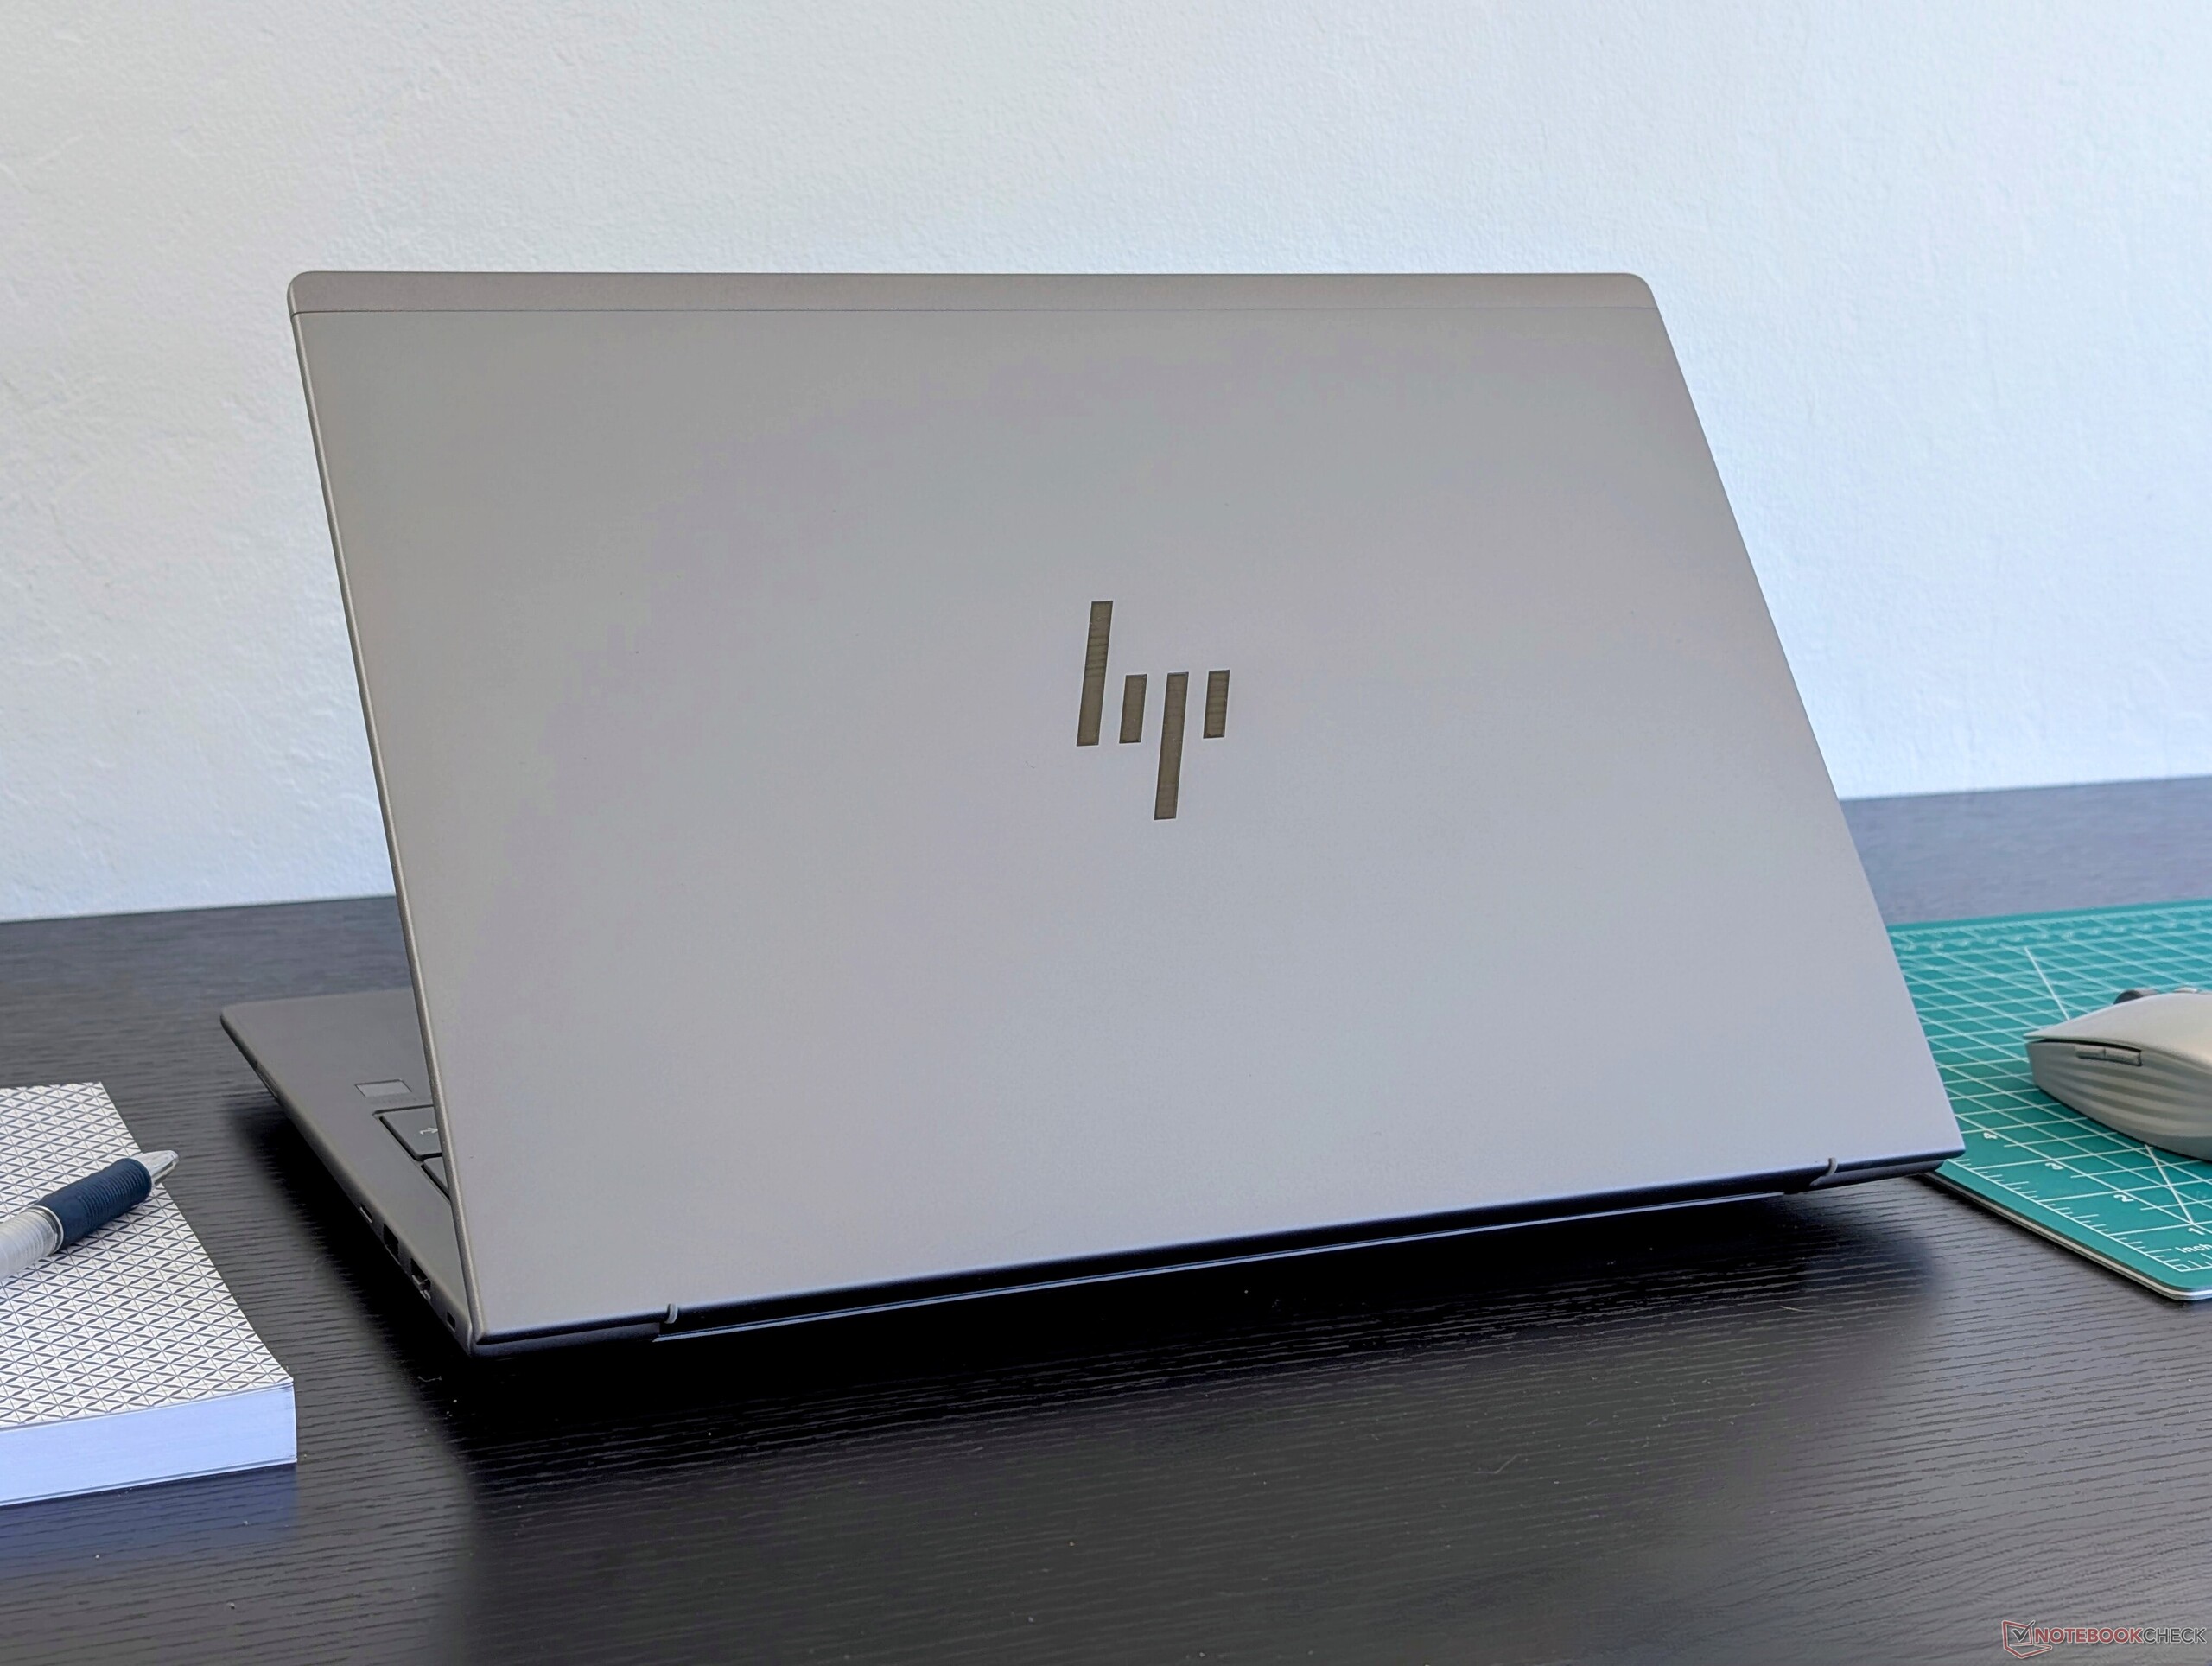
Nowa 16-calowa konstrukcja jest o około 10 procent cięższa i o 7 procent większa niż poprzedni 15-calowy model. W szczególności nie jest on cieńszy, co jest kłopotliwe, ponieważ jest już grubszy niż niektórzy konkurenci, tacy jak ThinkPad P1 Gen 7. The ZBook Fury 16 G11 jest jeszcze cięższy i jeszcze grubszy, ale z szybszymi opcjami procesora i karty graficznej, aby to zrekompensować. HP oferuje smuklejszy ZBook Firefly 16 jeśli użytkownicy chcą bardziej przenośnej opcji.
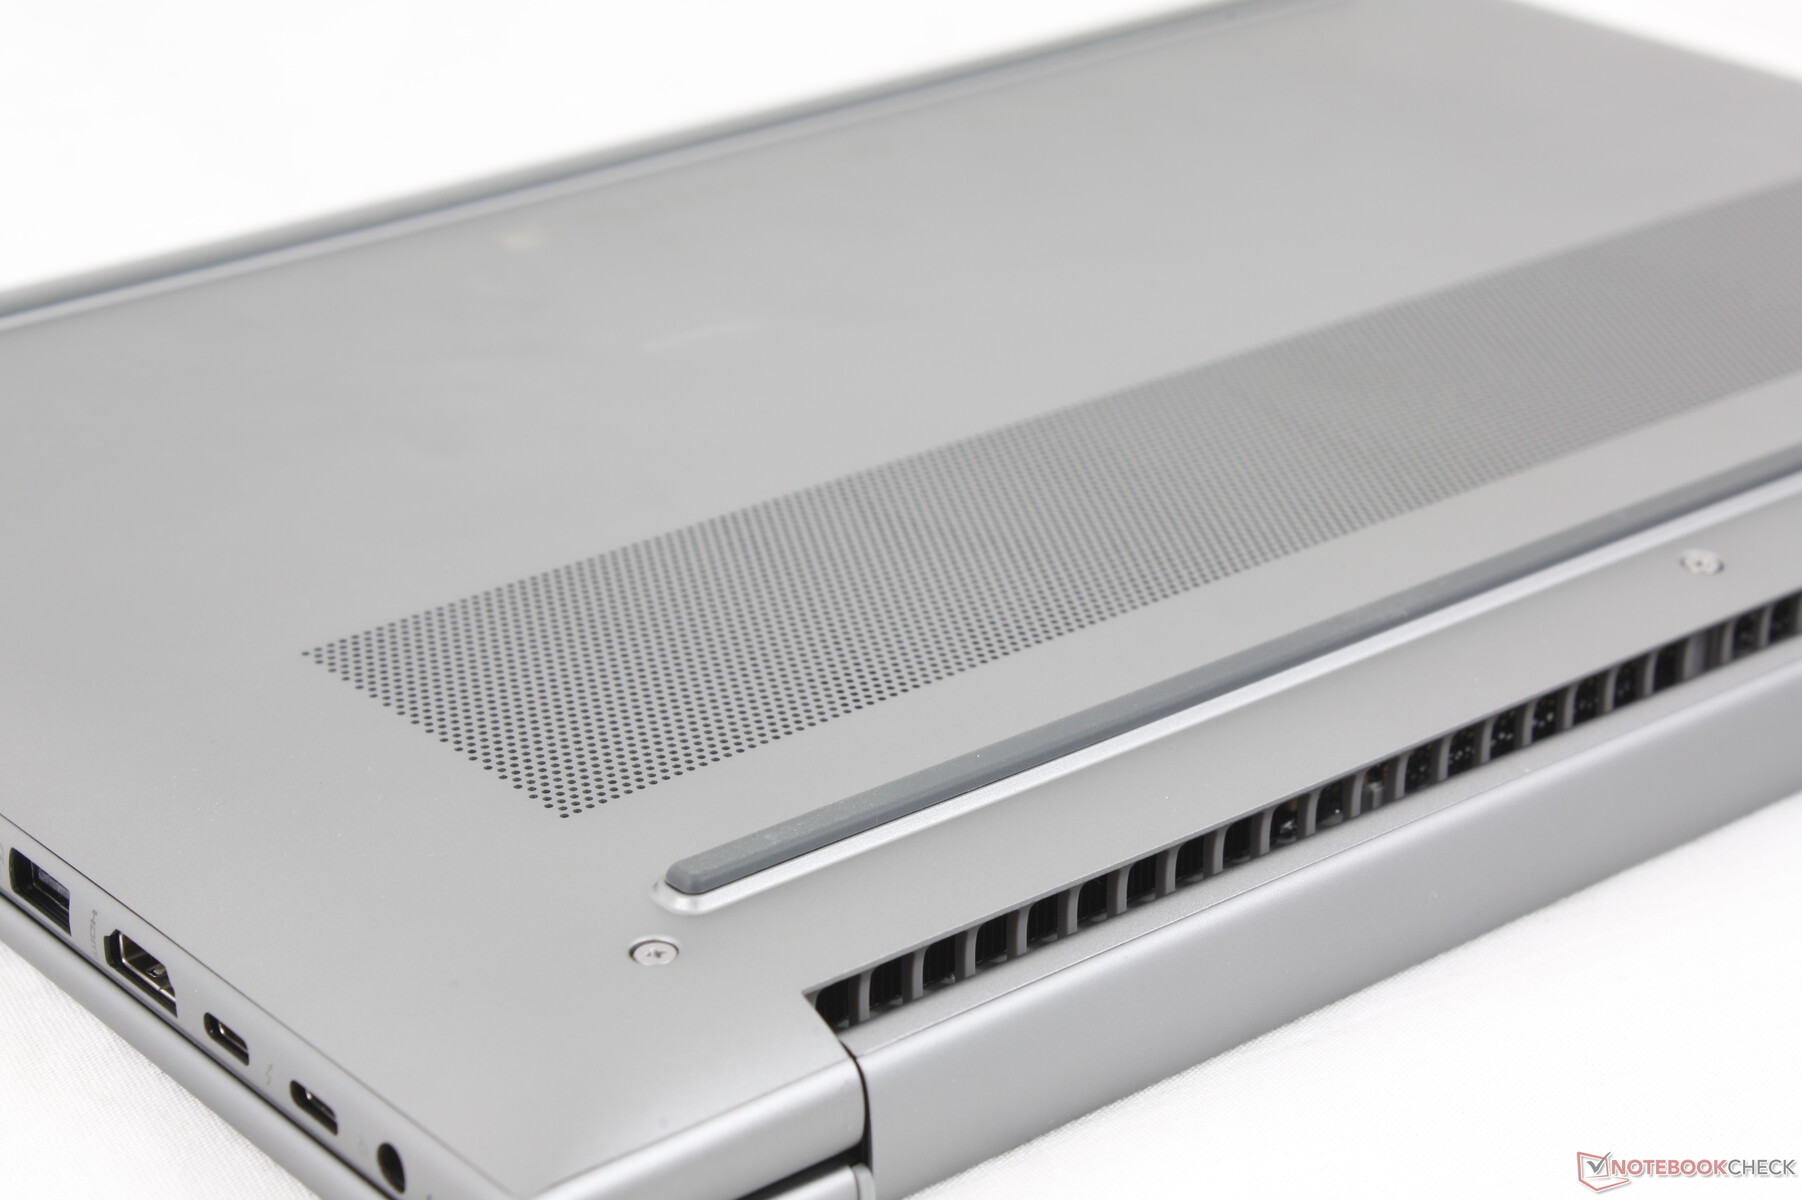
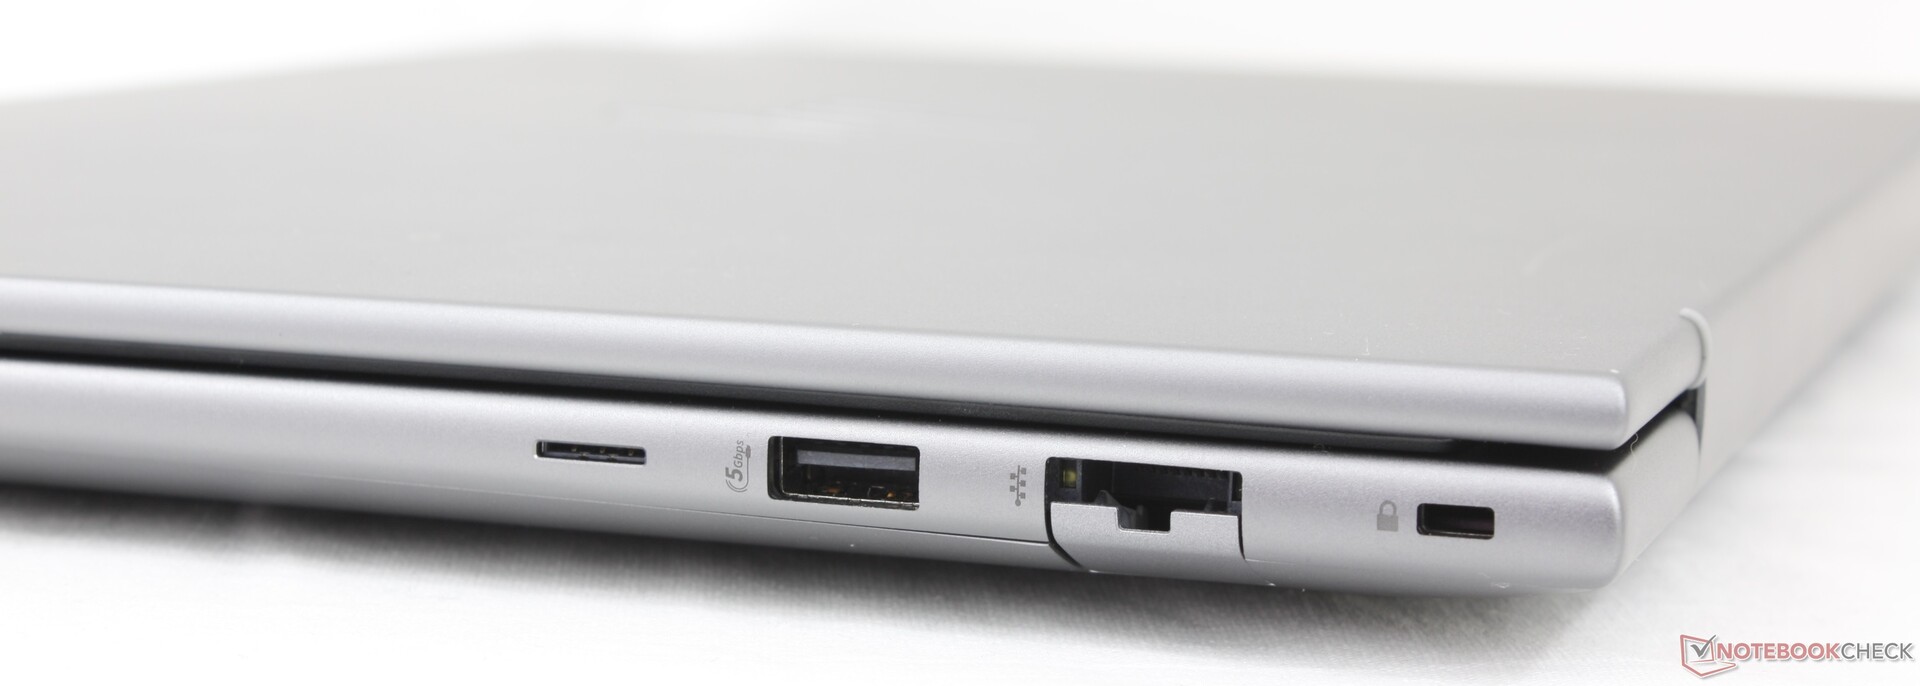
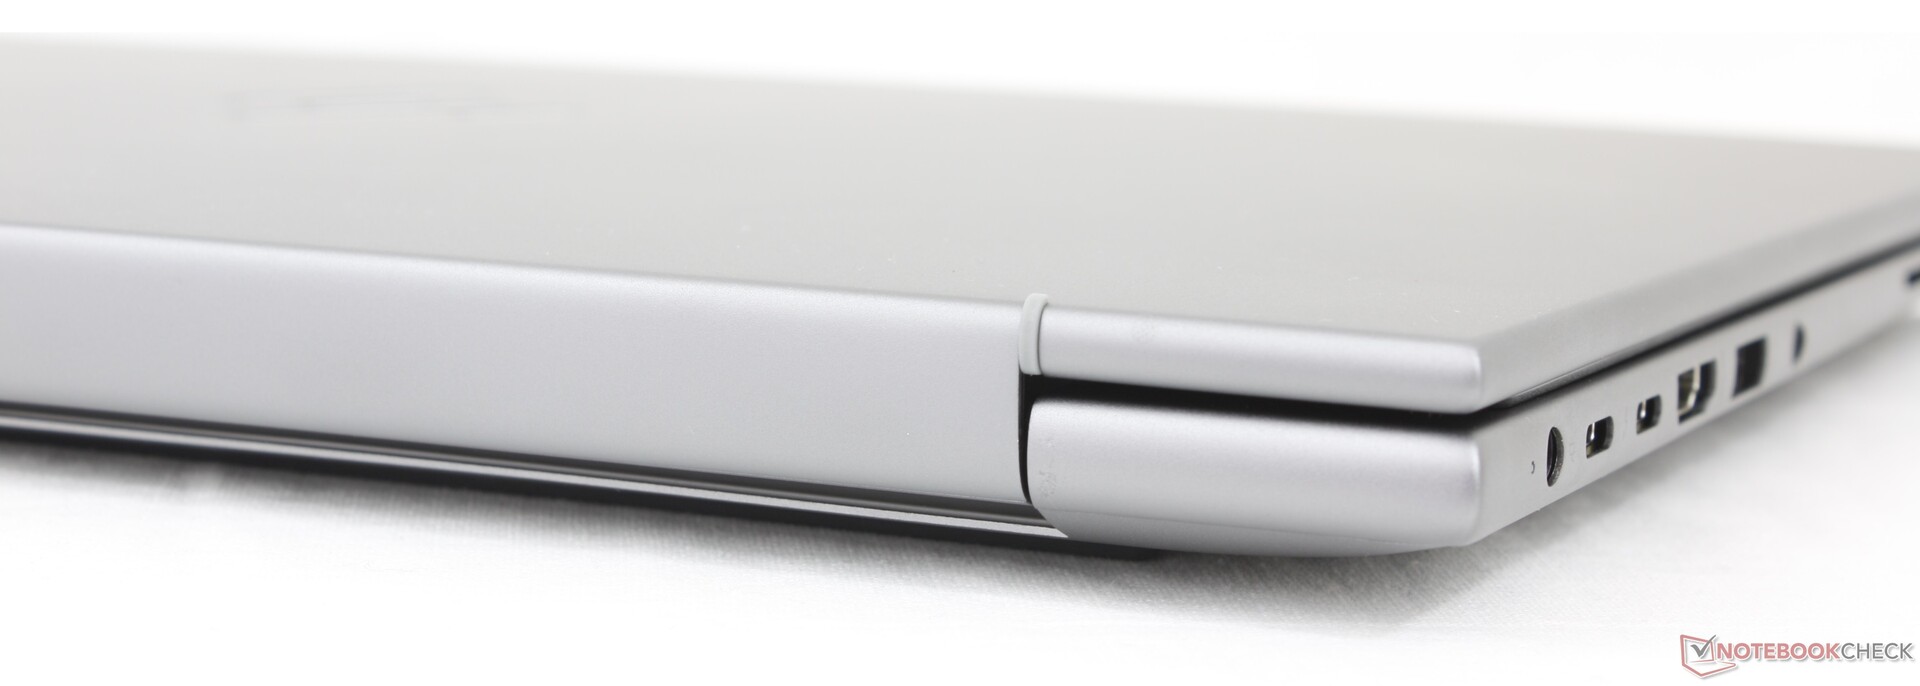
Łączność - porty Thunderbolt 4
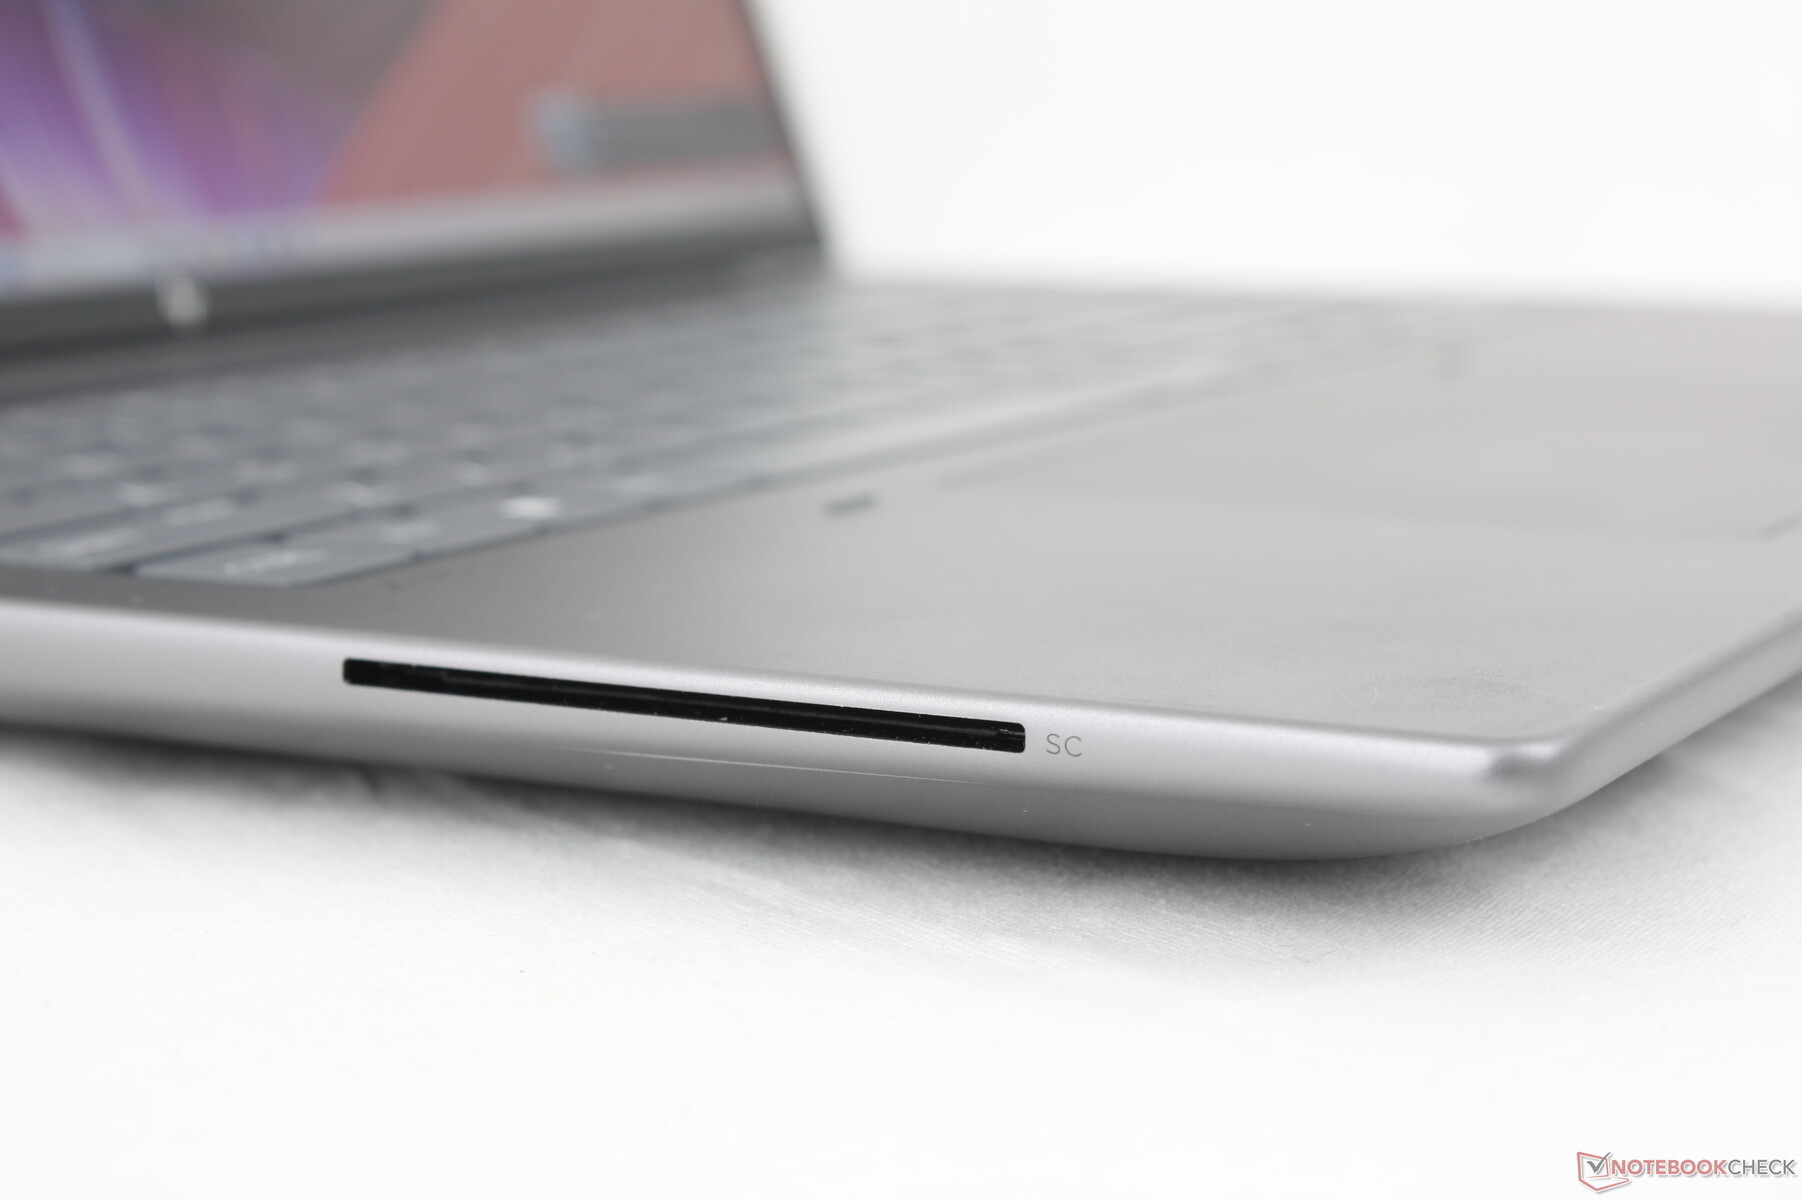
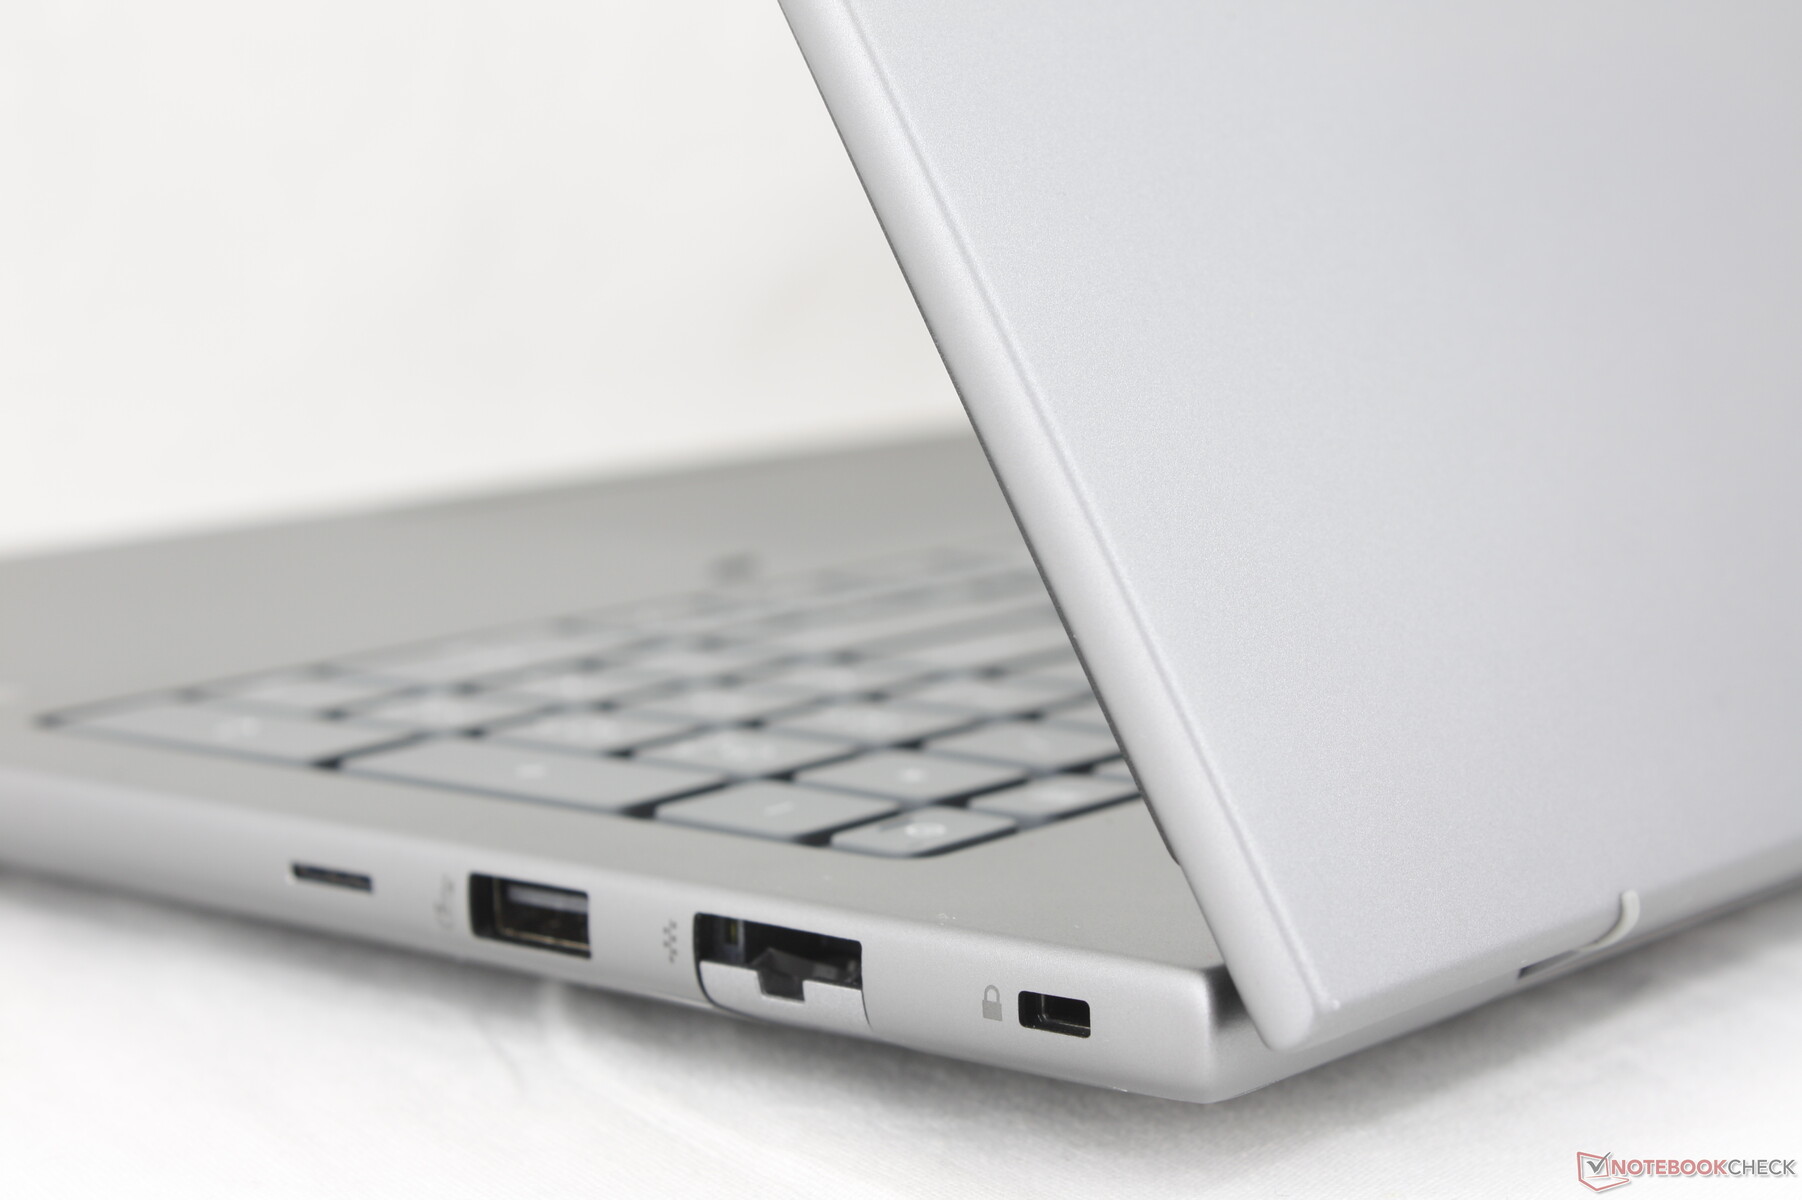
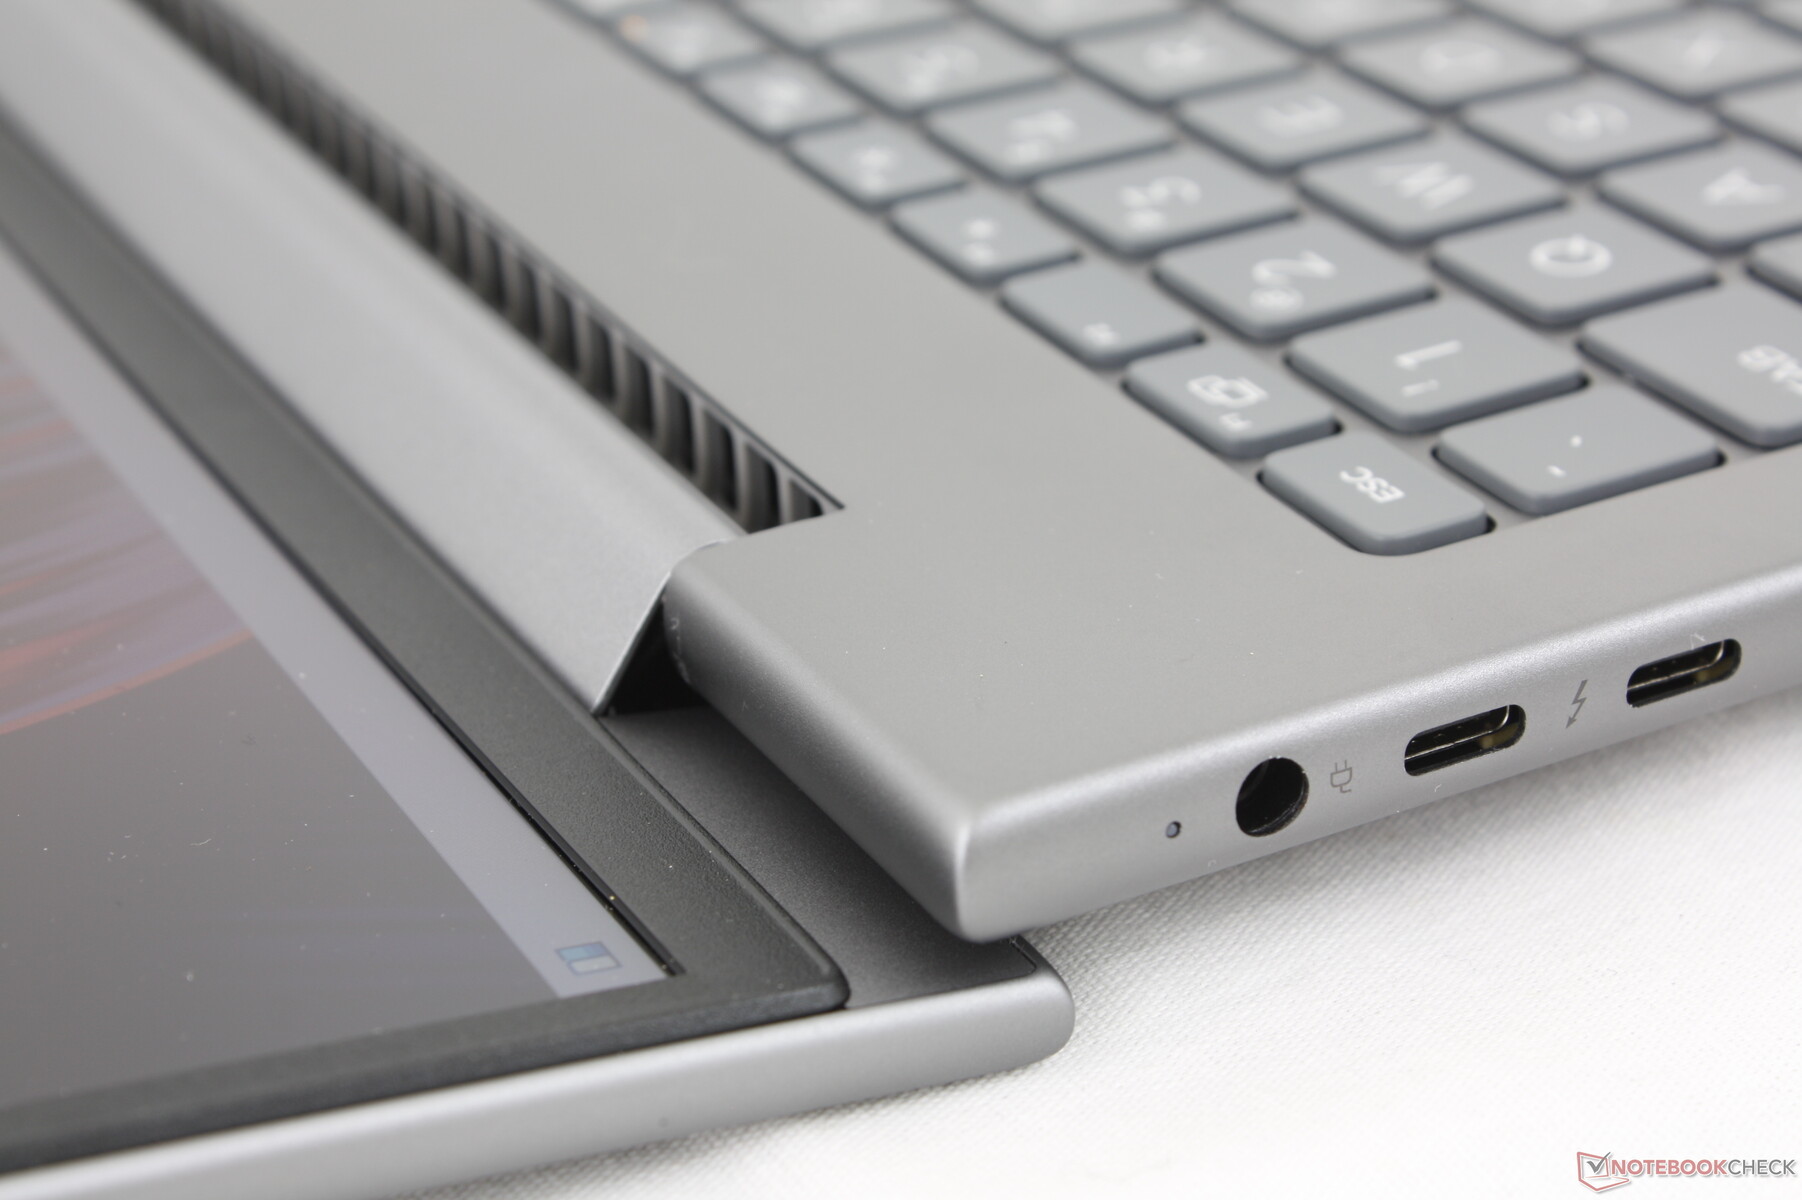
Model ten zawiera mniej portów USB-A niż zeszłoroczny ZBook Power 15 G10. Wszystko inne powróciło, w tym czytnik Smart Card i podwójne porty USB-C Thunderbolt 4, aczkolwiek zmieniono ich rozmieszczenie. W szczególności porty wzdłuż lewej krawędzi są zdecydowanie zbyt zatłoczone i mogłyby być nieco bardziej rozłożone.
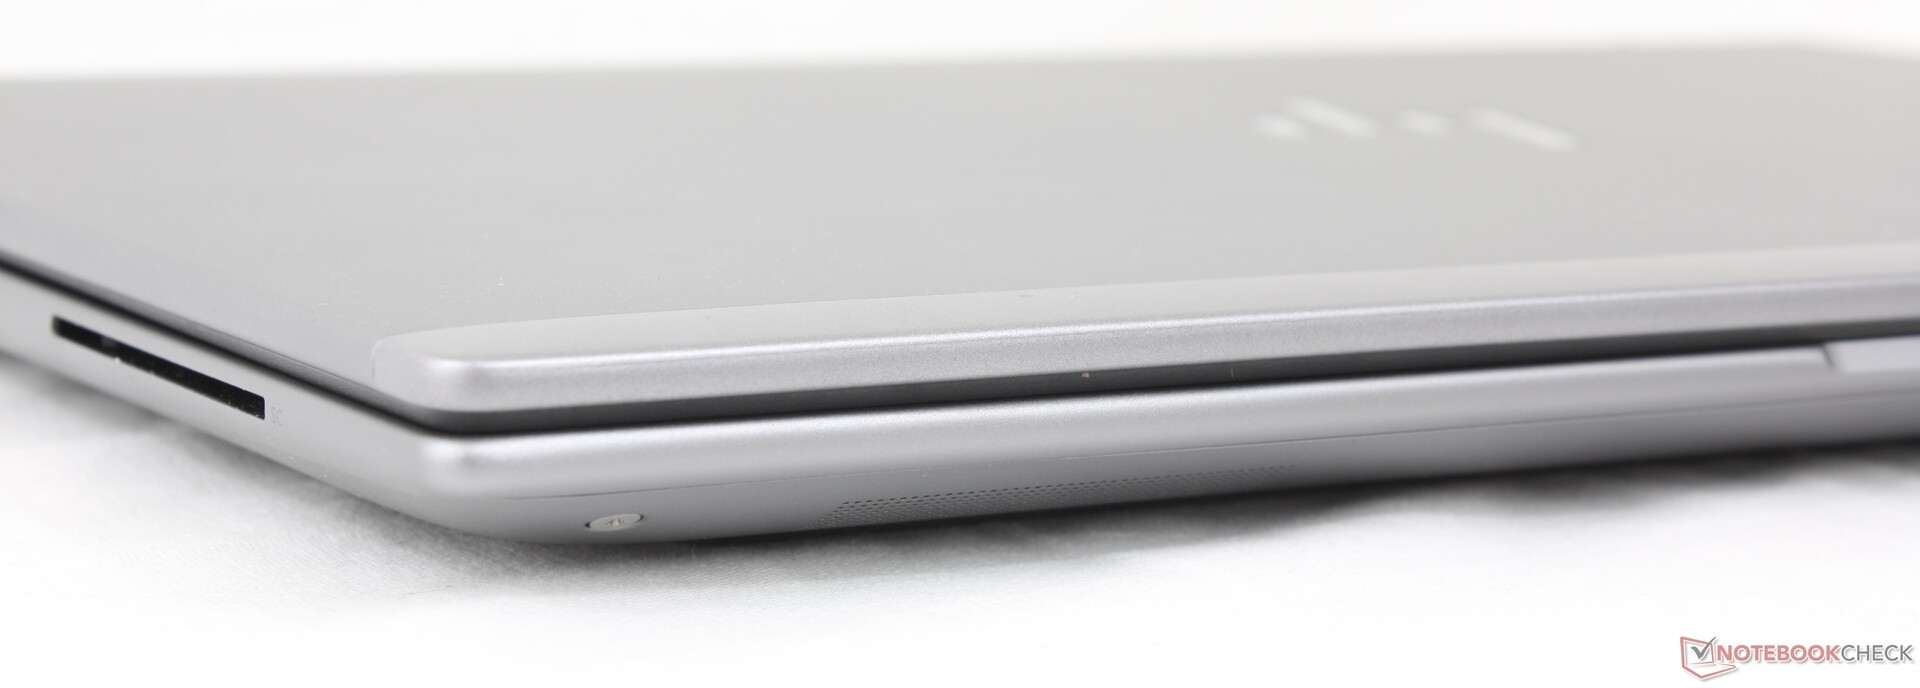

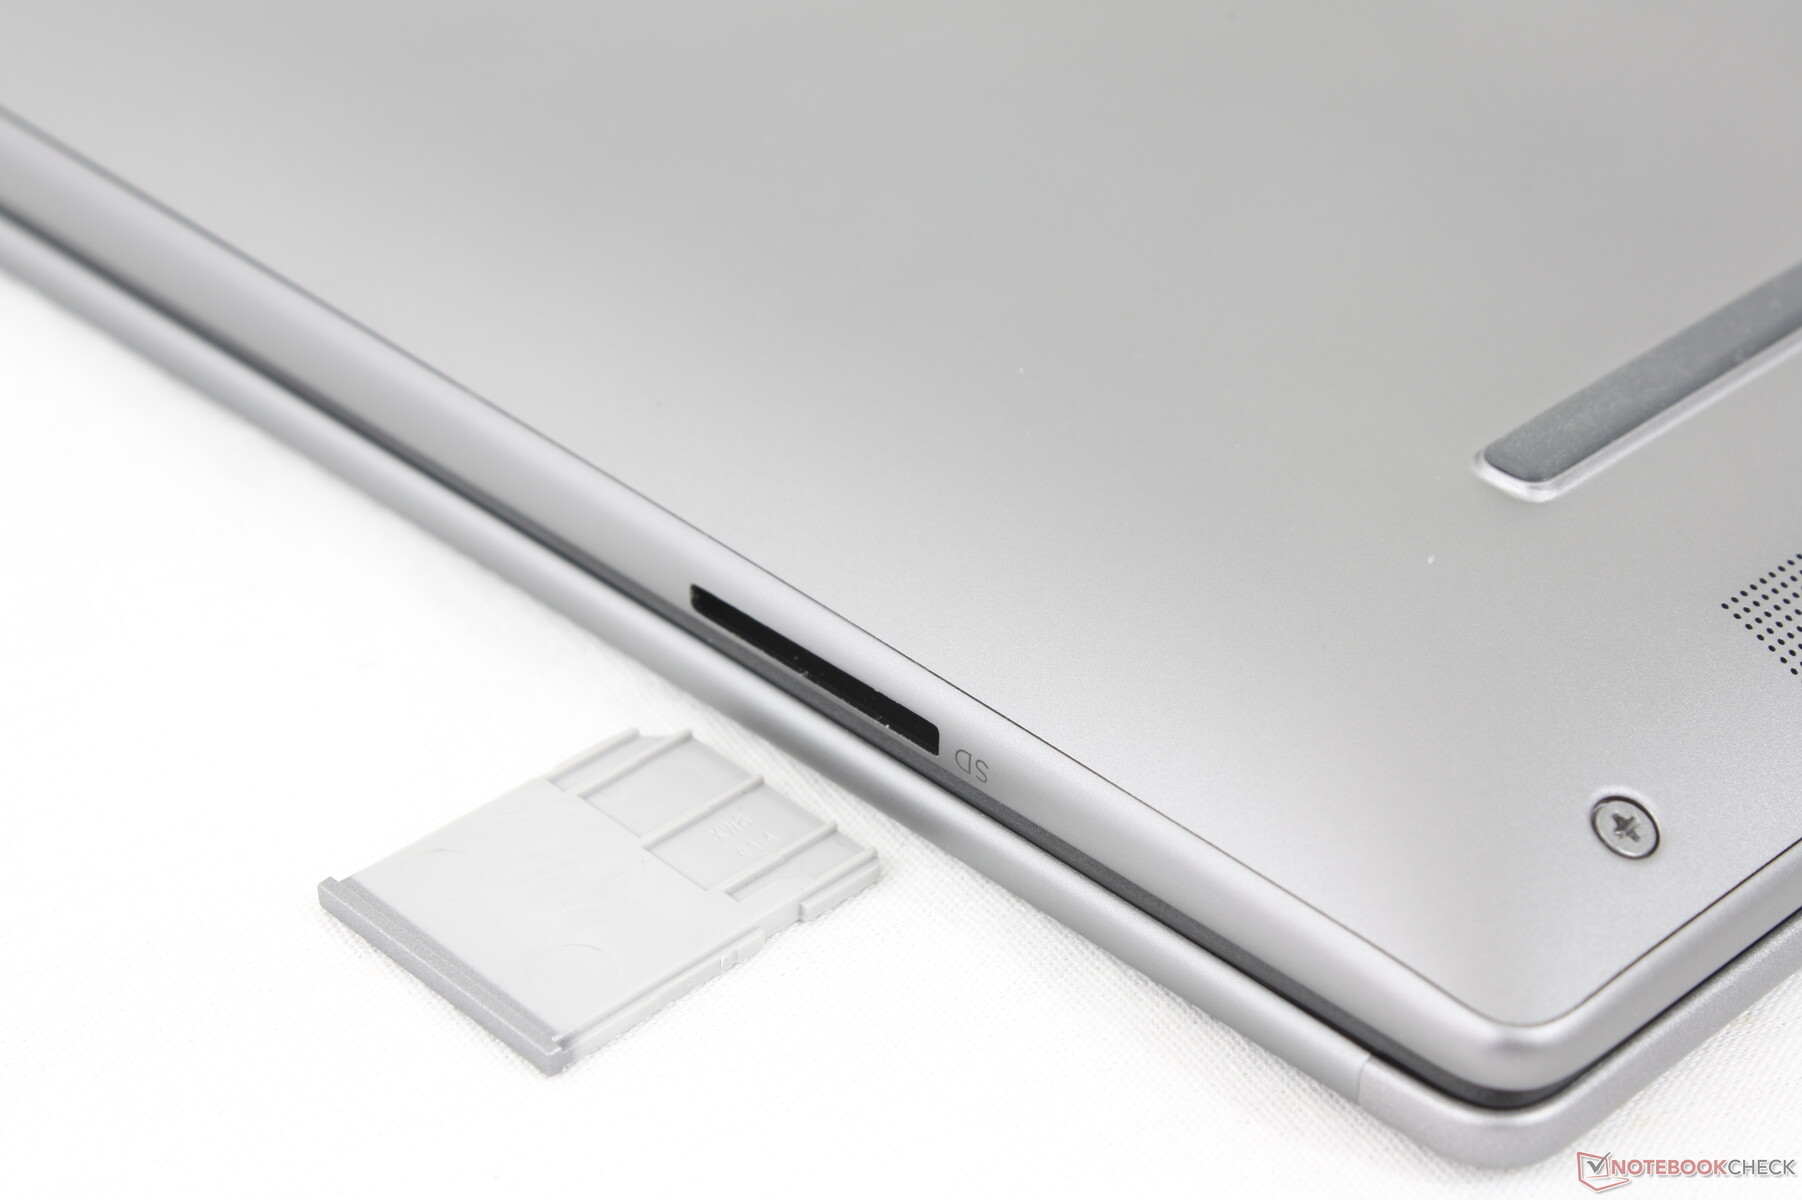
Czytnik kart SD
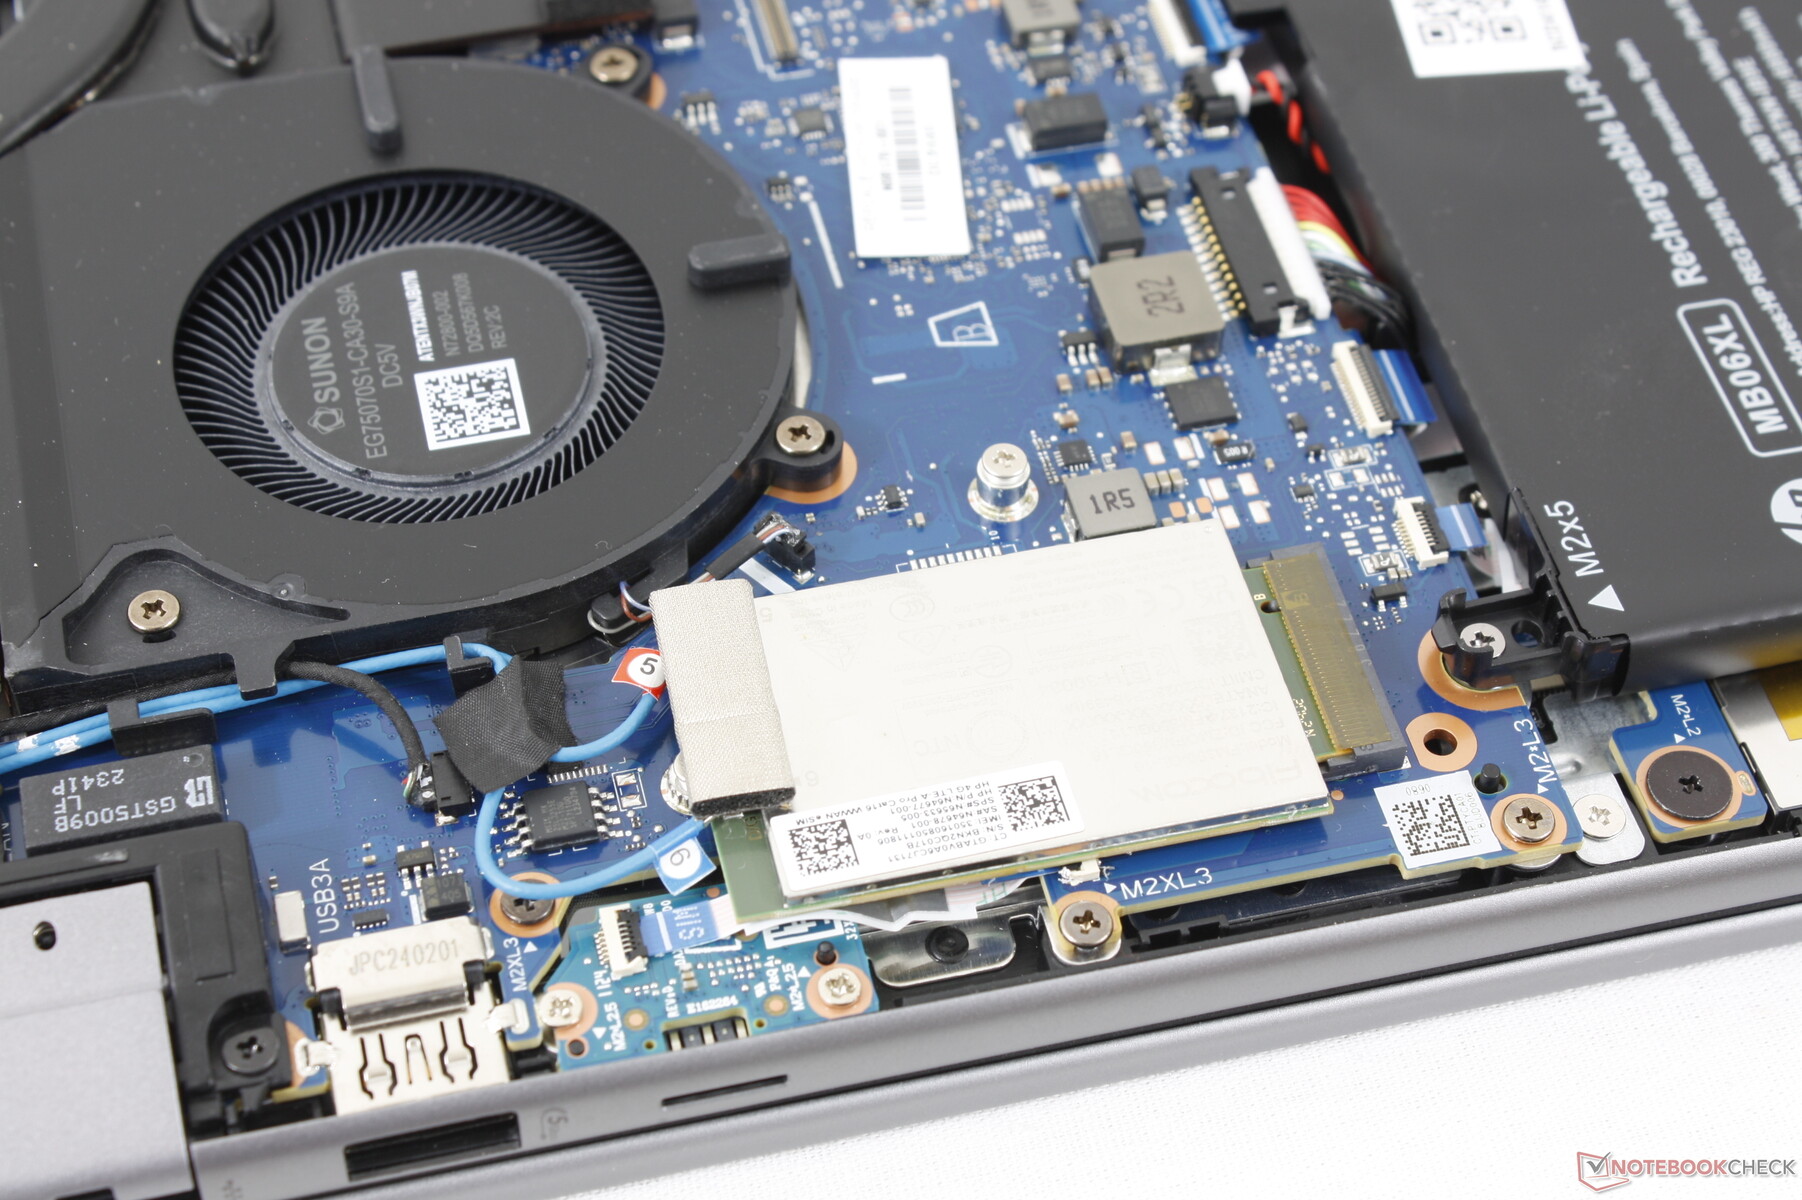
W modelu tym zintegrowano czytnik kart MicroSD, podczas gdy funkcji tej brakowało w ZBook Power 15 G10. Transfer jest bardzo szybki; przeniesienie 1 GB zdjęć z naszej karty testowej UHS-II zajmuje mniej niż 6 sekund w porównaniu do 12 sekund na ZBook Fury 16 G11 lub ThinkPad P1 Gen 7.
| SD Card Reader | |
| average JPG Copy Test (av. of 3 runs) | |
| HP ZBook Power 16 G11 A (Toshiba Exceria Pro SDXC 64 GB UHS-II) | |
| HP ZBook Fury 16 G11 (Toshiba Exceria Pro SDXC 64 GB UHS-II) | |
| Lenovo ThinkPad P1 Gen 7 21KV001SGE (AV Pro V60) | |
| maximum AS SSD Seq Read Test (1GB) | |
| HP ZBook Power 16 G11 A (Toshiba Exceria Pro SDXC 64 GB UHS-II) | |
| HP ZBook Fury 16 G11 (Toshiba Exceria Pro SDXC 64 GB UHS-II) | |
| Lenovo ThinkPad P1 Gen 7 21KV001SGE (AV Pro V60) | |
Komunikacja
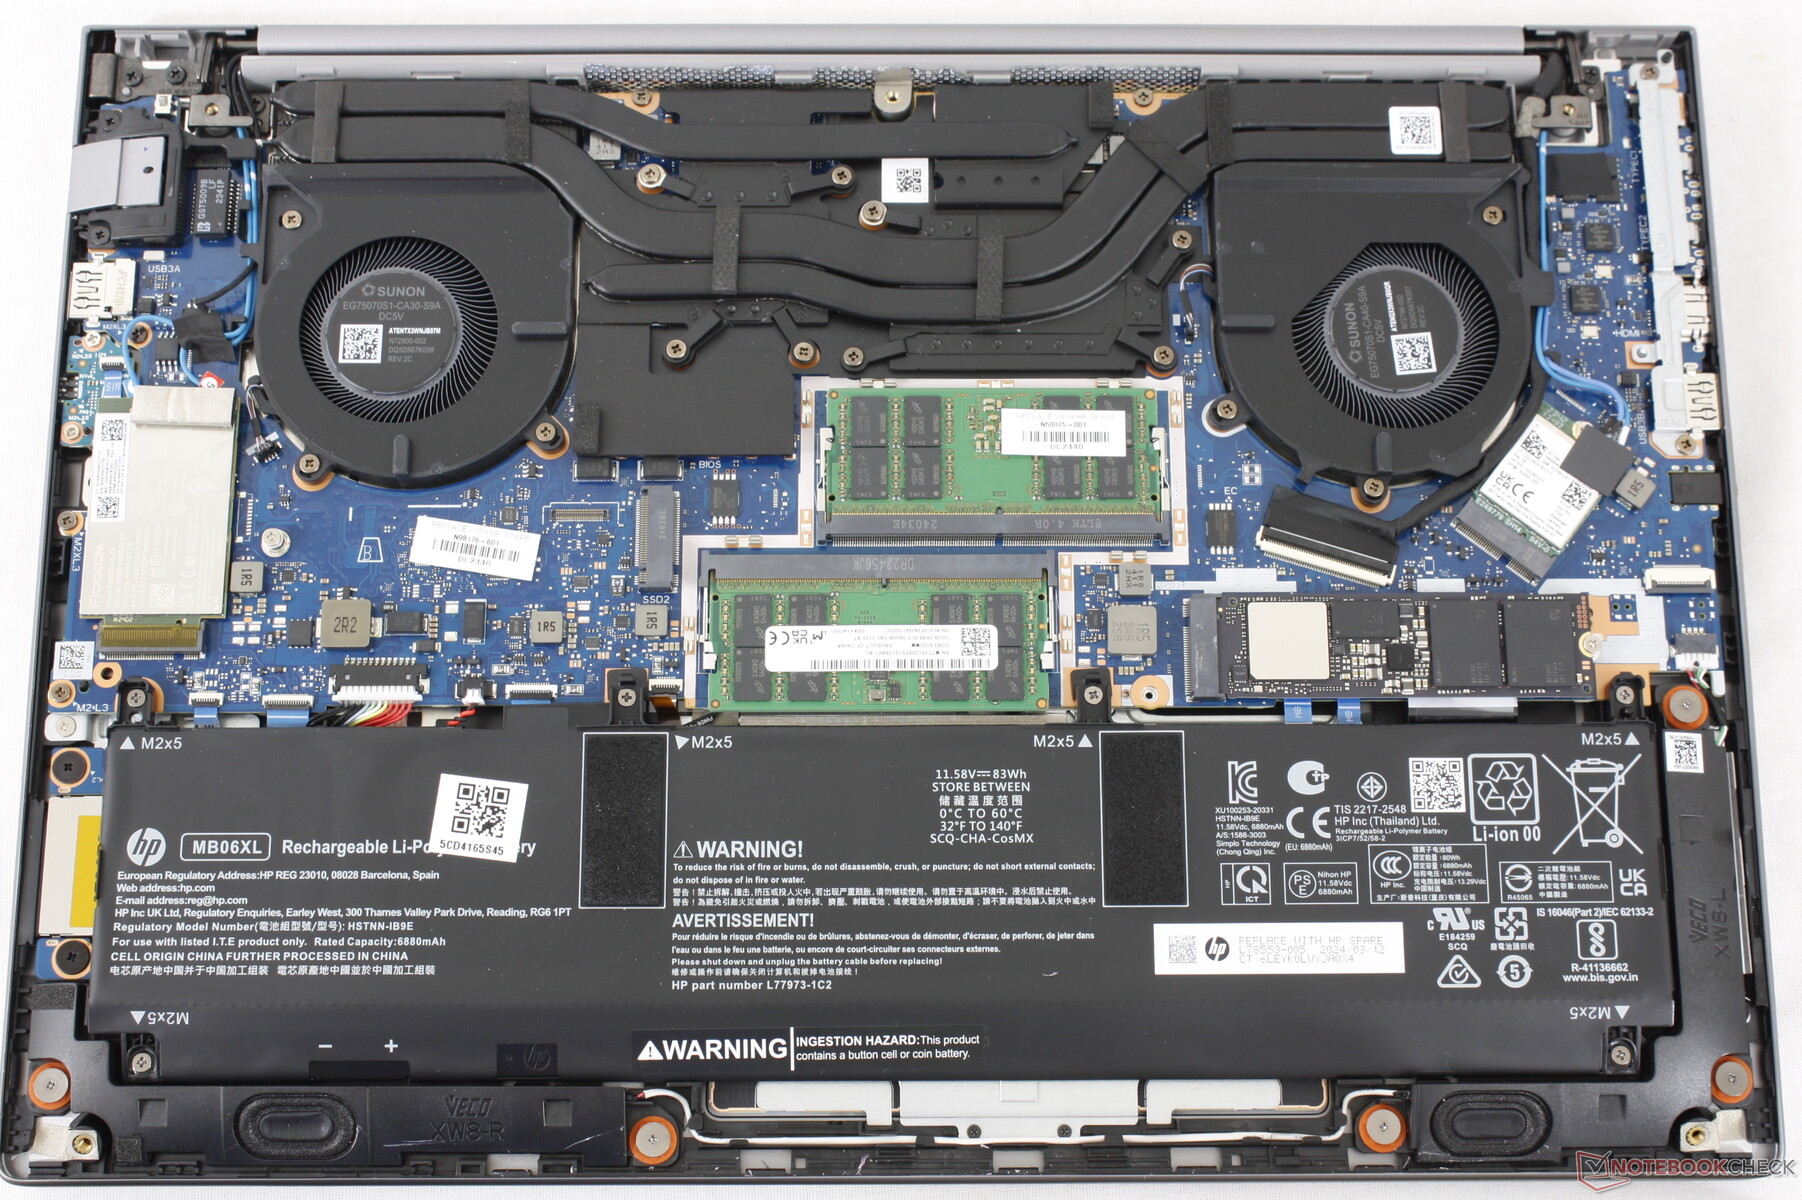
Układ MediaTek MT7922 zapewnia standardowo łączność Wi-Fi 6E i Bluetooth 5.2. Dostępne są również opcje Realtek, a także HP 4000 lub Qualcomm 9205 dla łączności WAN.
Kamera internetowa
Kamera internetowa 5 MP jest standardem wraz z podczerwienią i fizycznym suwakiem migawki, podobnie jak w ThinkPad P16s G2. Model Precision 5690 jest wyposażony w kamerę internetową o znacznie niższej rozdzielczości 2 MP.


Konserwacja
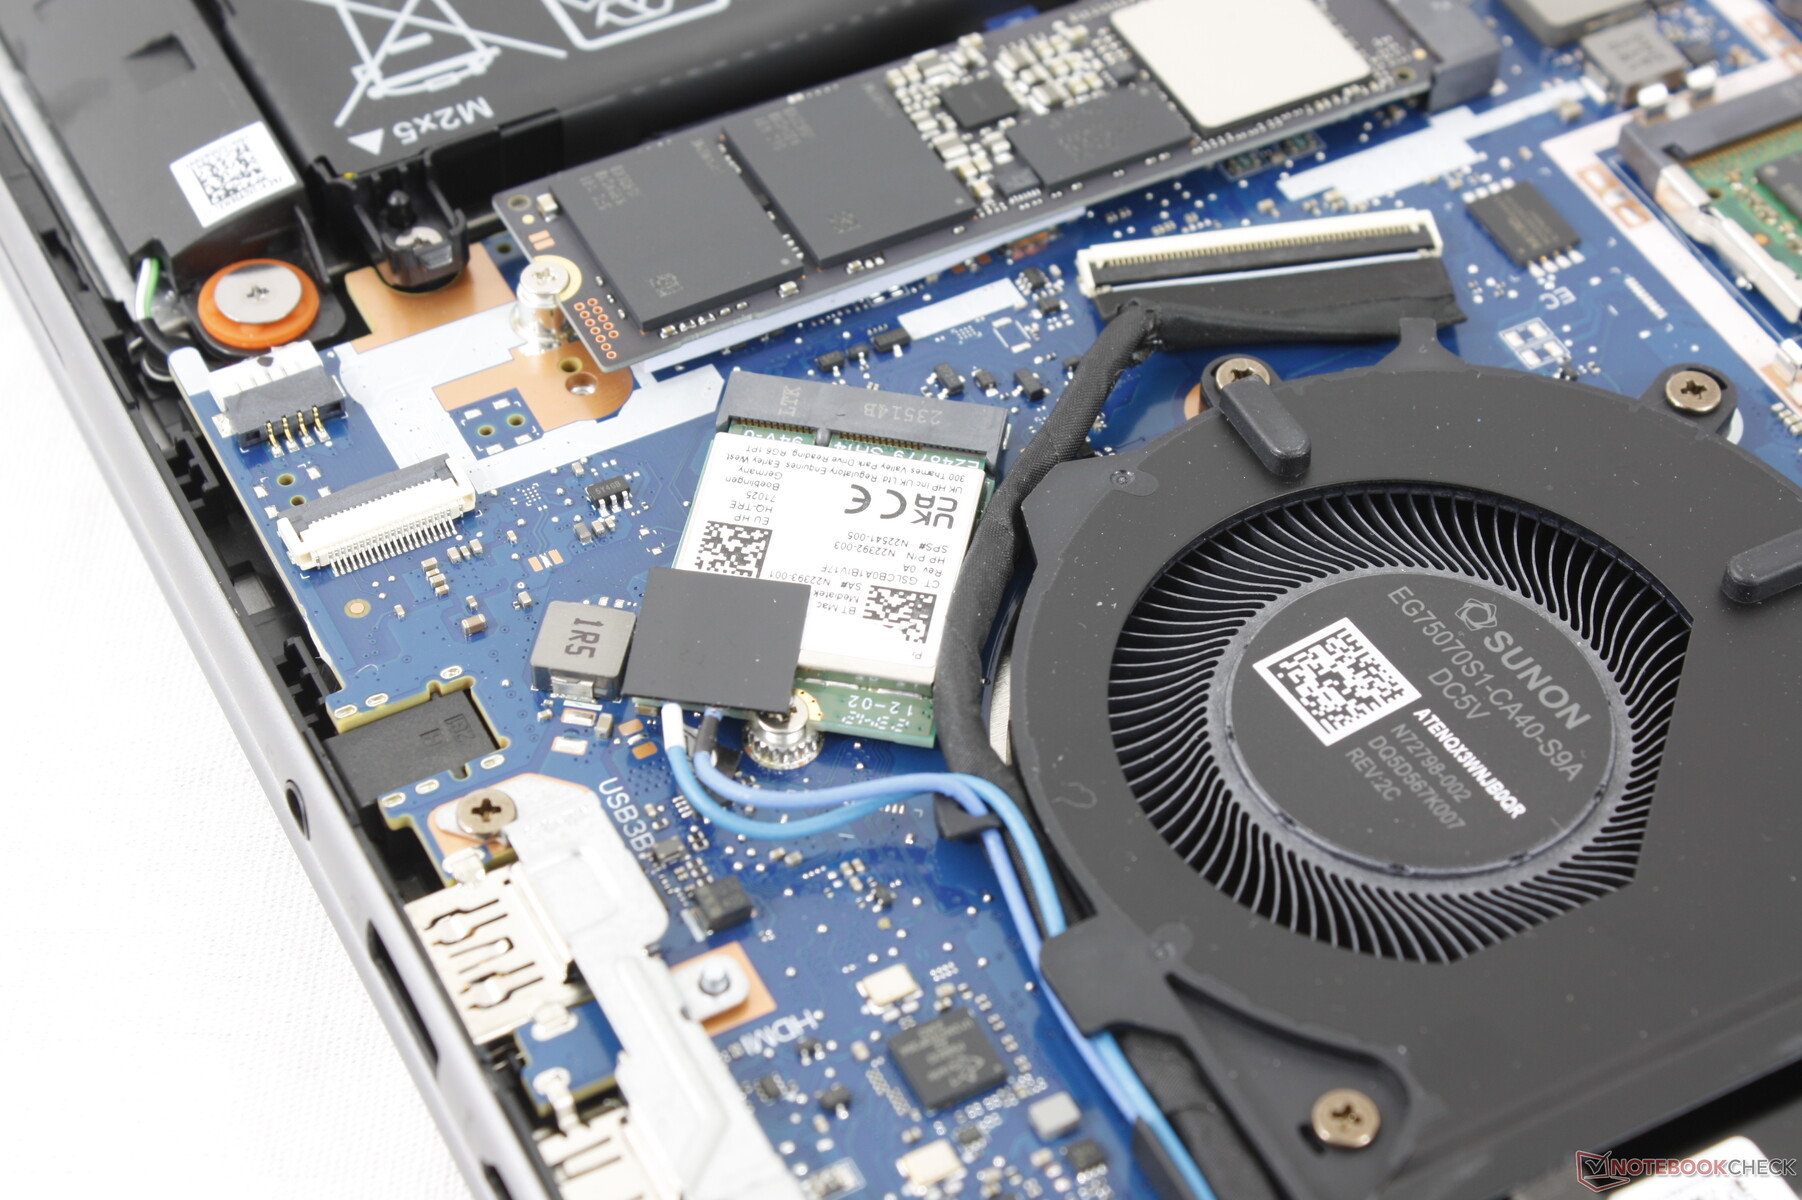
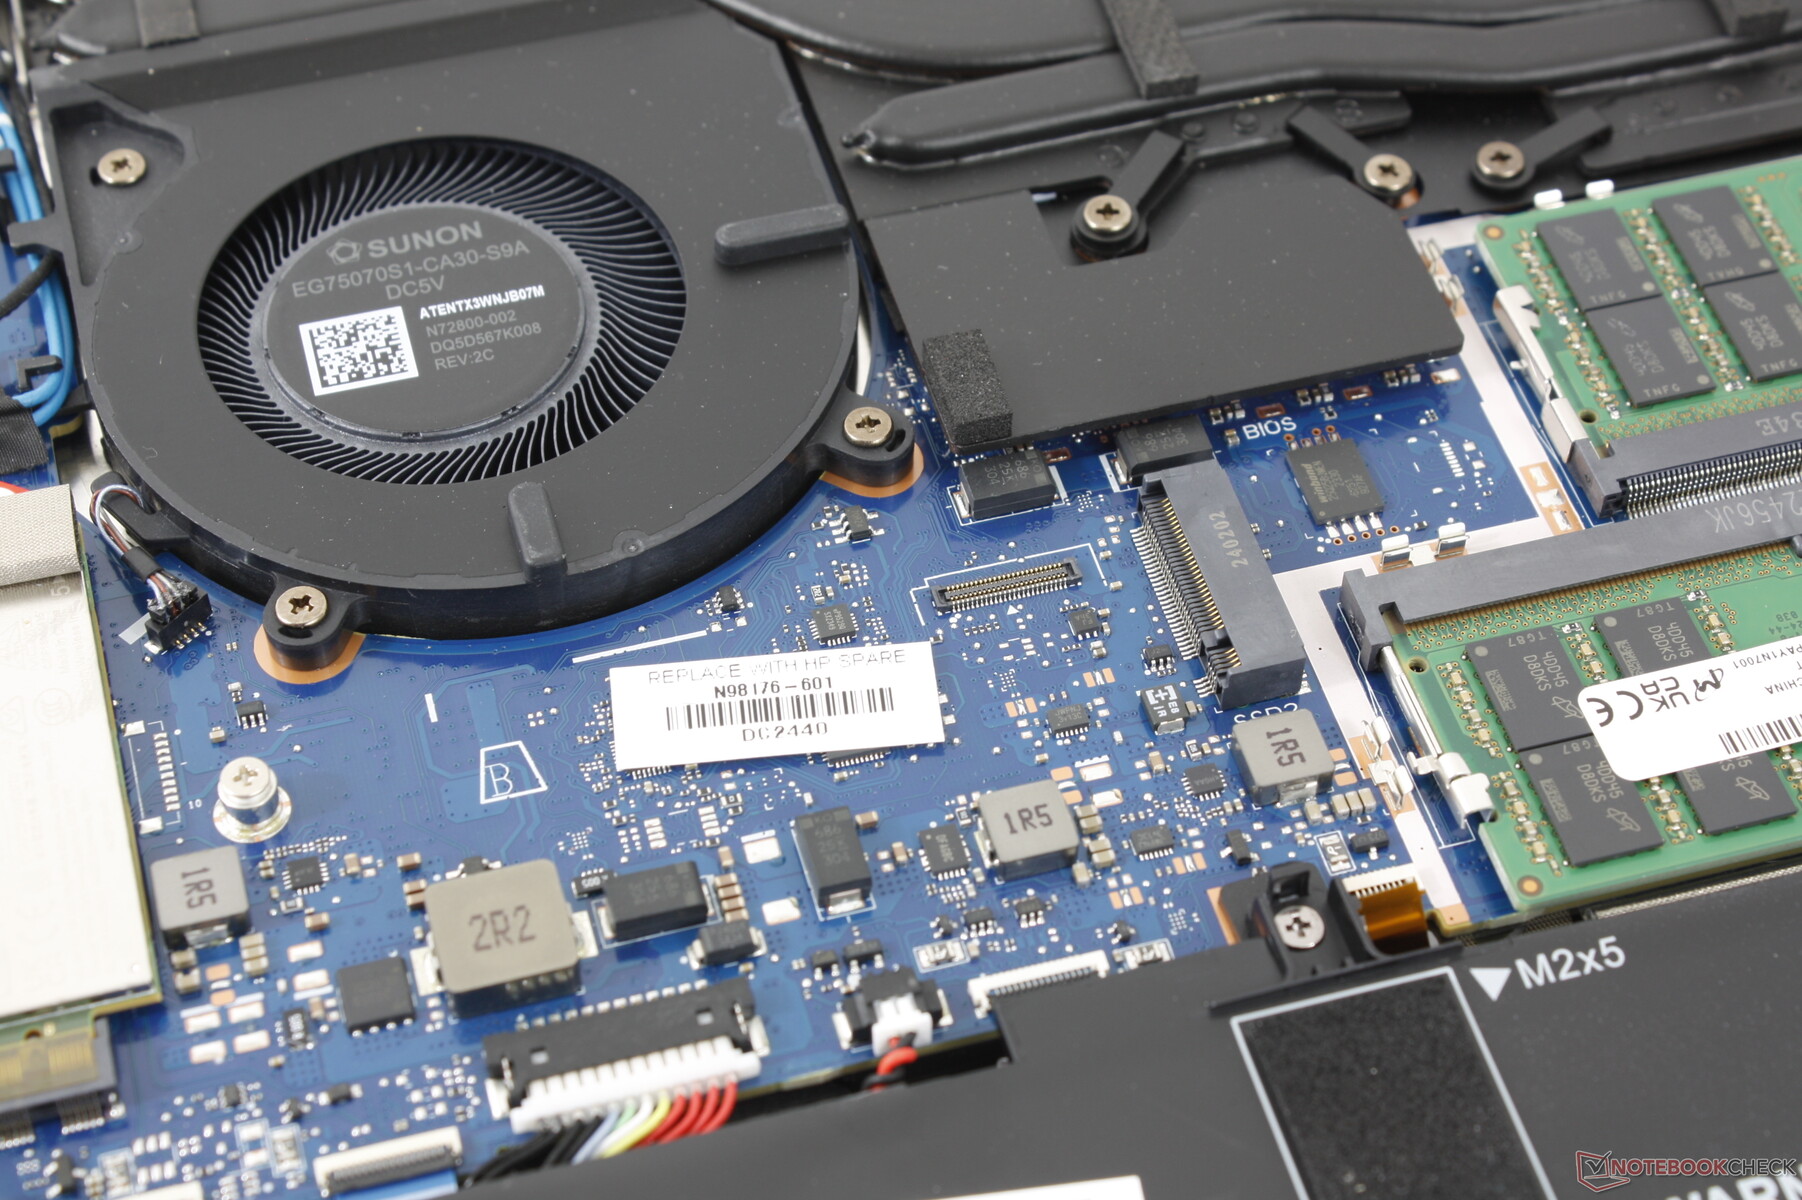
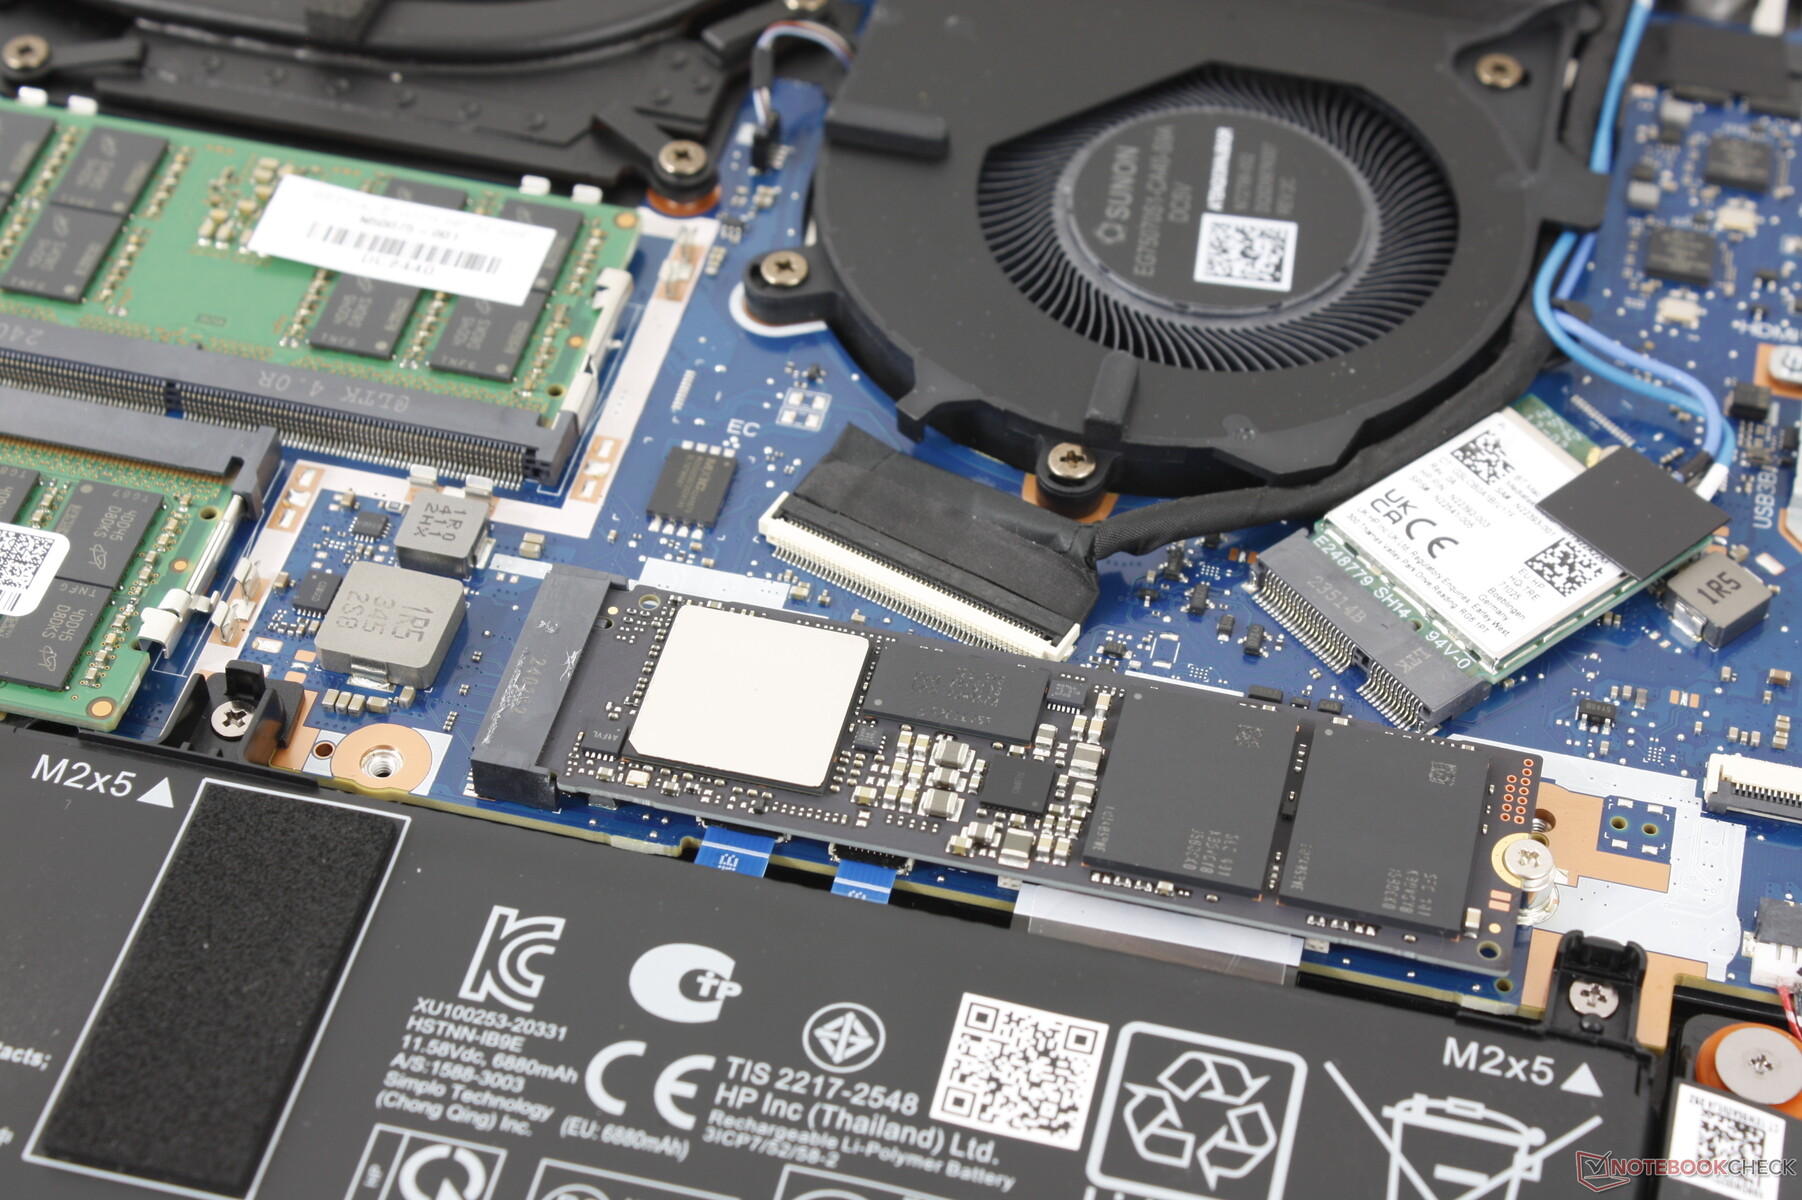
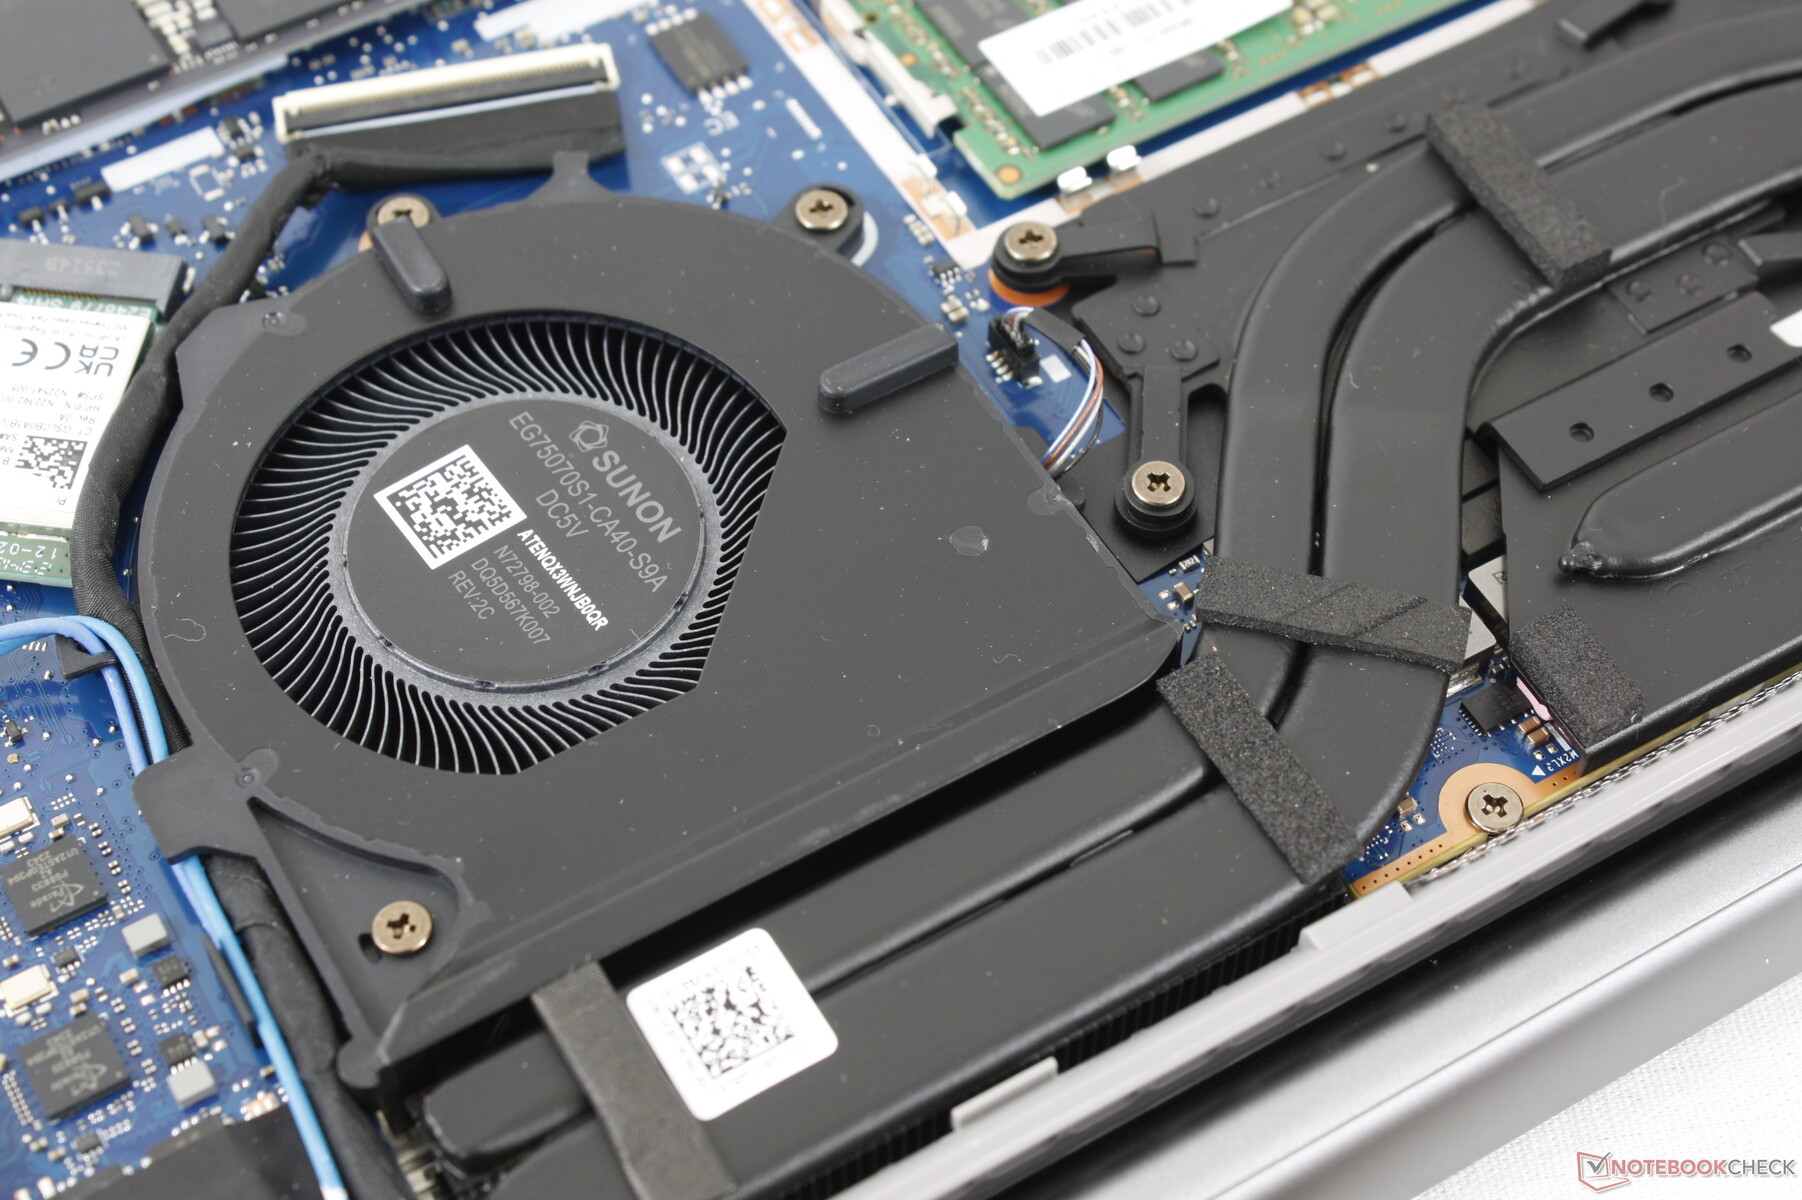
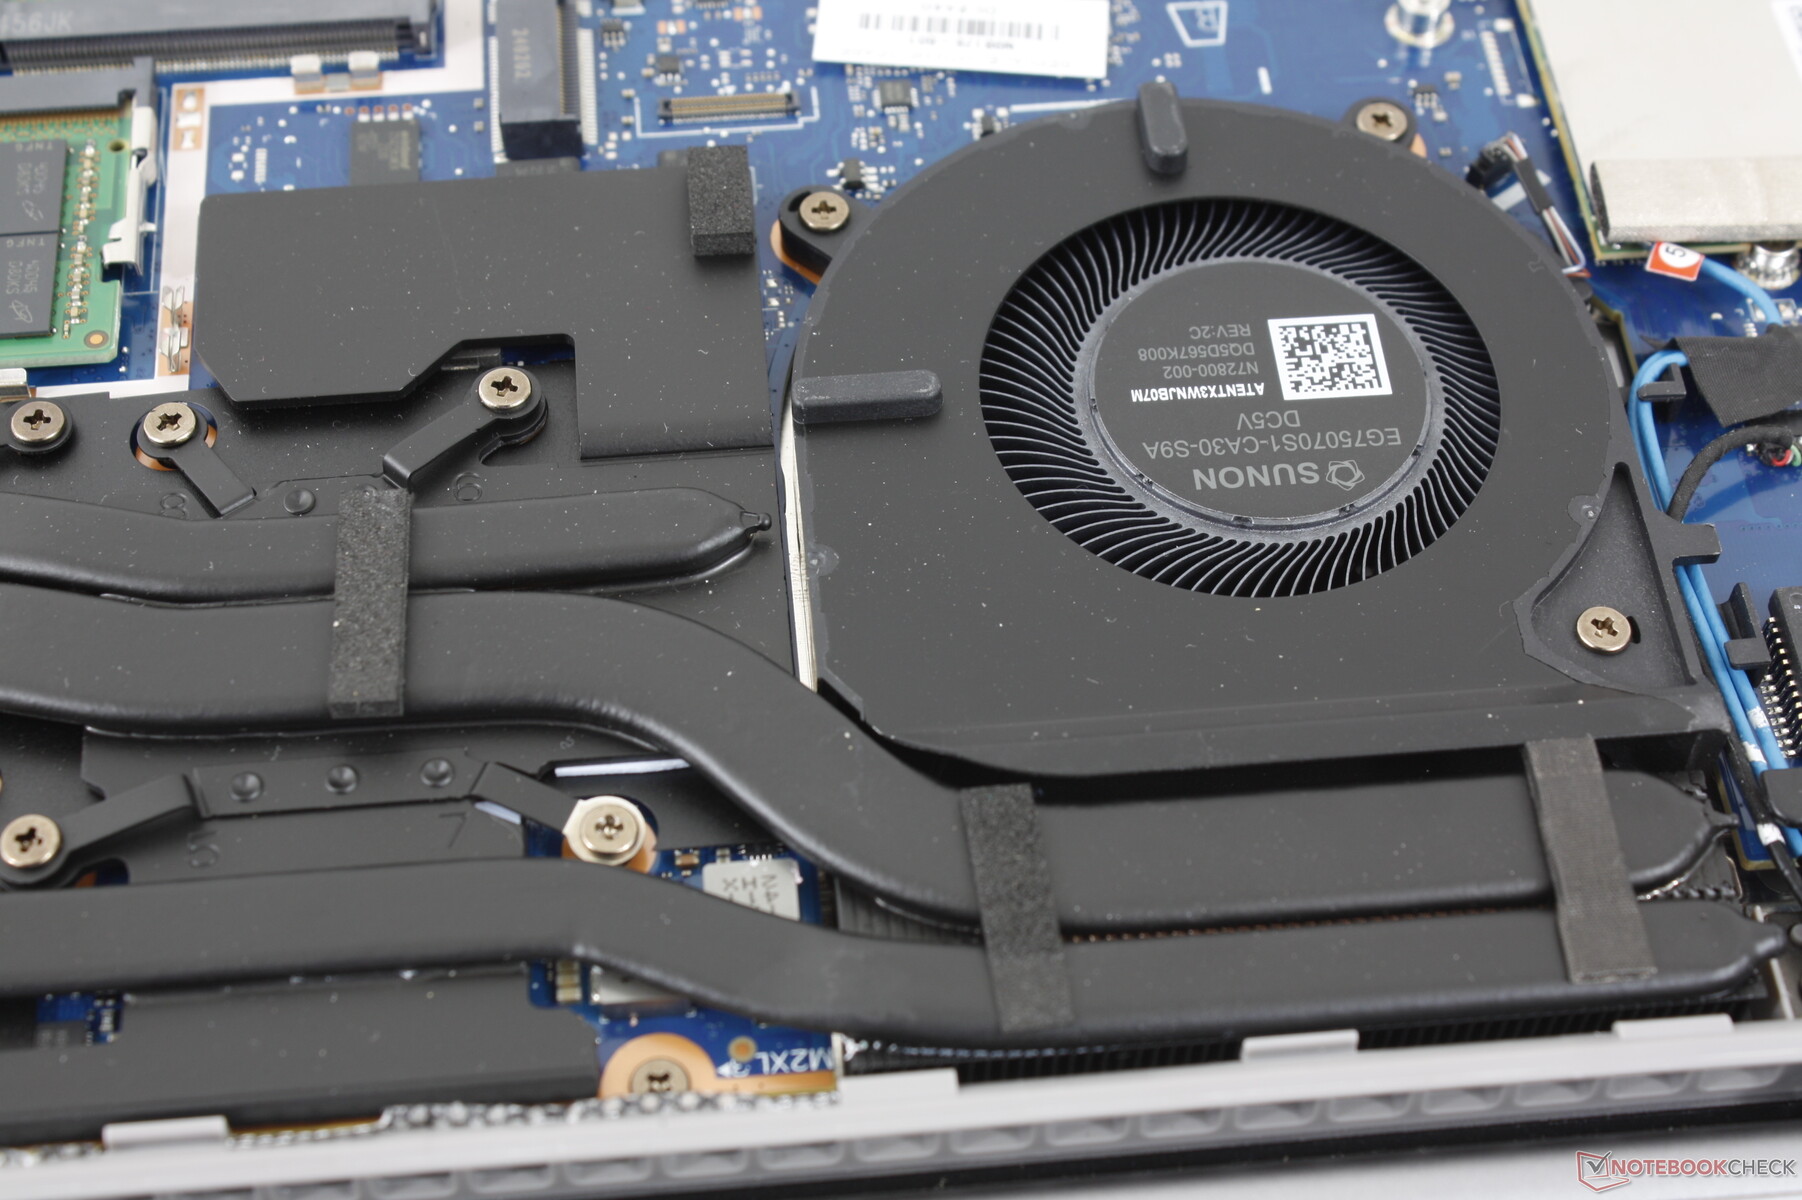
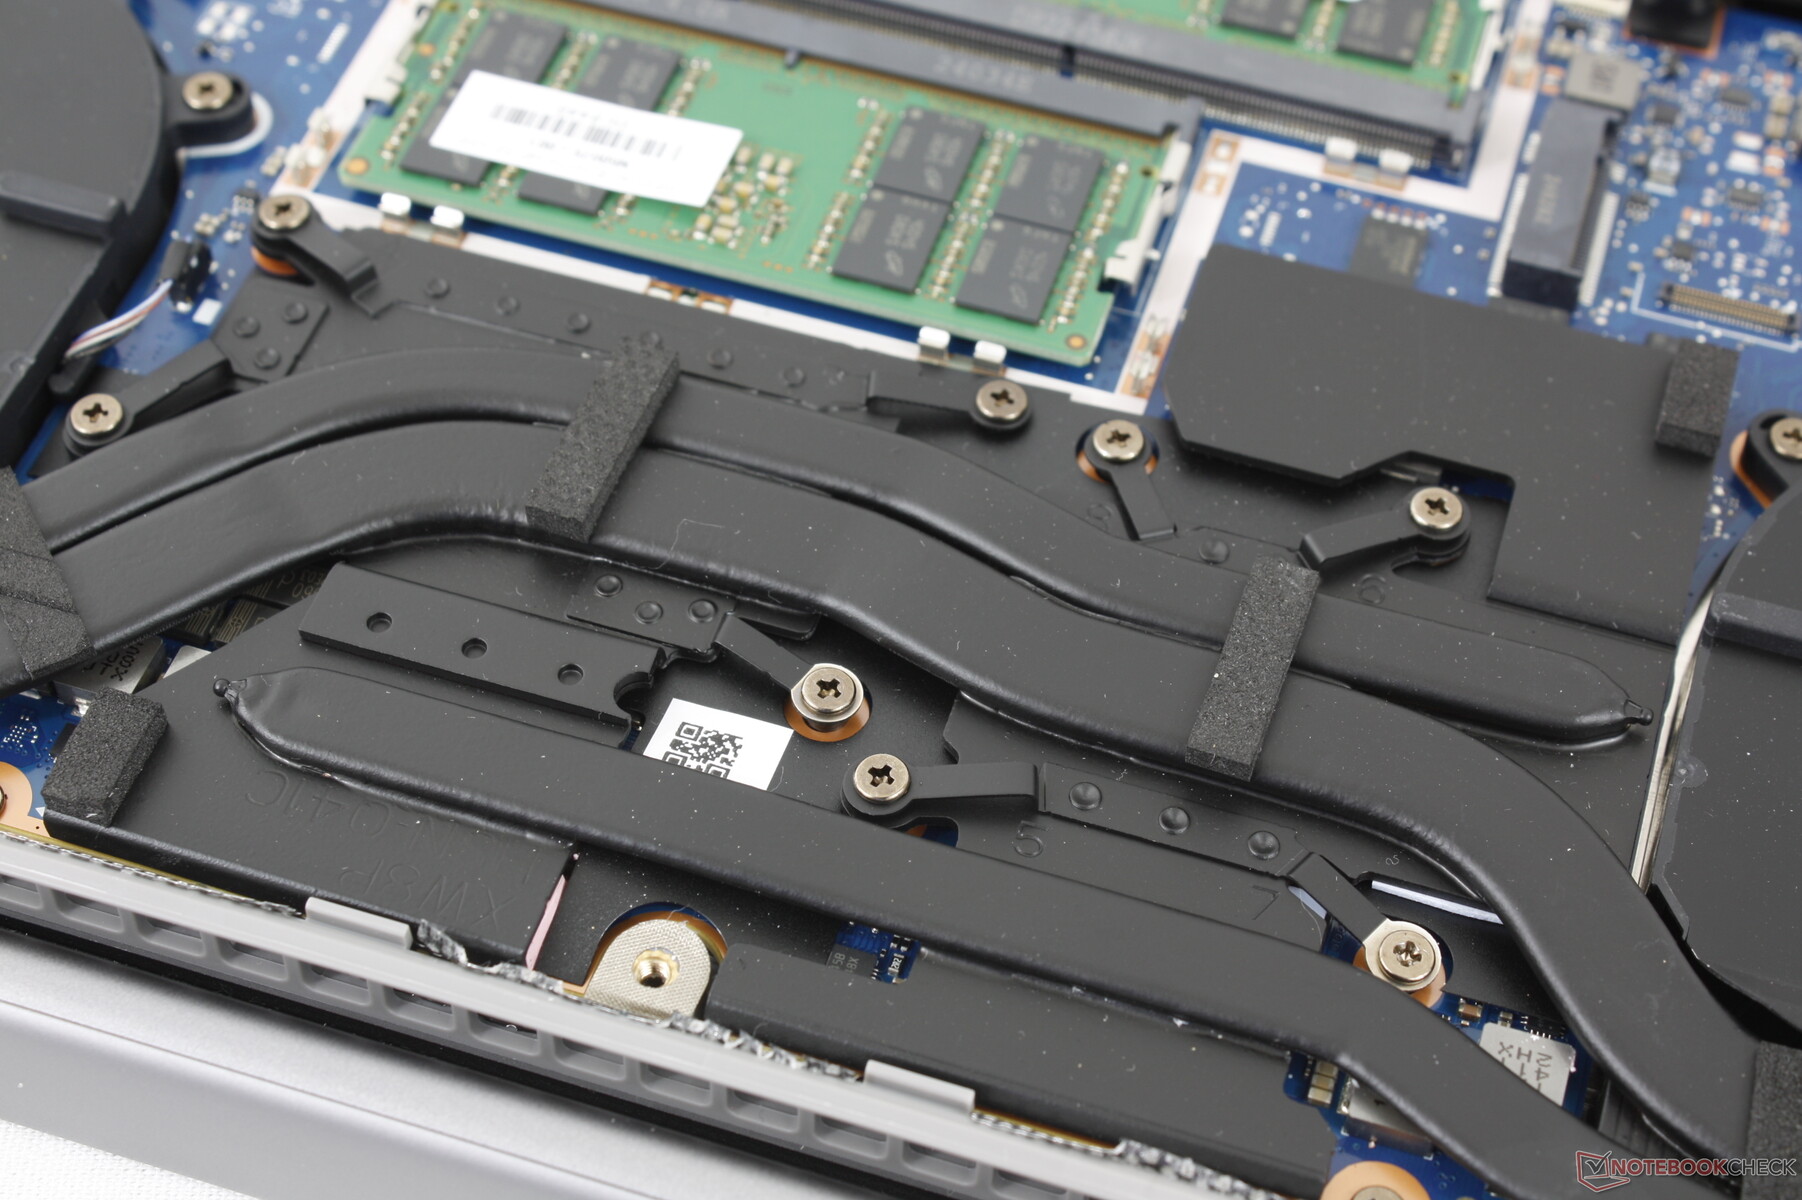
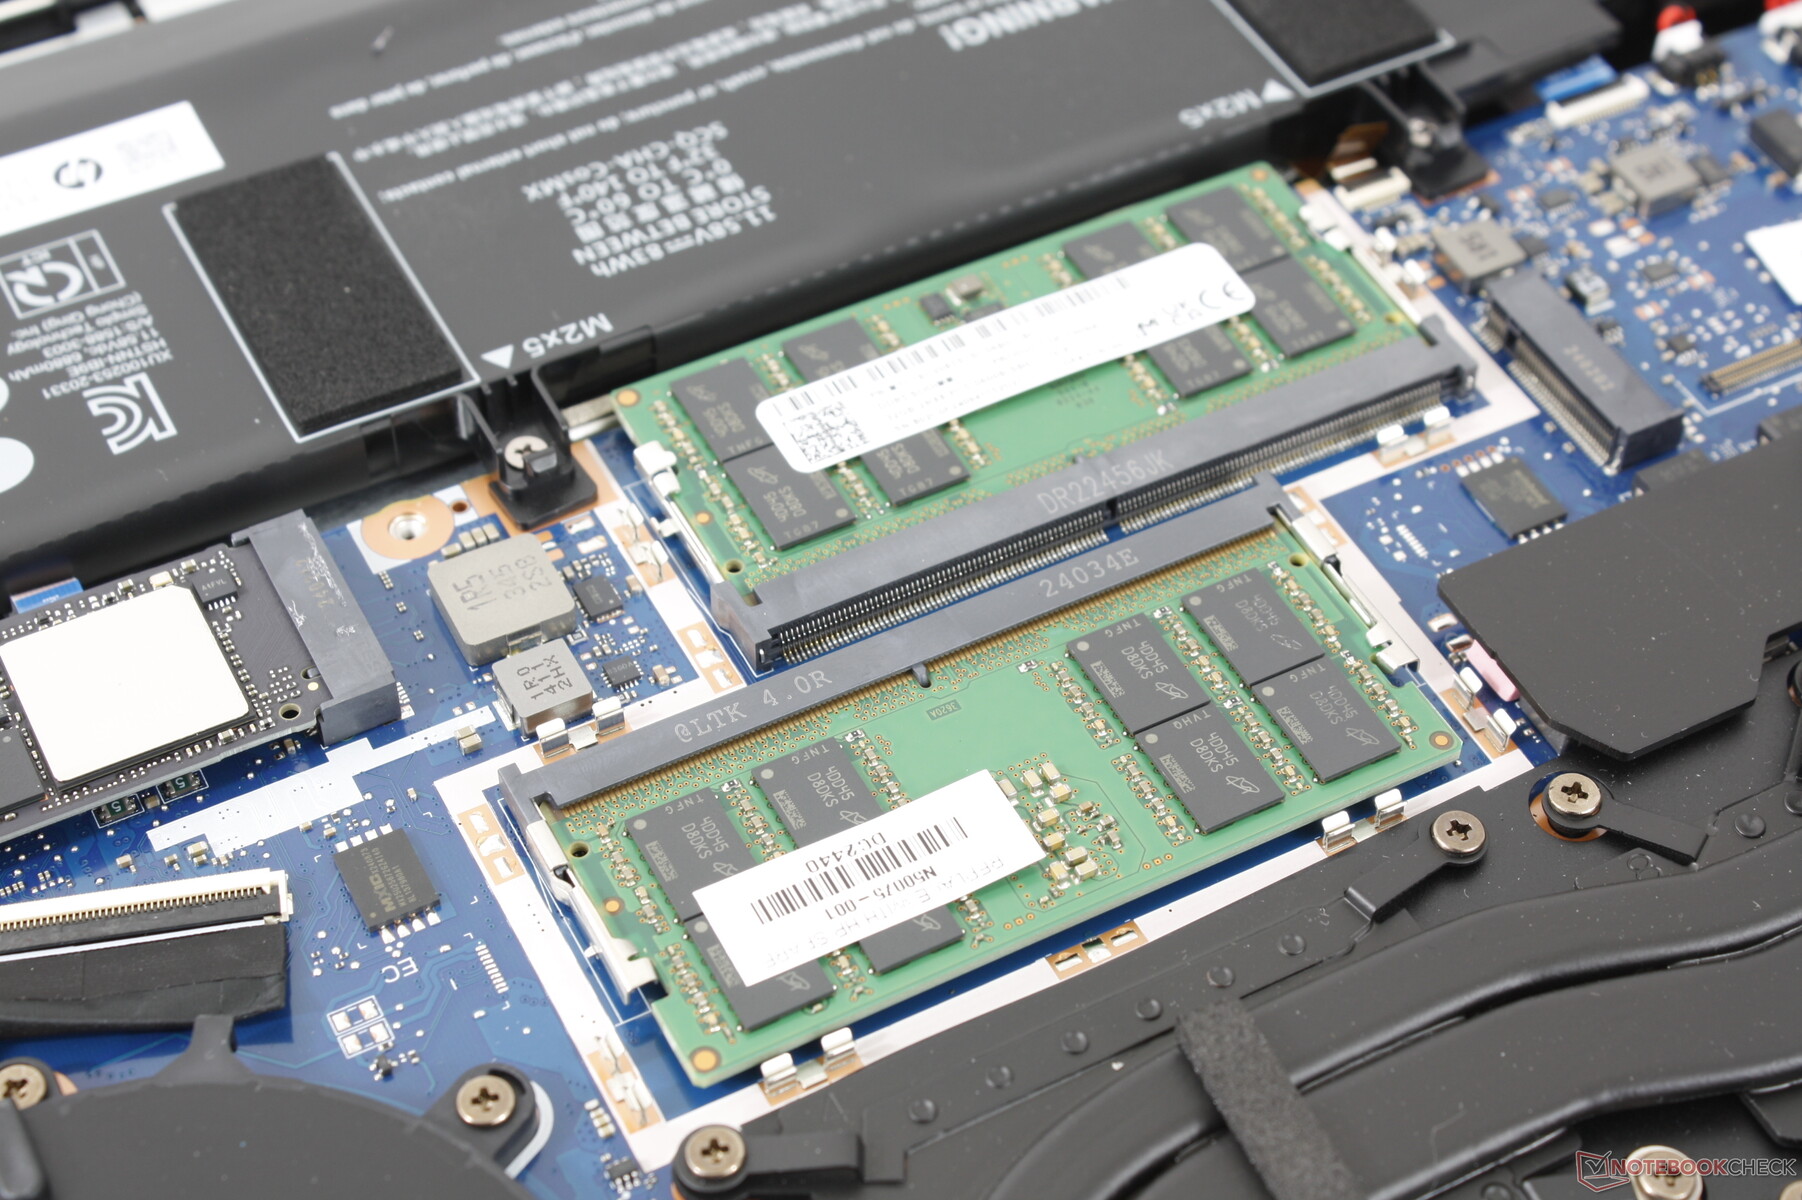
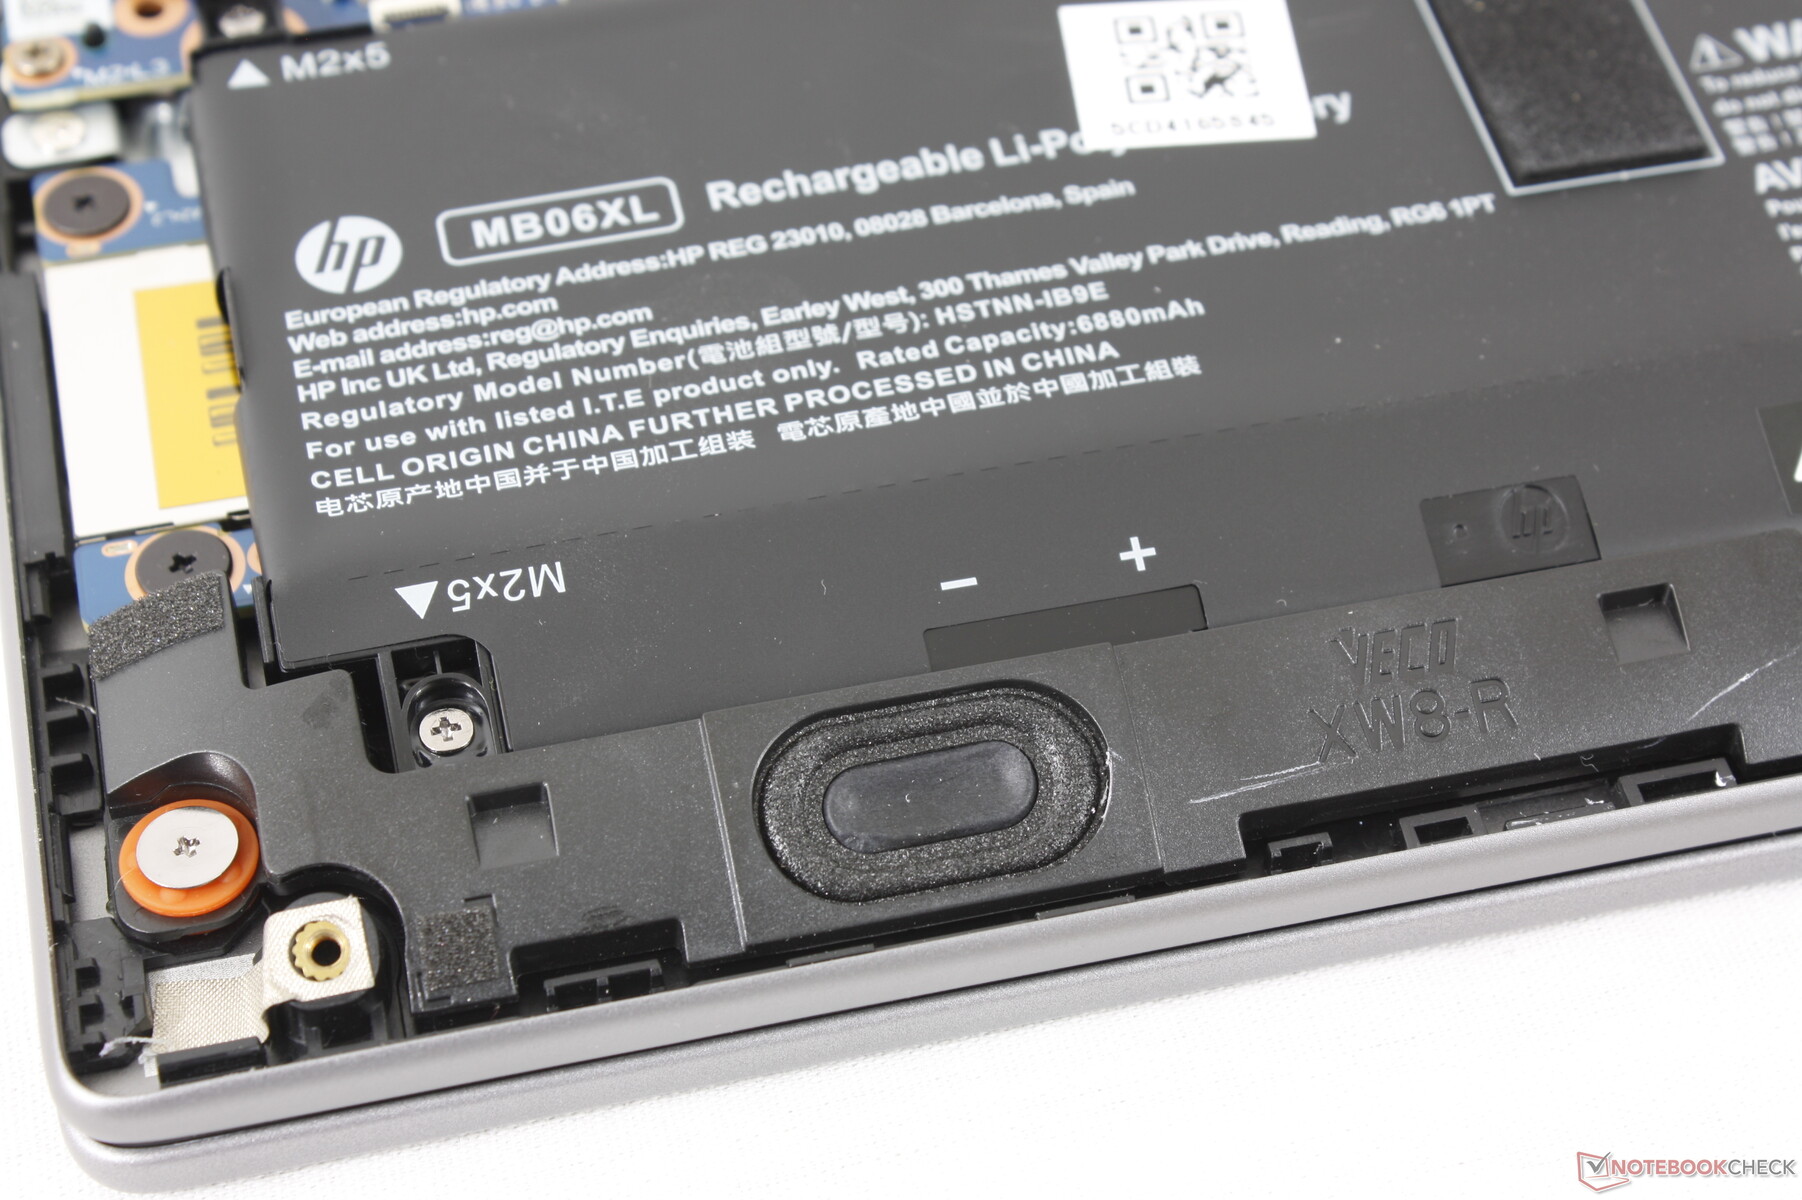
Dolny panel można stosunkowo łatwo zdjąć za pomocą śrubokręta krzyżakowego i ostrej krawędzi. Wewnętrzne elementy zostały całkowicie przeprojektowane w porównaniu do ZBook Power 15 G10, zachowując te same opcje rozbudowy, takie jak 2x gniazda SODIMM, 2x gniazda PCIe4 x4 NVMe SSD i wyjmowany moduł WLAN. WAN jest tym razem dodatkową opcją.
Zrównoważony rozwój
W produkcji zastosowano niskohalogenowe materiały, a opakowanie składa się z masy papierowej i tworzyw sztucznych pochodzących z recyklingu, wykonanych odpowiednio w 100% ze zrównoważonych źródeł i w 60% ze źródeł pokonsumpcyjnych.
Akcesoria i gwarancja
W pudełku nie ma żadnych dodatków, które towarzyszyłyby zasilaczowi sieciowemu i dokumentacji. Rozczarowujące jest to, że standardowa ograniczona gwarancja wynosi tylko jeden rok w przypadku zakupu w USA, podczas gdy ZBook Fury jest standardowo objęty trzyletnią gwarancją.
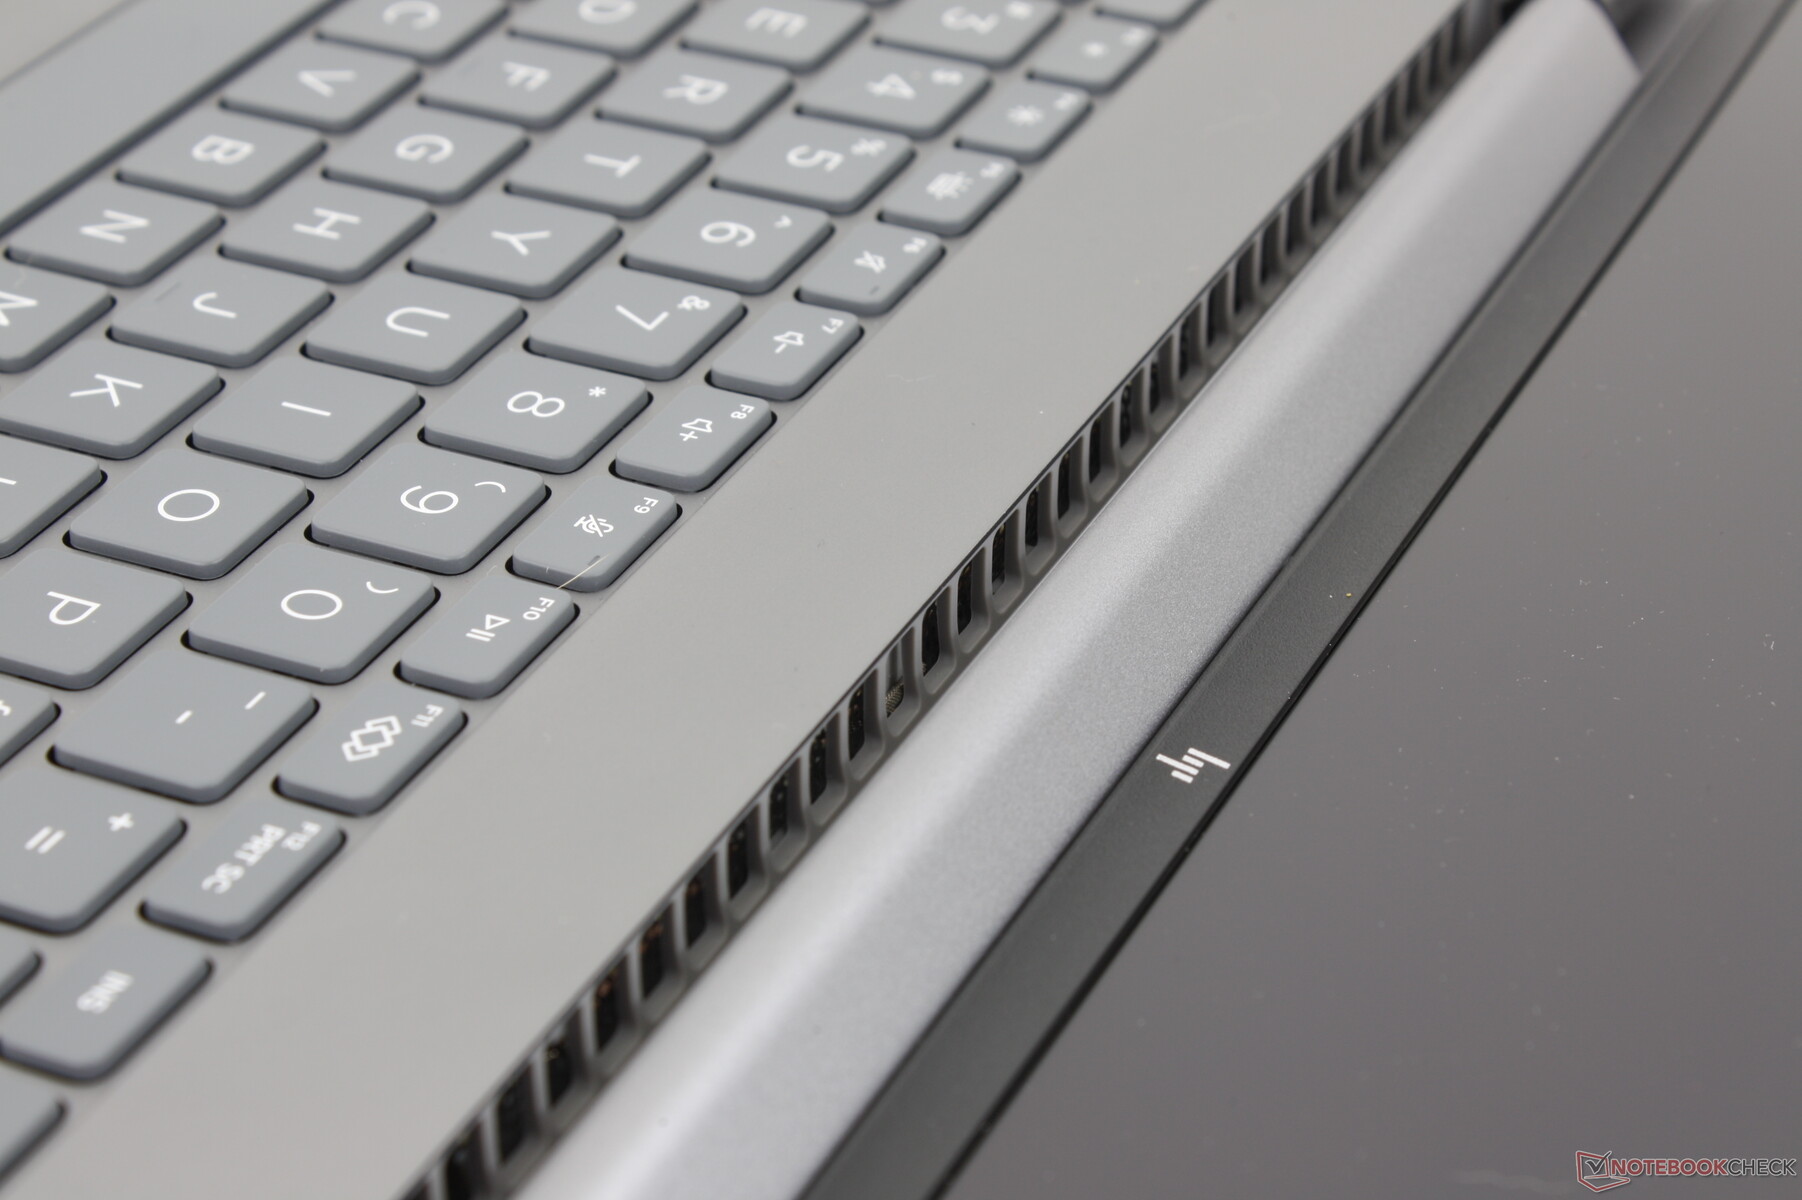
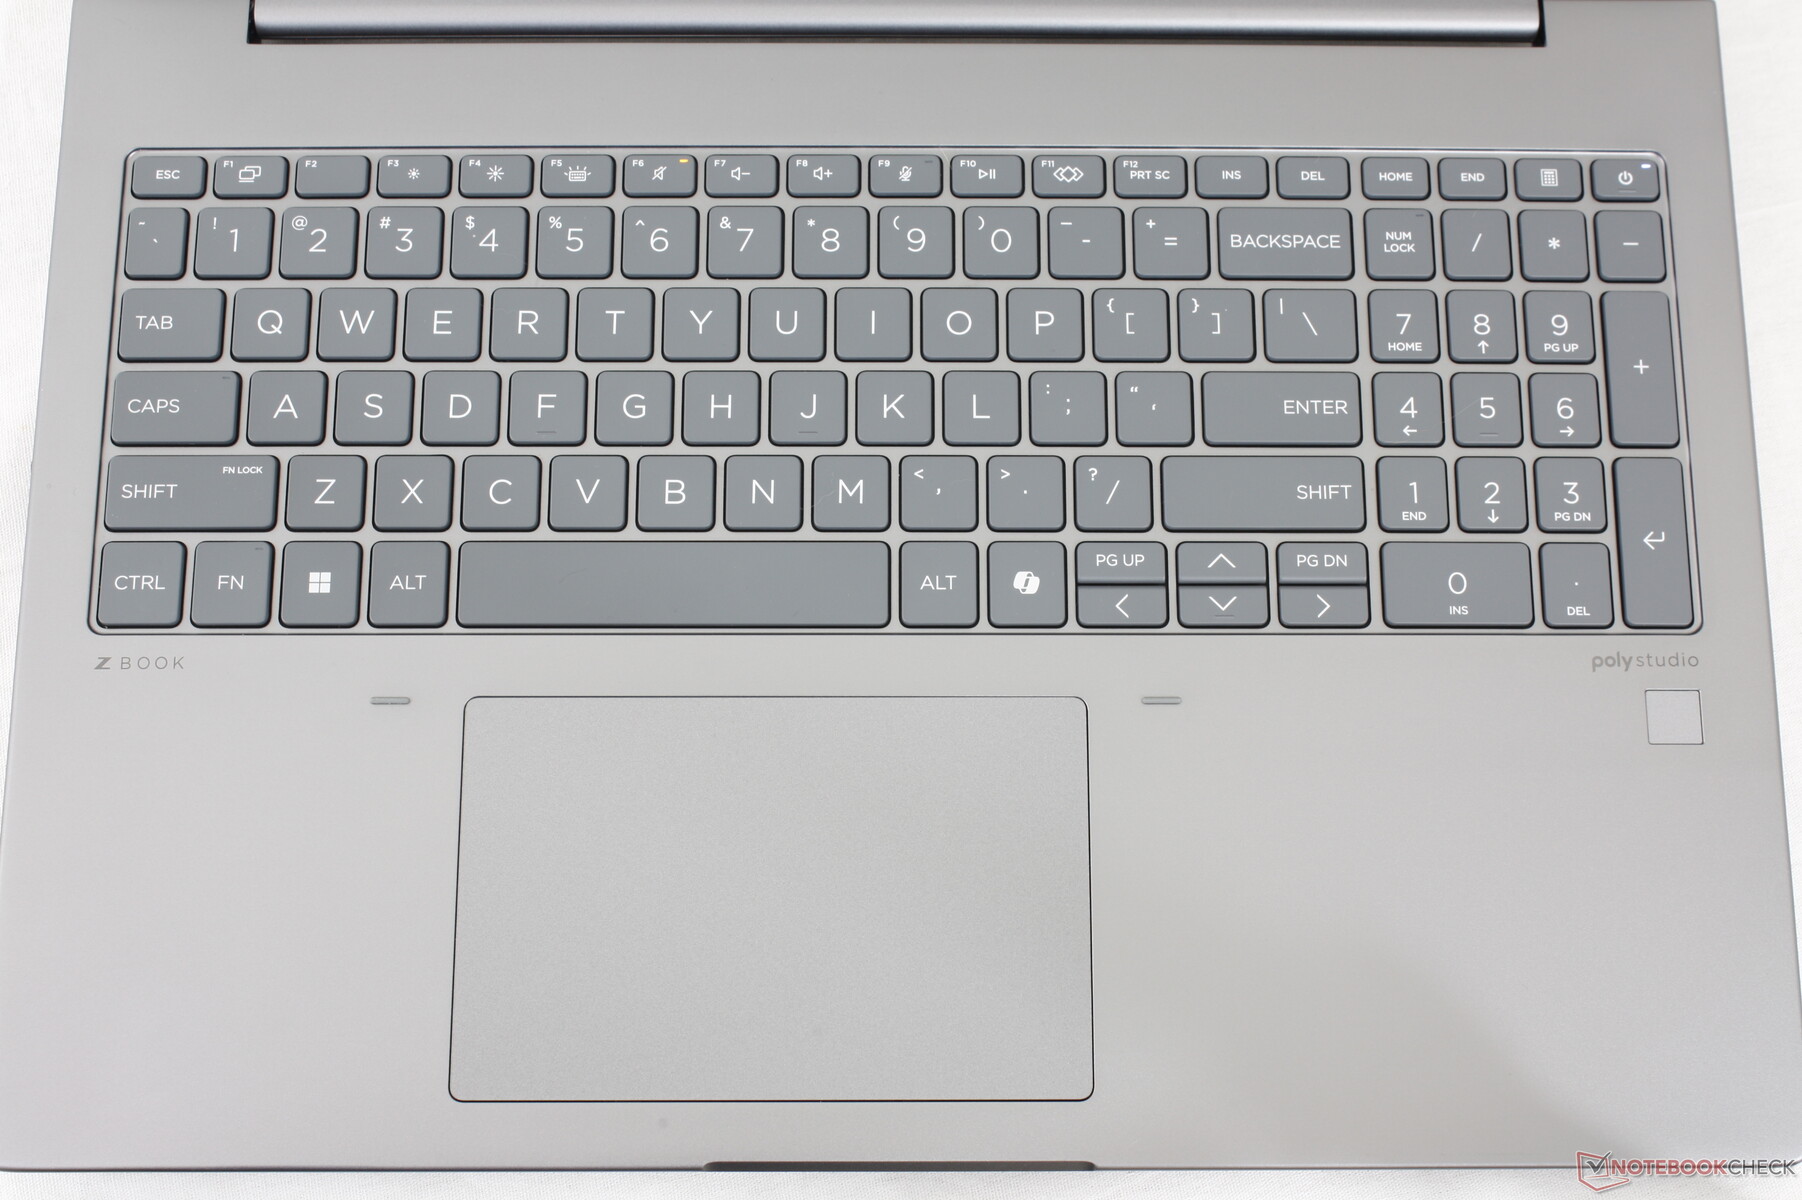
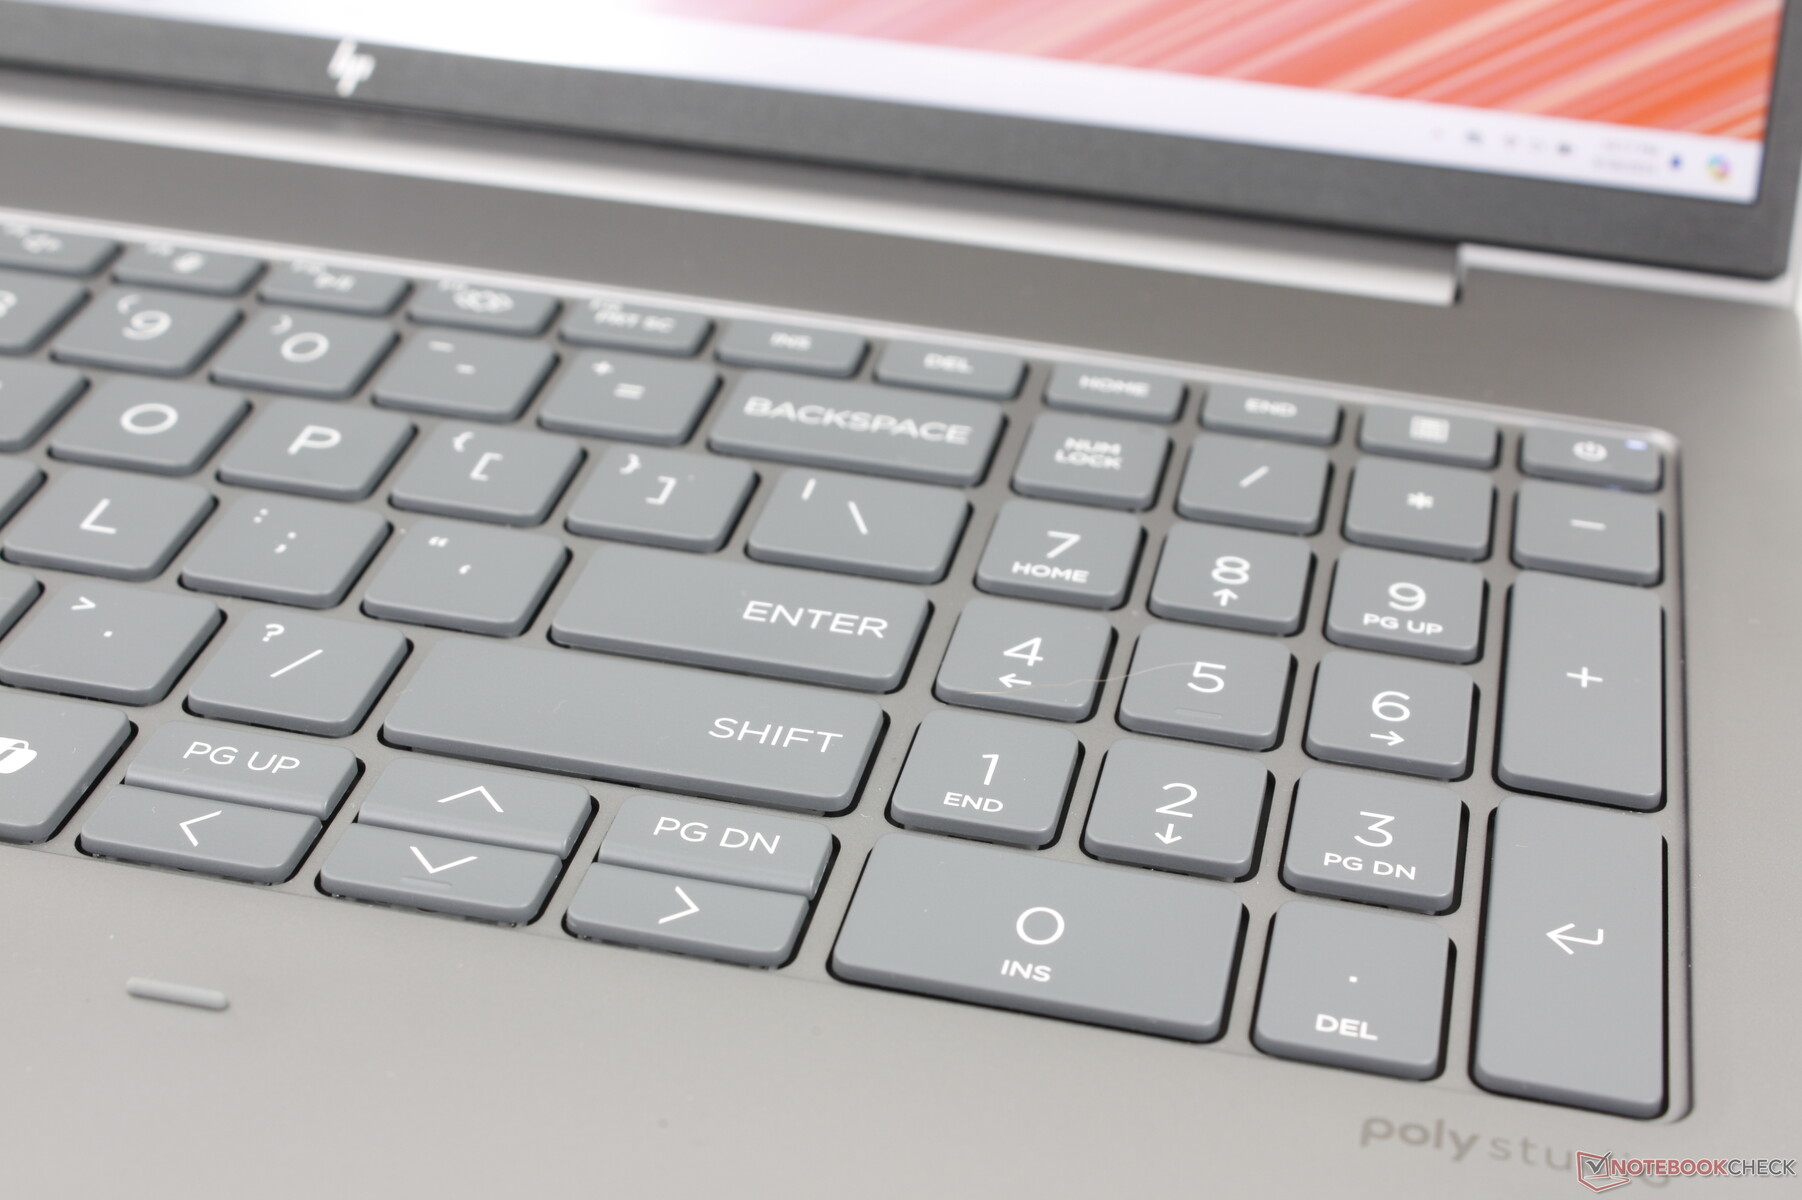
Urządzenia wejściowe - obszerne klawisze
Klawiatura
Doświadczenie podczas pisania jest podobne do Spectre x360 16 w tym sensie, że klawisze są twarde ze stosunkowo ostrym sprzężeniem zwrotnym, co zapewnia wygodę pisania. W szczególności skok klawiszy jest głębszy niż w większości ultrabooków, aby uniknąć typowego płytkiego lub gąbczastego sprzężenia zwrotnego.
Klawiatura numeryczna powróciła, podczas gdy brakuje jej w konkurencyjnym modelu Precision 5690. Jego klawisze są jednak nieco węższe niż główne klawisze QWERTY, więc sprzężenie zwrotne jest zauważalnie bardziej miękkie po naciśnięciu.
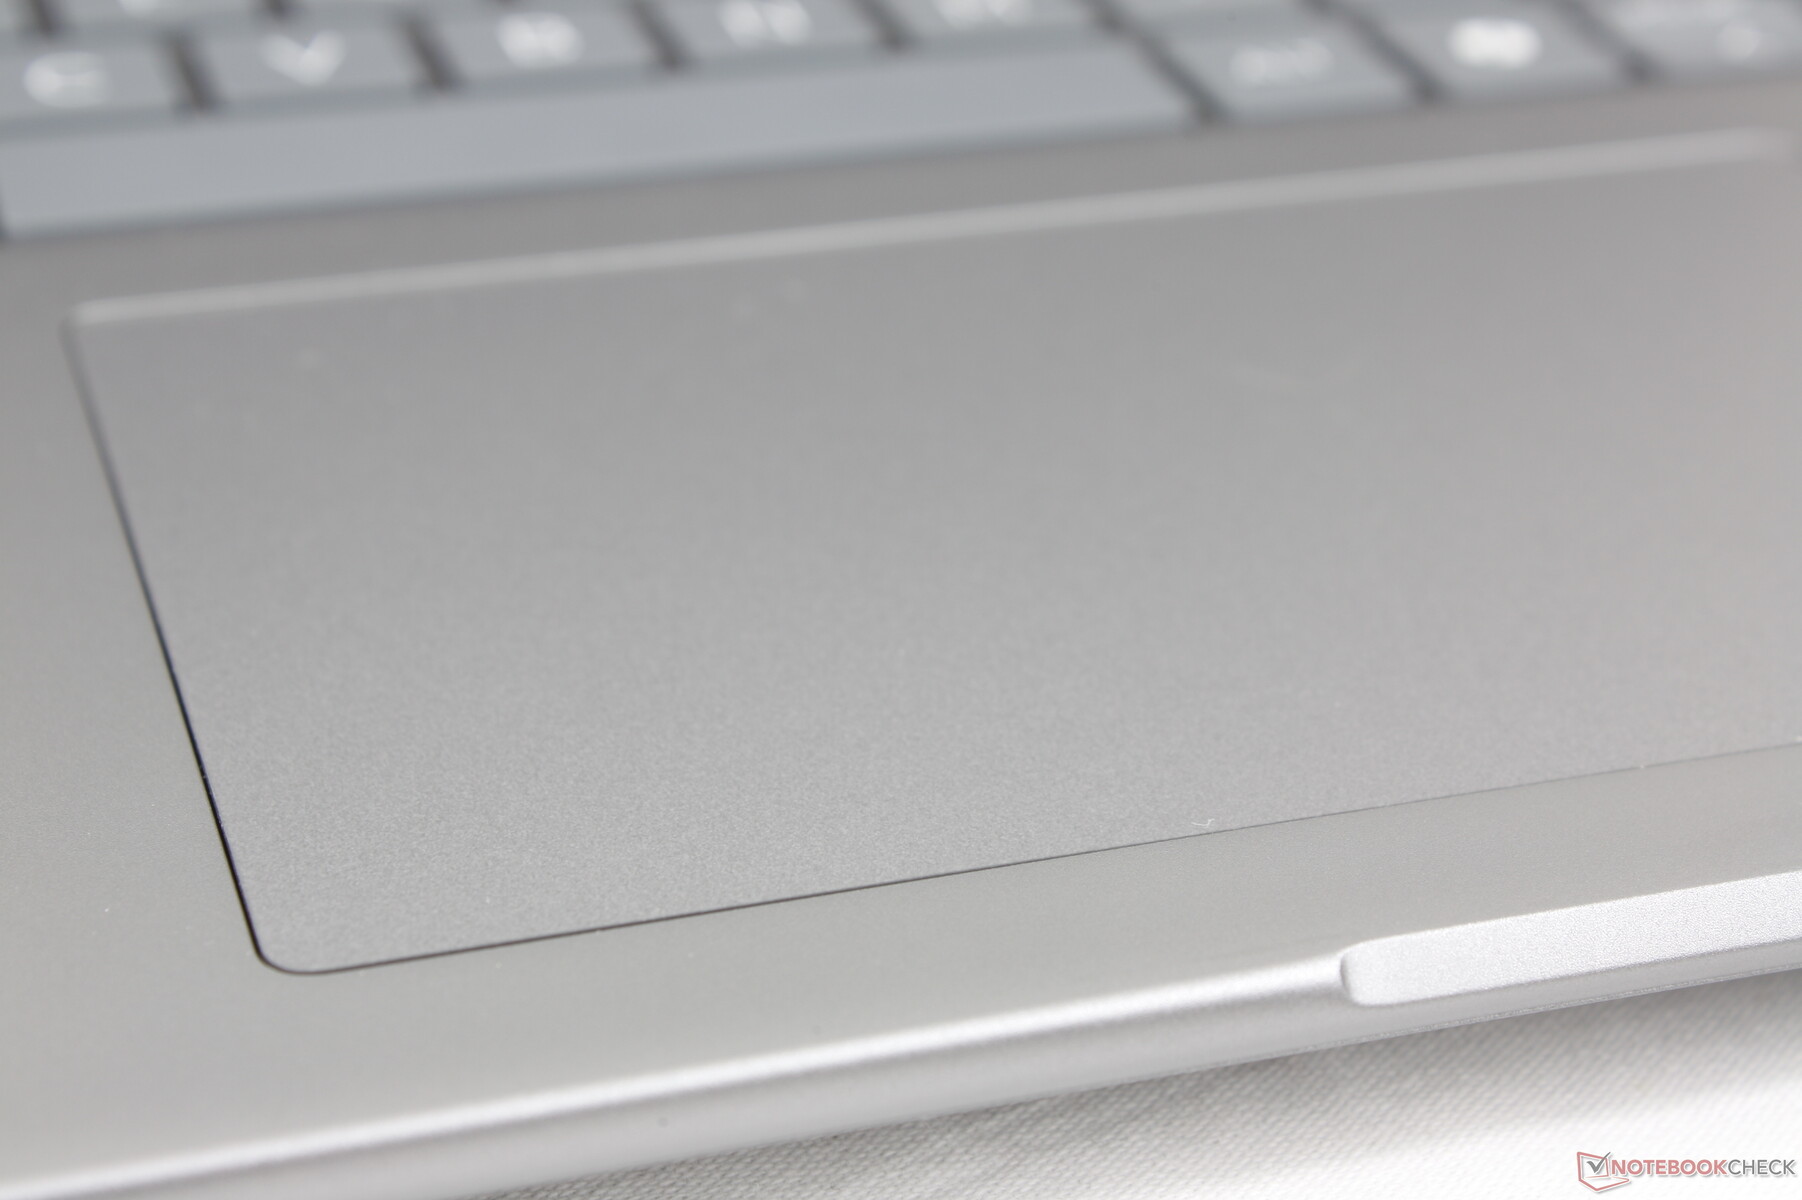
Panel dotykowy
Klawiatura jest większa niż wcześniej (12,5 x 8 cm w porównaniu do 11,5 x 7 cm), aby wykorzystać większą 16-calową obudowę. Nadal brakuje dedykowanych klawiszy, które są dostępne w droższej serii ZBook Fury. Trakcja i sprzężenie zwrotne są jednak odpowiednio gładkie i klikalne, aby były bardziej niezawodne niż zwykle gąbczaste clickpady w większości laptopów konsumenckich.

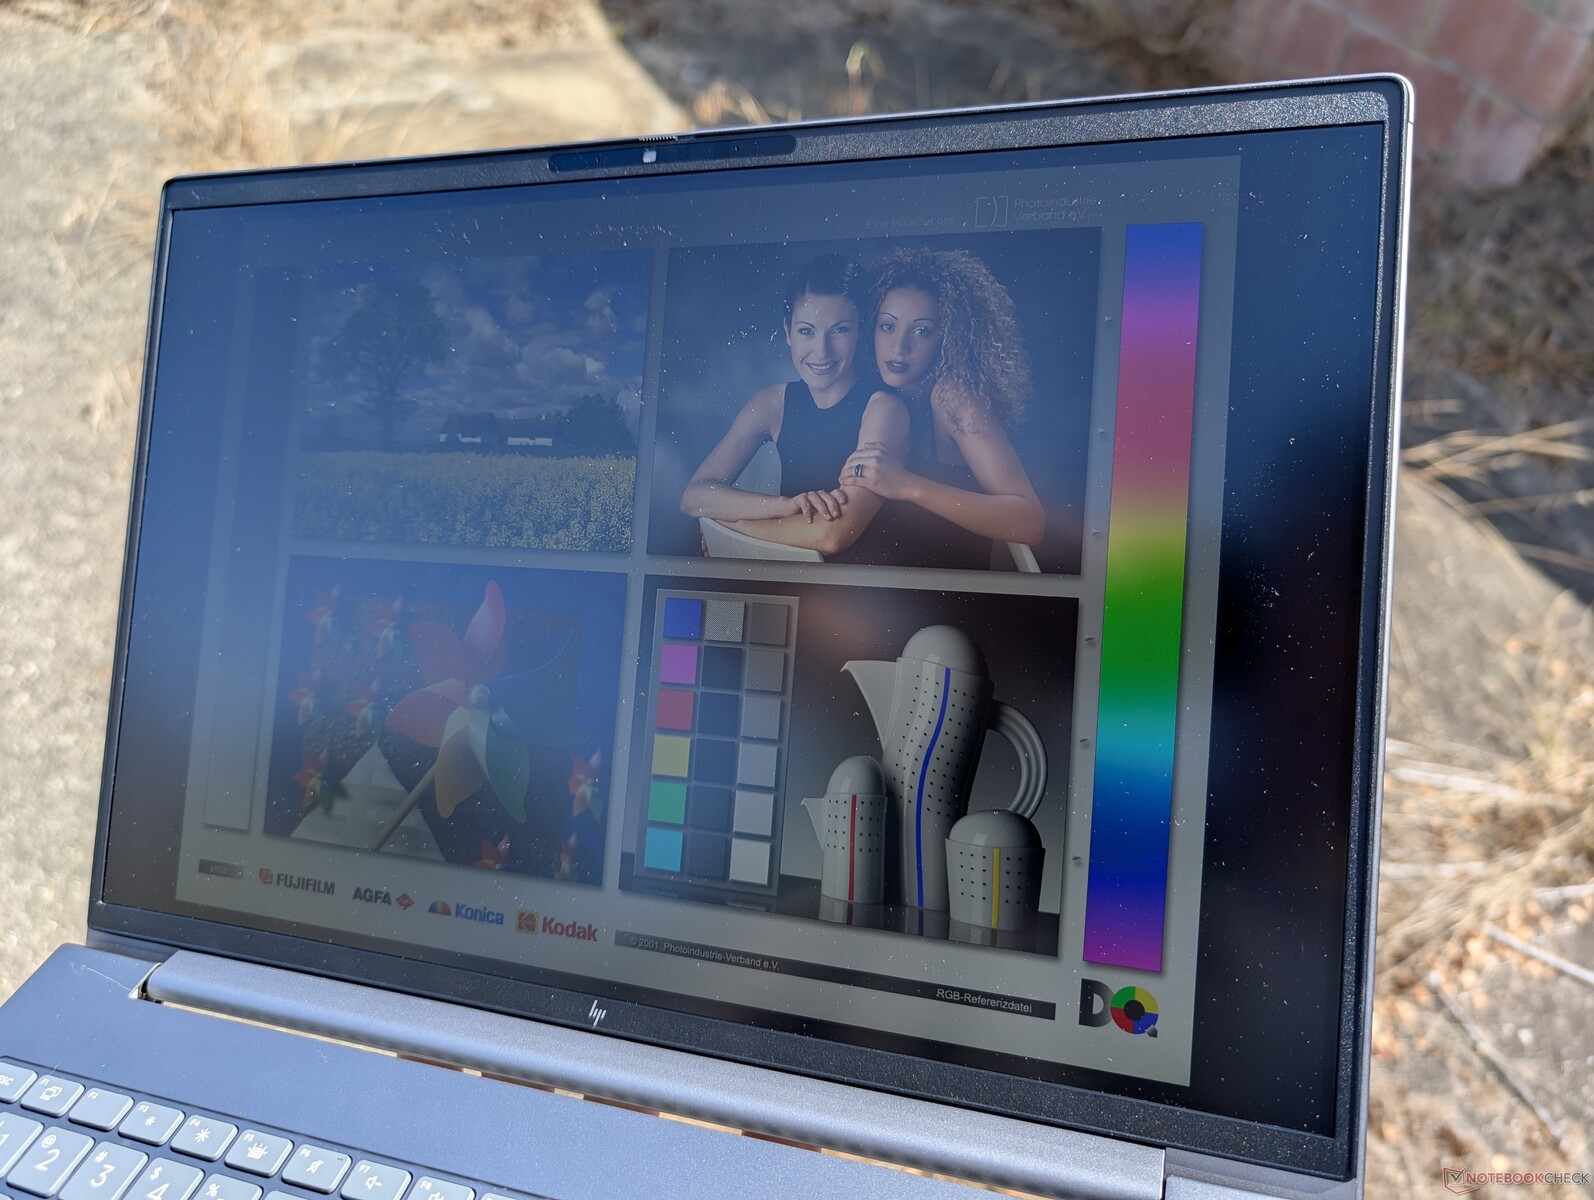
Wyświetlacz - IPS na całej płycie
Łącznie dostępnych jest pięć opcji wyświetlania, z których wszystkie są tylko IPS. Nasza konfiguracja jest dostarczana z pogrubioną opcją.
- 1920 x 1200, bezdotykowy, matowy, 250 nitów, 45 procent NTSC, 60 Hz
- 1920 x 1200, dotykowy, matowy, 250 nitów, 45 procent NTSC, 60 Hz
- 1920 x 1200, bezdotykowy, matowy, 400 nitów, 100% sRGB, 60 Hz
- 1920 x 1200, bezdotykowy, matowy, 1000 nitów, 100% sRGB, HP Sure View, 60 Hz
- 2560 x 1600, bezdotykowy, matowy, 400 nitów, 100% sRGB, 120 Hz
Jeśli jakość obrazu ma znaczenie, użytkownicy powinni pominąć dwie pierwsze opcje z niższej półki, ponieważ pokrycie kolorów wyniesie tylko około 60 procent sRGB. Superjasny panel o jasności 1000 nitów jest godny uwagi, ponieważ wiele innych stacji roboczych nie oferuje tej funkcji, ale opcja ta jest niestety powiązana z Sure View, co poważnie ogranicza kąty widzenia w celu zwiększenia prywatności. Nie ma żadnych opcji OLED, HDR ani P3, o których można by mówić, co jest nieco rozczarowujące w przypadku wydajnej stacji roboczej. Użytkownicy musieliby uaktualnić do HP ZBook Fury 16 G11 lub rozważyć ThinkPad P16s G2 dla takich funkcji.

| |||||||||||||||||||||||||
rozświetlenie: 88 %
na akumulatorze: 470.7 cd/m²
kontrast: 826:1 (czerń: 0.57 cd/m²)
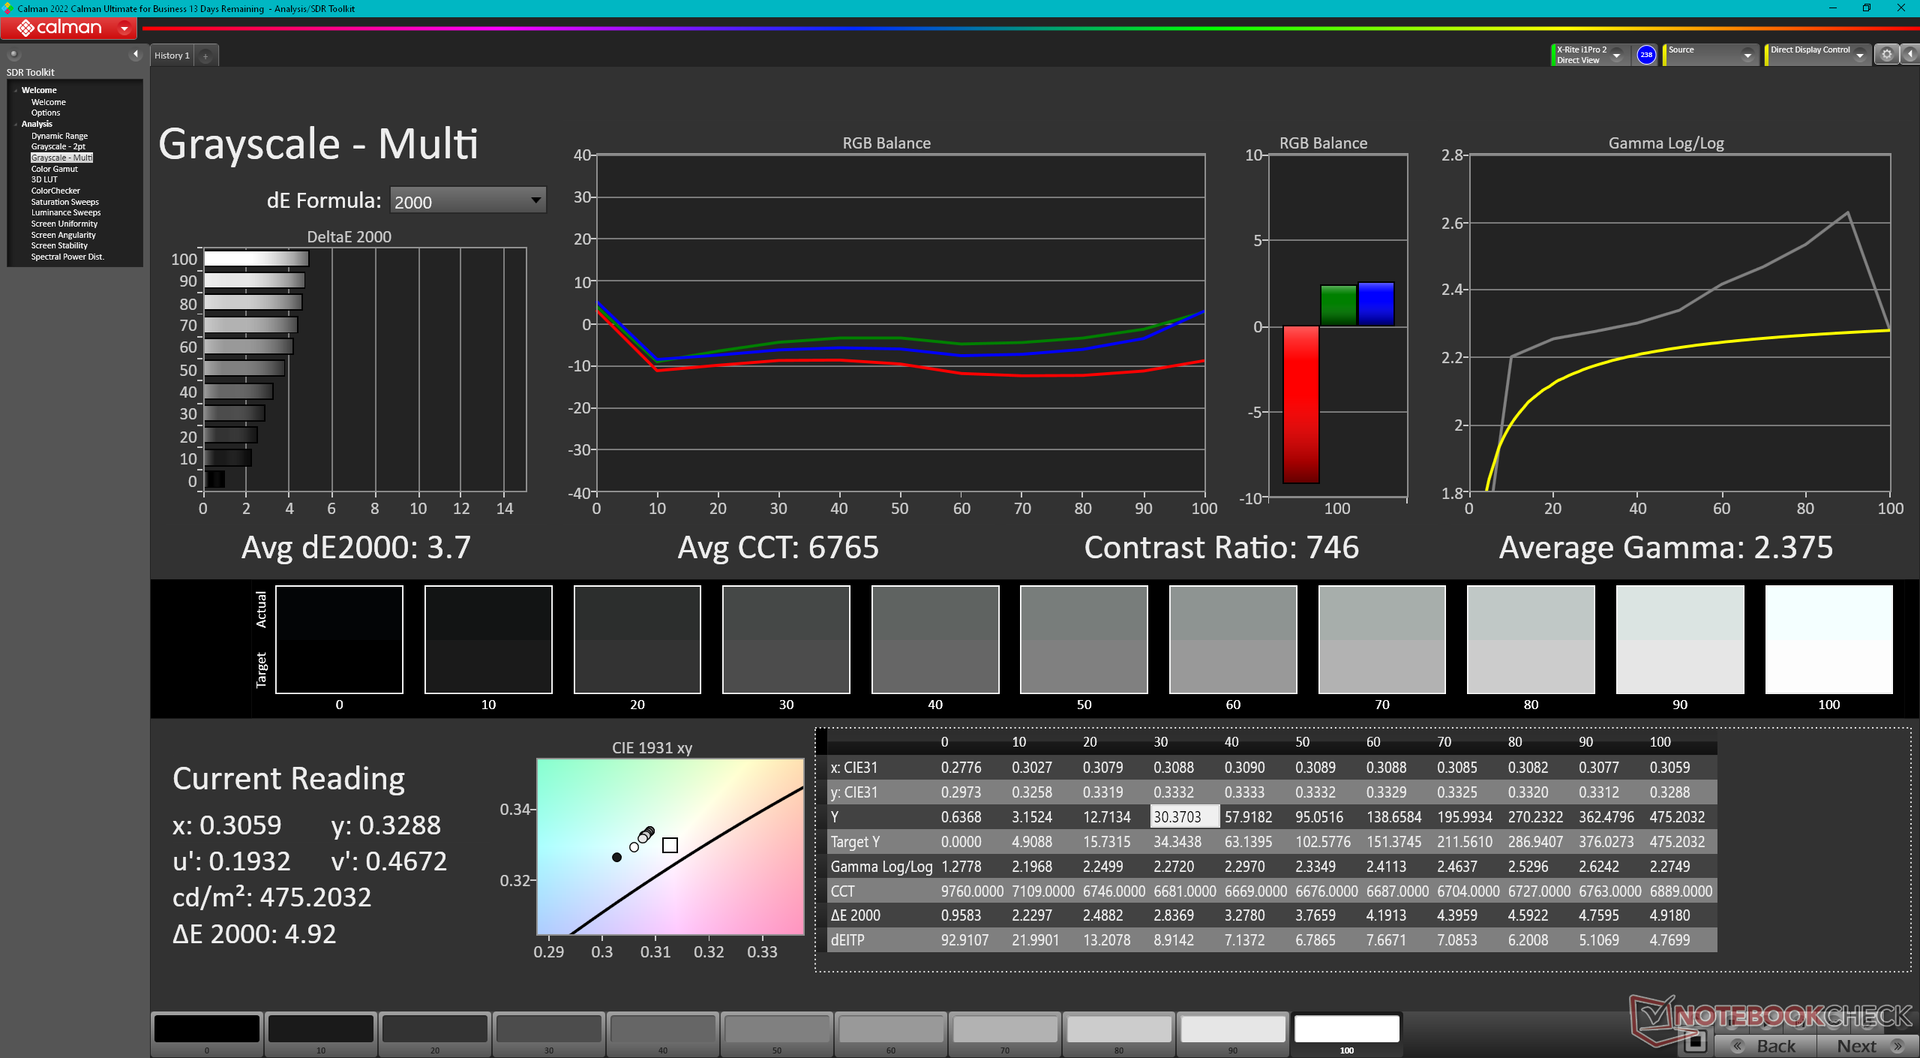
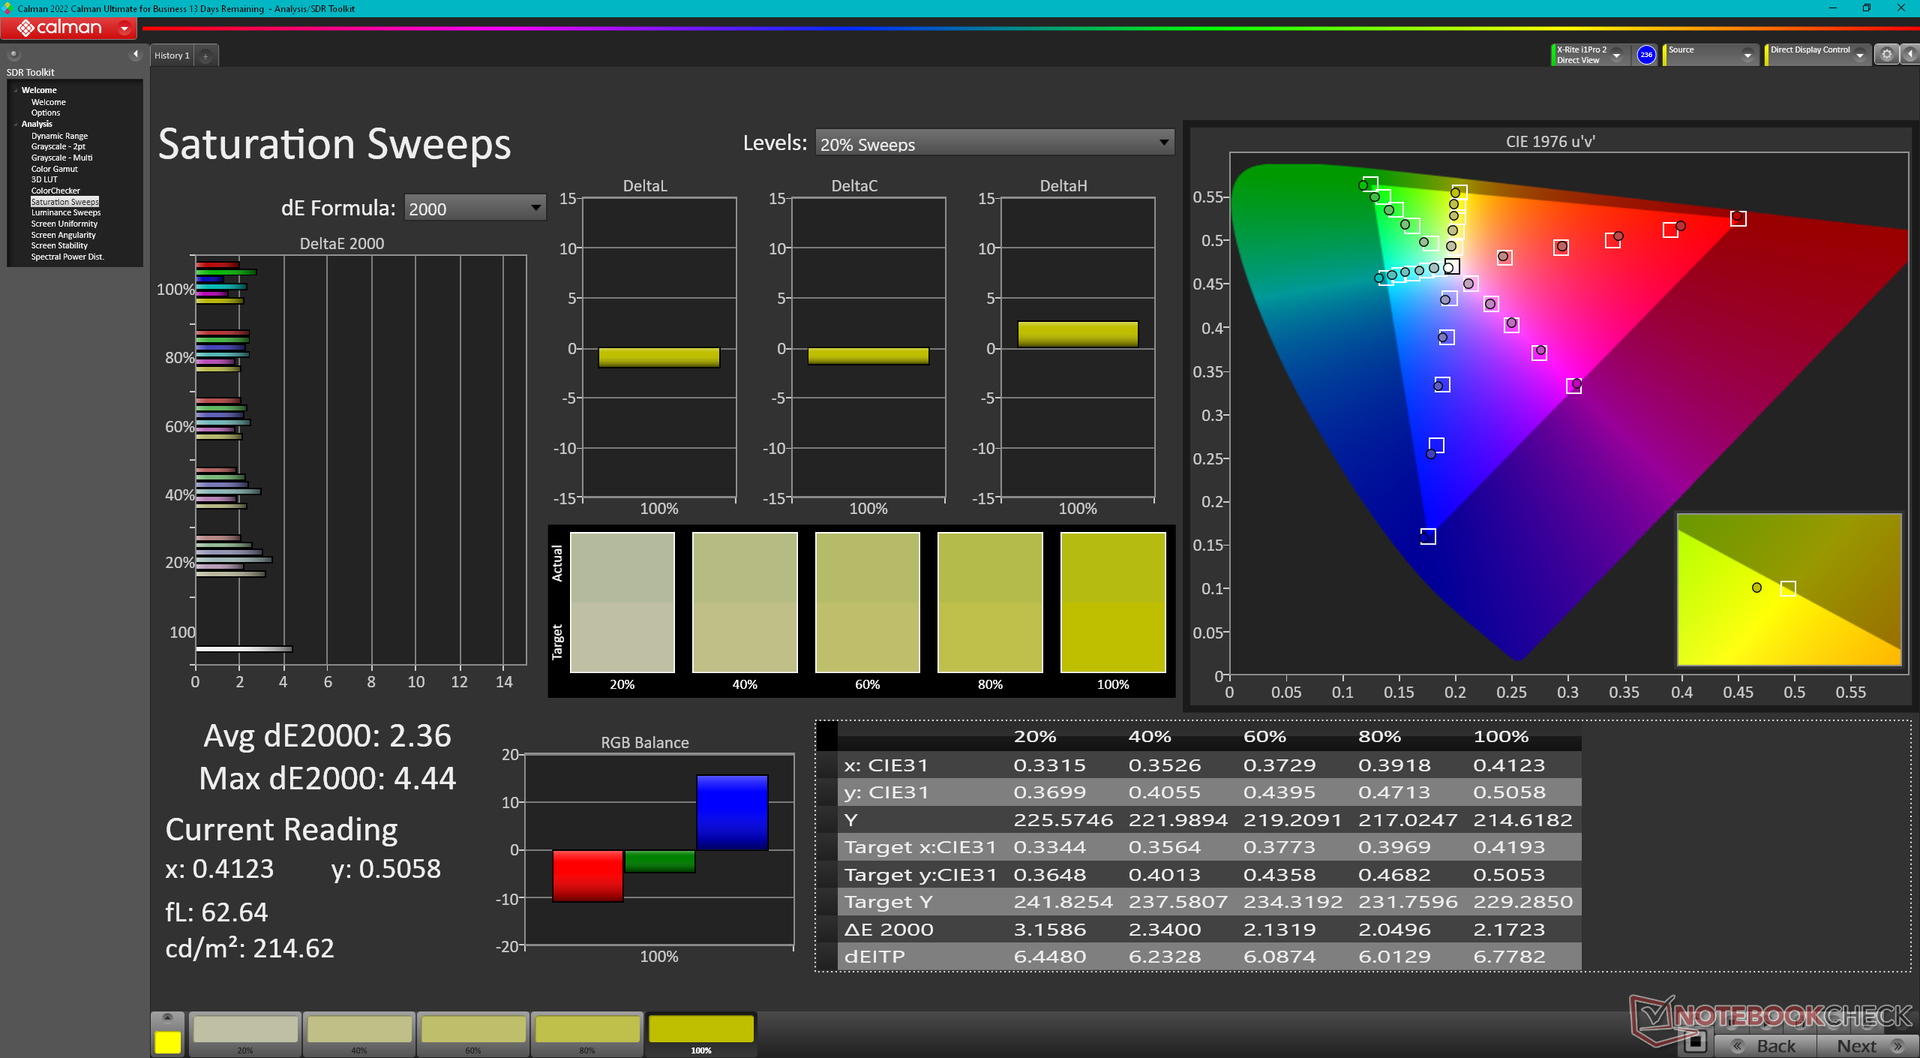
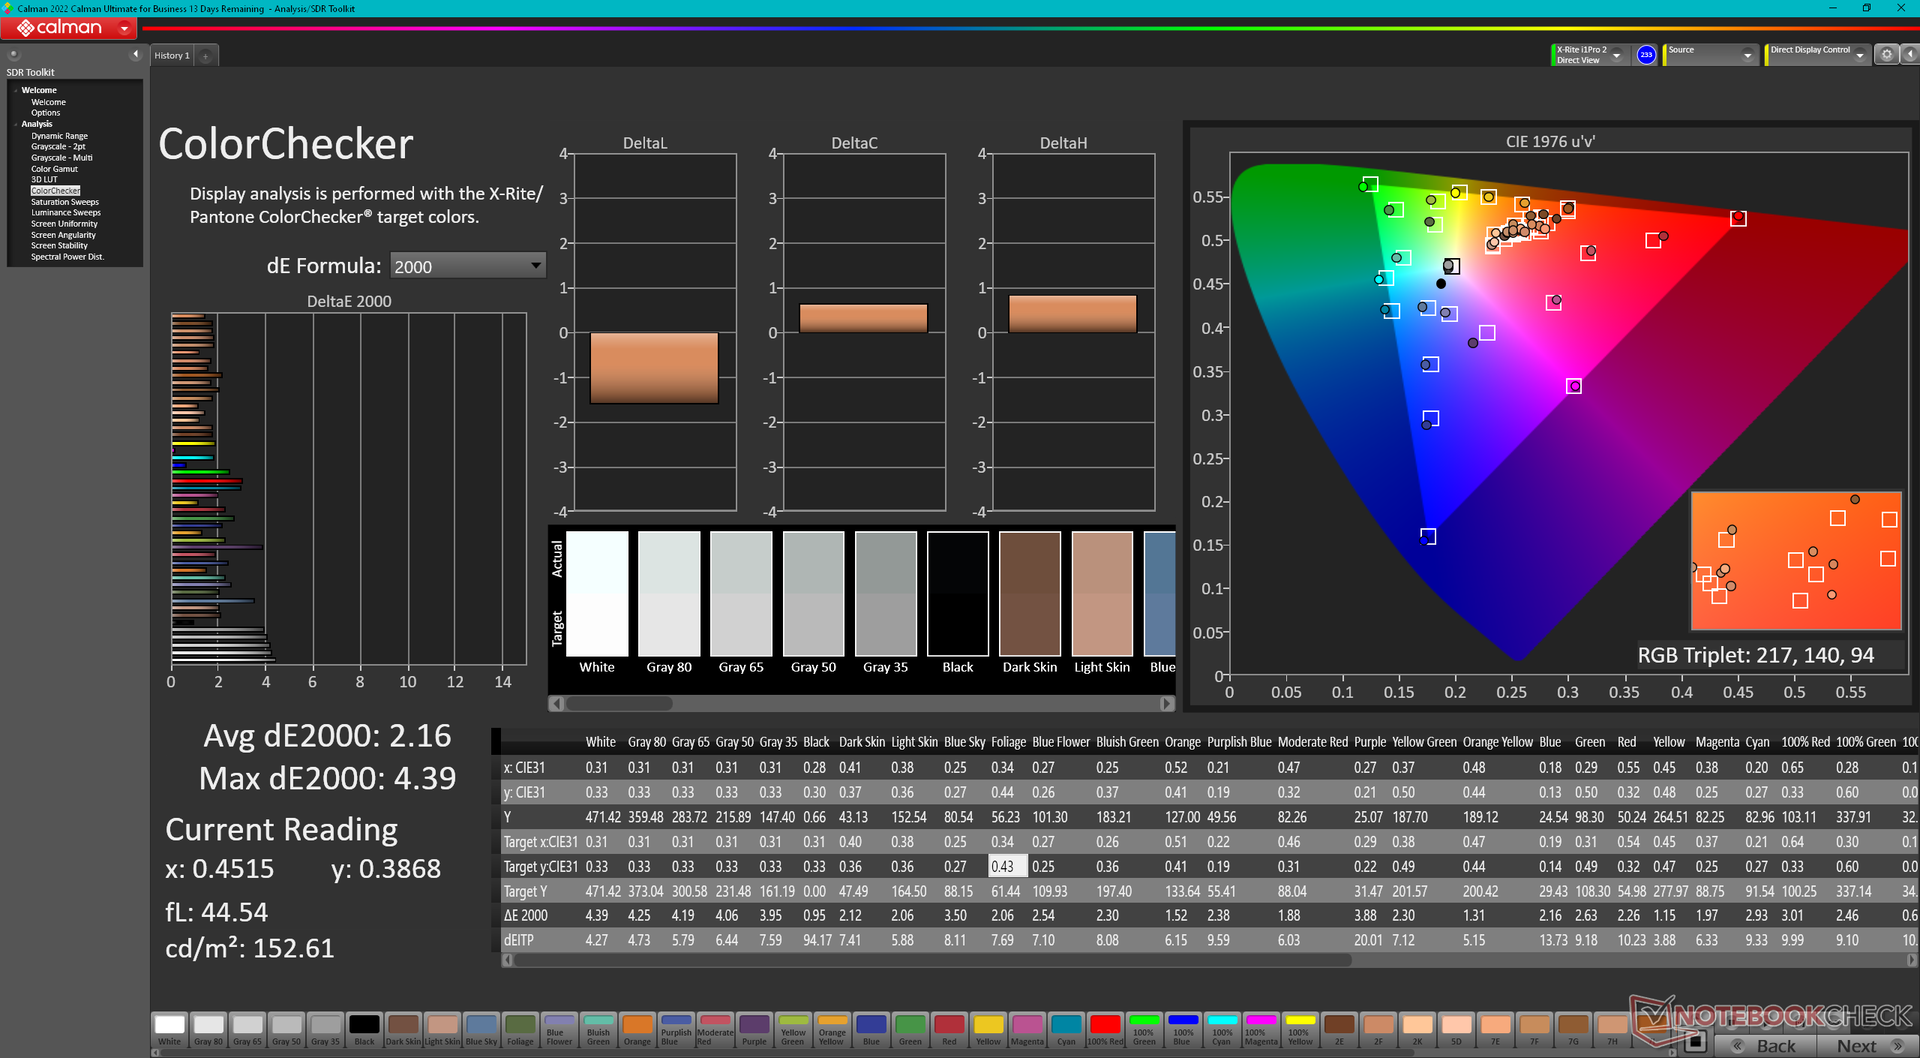
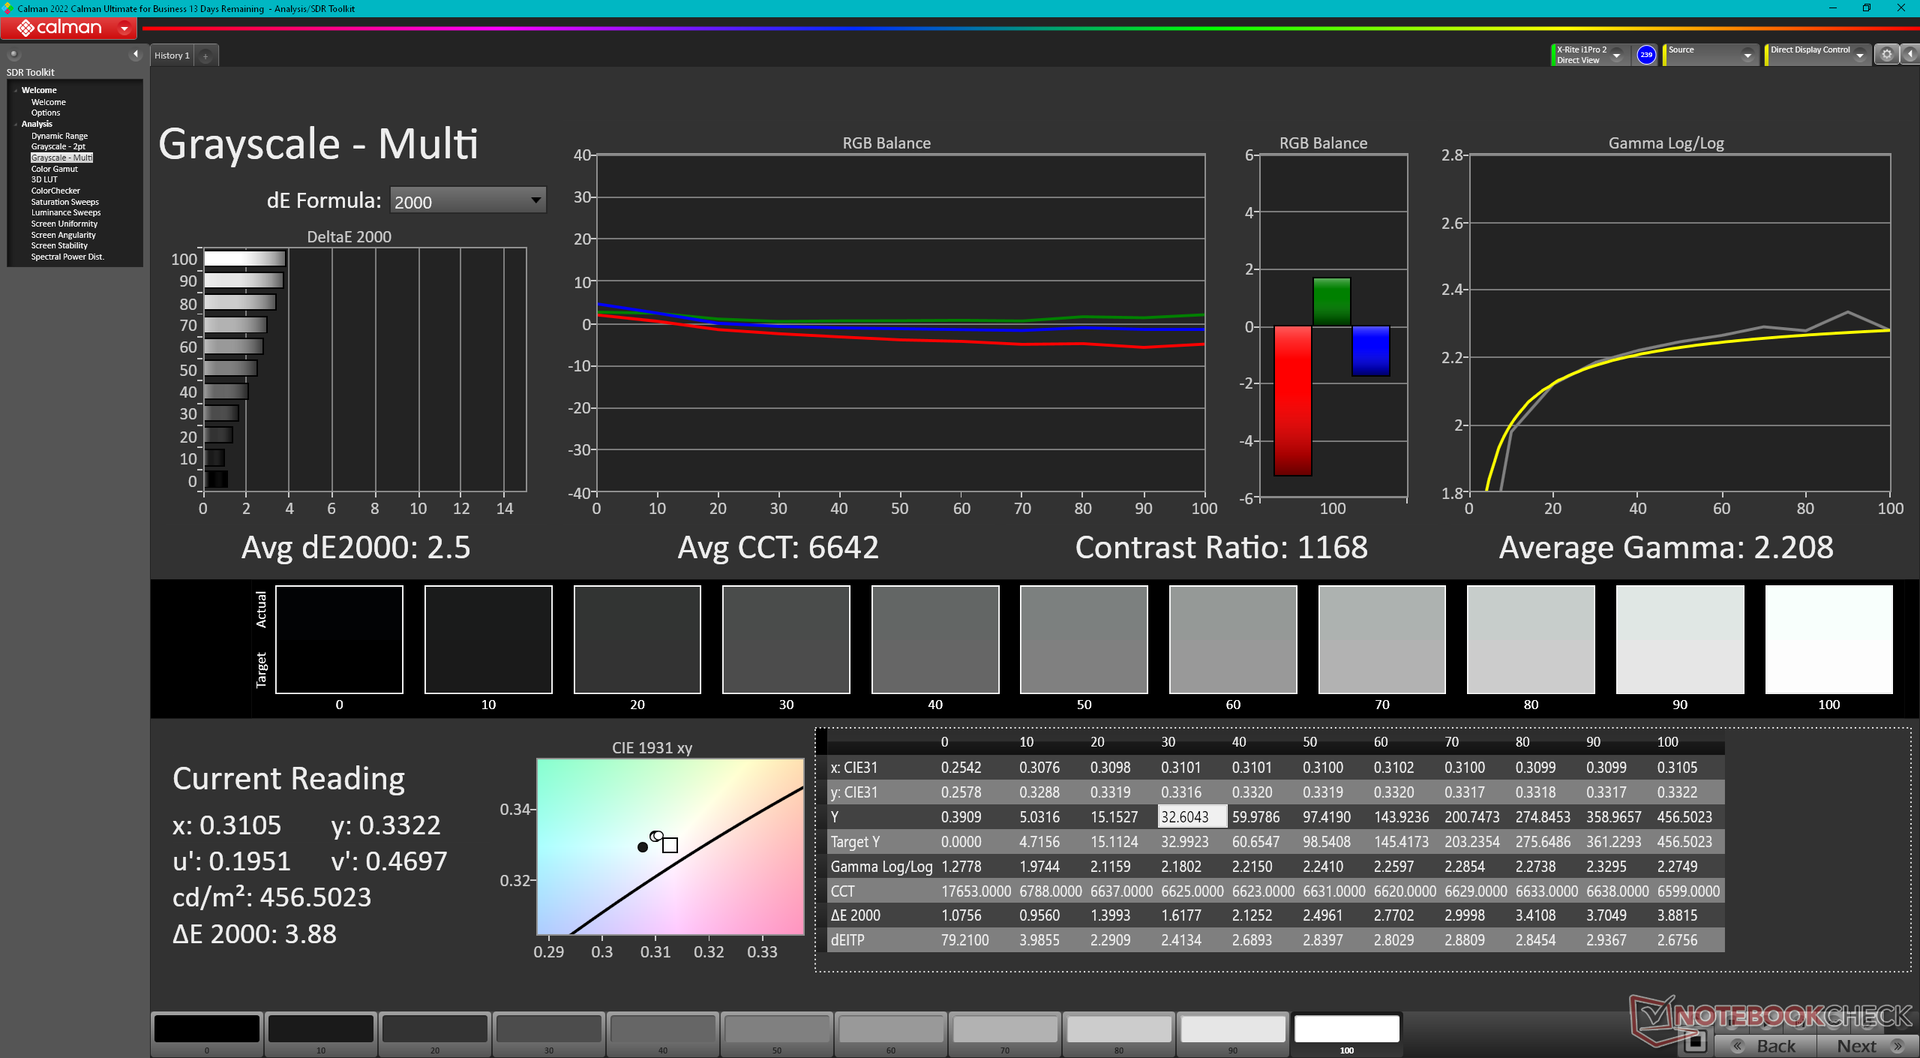
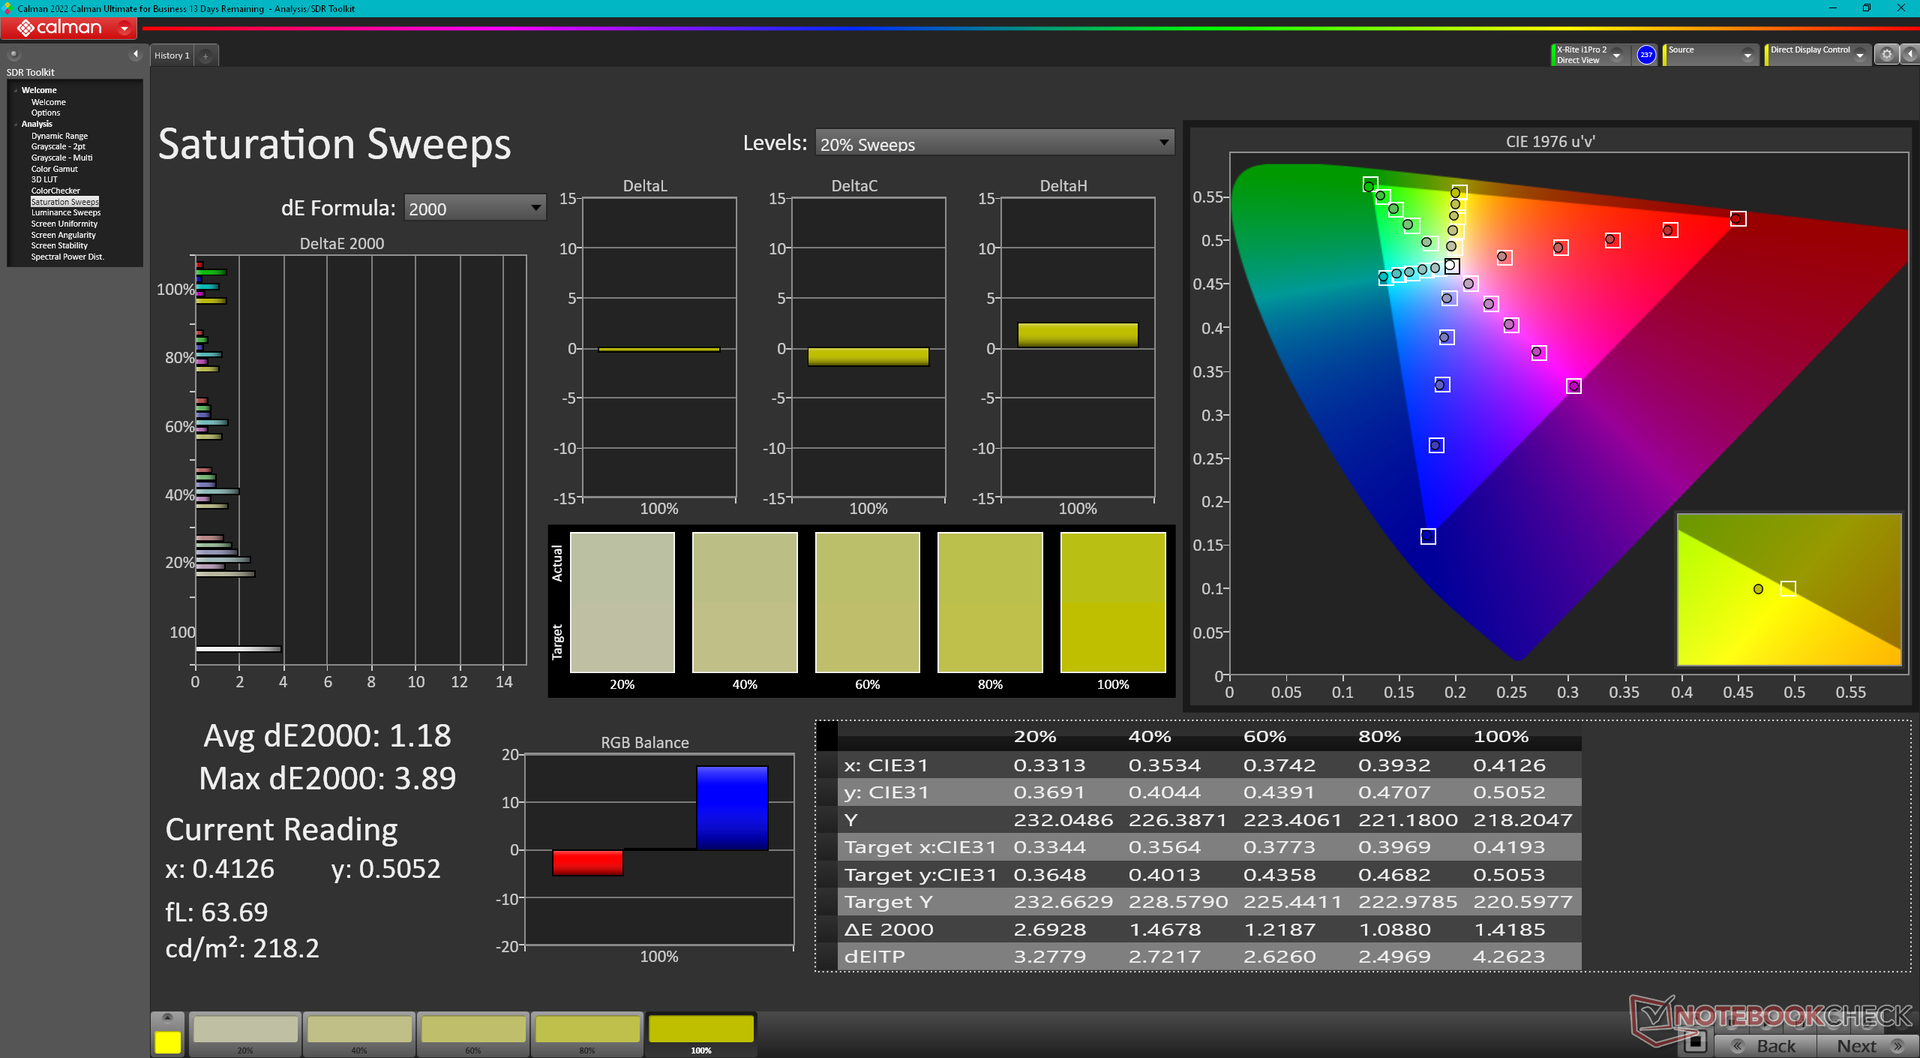
ΔE Color 2.16 | 0.5-29.43 Ø4.87, calibrated: 1.37
ΔE Greyscale 3.7 | 0.5-98 Ø5.1
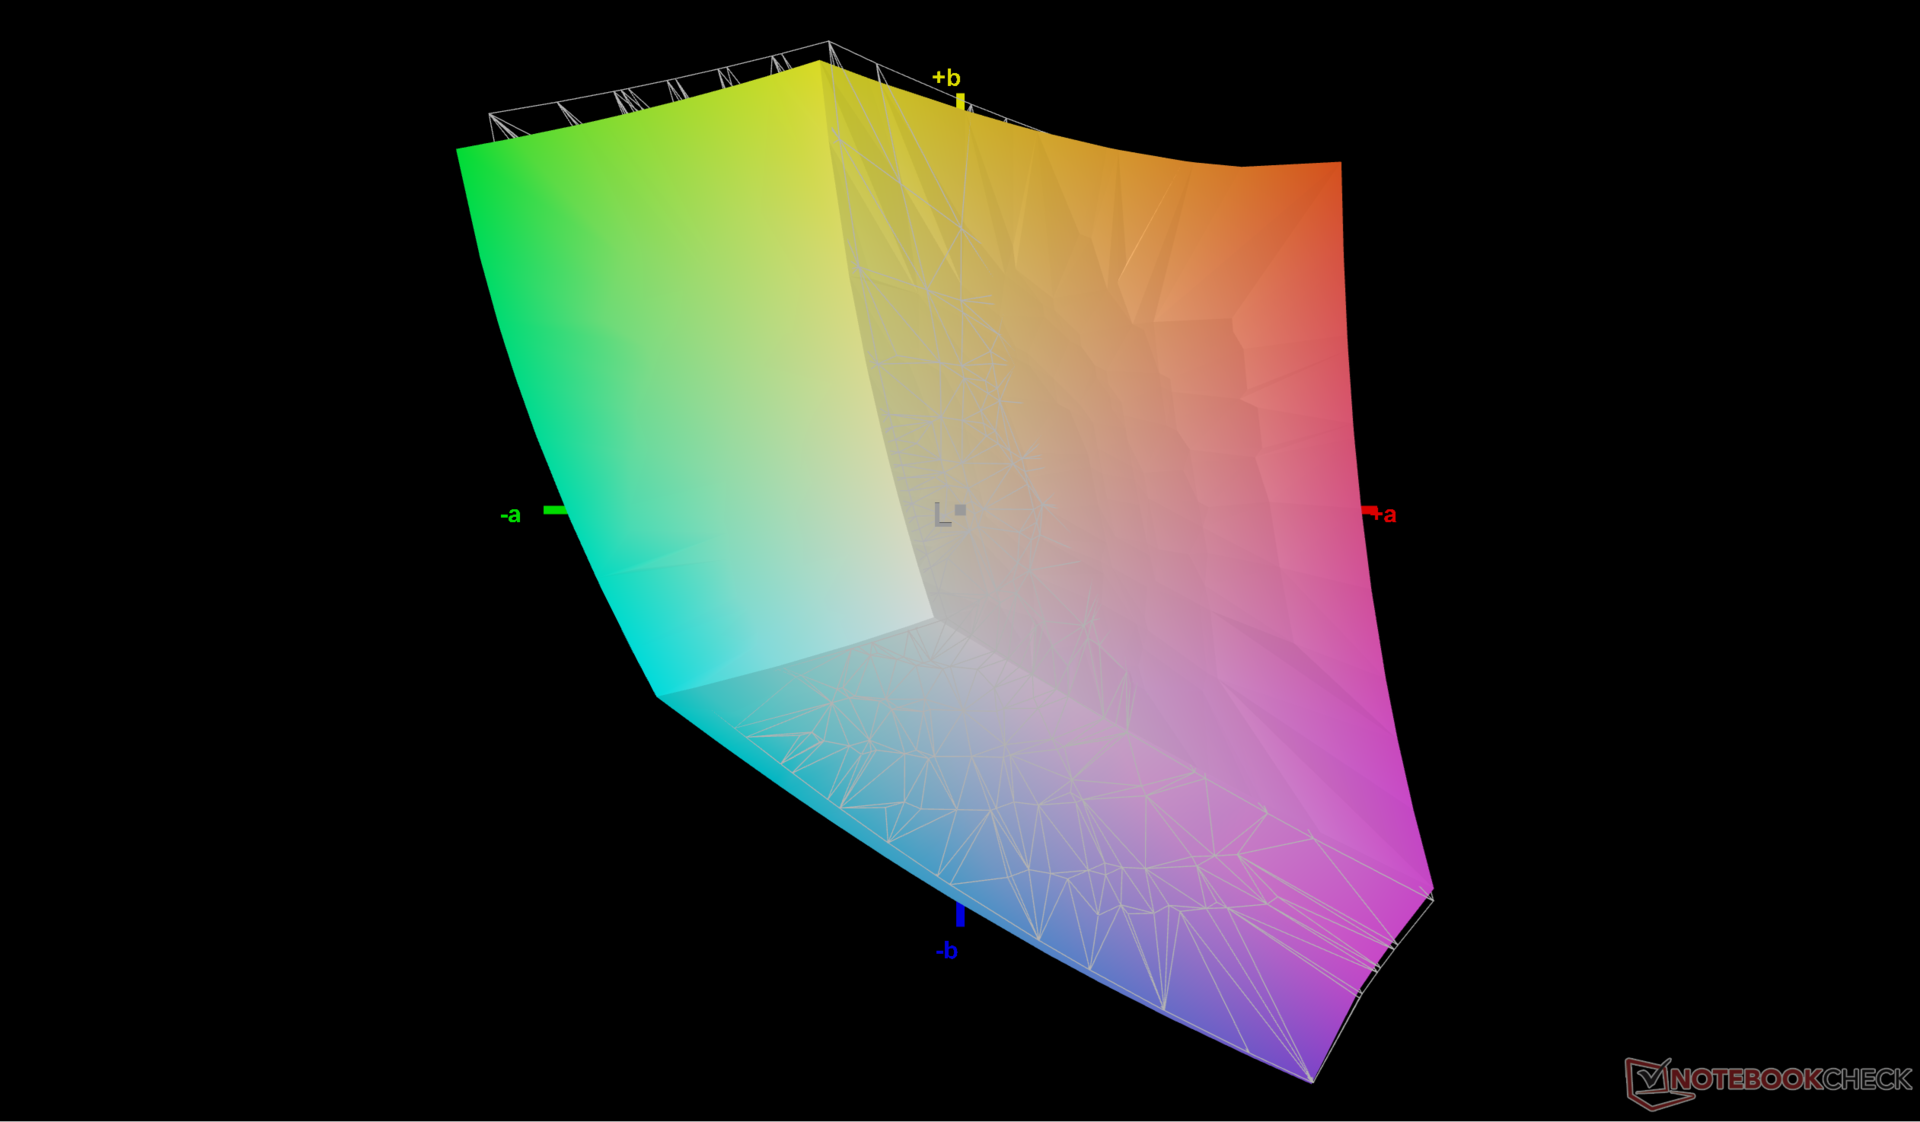
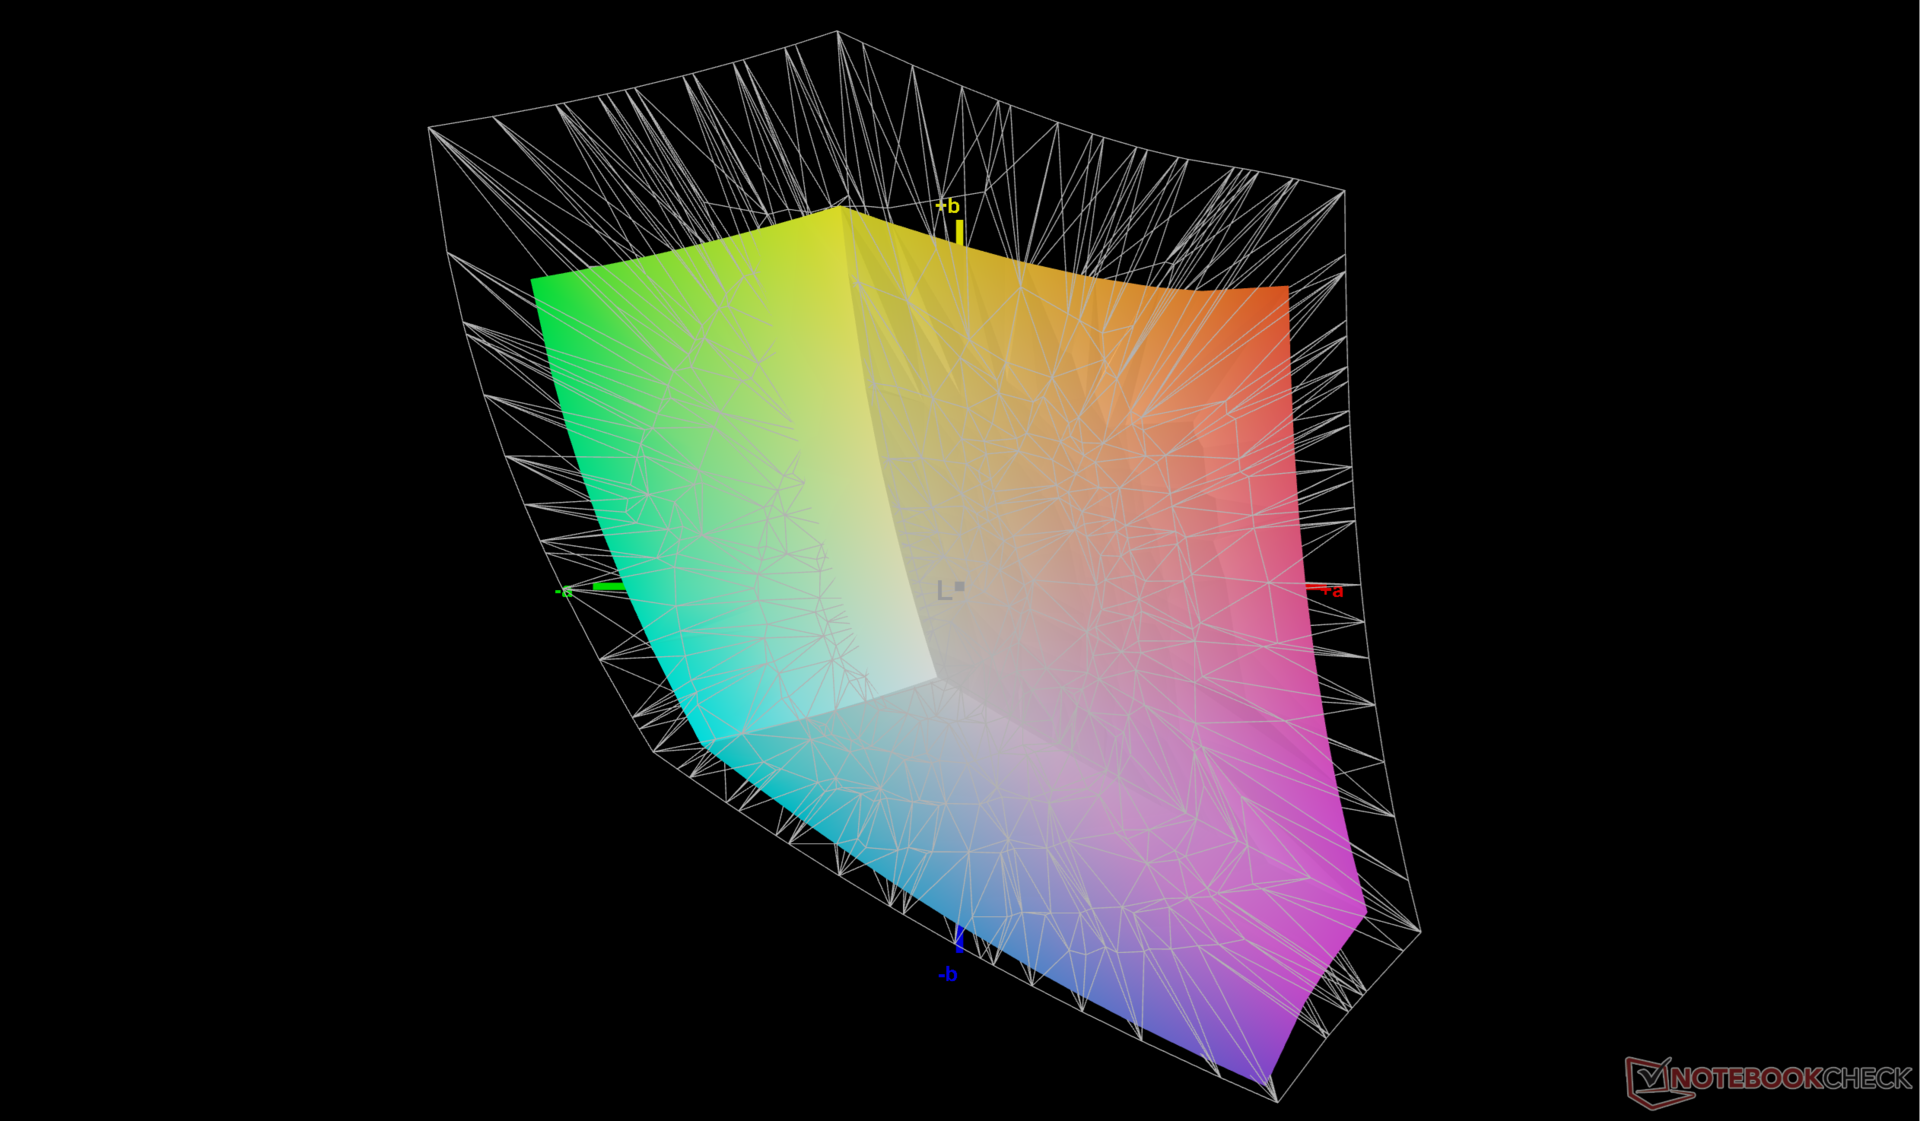
71% AdobeRGB 1998 (Argyll 2.2.0 3D)
97.7% sRGB (Argyll 2.2.0 3D)
69.1% Display P3 (Argyll 2.2.0 3D)
Gamma: 2.38
| HP ZBook Power 16 G11 A AUOA0A9, IPS, 2560x1600, 16", 120 Hz | HP ZBook Power 15 G10 BOE0B6A, IPS, 2560x1440, 15.6", 120 Hz | HP ZBook Fury 16 G11 AUO87A8, IPS, 3840x2400, 16", 120 Hz | Lenovo ThinkPad P1 Gen 7 21KV001SGE MNG007DA1-9 , IPS LED, 2560x1600, 16", 165 Hz | Lenovo ThinkPad P16s G2 21K9000CGE ATNA60YV04-0, OLED, 3840x2400, 16", 60 Hz | Dell Precision 5690 Samsung 160YV03, OLED, 3840x2400, 16", 60 Hz | |
|---|---|---|---|---|---|---|
| Display | -1% | 22% | 0% | 28% | 27% | |
| Display P3 Coverage | 69.1 | 68.2 -1% | 98.4 42% | 69.4 0% | 99.9 45% | 99.8 44% |
| sRGB Coverage | 97.7 | 95.6 -2% | 99.9 2% | 97.6 0% | 100 2% | 100 2% |
| AdobeRGB 1998 Coverage | 71 | 70.5 -1% | 86 21% | 71.8 1% | 96.9 36% | 96.6 36% |
| Response Times | -10% | 8% | -4% | 87% | 84% | |
| Response Time Grey 50% / Grey 80% * | 13.6 ? | 13 ? 4% | 11.4 ? 16% | 11.2 ? 18% | 1.5 ? 89% | 1.7 ? 87% |
| Response Time Black / White * | 8.4 ? | 10.4 ? -24% | 8.4 ? -0% | 10.6 ? -26% | 1.3 ? 85% | 1.7 ? 80% |
| PWM Frequency | 60 | 60 ? | ||||
| Screen | -13% | 5% | -10% | 2% | -14% | |
| Brightness middle | 470.7 | 313.8 -33% | 457.6 -3% | 516 10% | 416 -12% | 348.1 -26% |
| Brightness | 431 | 302 -30% | 466 8% | 505 17% | 421 -2% | 351 -19% |
| Brightness Distribution | 88 | 83 -6% | 83 -6% | 89 1% | 98 11% | 97 10% |
| Black Level * | 0.57 | 0.29 49% | 0.43 25% | 0.41 28% | ||
| Contrast | 826 | 1082 31% | 1064 29% | 1259 52% | ||
| Colorchecker dE 2000 * | 2.16 | 3.27 -51% | 2.78 -29% | 3.5 -62% | 1.3 40% | 4.18 -94% |
| Colorchecker dE 2000 max. * | 4.39 | 7.81 -78% | 5.53 -26% | 8.8 -100% | 2.8 36% | 6.68 -52% |
| Colorchecker dE 2000 calibrated * | 1.37 | 0.56 59% | 1.37 -0% | 1.2 12% | 2.9 -112% | 0.97 29% |
| Greyscale dE 2000 * | 3.7 | 5.9 -59% | 2 46% | 5.6 -51% | 1.8 51% | 1.7 54% |
| Gamma | 2.38 92% | 2.18 101% | 2.28 96% | 2.27 97% | 2.25 98% | 2.2 100% |
| CCT | 6765 96% | 6323 103% | 6806 96% | 6071 107% | 6574 99% | 6198 105% |
| Całkowita średnia (program / ustawienia) | -8% /
-10% | 12% /
9% | -5% /
-7% | 39% /
22% | 32% /
13% |
* ... im mniej tym lepiej
Wyświetlacz jest przyzwoicie skalibrowany po wyjęciu z pudełka względem standardu sRGB. Kalibracja panelu za pomocą naszego kolorymetru X-Rite poprawiłaby średnie wartości deltaE skali szarości i kolorów jeszcze bardziej, odpowiednio z 3,7 i 2,16 do zaledwie 2,5 i 1,37. Nasz skalibrowany profil ICM można pobrać bezpłatnie powyżej.

Wyświetl czasy reakcji
| ↔ Czas reakcji od czerni do bieli | ||
|---|---|---|
| 8.4 ms ... wzrost ↗ i spadek ↘ łącznie | ↗ 4.5 ms wzrost | 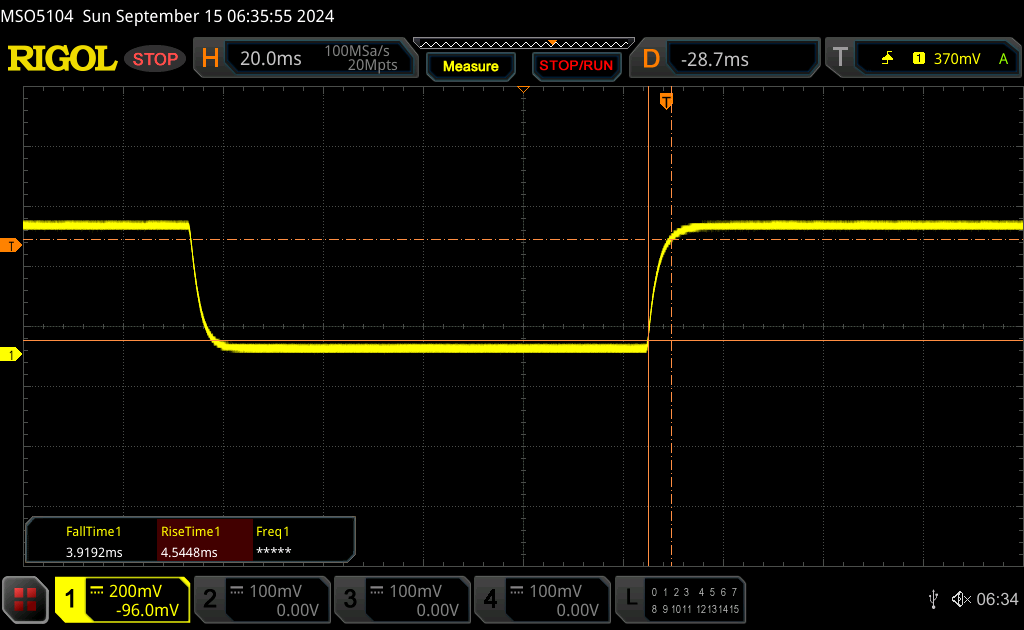 |
| ↘ 3.9 ms upadek | ||
| W naszych testach ekran wykazuje szybki czas reakcji i powinien nadawać się do gier. Dla porównania, wszystkie testowane urządzenia wahają się od 0.1 (minimum) do 240 (maksimum) ms. » 21 % wszystkich urządzeń jest lepszych. Oznacza to, że zmierzony czas reakcji jest lepszy od średniej wszystkich testowanych urządzeń (20.8 ms). | ||
| ↔ Czas reakcji 50% szarości do 80% szarości | ||
| 13.6 ms ... wzrost ↗ i spadek ↘ łącznie | ↗ 7.2 ms wzrost | 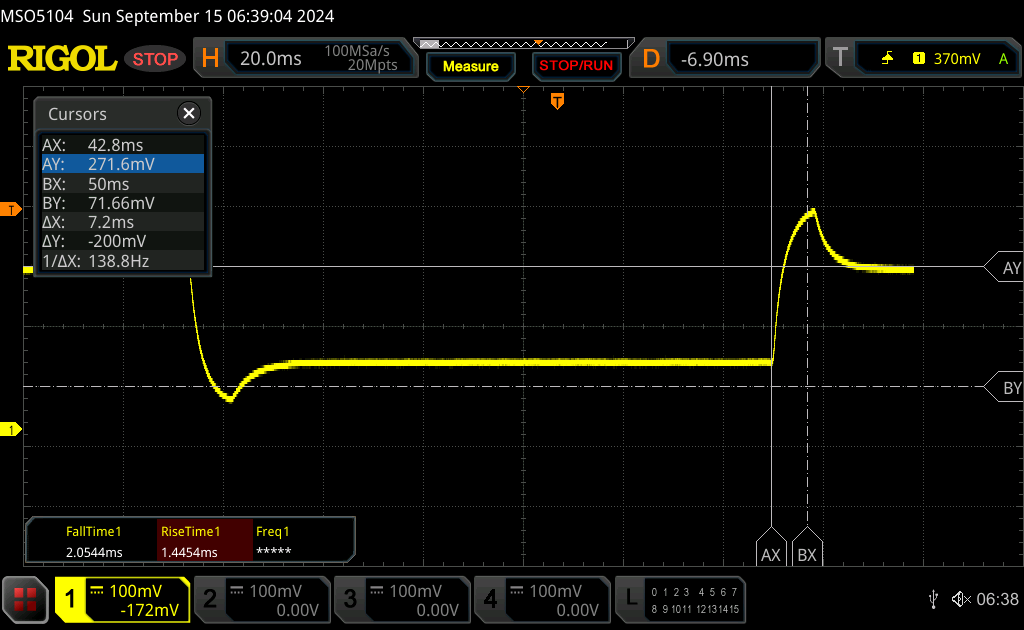 |
| ↘ 6.4 ms upadek | ||
| W naszych testach ekran wykazuje dobry współczynnik reakcji, ale może być zbyt wolny dla graczy rywalizujących ze sobą. Dla porównania, wszystkie testowane urządzenia wahają się od 0.165 (minimum) do 636 (maksimum) ms. » 24 % wszystkich urządzeń jest lepszych. Oznacza to, że zmierzony czas reakcji jest lepszy od średniej wszystkich testowanych urządzeń (32.5 ms). | ||
Migotanie ekranu / PWM (modulacja szerokości impulsu)
| Migotanie ekranu/nie wykryto PWM | 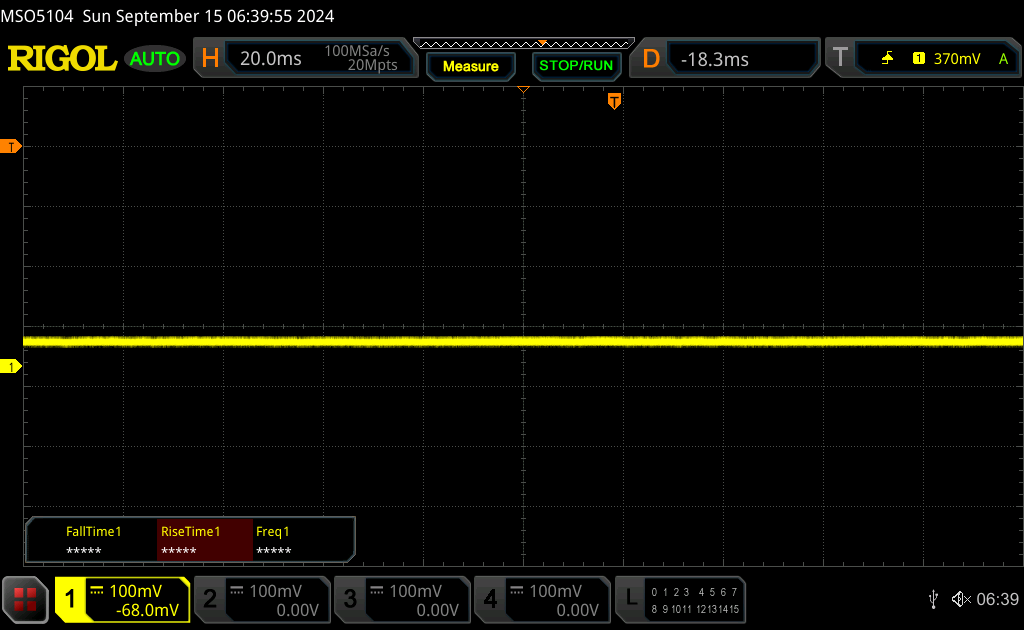 | ||
Dla porównania: 53 % wszystkich testowanych urządzeń nie używa PWM do przyciemniania wyświetlacza. Jeśli wykryto PWM, zmierzono średnio 8516 (minimum: 5 - maksimum: 343500) Hz. | |||
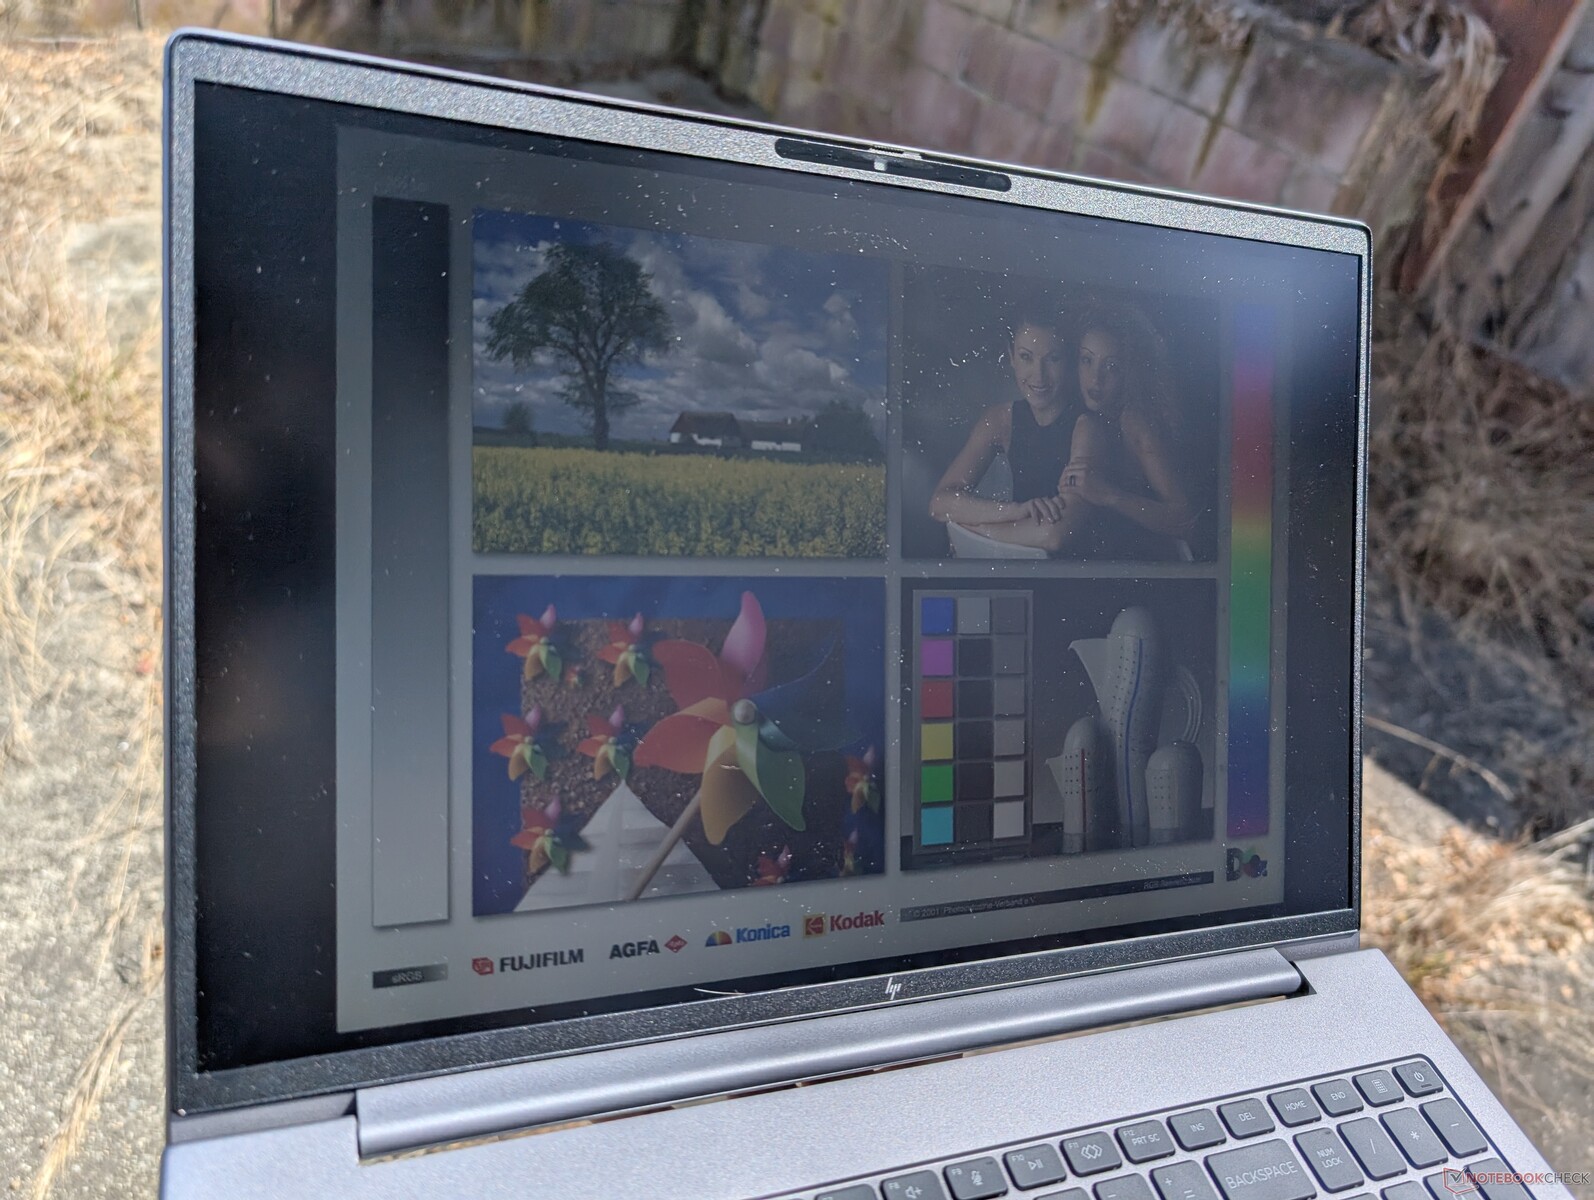
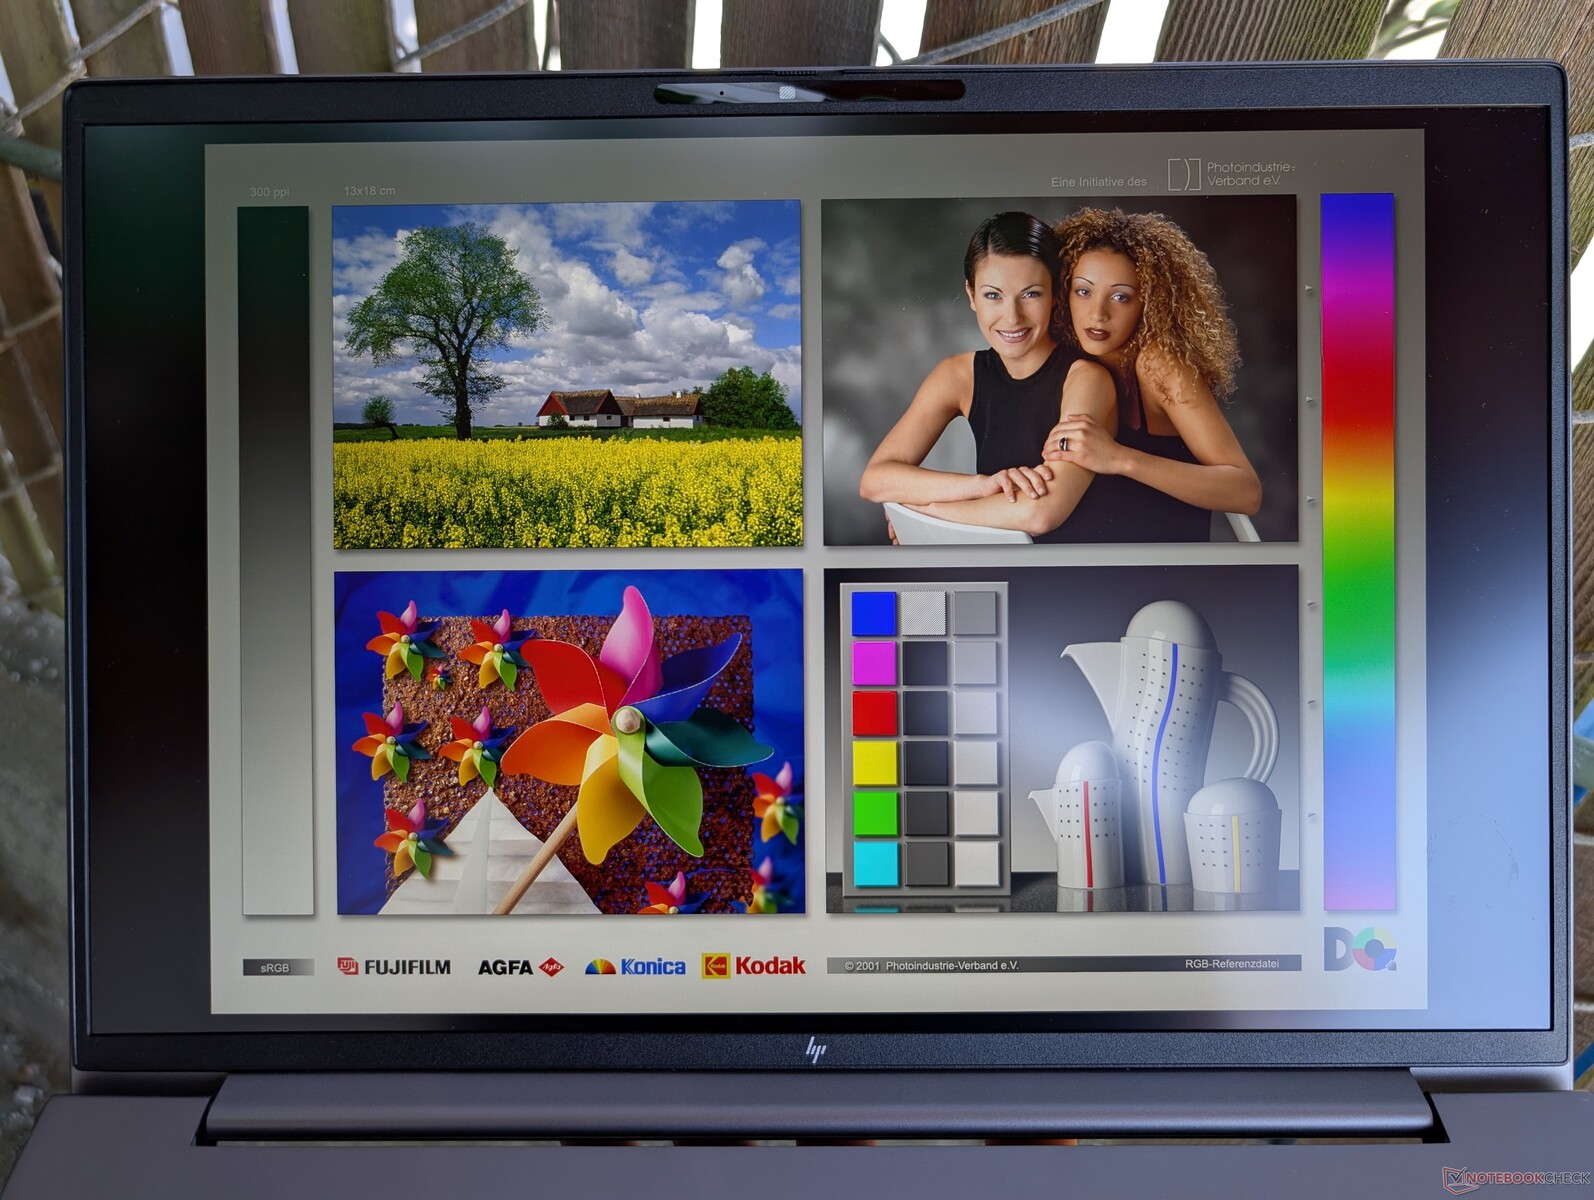
Widoczność na zewnątrz jest przyzwoita w cieniu z naszym panelem 1600p, ale opcje z niższej półki będą ciemniejsze i bardziej podatne na odblaski. Opcja 1000 nitów powinna być brana pod uwagę w przypadku częstego przebywania na zewnątrz.
Wydajność - Nowy Zen 4, ta sama wydajność Zen 4
Warunki testowania
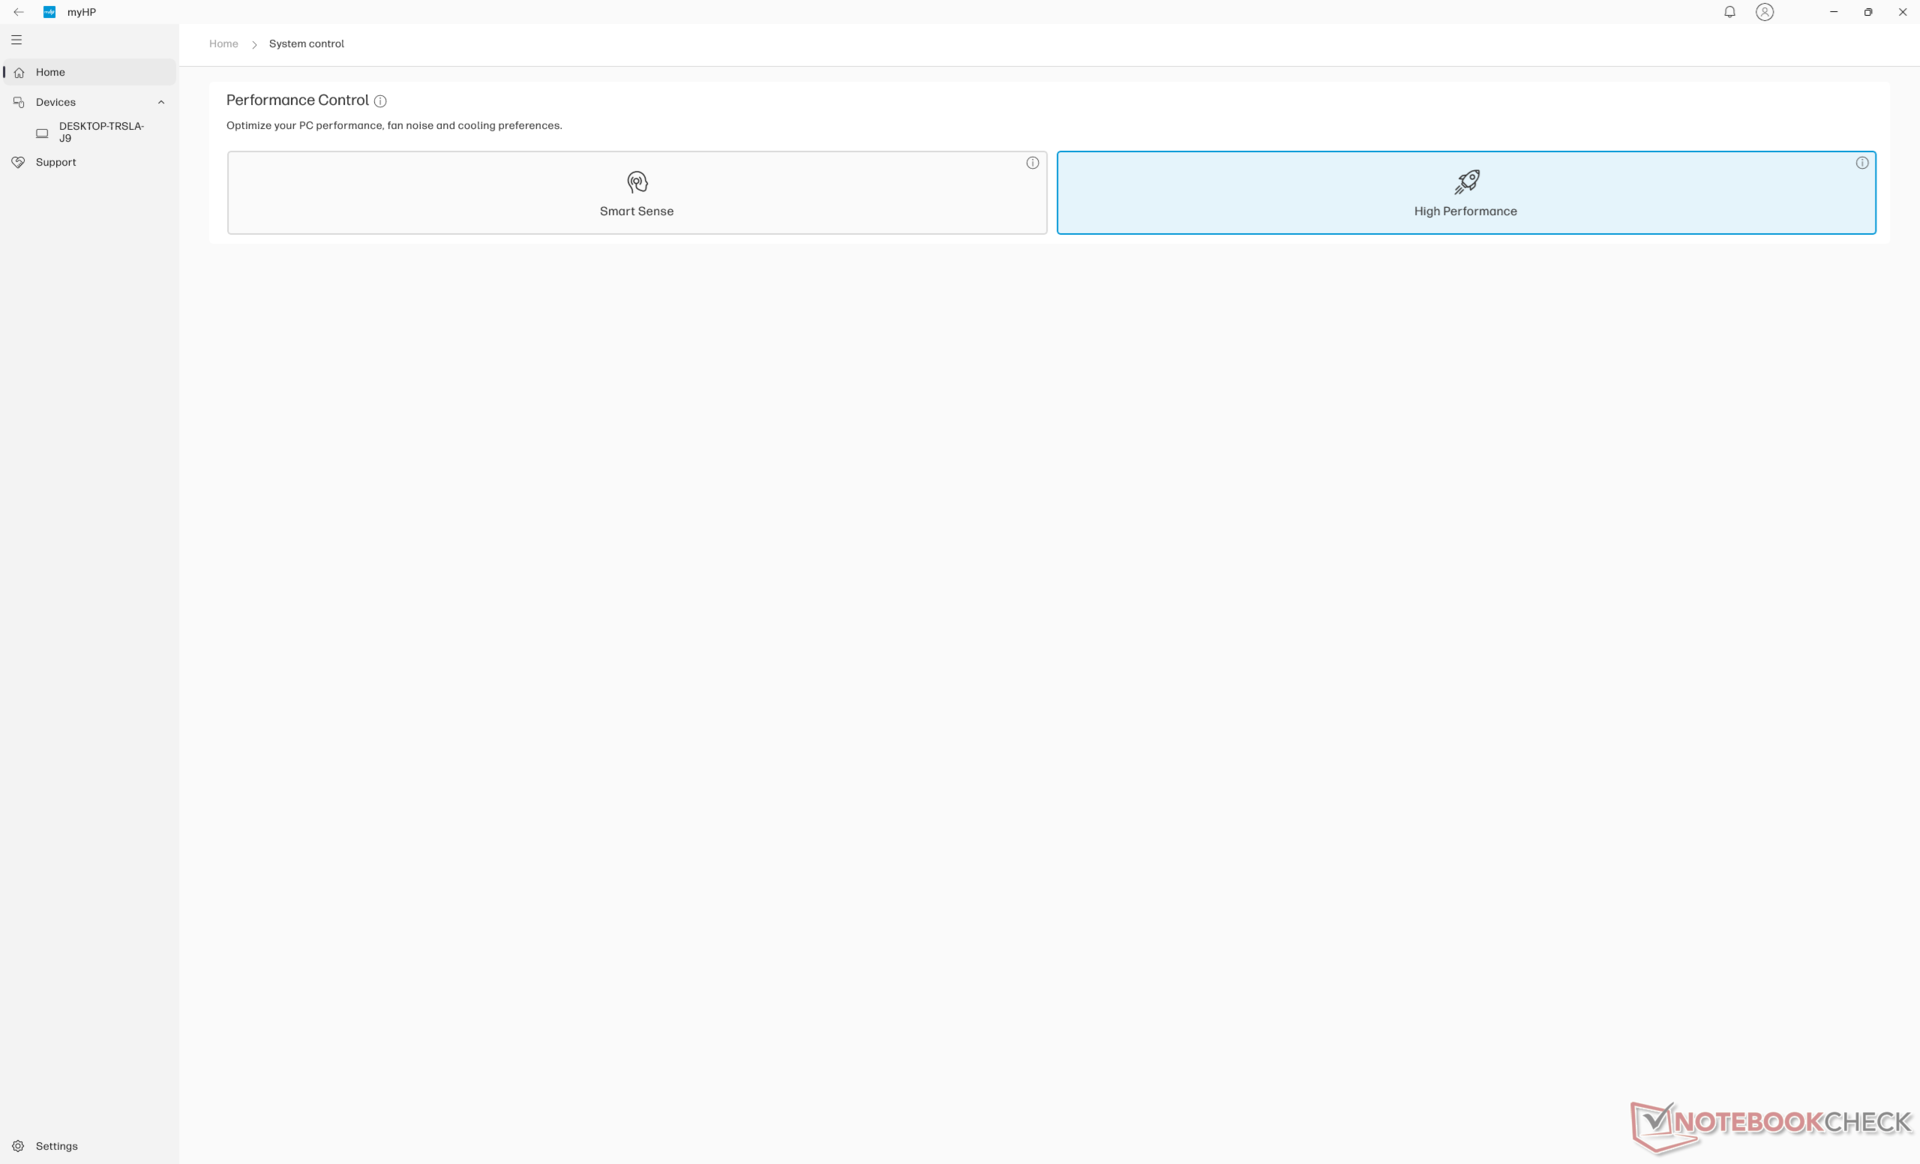
Przed wykonaniem poniższych testów ustawiliśmy zarówno system Windows, jak i MyHP w tryb wydajności. Optimus 1.0 jest obsługiwany.
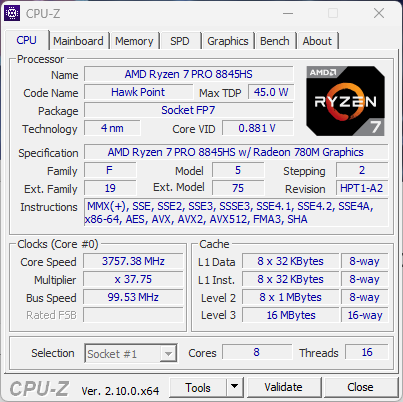
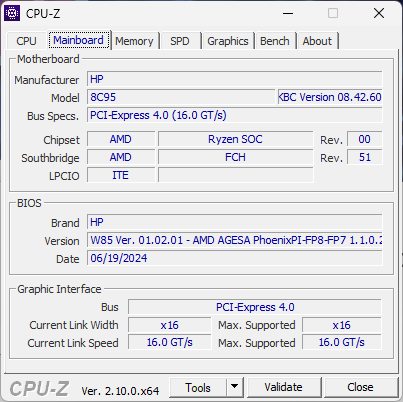
Procesor
Ryzen Ryzen 7 8845HS nie oferuje zbyt wiele w porównaniu do Ryzen 7 7840HS który zastępuje w zeszłorocznym ZBook Power 15 G10. W rzeczywistości, testy porównawcze wykazały, że oba procesory są identyczne o zaledwie kilka punktów procentowych. Może to być rozczarowujące dla zaawansowanych użytkowników, którzy oczekiwali bardziej znaczącego wzrostu wydajności przy przejściu z 15 na 16 cali. Szybsze opcje Raptor Lake-HX są dostępne tylko w grubszej serii HP ZBook Fury.
Główną przewagą Ryzena 7 8845HS nad Ryzenem 7 7840HS jest akceleracja sztucznej inteligencji dzięki zintegrowanej jednostce NPU. Co-Pilot+ jest jednak niekompatybilny z procesorami Hawk Point, więc praktyczność NPU jest bardzo ograniczona na tej maszynie.
Przejście na Ryzen 5 8645HS zmniejszy wydajność o 25 do 30 procent, podczas gdy aktualizacja do modelu Ryzen 9 8945HS poprawi wydajność o zaledwie 5 procent.
Cinebench R15 Multi Loop
Cinebench R23: Multi Core | Single Core
Cinebench R20: CPU (Multi Core) | CPU (Single Core)
Cinebench R15: CPU Multi 64Bit | CPU Single 64Bit
Blender: v2.79 BMW27 CPU
7-Zip 18.03: 7z b 4 | 7z b 4 -mmt1
Geekbench 6.4: Multi-Core | Single-Core
Geekbench 5.5: Multi-Core | Single-Core
HWBOT x265 Benchmark v2.2: 4k Preset
LibreOffice : 20 Documents To PDF
R Benchmark 2.5: Overall mean
| CPU Performance Rating | |
| HP ZBook Fury 16 G11 | |
| Asus ExpertBook B6 Flip B6602FC2 -2! | |
| Dell Precision 5690 | |
| HP ZBook Fury 16 G9 -2! | |
| HP ZBook Power 15 G10 | |
| Przeciętny AMD Ryzen 7 8845HS | |
| HP ZBook Power 16 G11 A | |
| Dell Precision 5000 5490 | |
| MSI CreatorPro Z16P B12UKST -2! | |
| Lenovo ThinkPad P16v G1 AMD | |
| Lenovo ThinkPad P16s G2 21K9000CGE | |
| Lenovo ThinkPad P1 G4-20Y4Z9DVUS -2! | |
| HP ZBook Firefly 16 G9-6B897EA -2! | |
| Cinebench R23 / Multi Core | |
| HP ZBook Fury 16 G11 | |
| Asus ExpertBook B6 Flip B6602FC2 | |
| Dell Precision 5690 | |
| HP ZBook Fury 16 G9 | |
| MSI CreatorPro Z16P B12UKST | |
| Dell Precision 5000 5490 | |
| Przeciętny AMD Ryzen 7 8845HS (14895 - 18037, n=12) | |
| HP ZBook Power 16 G11 A | |
| HP ZBook Power 15 G10 | |
| Lenovo ThinkPad P16s G2 21K9000CGE | |
| Lenovo ThinkPad P16v G1 AMD | |
| Lenovo ThinkPad P1 G4-20Y4Z9DVUS | |
| HP ZBook Firefly 16 G9-6B897EA | |
| Cinebench R23 / Single Core | |
| HP ZBook Fury 16 G11 | |
| HP ZBook Fury 16 G9 | |
| Asus ExpertBook B6 Flip B6602FC2 | |
| Dell Precision 5690 | |
| HP ZBook Power 15 G10 | |
| Dell Precision 5000 5490 | |
| HP ZBook Power 16 G11 A | |
| Przeciętny AMD Ryzen 7 8845HS (1623 - 1783, n=12) | |
| MSI CreatorPro Z16P B12UKST | |
| Lenovo ThinkPad P16s G2 21K9000CGE | |
| Lenovo ThinkPad P16v G1 AMD | |
| Lenovo ThinkPad P1 G4-20Y4Z9DVUS | |
| HP ZBook Firefly 16 G9-6B897EA | |
| Cinebench R20 / CPU (Multi Core) | |
| HP ZBook Fury 16 G11 | |
| Asus ExpertBook B6 Flip B6602FC2 | |
| Dell Precision 5690 | |
| HP ZBook Fury 16 G9 | |
| MSI CreatorPro Z16P B12UKST | |
| Dell Precision 5000 5490 | |
| HP ZBook Power 16 G11 A | |
| Przeciętny AMD Ryzen 7 8845HS (5808 - 7026, n=12) | |
| HP ZBook Power 15 G10 | |
| Lenovo ThinkPad P16s G2 21K9000CGE | |
| Lenovo ThinkPad P16v G1 AMD | |
| Lenovo ThinkPad P1 G4-20Y4Z9DVUS | |
| HP ZBook Firefly 16 G9-6B897EA | |
| Cinebench R20 / CPU (Single Core) | |
| HP ZBook Fury 16 G11 | |
| HP ZBook Fury 16 G9 | |
| Asus ExpertBook B6 Flip B6602FC2 | |
| Dell Precision 5690 | |
| HP ZBook Power 15 G10 | |
| Przeciętny AMD Ryzen 7 8845HS (673 - 698, n=12) | |
| HP ZBook Power 16 G11 A | |
| Dell Precision 5000 5490 | |
| MSI CreatorPro Z16P B12UKST | |
| Lenovo ThinkPad P16s G2 21K9000CGE | |
| Lenovo ThinkPad P16v G1 AMD | |
| Lenovo ThinkPad P1 G4-20Y4Z9DVUS | |
| HP ZBook Firefly 16 G9-6B897EA | |
| Cinebench R15 / CPU Multi 64Bit | |
| HP ZBook Fury 16 G11 | |
| Asus ExpertBook B6 Flip B6602FC2 | |
| Dell Precision 5690 | |
| Dell Precision 5000 5490 | |
| HP ZBook Power 16 G11 A | |
| Przeciętny AMD Ryzen 7 8845HS (2342 - 2908, n=12) | |
| HP ZBook Power 15 G10 | |
| HP ZBook Fury 16 G9 | |
| Lenovo ThinkPad P16s G2 21K9000CGE | |
| Lenovo ThinkPad P16v G1 AMD | |
| MSI CreatorPro Z16P B12UKST | |
| Lenovo ThinkPad P1 G4-20Y4Z9DVUS | |
| HP ZBook Firefly 16 G9-6B897EA | |
| Cinebench R15 / CPU Single 64Bit | |
| HP ZBook Fury 16 G11 | |
| HP ZBook Power 15 G10 | |
| Przeciętny AMD Ryzen 7 8845HS (269 - 283, n=12) | |
| HP ZBook Power 16 G11 A | |
| Asus ExpertBook B6 Flip B6602FC2 | |
| Dell Precision 5690 | |
| Lenovo ThinkPad P16s G2 21K9000CGE | |
| Lenovo ThinkPad P16v G1 AMD | |
| Dell Precision 5000 5490 | |
| MSI CreatorPro Z16P B12UKST | |
| Lenovo ThinkPad P1 G4-20Y4Z9DVUS | |
| HP ZBook Firefly 16 G9-6B897EA | |
| HP ZBook Fury 16 G9 | |
| Blender / v2.79 BMW27 CPU | |
| HP ZBook Firefly 16 G9-6B897EA | |
| Lenovo ThinkPad P1 G4-20Y4Z9DVUS | |
| Lenovo ThinkPad P16s G2 21K9000CGE | |
| Dell Precision 5690 | |
| HP ZBook Power 16 G11 A | |
| Lenovo ThinkPad P16v G1 AMD | |
| Dell Precision 5000 5490 | |
| Przeciętny AMD Ryzen 7 8845HS (179 - 216, n=12) | |
| MSI CreatorPro Z16P B12UKST | |
| HP ZBook Power 15 G10 | |
| Asus ExpertBook B6 Flip B6602FC2 | |
| HP ZBook Fury 16 G9 | |
| HP ZBook Fury 16 G11 | |
| 7-Zip 18.03 / 7z b 4 | |
| HP ZBook Fury 16 G11 | |
| HP ZBook Fury 16 G9 | |
| Dell Precision 5690 | |
| Asus ExpertBook B6 Flip B6602FC2 | |
| HP ZBook Power 15 G10 | |
| Przeciętny AMD Ryzen 7 8845HS (62669 - 74664, n=12) | |
| Dell Precision 5000 5490 | |
| HP ZBook Power 16 G11 A | |
| MSI CreatorPro Z16P B12UKST | |
| Lenovo ThinkPad P16v G1 AMD | |
| Lenovo ThinkPad P16s G2 21K9000CGE | |
| Lenovo ThinkPad P1 G4-20Y4Z9DVUS | |
| HP ZBook Firefly 16 G9-6B897EA | |
| 7-Zip 18.03 / 7z b 4 -mmt1 | |
| HP ZBook Fury 16 G11 | |
| Lenovo ThinkPad P16v G1 AMD | |
| HP ZBook Power 15 G10 | |
| HP ZBook Power 16 G11 A | |
| Przeciętny AMD Ryzen 7 8845HS (5197 - 6714, n=12) | |
| Asus ExpertBook B6 Flip B6602FC2 | |
| HP ZBook Fury 16 G9 | |
| Lenovo ThinkPad P16s G2 21K9000CGE | |
| MSI CreatorPro Z16P B12UKST | |
| Lenovo ThinkPad P1 G4-20Y4Z9DVUS | |
| Dell Precision 5000 5490 | |
| Dell Precision 5690 | |
| HP ZBook Firefly 16 G9-6B897EA | |
| Geekbench 6.4 / Multi-Core | |
| HP ZBook Fury 16 G11 | |
| Dell Precision 5690 | |
| Dell Precision 5000 5490 | |
| HP ZBook Power 15 G10 | |
| Przeciętny AMD Ryzen 7 8845HS (11073 - 14014, n=16) | |
| HP ZBook Power 16 G11 A | |
| Lenovo ThinkPad P16s G2 21K9000CGE | |
| Lenovo ThinkPad P16v G1 AMD | |
| Geekbench 6.4 / Single-Core | |
| HP ZBook Fury 16 G11 | |
| HP ZBook Power 15 G10 | |
| Przeciętny AMD Ryzen 7 8845HS (2510 - 2698, n=14) | |
| HP ZBook Power 16 G11 A | |
| Lenovo ThinkPad P16v G1 AMD | |
| Dell Precision 5690 | |
| Lenovo ThinkPad P16s G2 21K9000CGE | |
| Dell Precision 5000 5490 | |
| Geekbench 5.5 / Multi-Core | |
| HP ZBook Fury 16 G11 | |
| Asus ExpertBook B6 Flip B6602FC2 | |
| Dell Precision 5690 | |
| HP ZBook Fury 16 G9 | |
| Dell Precision 5000 5490 | |
| MSI CreatorPro Z16P B12UKST | |
| HP ZBook Power 15 G10 | |
| Przeciętny AMD Ryzen 7 8845HS (11256 - 12726, n=13) | |
| HP ZBook Power 16 G11 A | |
| Lenovo ThinkPad P16s G2 21K9000CGE | |
| Lenovo ThinkPad P16v G1 AMD | |
| Lenovo ThinkPad P1 G4-20Y4Z9DVUS | |
| HP ZBook Firefly 16 G9-6B897EA | |
| Geekbench 5.5 / Single-Core | |
| HP ZBook Fury 16 G11 | |
| HP ZBook Power 15 G10 | |
| HP ZBook Fury 16 G9 | |
| Przeciętny AMD Ryzen 7 8845HS (1765 - 2004, n=13) | |
| HP ZBook Power 16 G11 A | |
| Asus ExpertBook B6 Flip B6602FC2 | |
| Dell Precision 5690 | |
| Lenovo ThinkPad P16v G1 AMD | |
| HP ZBook Firefly 16 G9-6B897EA | |
| MSI CreatorPro Z16P B12UKST | |
| Dell Precision 5000 5490 | |
| Lenovo ThinkPad P16s G2 21K9000CGE | |
| Lenovo ThinkPad P1 G4-20Y4Z9DVUS | |
| HWBOT x265 Benchmark v2.2 / 4k Preset | |
| HP ZBook Fury 16 G11 | |
| Dell Precision 5690 | |
| Asus ExpertBook B6 Flip B6602FC2 | |
| Przeciętny AMD Ryzen 7 8845HS (18.6 - 22.7, n=12) | |
| HP ZBook Power 15 G10 | |
| HP ZBook Fury 16 G9 | |
| HP ZBook Power 16 G11 A | |
| MSI CreatorPro Z16P B12UKST | |
| Lenovo ThinkPad P16v G1 AMD | |
| Lenovo ThinkPad P16s G2 21K9000CGE | |
| Dell Precision 5000 5490 | |
| Lenovo ThinkPad P1 G4-20Y4Z9DVUS | |
| HP ZBook Firefly 16 G9-6B897EA | |
| LibreOffice / 20 Documents To PDF | |
| HP ZBook Power 15 G10 | |
| HP ZBook Firefly 16 G9-6B897EA | |
| Lenovo ThinkPad P16s G2 21K9000CGE | |
| HP ZBook Power 16 G11 A | |
| Przeciętny AMD Ryzen 7 8845HS (44.4 - 77, n=12) | |
| Lenovo ThinkPad P1 G4-20Y4Z9DVUS | |
| HP ZBook Fury 16 G11 | |
| Lenovo ThinkPad P16v G1 AMD | |
| Dell Precision 5000 5490 | |
| Asus ExpertBook B6 Flip B6602FC2 | |
| Dell Precision 5690 | |
| MSI CreatorPro Z16P B12UKST | |
| HP ZBook Fury 16 G9 | |
| R Benchmark 2.5 / Overall mean | |
| Lenovo ThinkPad P1 G4-20Y4Z9DVUS | |
| HP ZBook Firefly 16 G9-6B897EA | |
| Dell Precision 5000 5490 | |
| Lenovo ThinkPad P16s G2 21K9000CGE | |
| Dell Precision 5690 | |
| MSI CreatorPro Z16P B12UKST | |
| Przeciętny AMD Ryzen 7 8845HS (0.4304 - 0.4935, n=12) | |
| Asus ExpertBook B6 Flip B6602FC2 | |
| HP ZBook Power 15 G10 | |
| HP ZBook Power 16 G11 A | |
| Lenovo ThinkPad P16v G1 AMD | |
| HP ZBook Fury 16 G9 | |
| HP ZBook Fury 16 G11 | |
Cinebench R23: Multi Core | Single Core
Cinebench R20: CPU (Multi Core) | CPU (Single Core)
Cinebench R15: CPU Multi 64Bit | CPU Single 64Bit
Blender: v2.79 BMW27 CPU
7-Zip 18.03: 7z b 4 | 7z b 4 -mmt1
Geekbench 6.4: Multi-Core | Single-Core
Geekbench 5.5: Multi-Core | Single-Core
HWBOT x265 Benchmark v2.2: 4k Preset
LibreOffice : 20 Documents To PDF
R Benchmark 2.5: Overall mean
* ... im mniej tym lepiej
AIDA64: FP32 Ray-Trace | FPU Julia | CPU SHA3 | CPU Queen | FPU SinJulia | FPU Mandel | CPU AES | CPU ZLib | FP64 Ray-Trace | CPU PhotoWorxx
| Performance Rating | |
| Przeciętny AMD Ryzen 7 8845HS | |
| HP ZBook Power 15 G10 | |
| HP ZBook Power 16 G11 A | |
| HP ZBook Fury 16 G11 | |
| Lenovo ThinkPad P16s G2 21K9000CGE | |
| Dell Precision 5690 | |
| Lenovo ThinkPad P1 Gen 7 21KV001SGE | |
| AIDA64 / FP32 Ray-Trace | |
| Przeciętny AMD Ryzen 7 8845HS (23708 - 29544, n=12) | |
| HP ZBook Power 15 G10 | |
| HP ZBook Power 16 G11 A | |
| Lenovo ThinkPad P16s G2 21K9000CGE | |
| HP ZBook Fury 16 G11 | |
| Dell Precision 5690 | |
| Lenovo ThinkPad P1 Gen 7 21KV001SGE | |
| AIDA64 / FPU Julia | |
| HP ZBook Power 16 G11 A | |
| Przeciętny AMD Ryzen 7 8845HS (99659 - 125873, n=12) | |
| HP ZBook Power 15 G10 | |
| HP ZBook Fury 16 G11 | |
| Lenovo ThinkPad P16s G2 21K9000CGE | |
| Dell Precision 5690 | |
| Lenovo ThinkPad P1 Gen 7 21KV001SGE | |
| AIDA64 / CPU SHA3 | |
| HP ZBook Fury 16 G11 | |
| HP ZBook Power 16 G11 A | |
| Przeciętny AMD Ryzen 7 8845HS (4332 - 5180, n=12) | |
| HP ZBook Power 15 G10 | |
| Lenovo ThinkPad P16s G2 21K9000CGE | |
| Dell Precision 5690 | |
| Lenovo ThinkPad P1 Gen 7 21KV001SGE | |
| AIDA64 / CPU Queen | |
| HP ZBook Fury 16 G11 | |
| HP ZBook Power 16 G11 A | |
| Przeciętny AMD Ryzen 7 8845HS (109458 - 124695, n=12) | |
| HP ZBook Power 15 G10 | |
| Lenovo ThinkPad P16s G2 21K9000CGE | |
| Dell Precision 5690 | |
| Lenovo ThinkPad P1 Gen 7 21KV001SGE | |
| AIDA64 / FPU SinJulia | |
| Przeciętny AMD Ryzen 7 8845HS (14062 - 15519, n=12) | |
| HP ZBook Power 15 G10 | |
| HP ZBook Power 16 G11 A | |
| Lenovo ThinkPad P16s G2 21K9000CGE | |
| HP ZBook Fury 16 G11 | |
| Dell Precision 5690 | |
| Lenovo ThinkPad P1 Gen 7 21KV001SGE | |
| AIDA64 / FPU Mandel | |
| Przeciętny AMD Ryzen 7 8845HS (53436 - 67367, n=12) | |
| HP ZBook Power 15 G10 | |
| HP ZBook Power 16 G11 A | |
| Lenovo ThinkPad P16s G2 21K9000CGE | |
| HP ZBook Fury 16 G11 | |
| Dell Precision 5690 | |
| Lenovo ThinkPad P1 Gen 7 21KV001SGE | |
| AIDA64 / CPU AES | |
| HP ZBook Fury 16 G11 | |
| Przeciętny AMD Ryzen 7 8845HS (64515 - 172642, n=12) | |
| Dell Precision 5690 | |
| HP ZBook Power 15 G10 | |
| Lenovo ThinkPad P1 Gen 7 21KV001SGE | |
| HP ZBook Power 16 G11 A | |
| Lenovo ThinkPad P16s G2 21K9000CGE | |
| AIDA64 / CPU ZLib | |
| HP ZBook Fury 16 G11 | |
| Dell Precision 5690 | |
| Lenovo ThinkPad P1 Gen 7 21KV001SGE | |
| HP ZBook Power 16 G11 A | |
| HP ZBook Power 15 G10 | |
| Lenovo ThinkPad P16s G2 21K9000CGE | |
| Przeciętny AMD Ryzen 7 8845HS (627 - 1080, n=12) | |
| AIDA64 / FP64 Ray-Trace | |
| HP ZBook Power 15 G10 | |
| Przeciętny AMD Ryzen 7 8845HS (12361 - 15911, n=12) | |
| HP ZBook Power 16 G11 A | |
| Lenovo ThinkPad P16s G2 21K9000CGE | |
| HP ZBook Fury 16 G11 | |
| Dell Precision 5690 | |
| Lenovo ThinkPad P1 Gen 7 21KV001SGE | |
| AIDA64 / CPU PhotoWorxx | |
| Dell Precision 5690 | |
| HP ZBook Power 15 G10 | |
| Lenovo ThinkPad P1 Gen 7 21KV001SGE | |
| HP ZBook Power 16 G11 A | |
| Przeciętny AMD Ryzen 7 8845HS (33192 - 41668, n=12) | |
| Lenovo ThinkPad P16s G2 21K9000CGE | |
| HP ZBook Fury 16 G11 | |
Test warunków skrajnych
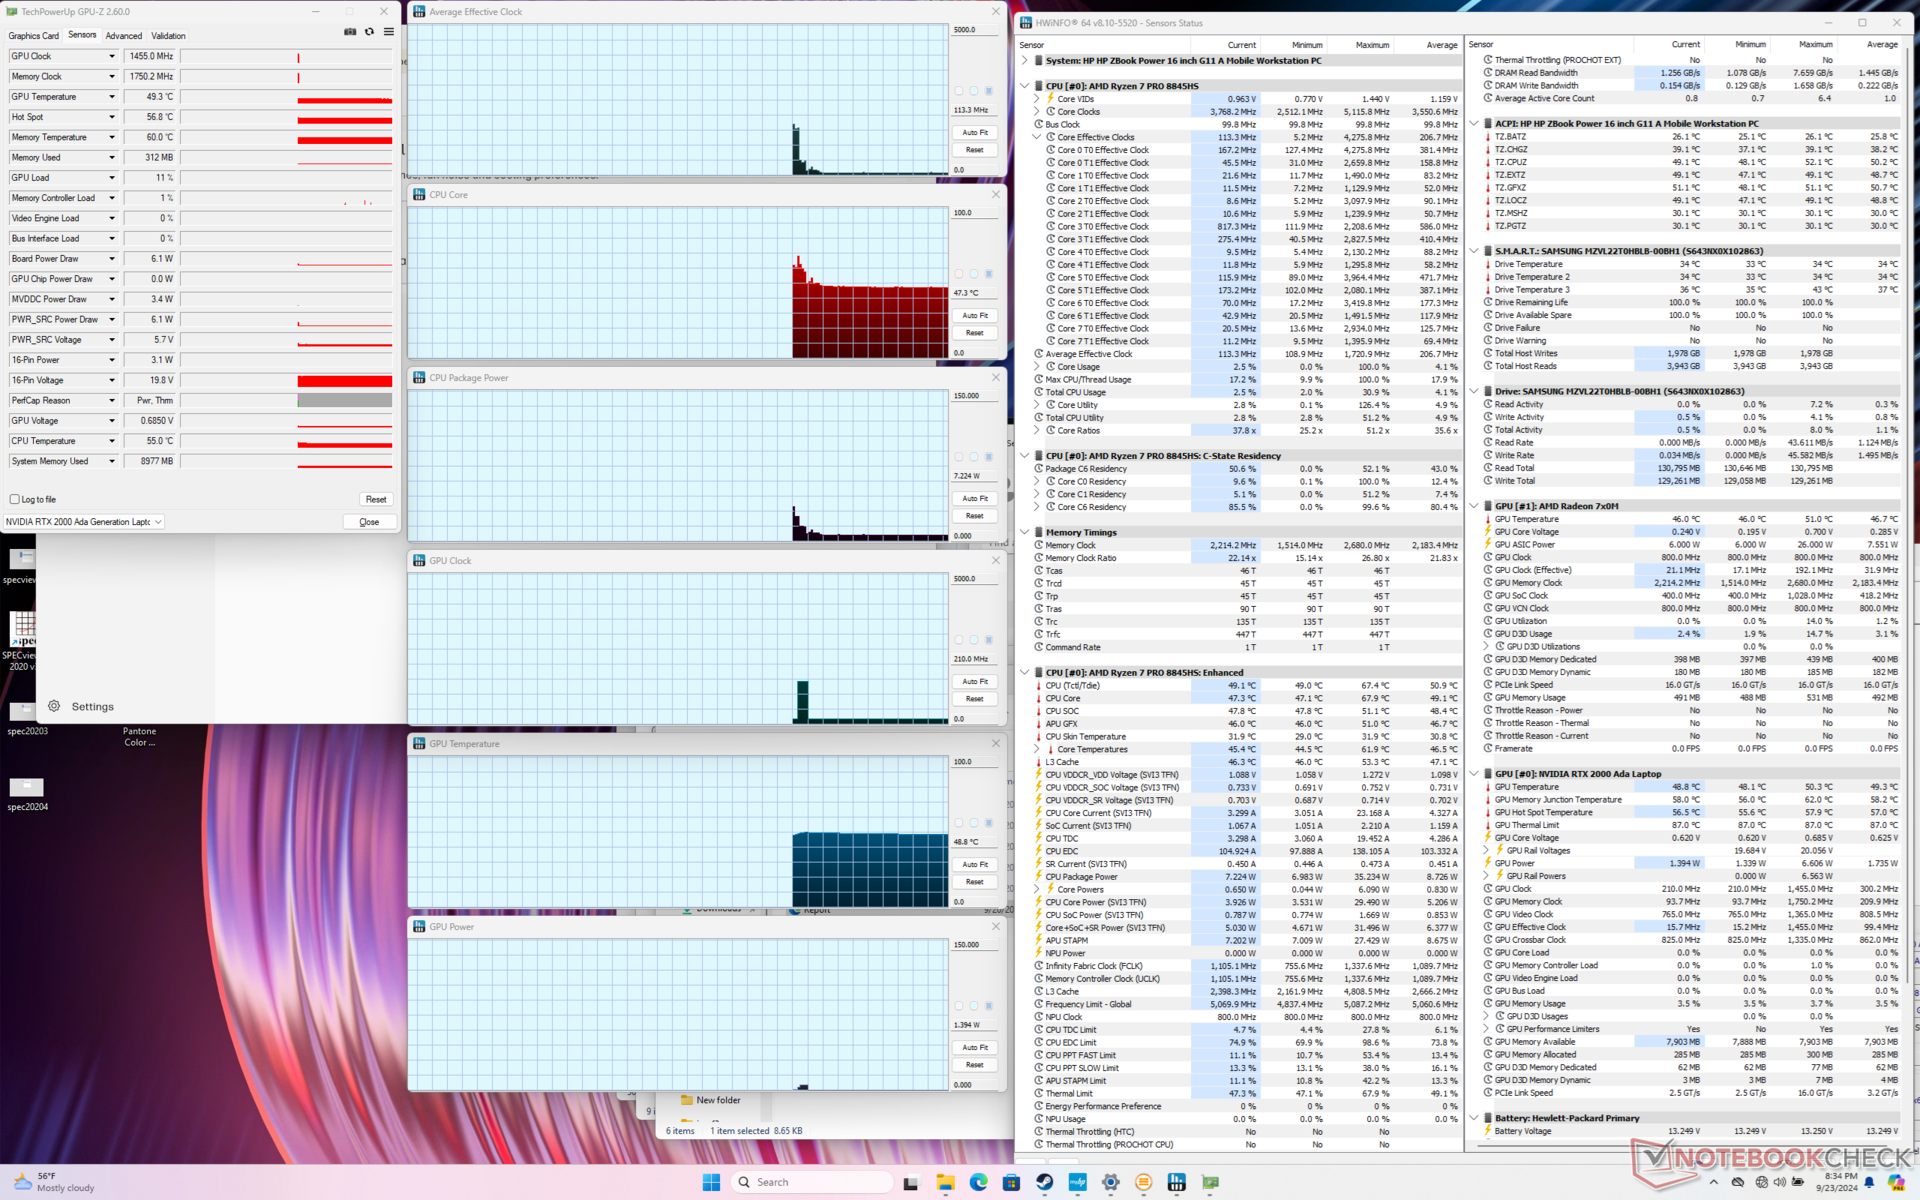
Procesor zwiększał taktowanie do 4,3 GHz, 65 W i 90 C podczas inicjowania stresu Prime95, po czym szybko spadał i stabilizował się na poziomie 3,8 GHz i 50 W, aby zapobiec wyższym temperaturom rdzenia. Wyniki są zbliżone do tego, co zaobserwowaliśmy na ZBook Power 15 G10, o ile nie są nieco cieplejsze o kilka stopni.
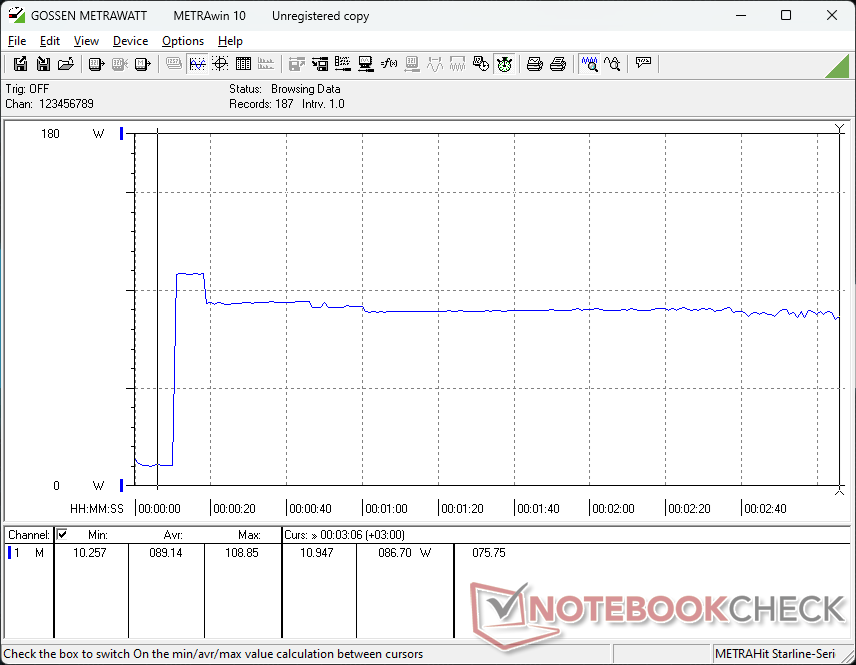
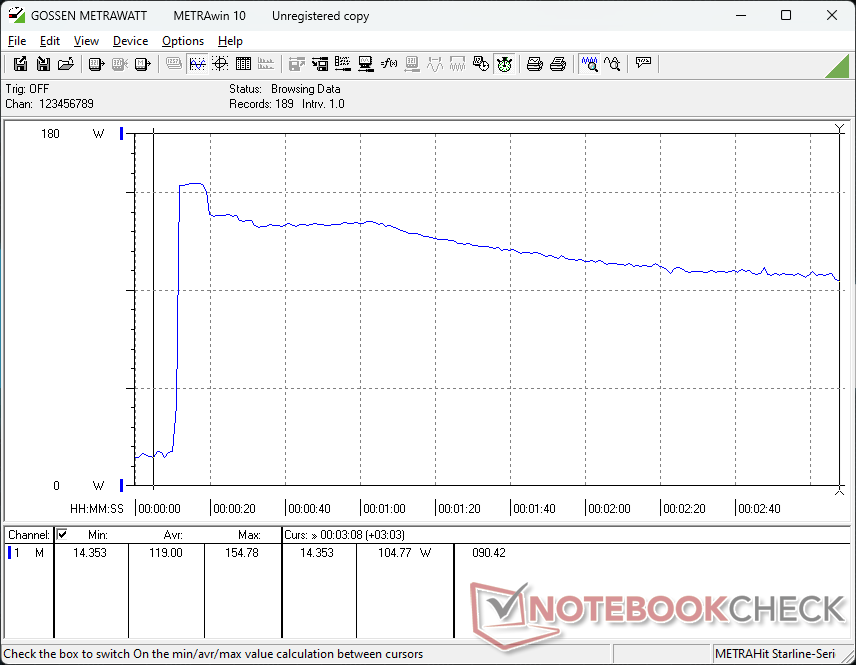
Co ciekawe, procesor jest mocniej dławiony do zaledwie 2,8 GHz podczas jednoczesnego uruchamiania Prime95 i FurMark, zamiast 3,8 GHz, jak w zeszłorocznym modelu. Zmiana ta prawdopodobnie miała na celu poprawę temperatury rdzenia; CPU stabilizuje się teraz na bardziej komfortowym poziomie 66 C zamiast 99 C w ZBook Power 15 G10.
Uruchomienie Cyberpunk 2077 w trybie zrównoważonym zamiast w trybie wydajnościowym skutkuje zarówno nieco niższymi temperaturami rdzenia, jak i nieco niższymi średnimi częstotliwościami taktowania, jak pokazano poniżej. Pobór mocy karty graficznej również spadł z 35 W do 30 W w porównaniu do reklamowanego maksimum 50 W.
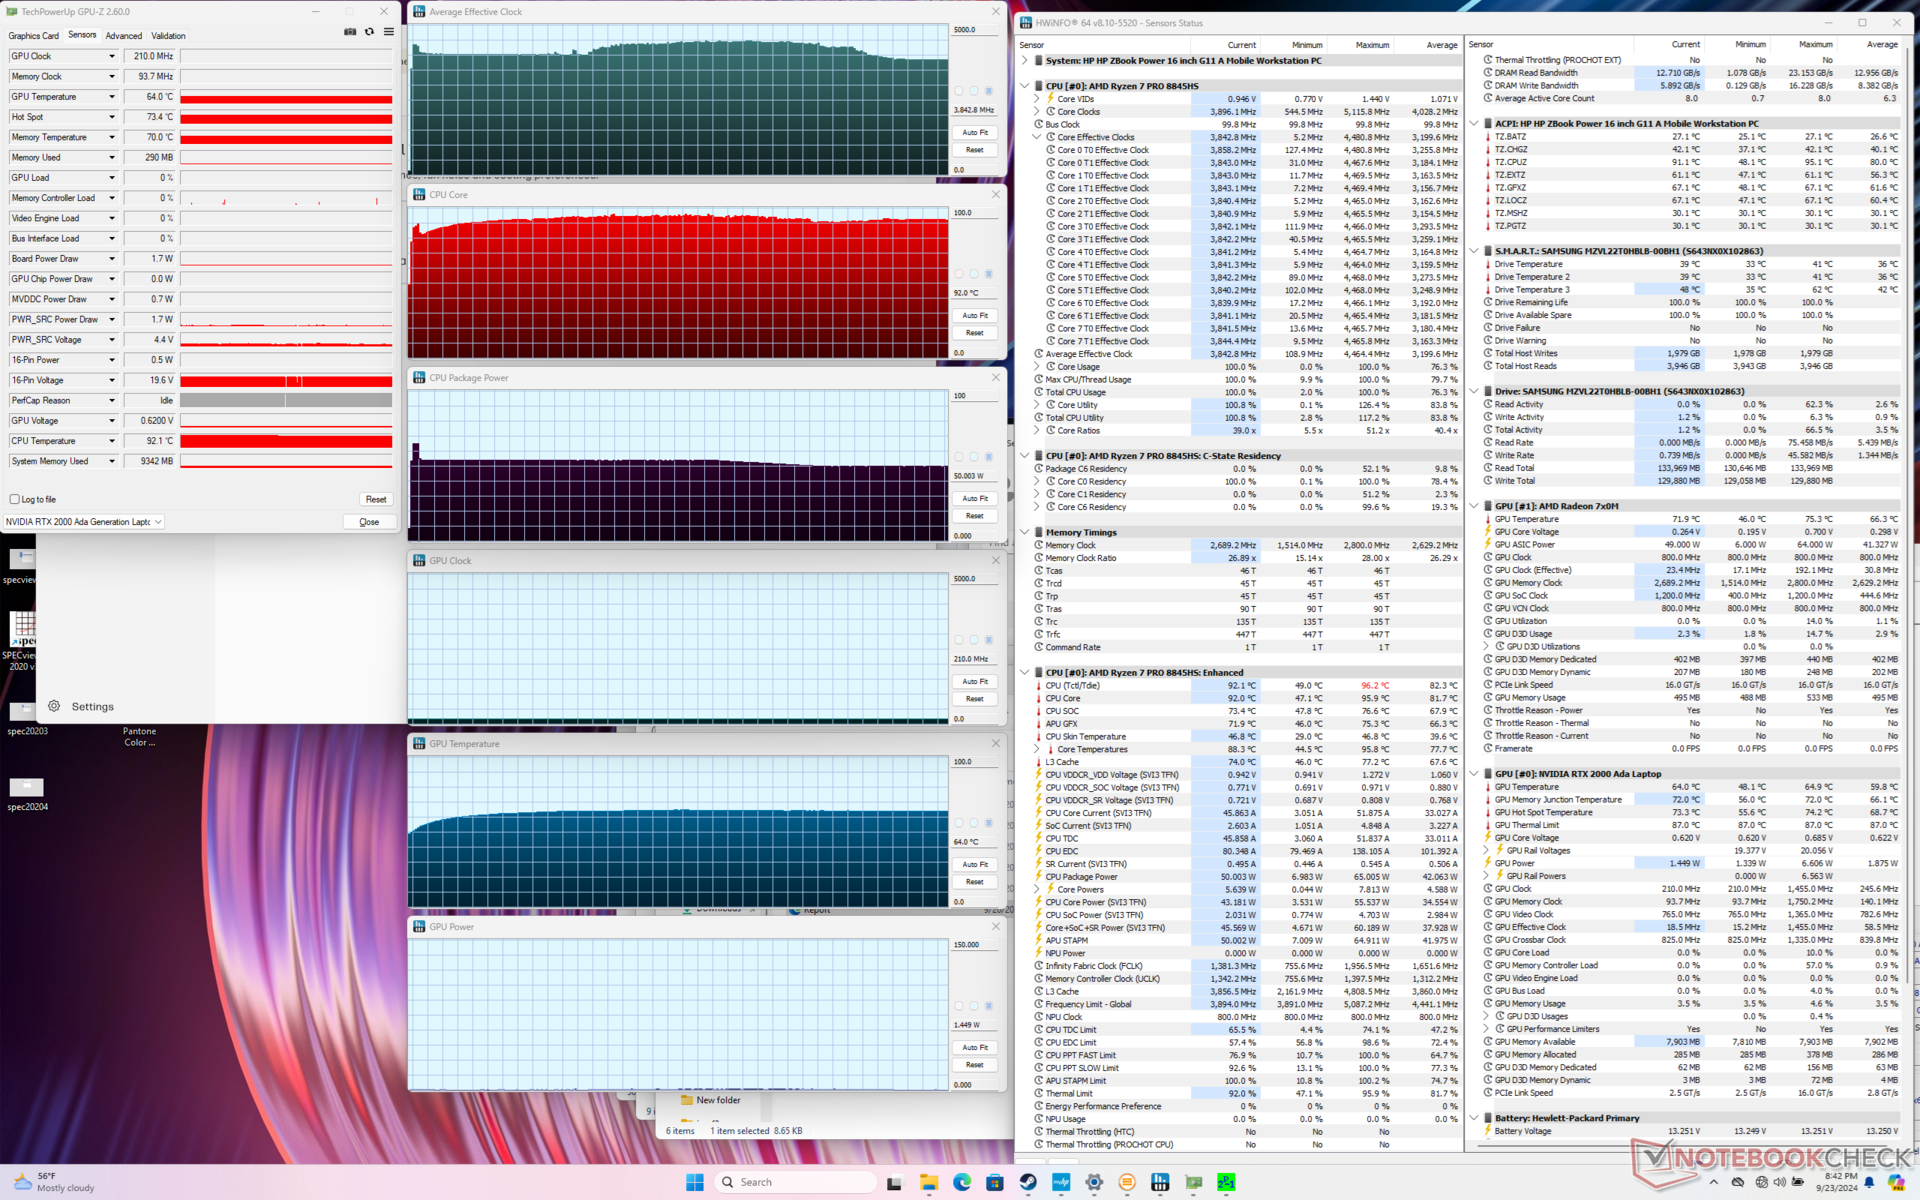
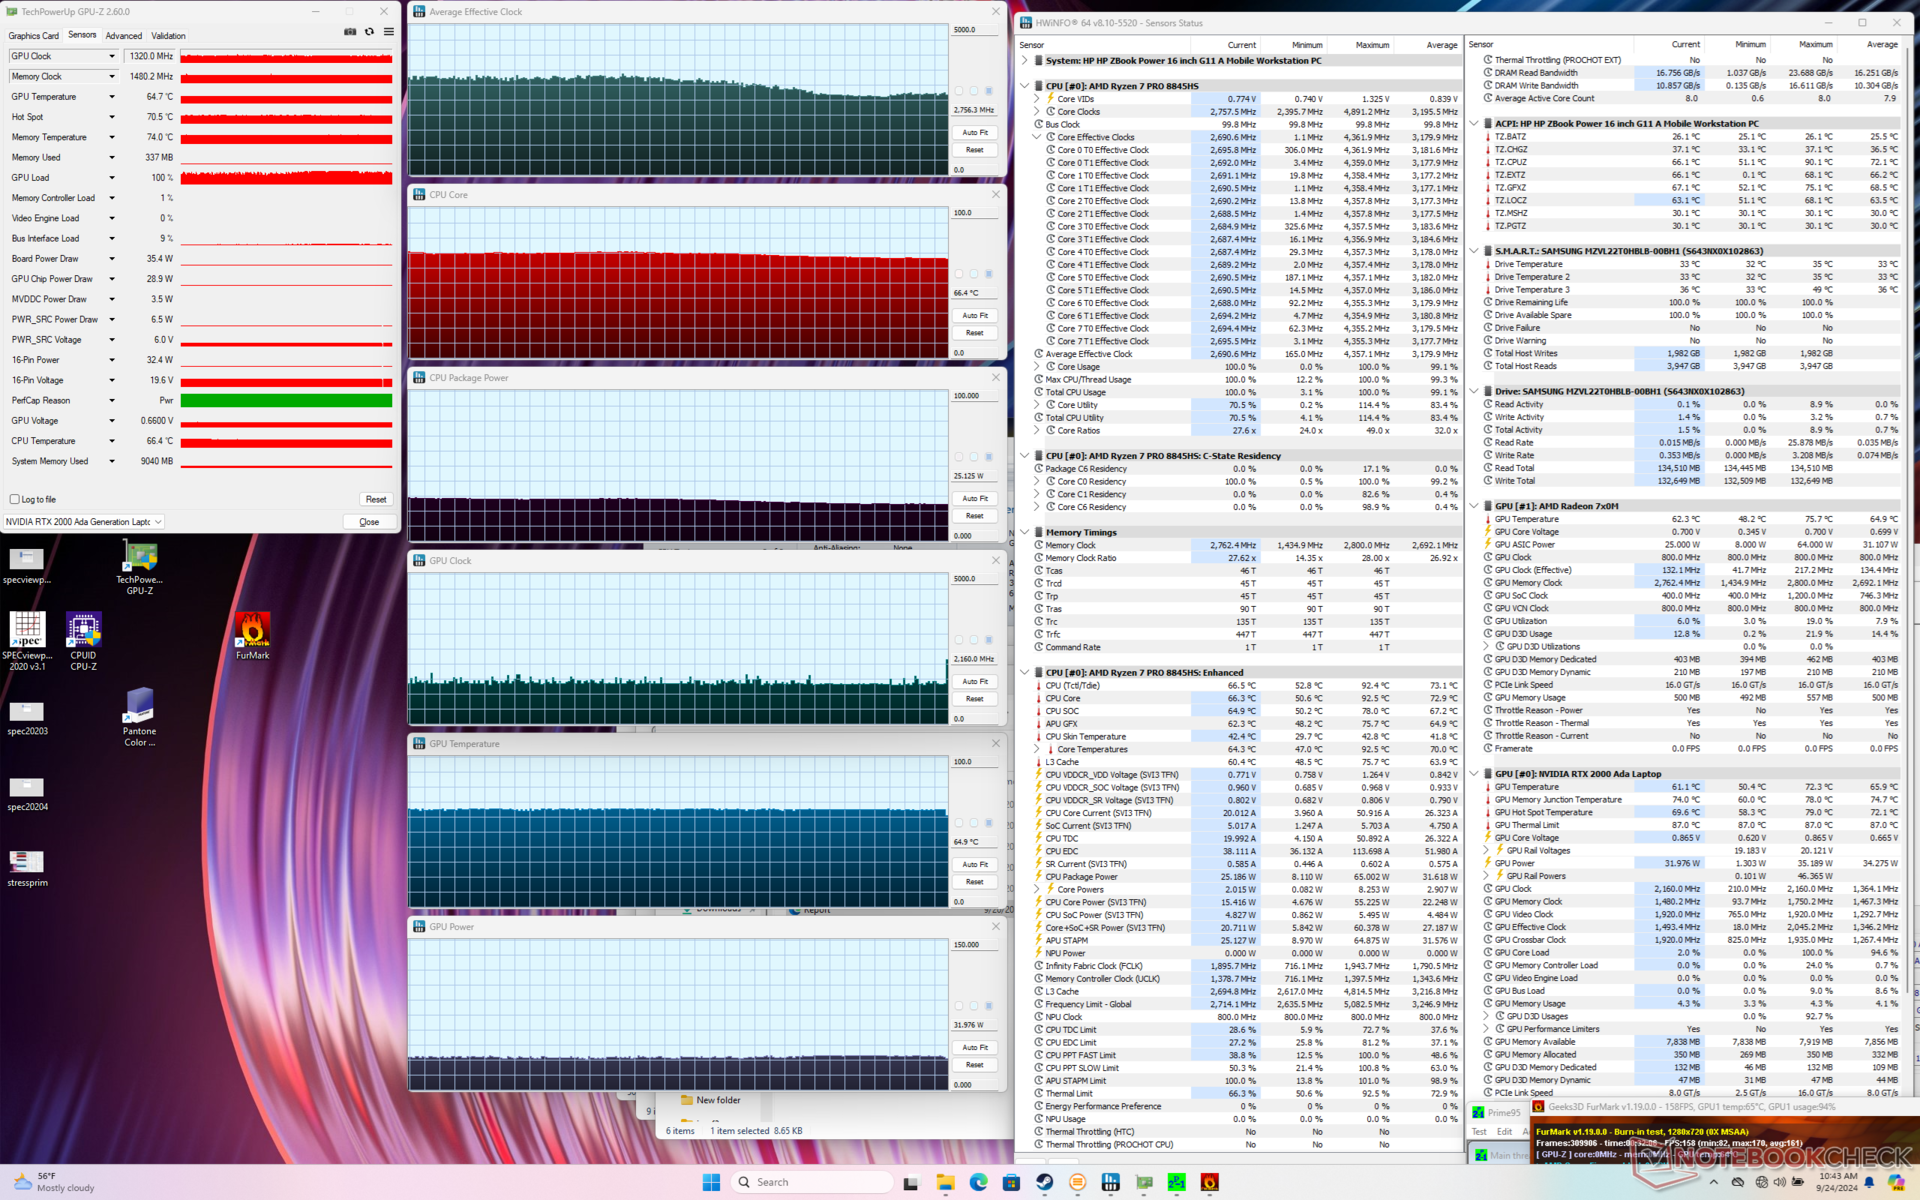
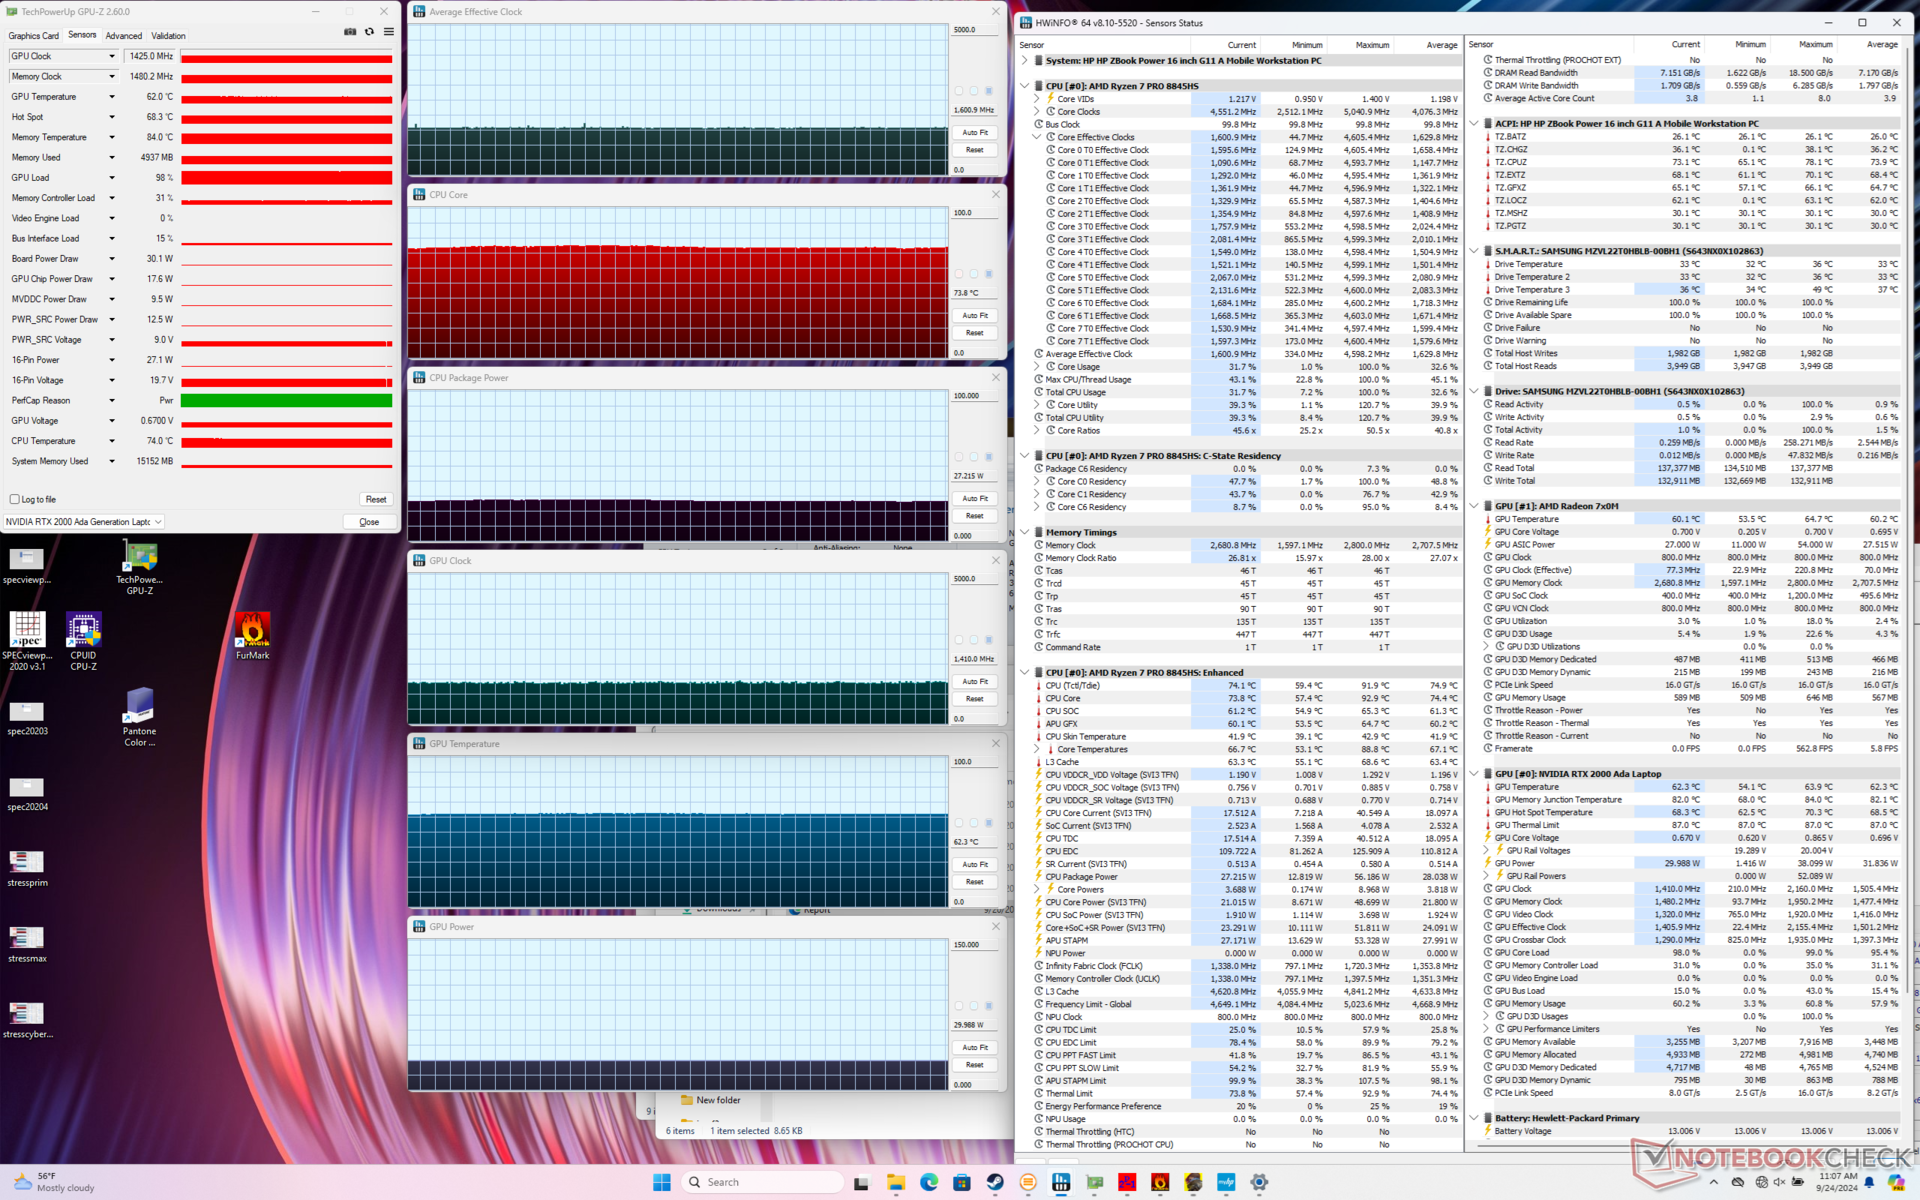
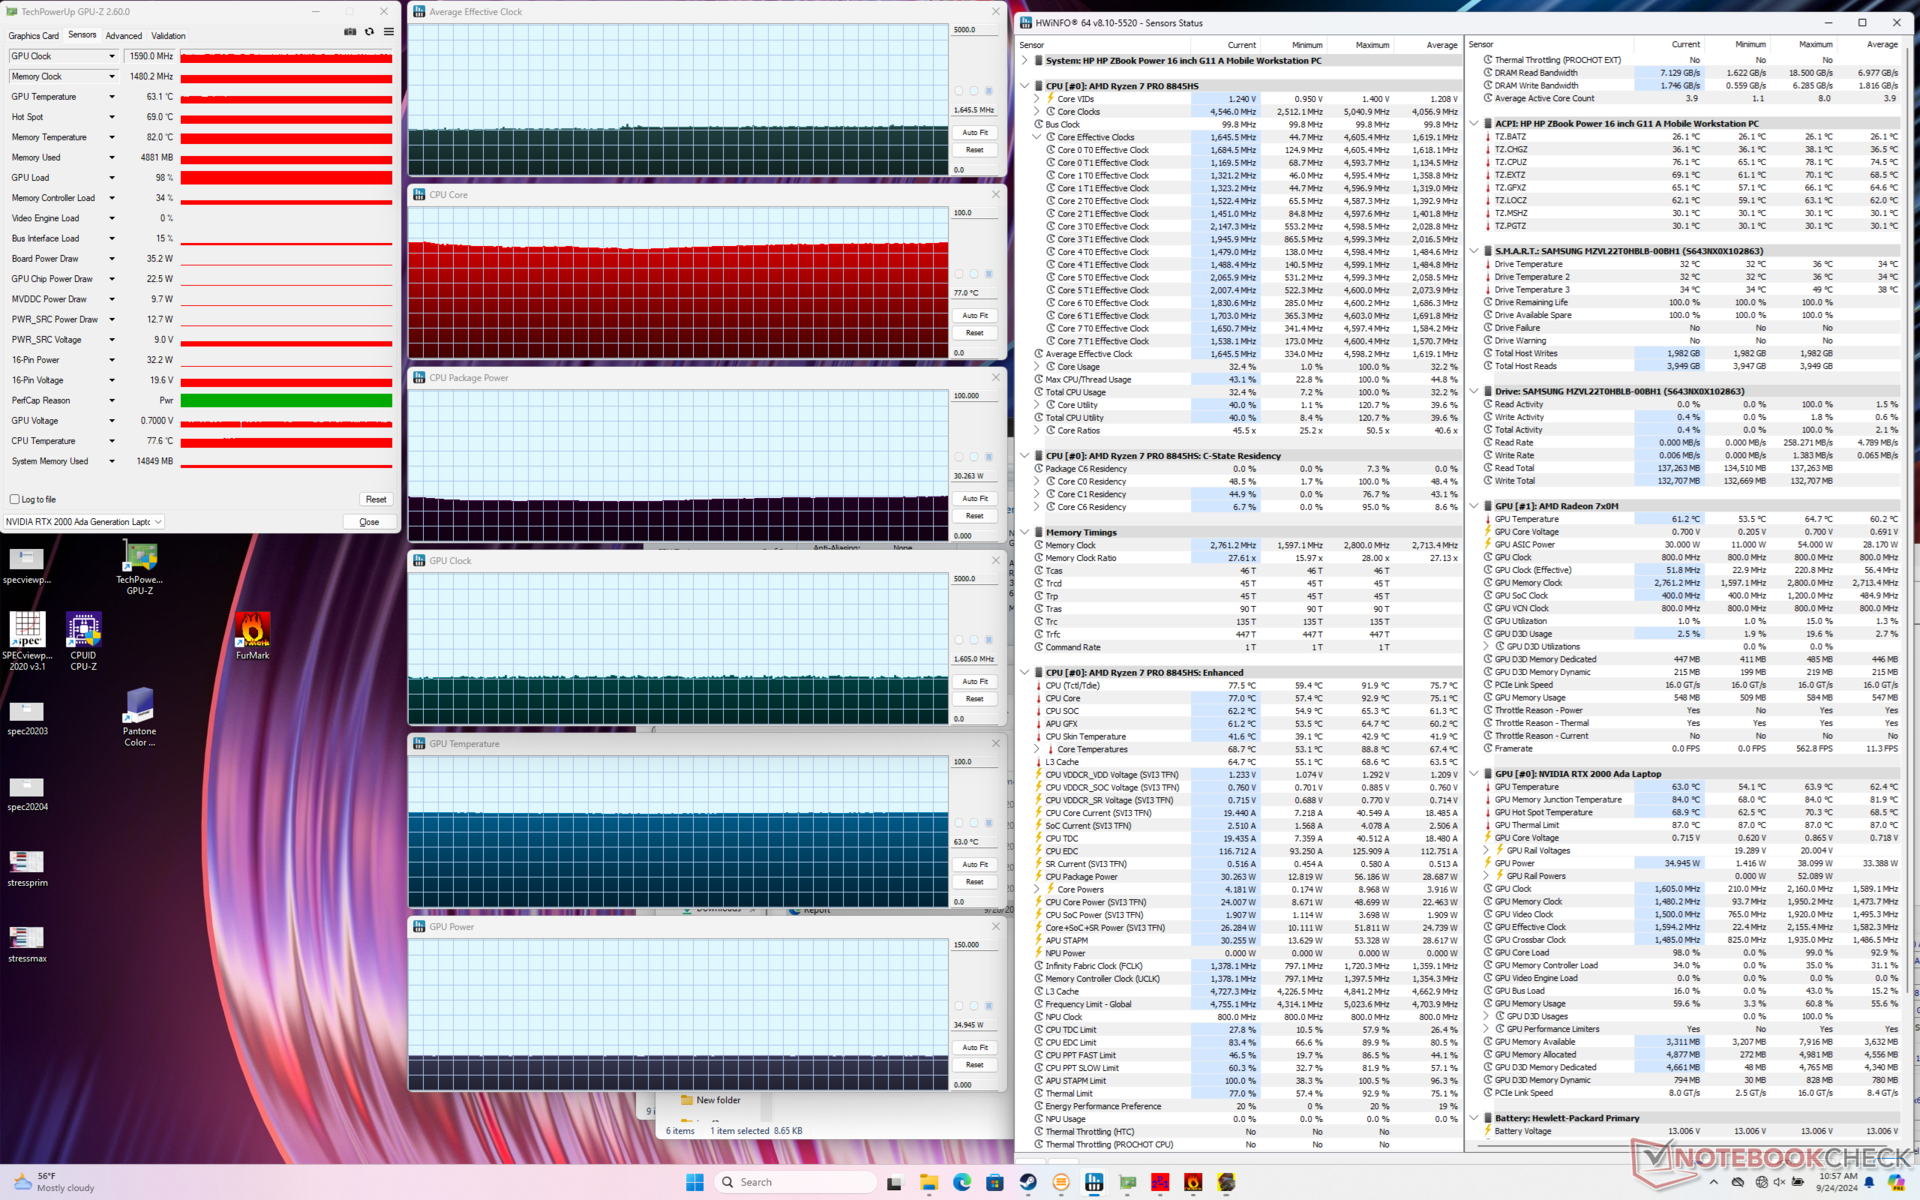
| Średnie taktowanieCPU (GHz) | Taktowanie GPU (MHz) | Średnia temperatura CPU (°C) | Średnia temperatura GPU (°C) | |
| System w stanie spoczynku | -- | -- | 47 | 49 |
| Prime95 Stress | 3.9 | -- | 92 | 64 |
| Prime95 + FurMark Stress | 2.8 | 1320 | 66 | 65 |
| Cyberpunk 2077 Stress (tryb zrównoważony) | 1.6 | 1425 | 74 | 62 |
| Cyberpunk 2077 Stress (tryb wydajności) | 1.7 | 1590 | 77 | 63 |
Wydajność systemu
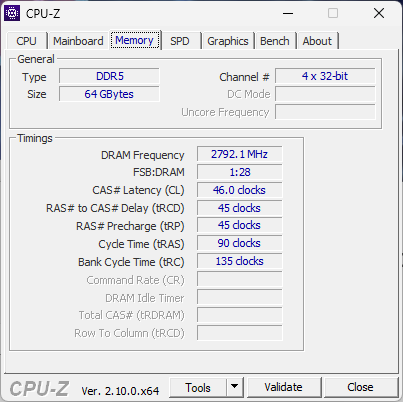
Wyniki PCMark są niemal identyczne z tymi, które odnotowaliśmy na zeszłorocznym ZBook Power 15 G10. Oznacza to, że tradycyjne codzienne obciążenia, takie jak przeglądanie lub edycja, nie są zauważalnie szybsze na naszym nowszym modelu. Wydajność pamięci RAM również nie uległa poprawie.
Doświadczyliśmy problemu z wybudzaniem z uśpienia, w którym konieczne było twarde zamknięcie, aby powrócić do systemu Windows. Nie byliśmy w stanie wiarygodnie odtworzyć tego problemu, ale fakt, że w ogóle wystąpił on na mobilnej stacji roboczej jest godny odnotowania.

CrossMark: Overall | Productivity | Creativity | Responsiveness
WebXPRT 3: Overall
WebXPRT 4: Overall
Mozilla Kraken 1.1: Total
| PCMark 10 / Score | |
| Dell Precision 5690 | |
| HP ZBook Fury 16 G11 | |
| HP ZBook Power 15 G10 | |
| HP ZBook Power 16 G11 A | |
| Przeciętny AMD Ryzen 7 8845HS, NVIDIA RTX 2000 Ada Generation Laptop GPU (n=1) | |
| Lenovo ThinkPad P1 Gen 7 21KV001SGE | |
| Lenovo ThinkPad P16s G2 21K9000CGE | |
| PCMark 10 / Essentials | |
| Dell Precision 5690 | |
| HP ZBook Power 15 G10 | |
| HP ZBook Power 16 G11 A | |
| Przeciętny AMD Ryzen 7 8845HS, NVIDIA RTX 2000 Ada Generation Laptop GPU (n=1) | |
| Lenovo ThinkPad P1 Gen 7 21KV001SGE | |
| Lenovo ThinkPad P16s G2 21K9000CGE | |
| HP ZBook Fury 16 G11 | |
| PCMark 10 / Productivity | |
| Dell Precision 5690 | |
| HP ZBook Power 15 G10 | |
| HP ZBook Power 16 G11 A | |
| Przeciętny AMD Ryzen 7 8845HS, NVIDIA RTX 2000 Ada Generation Laptop GPU (n=1) | |
| HP ZBook Fury 16 G11 | |
| Lenovo ThinkPad P1 Gen 7 21KV001SGE | |
| Lenovo ThinkPad P16s G2 21K9000CGE | |
| PCMark 10 / Digital Content Creation | |
| HP ZBook Fury 16 G11 | |
| Dell Precision 5690 | |
| Lenovo ThinkPad P1 Gen 7 21KV001SGE | |
| HP ZBook Power 15 G10 | |
| HP ZBook Power 16 G11 A | |
| Przeciętny AMD Ryzen 7 8845HS, NVIDIA RTX 2000 Ada Generation Laptop GPU (n=1) | |
| Lenovo ThinkPad P16s G2 21K9000CGE | |
| CrossMark / Overall | |
| HP ZBook Fury 16 G11 | |
| Dell Precision 5690 | |
| HP ZBook Power 16 G11 A | |
| Przeciętny AMD Ryzen 7 8845HS, NVIDIA RTX 2000 Ada Generation Laptop GPU (n=1) | |
| Lenovo ThinkPad P1 Gen 7 21KV001SGE | |
| HP ZBook Power 15 G10 | |
| Lenovo ThinkPad P16s G2 21K9000CGE | |
| CrossMark / Productivity | |
| HP ZBook Fury 16 G11 | |
| Dell Precision 5690 | |
| HP ZBook Power 16 G11 A | |
| Przeciętny AMD Ryzen 7 8845HS, NVIDIA RTX 2000 Ada Generation Laptop GPU (n=1) | |
| Lenovo ThinkPad P1 Gen 7 21KV001SGE | |
| HP ZBook Power 15 G10 | |
| Lenovo ThinkPad P16s G2 21K9000CGE | |
| CrossMark / Creativity | |
| HP ZBook Fury 16 G11 | |
| HP ZBook Power 16 G11 A | |
| Przeciętny AMD Ryzen 7 8845HS, NVIDIA RTX 2000 Ada Generation Laptop GPU (n=1) | |
| Dell Precision 5690 | |
| Lenovo ThinkPad P1 Gen 7 21KV001SGE | |
| HP ZBook Power 15 G10 | |
| Lenovo ThinkPad P16s G2 21K9000CGE | |
| CrossMark / Responsiveness | |
| HP ZBook Fury 16 G11 | |
| Dell Precision 5690 | |
| HP ZBook Power 16 G11 A | |
| Przeciętny AMD Ryzen 7 8845HS, NVIDIA RTX 2000 Ada Generation Laptop GPU (n=1) | |
| Lenovo ThinkPad P1 Gen 7 21KV001SGE | |
| Lenovo ThinkPad P16s G2 21K9000CGE | |
| HP ZBook Power 15 G10 | |
| WebXPRT 3 / Overall | |
| HP ZBook Fury 16 G11 | |
| HP ZBook Power 15 G10 | |
| HP ZBook Power 16 G11 A | |
| Przeciętny AMD Ryzen 7 8845HS, NVIDIA RTX 2000 Ada Generation Laptop GPU (n=1) | |
| Dell Precision 5690 | |
| Lenovo ThinkPad P1 Gen 7 21KV001SGE | |
| Lenovo ThinkPad P16s G2 21K9000CGE | |
| WebXPRT 4 / Overall | |
| HP ZBook Fury 16 G11 | |
| Dell Precision 5690 | |
| Lenovo ThinkPad P1 Gen 7 21KV001SGE | |
| HP ZBook Power 16 G11 A | |
| Przeciętny AMD Ryzen 7 8845HS, NVIDIA RTX 2000 Ada Generation Laptop GPU (n=1) | |
| HP ZBook Power 15 G10 | |
| Mozilla Kraken 1.1 / Total | |
| Lenovo ThinkPad P16s G2 21K9000CGE | |
| HP ZBook Power 15 G10 | |
| HP ZBook Power 16 G11 A | |
| Przeciętny AMD Ryzen 7 8845HS, NVIDIA RTX 2000 Ada Generation Laptop GPU (n=1) | |
| Lenovo ThinkPad P1 Gen 7 21KV001SGE | |
| Dell Precision 5690 | |
| HP ZBook Fury 16 G11 | |
* ... im mniej tym lepiej
| PCMark 10 Score | 7376 pkt. | |
Pomoc | ||
| AIDA64 / Memory Copy | |
| Dell Precision 5690 | |
| HP ZBook Power 15 G10 | |
| Przeciętny AMD Ryzen 7 8845HS (61459 - 71873, n=12) | |
| Lenovo ThinkPad P16s G2 21K9000CGE | |
| Lenovo ThinkPad P1 Gen 7 21KV001SGE | |
| HP ZBook Power 16 G11 A | |
| HP ZBook Fury 16 G11 | |
| AIDA64 / Memory Read | |
| Dell Precision 5690 | |
| Lenovo ThinkPad P1 Gen 7 21KV001SGE | |
| HP ZBook Power 15 G10 | |
| HP ZBook Power 16 G11 A | |
| HP ZBook Fury 16 G11 | |
| Przeciętny AMD Ryzen 7 8845HS (49866 - 61976, n=12) | |
| Lenovo ThinkPad P16s G2 21K9000CGE | |
| AIDA64 / Memory Write | |
| Lenovo ThinkPad P16s G2 21K9000CGE | |
| Przeciętny AMD Ryzen 7 8845HS (68425 - 93239, n=12) | |
| HP ZBook Power 15 G10 | |
| HP ZBook Power 16 G11 A | |
| Dell Precision 5690 | |
| Lenovo ThinkPad P1 Gen 7 21KV001SGE | |
| HP ZBook Fury 16 G11 | |
| AIDA64 / Memory Latency | |
| Dell Precision 5690 | |
| Lenovo ThinkPad P1 Gen 7 21KV001SGE | |
| Lenovo ThinkPad P16s G2 21K9000CGE | |
| HP ZBook Power 15 G10 | |
| HP ZBook Power 16 G11 A | |
| Przeciętny AMD Ryzen 7 8845HS (82.5 - 117, n=12) | |
| HP ZBook Fury 16 G11 | |
* ... im mniej tym lepiej
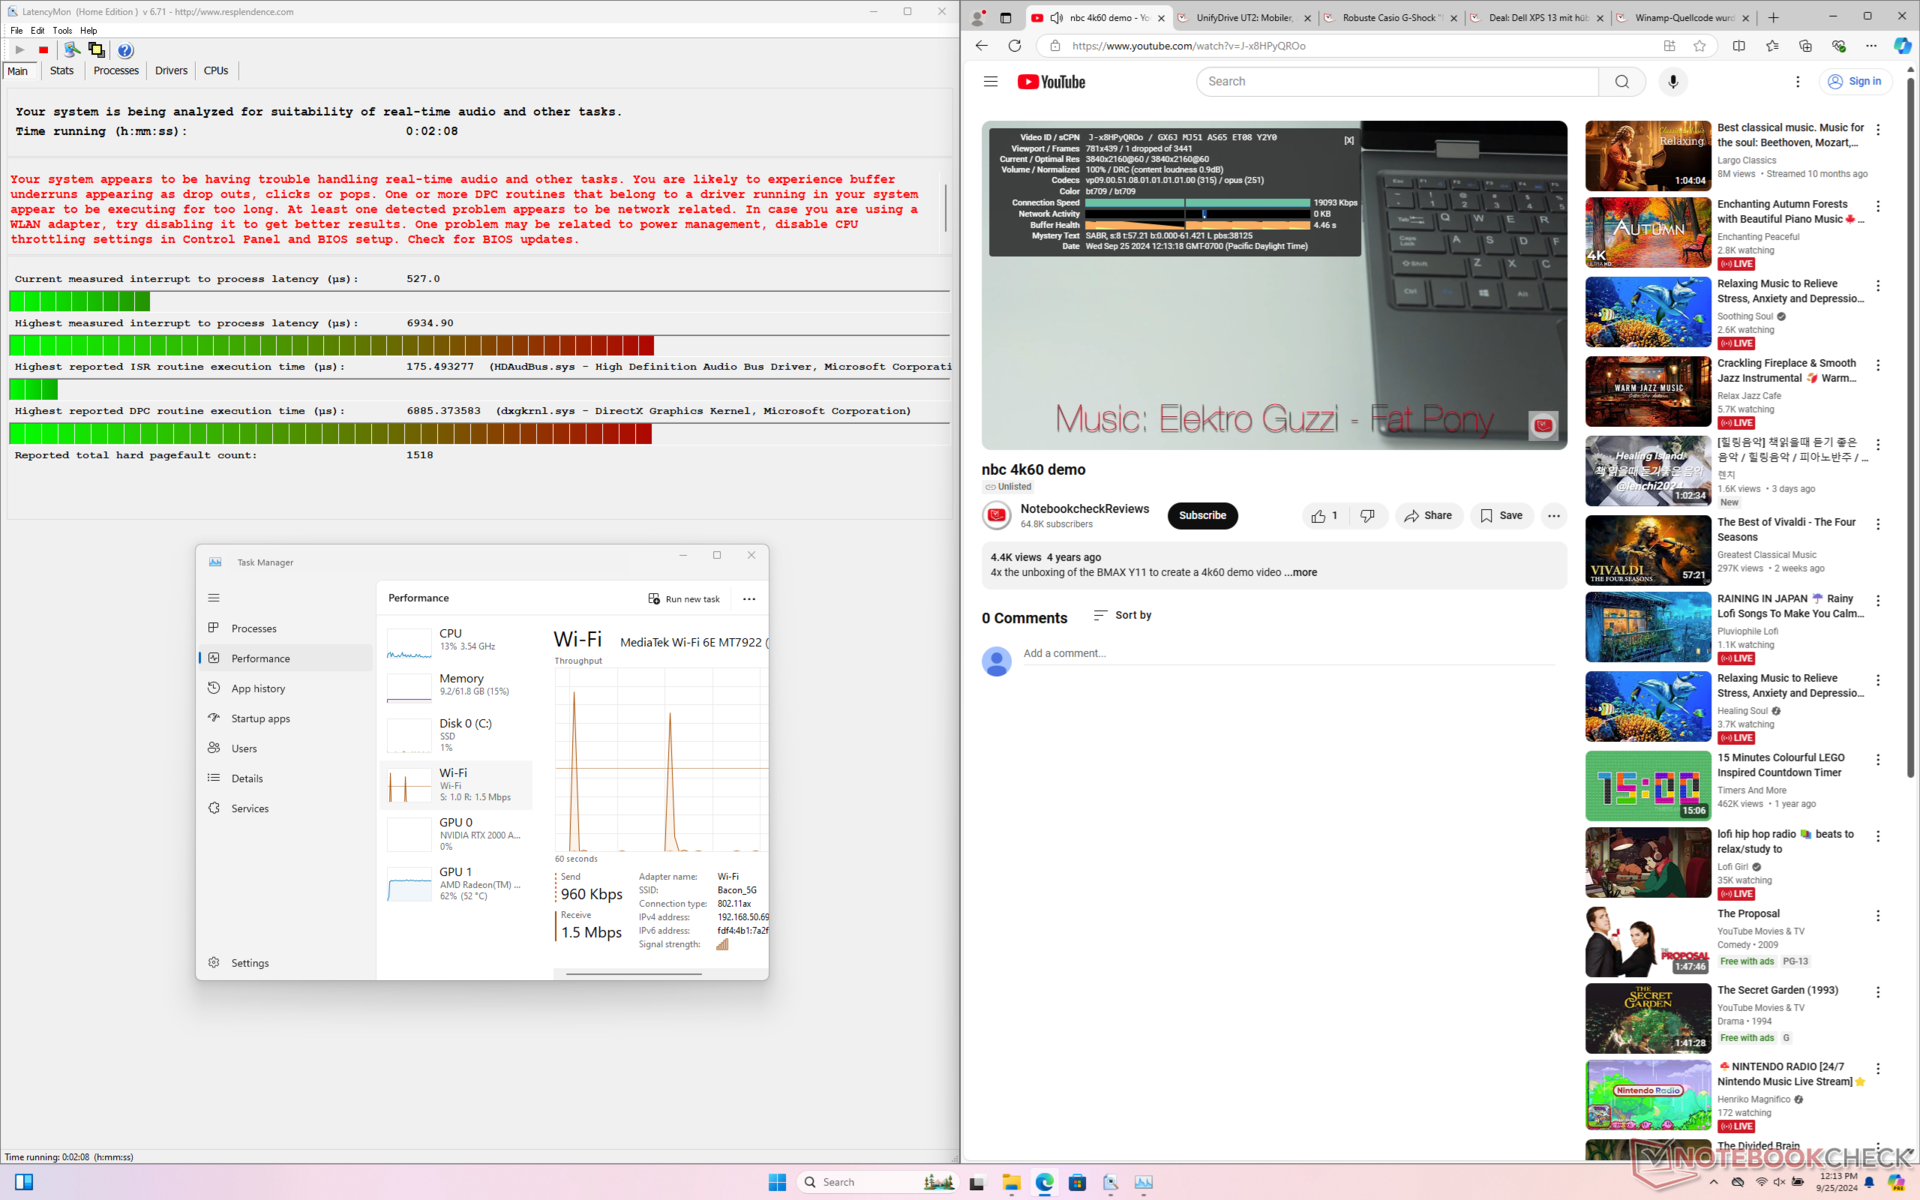
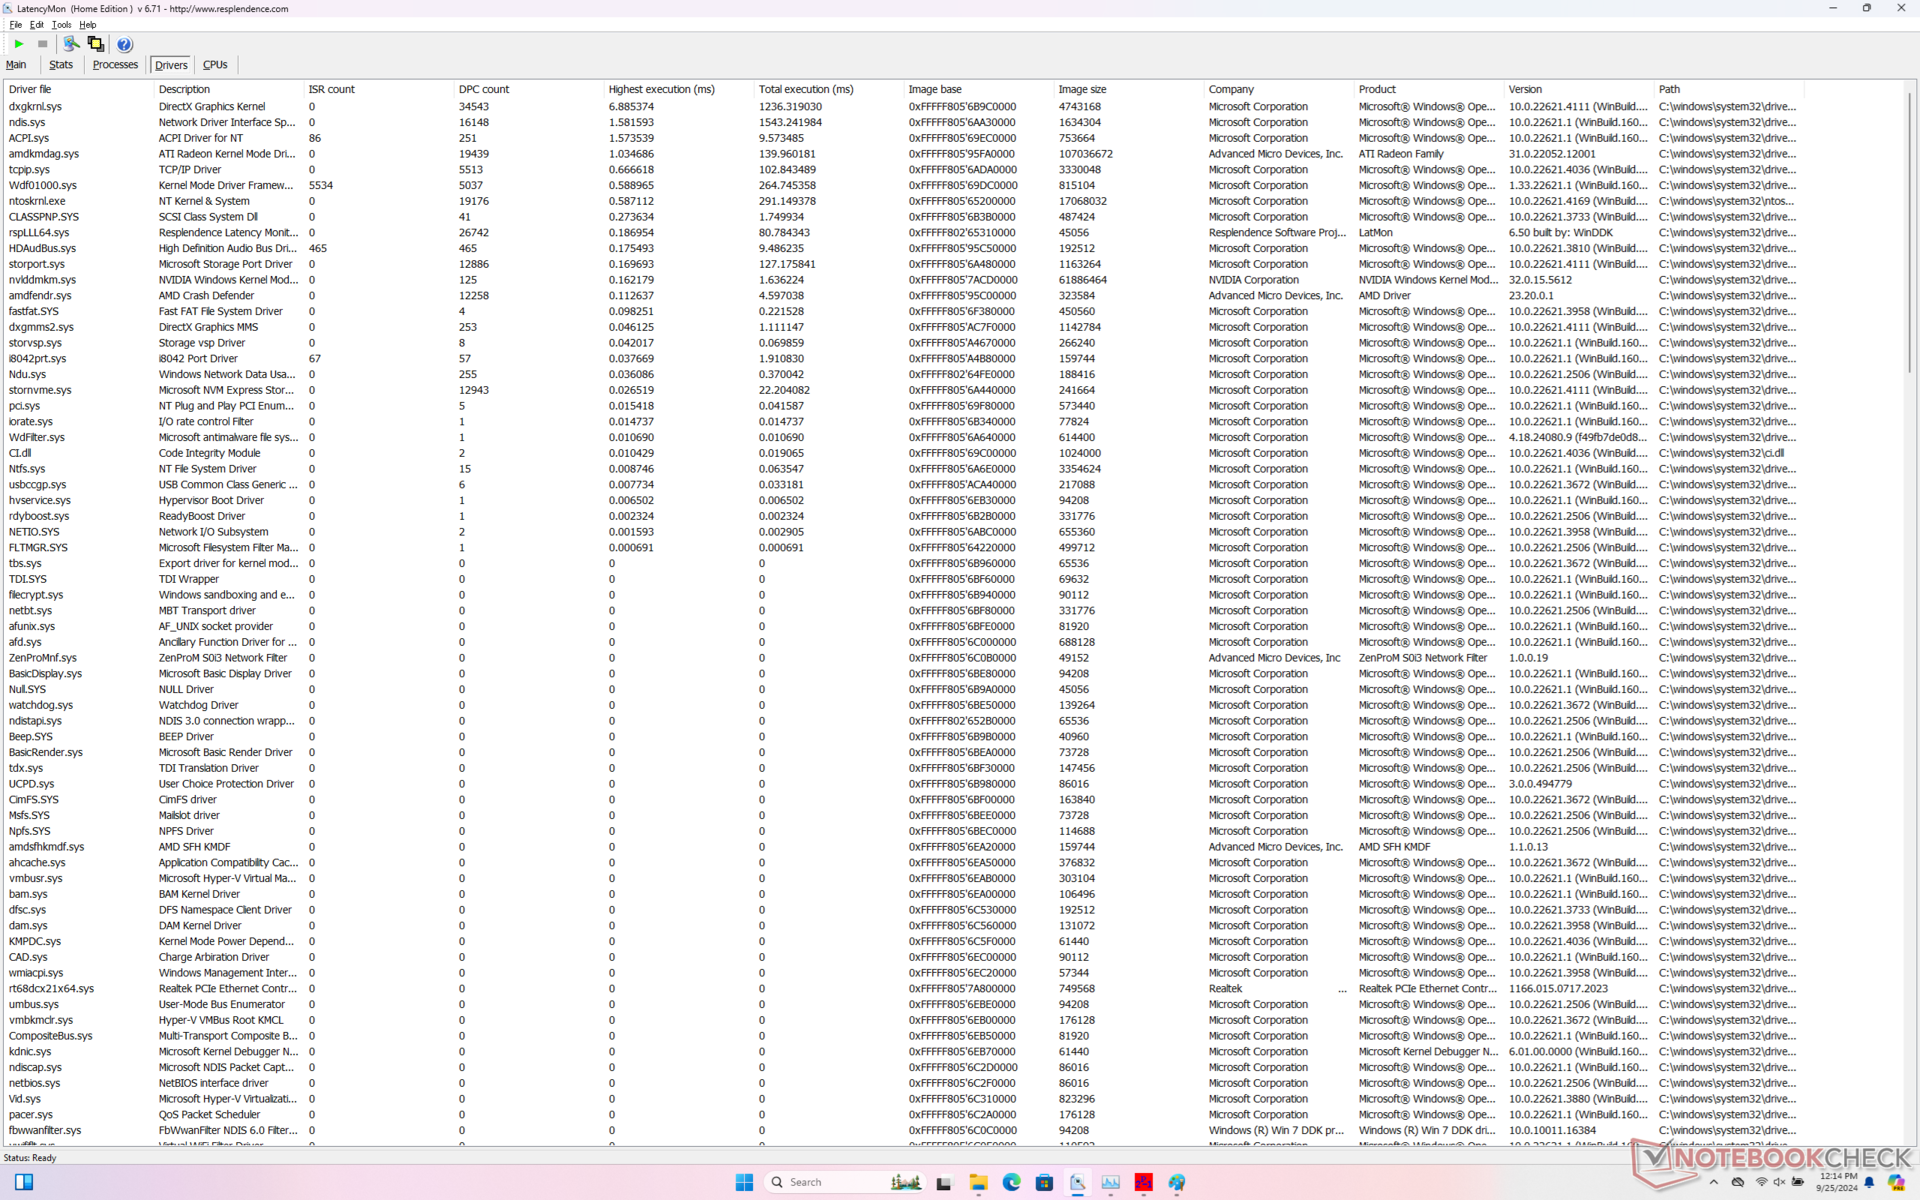
Opóźnienie DPC
LatencyMon ujawnia problemy DPC związane z HDAudBus.sys nawet po wielu ponownych testach. odtwarzanie wideo 4K przy 60 FPS jest poza tym doskonałe, z zaledwie jedną utraconą klatką zarejestrowaną podczas 60-sekundowego okna.
| DPC Latencies / LatencyMon - interrupt to process latency (max), Web, Youtube, Prime95 | |
| HP ZBook Fury 16 G11 | |
| HP ZBook Power 16 G11 A | |
| HP ZBook Power 15 G10 | |
| Lenovo ThinkPad P1 Gen 7 21KV001SGE | |
| Lenovo ThinkPad P16s G2 21K9000CGE | |
| Dell Precision 5690 | |
* ... im mniej tym lepiej
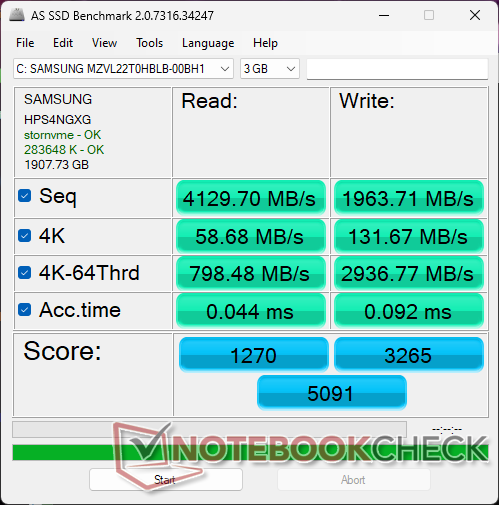
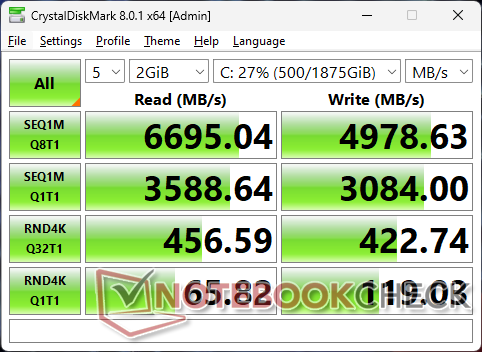
Urządzenia pamięci masowej
Nasza jednostka testowa jest dostarczana z dyskiem 2 TB Samsung PM9A1 PCIe4 x4 NVMe SSD dla sekwencyjnych prędkości odczytu do 6700 MB/s. Niestety, dysk szybko spadał do niskiego poziomu 2000 MB/s po zaledwie kilku minutach obciążenia, jak pokazują poniższe wyniki testu pętli DiskSpd. Powtórzyliśmy test i wyniki nie uległy poprawie. Jest to rozczarowujące, ponieważ dysk WD w starszym ZBook Power 15 G10 nie wykazywał żadnych problemów z dławieniem. Rozpraszacz ciepła prawdopodobnie poprawiłby wydajność.

| Drive Performance Rating - Percent | |
| HP ZBook Fury 16 G11 | |
| Dell Precision 5690 | |
| Lenovo ThinkPad P16s G2 21K9000CGE | |
| HP ZBook Power 15 G10 | |
| HP ZBook Power 16 G11 A | |
| Lenovo ThinkPad P1 Gen 7 21KV001SGE | |
* ... im mniej tym lepiej
Disk Throttling: DiskSpd Read Loop, Queue Depth 8
Wydajność GPU
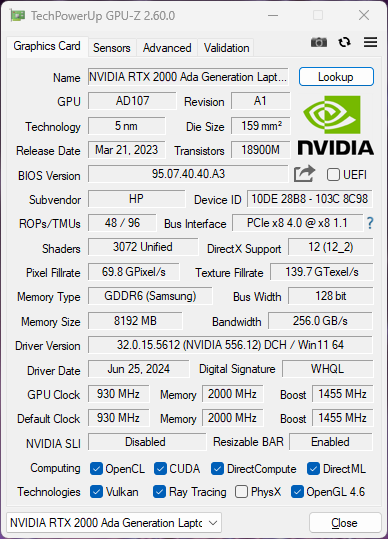
Opcje dyskretnych procesorów graficznych pozostają identyczne jak w 15-calowym ZBooku Power 15 G10, ponieważ Nvidia nie wprowadziła jeszcze następcy mobilnej serii Ada Lovelace. Co więcej, rozwiązanie chłodzące nie uległo znacznej poprawie podczas przejścia na 16-calową obudowę, co oznacza, że ZBook Power 16 G11 jest nadal ograniczony do tego samego pułapu 50 W TGP i RTX 1000 Ada, RTX 2000 Adai RTX 3000 Ada jak poprzednio. Użytkownicy będą musieli rozważyć grubszą serię ZBook Fury 16 dla wyższych opcji RTX Ada.
Uaktualnienie do RTX 3000 Ada przynosi w najlepszym razie marginalny wzrost wydajności w oparciu o nasze doświadczenia z Dell Precision 5490.
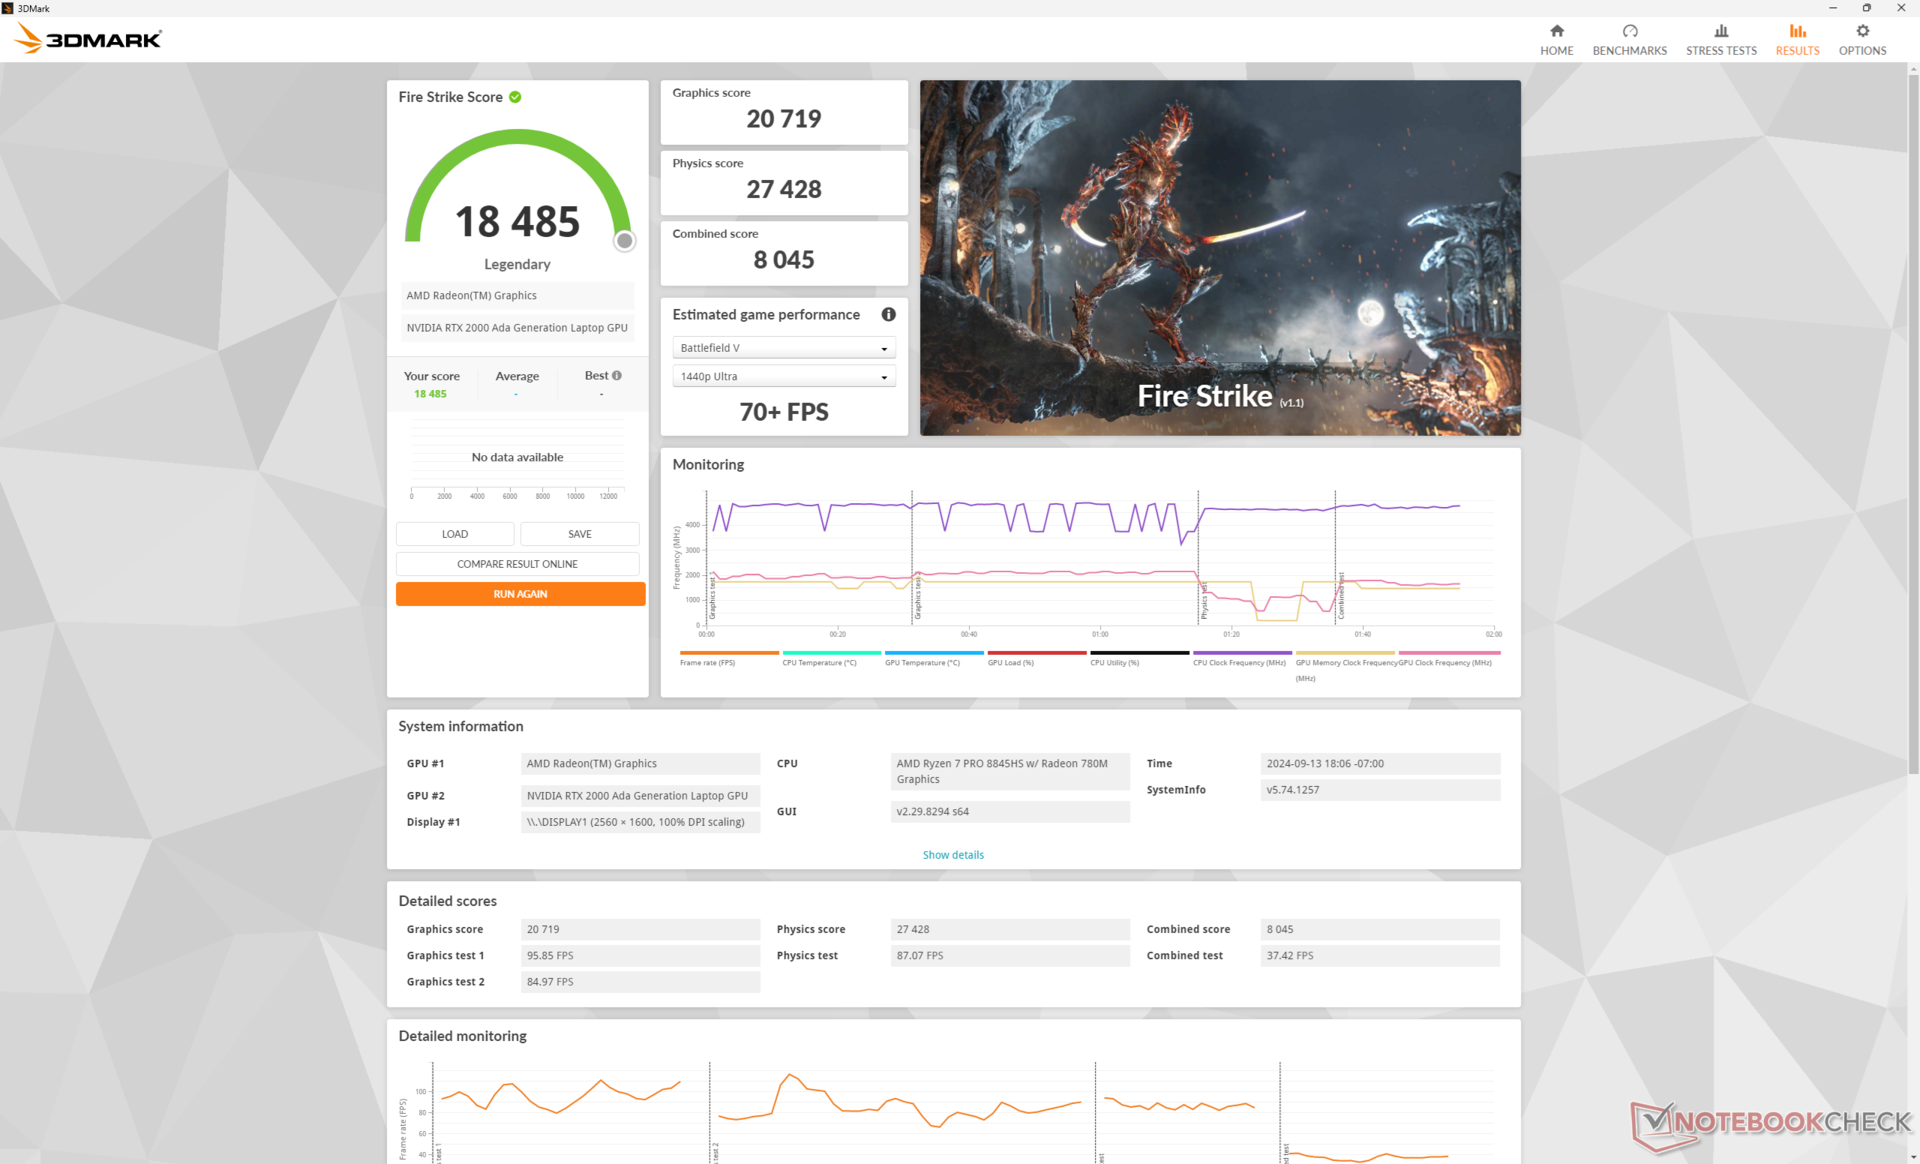
| Profil zasilania | Wynik grafiki | Wynik fizyki | Wynik łączny |
| Tryb wydajności | 20719 | 27428 | 8045 |
| Tryb zrównoważony | 19961 (-4%) | 26363 (-4%) | 7633 (-5%) |
| Zasilanie bateryjne | 8108 (-61%) | 6149 (-78%) | 1727 (-79%) |
Praca w trybie zrównoważonym zamiast w trybie wydajności ma niewielki wpływ na wydajność, jak pokazuje nasza tabela wyników Fire Strike powyżej. Jednak zarówno wydajność CPU, jak i GPU jest znacznie zmniejszona, jeśli działają na bateriach.
| 3DMark Performance Rating - Percent | |
| Dell Precision 5690 -3! | |
| HP ZBook Fury 16 G11 | |
| HP ZBook Fury 16 G9 -3! | |
| HP ZBook Power 16 G11 A | |
| Przeciętny NVIDIA RTX 2000 Ada Generation Laptop GPU | |
| Dell Precision 5000 5490 -3! | |
| MSI CreatorPro Z16P B12UKST -19! | |
| HP ZBook Power 15 G10 -11! | |
| Asus ExpertBook B6 Flip B6602FC2 -19! | |
| Lenovo ThinkPad P16v G1 AMD -18! | |
| Lenovo ThinkPad P1 G4-20Y4Z9DVUS -19! | |
| Lenovo ThinkPad P16s G2 21K9000CGE -19! | |
| HP ZBook Firefly 16 G9-6B897EA -19! | |
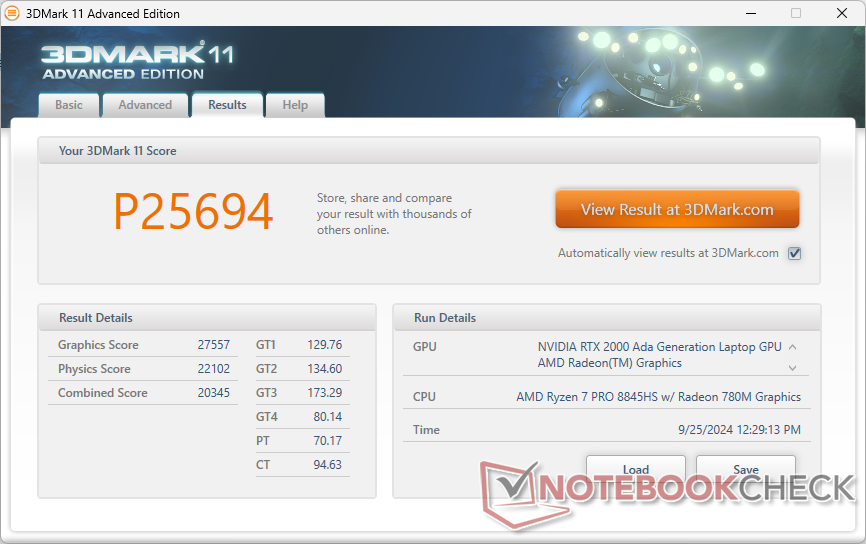
| 3DMark 11 Performance | 25694 pkt. | |
| 3DMark Cloud Gate Standard Score | 51846 pkt. | |
| 3DMark Fire Strike Score | 18485 pkt. | |
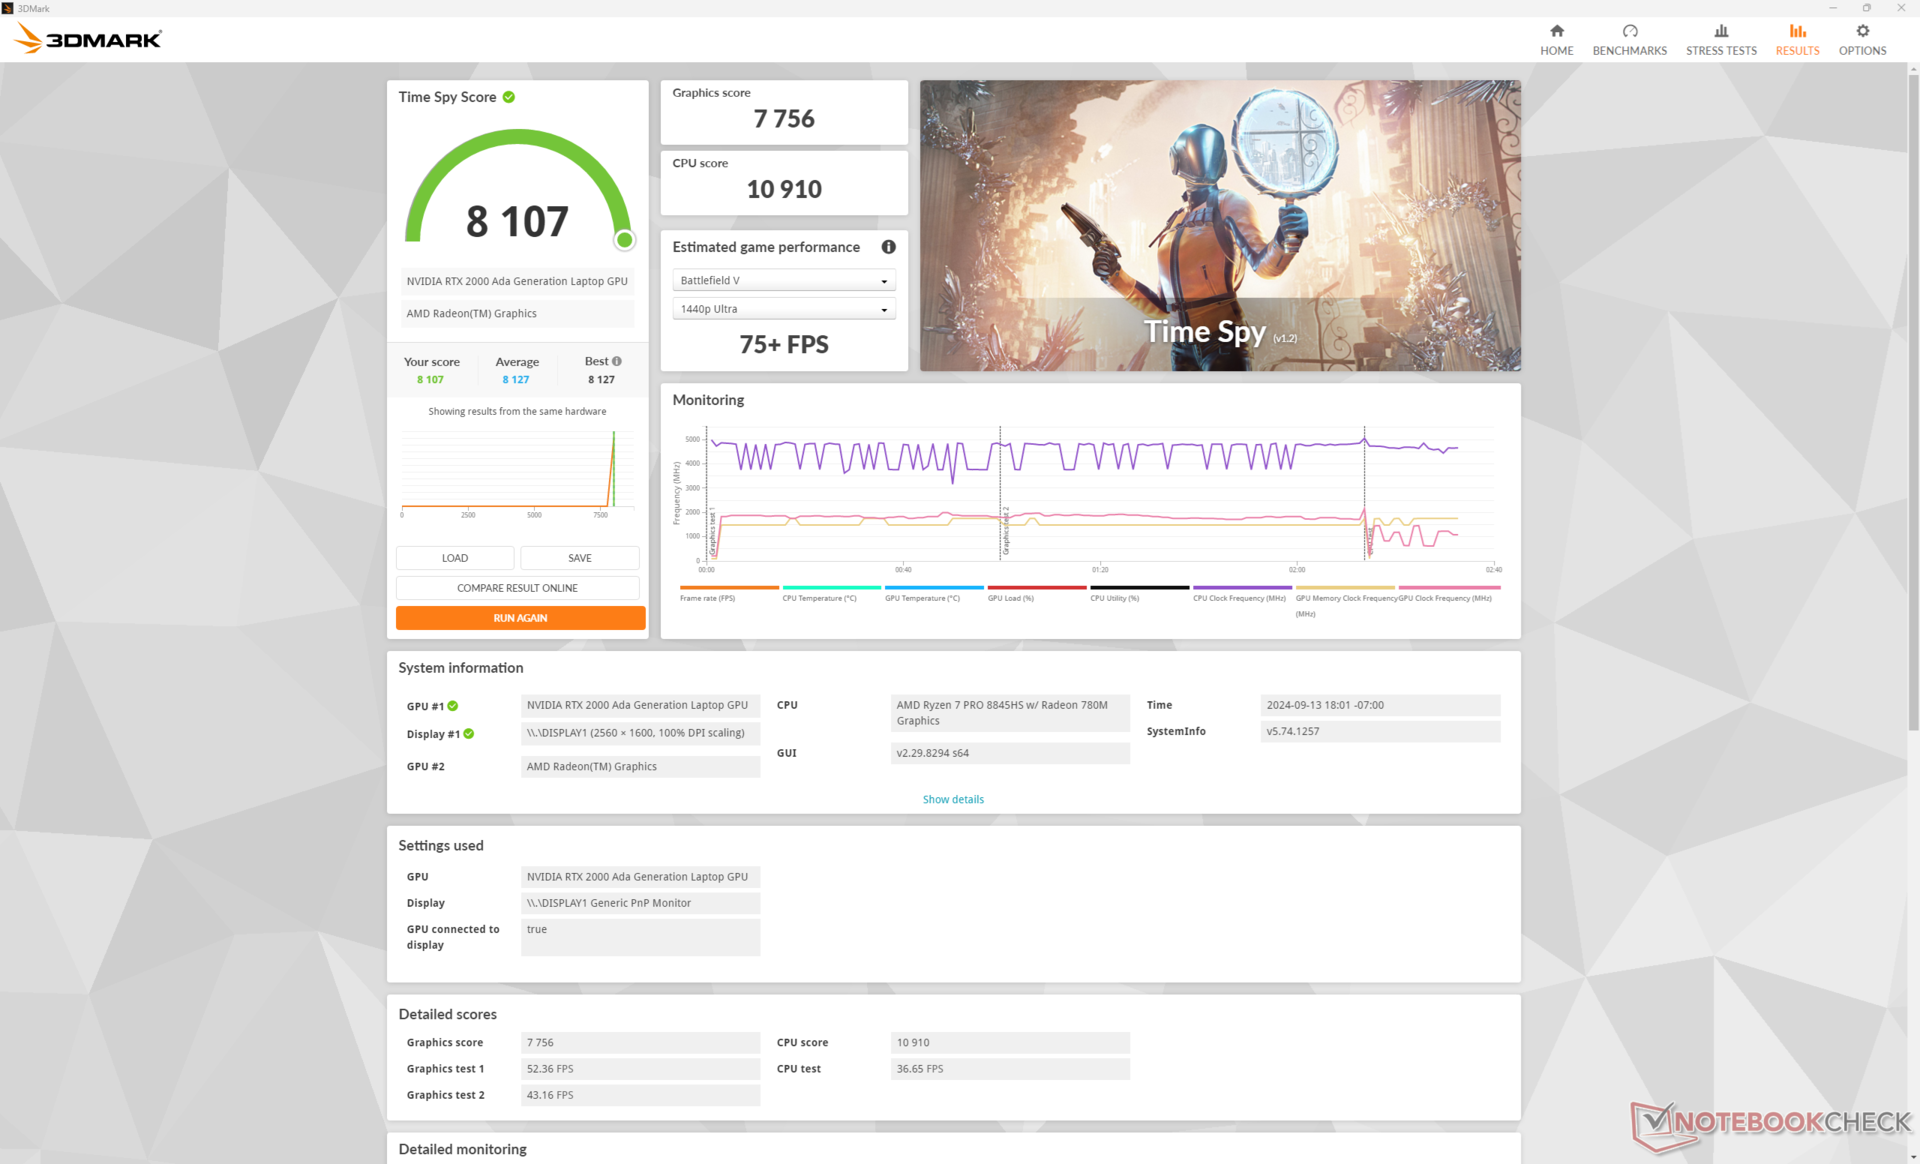
| 3DMark Time Spy Score | 8107 pkt. | |
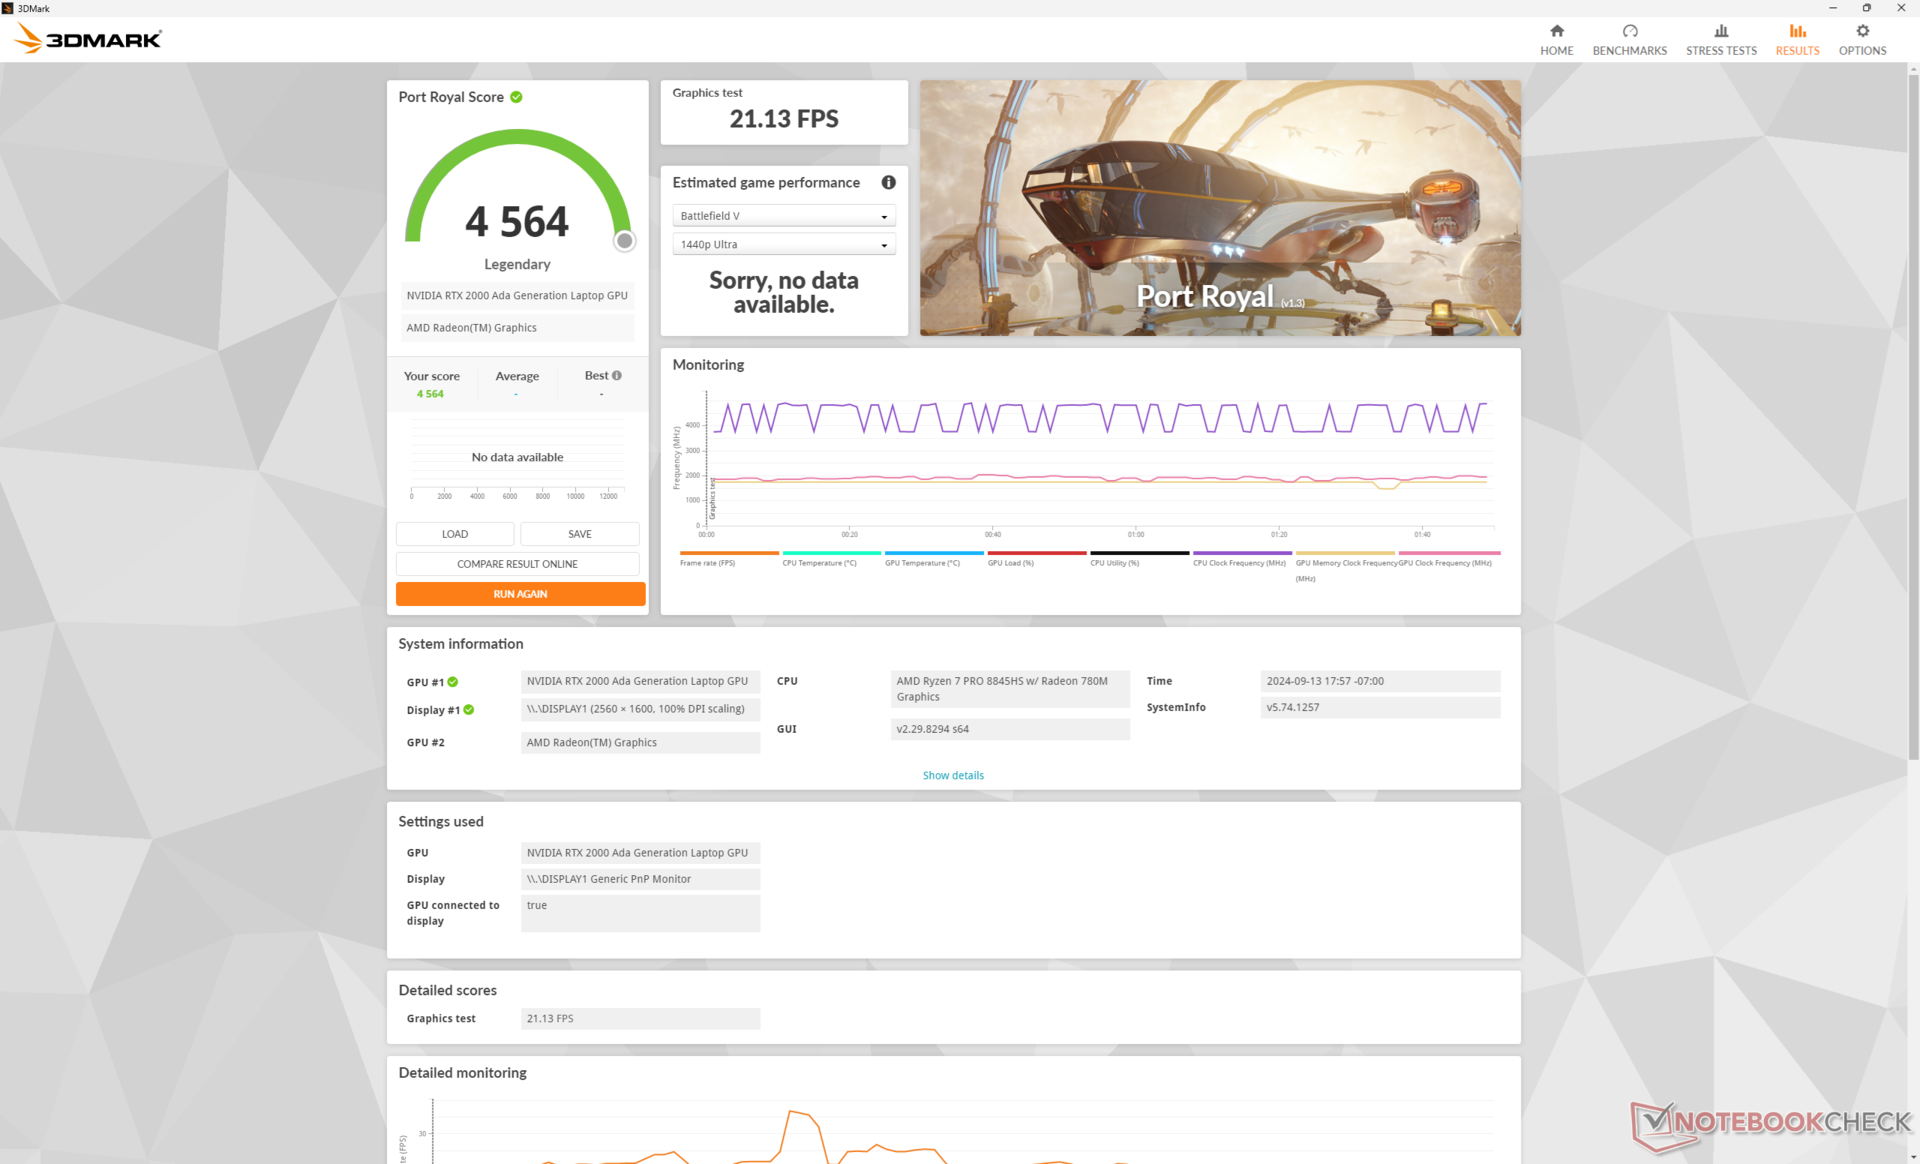
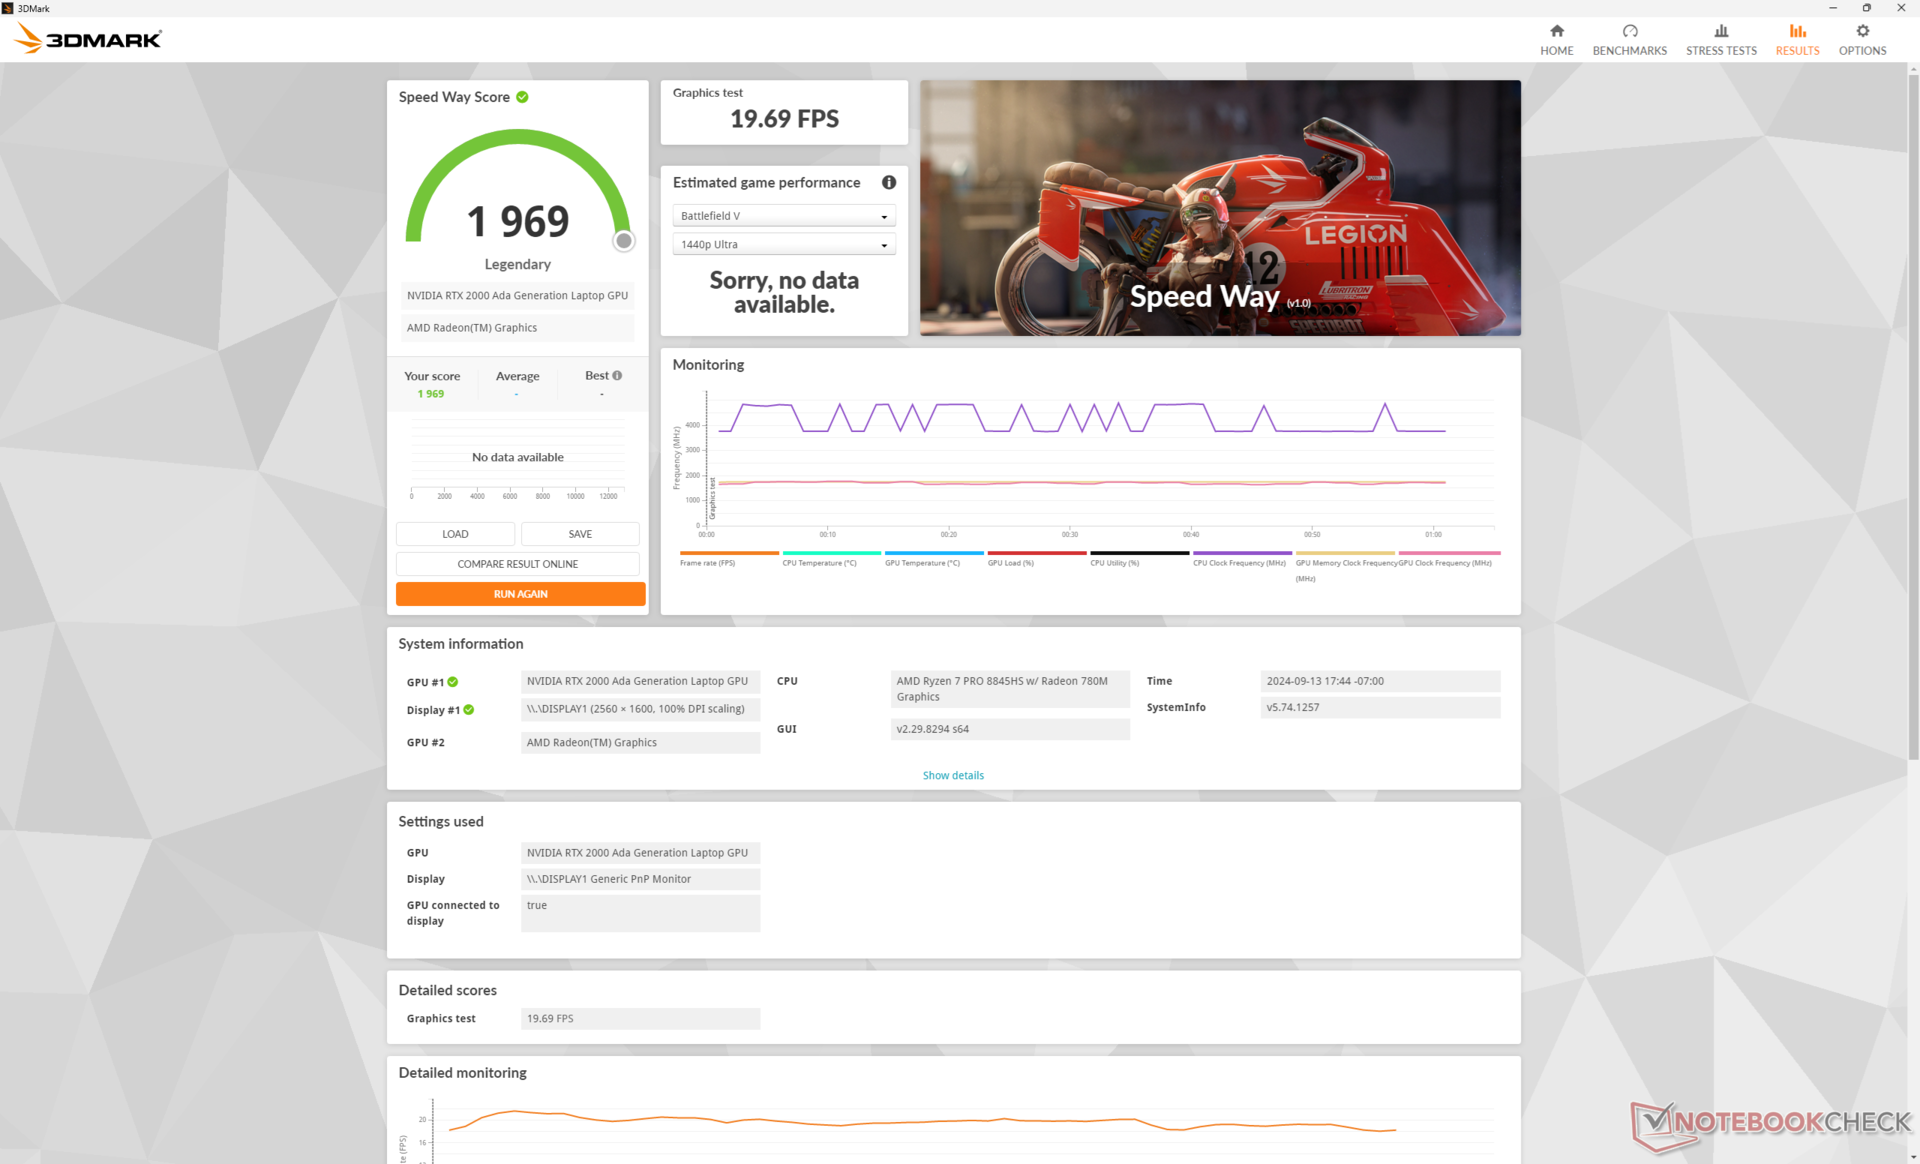
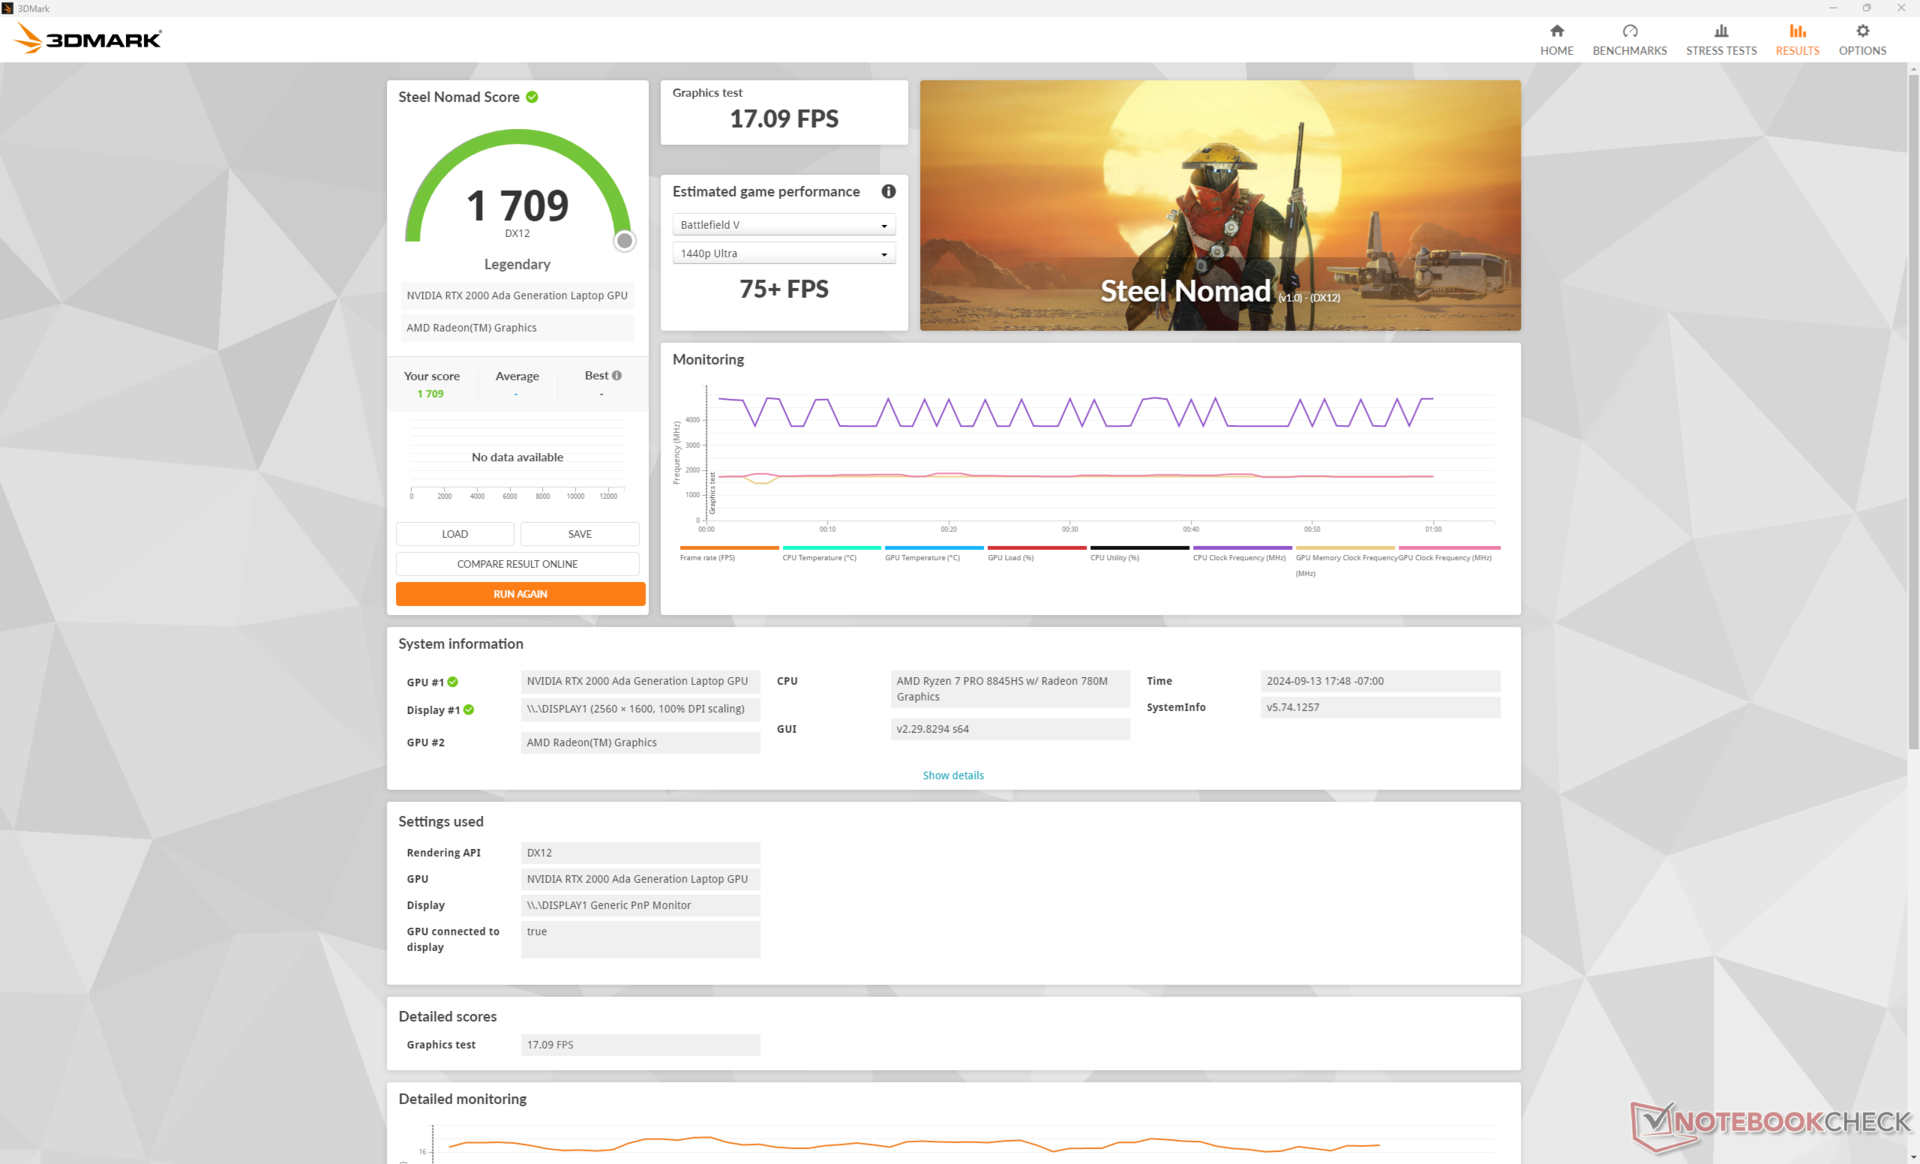
| 3DMark Steel Nomad Score | 1709 pkt. | |
Pomoc | ||
* ... im mniej tym lepiej
Wydajność w grach
Chociaż nie jest zoptymalizowana pod kątem gier, RTX 2000 Ada jest najbardziej podobna do laptopów działających na GeForce RTX 3060 lub RTX 4060.
| Performance Rating - Percent | |
| HP ZBook Fury 16 G11 | |
| Dell Precision 5690 -1! | |
| HP ZBook Fury 16 G9 -1! | |
| MSI CreatorPro Z16P B12UKST | |
| Asus ExpertBook B6 Flip B6602FC2 | |
| Dell Precision 5000 5490 -1! | |
| HP ZBook Power 16 G11 A | |
| HP ZBook Power 15 G10 | |
| Lenovo ThinkPad P1 G4-20Y4Z9DVUS -3! | |
| Lenovo ThinkPad P16v G1 AMD | |
| HP ZBook Firefly 16 G9-6B897EA | |
| Lenovo ThinkPad P16s G2 21K9000CGE | |
| GTA V - 1920x1080 Highest Settings possible AA:4xMSAA + FX AF:16x | |
| HP ZBook Fury 16 G9 | |
| HP ZBook Fury 16 G11 | |
| MSI CreatorPro Z16P B12UKST | |
| HP ZBook Power 16 G11 A | |
| HP ZBook Power 15 G10 | |
| Asus ExpertBook B6 Flip B6602FC2 | |
| Lenovo ThinkPad P16v G1 AMD | |
| HP ZBook Firefly 16 G9-6B897EA | |
| Lenovo ThinkPad P16s G2 21K9000CGE | |
| Final Fantasy XV Benchmark - 1920x1080 High Quality | |
| Dell Precision 5690 | |
| HP ZBook Fury 16 G11 | |
| HP ZBook Fury 16 G9 | |
| Dell Precision 5000 5490 | |
| HP ZBook Power 15 G10 | |
| HP ZBook Power 16 G11 A | |
| MSI CreatorPro Z16P B12UKST | |
| Asus ExpertBook B6 Flip B6602FC2 | |
| Lenovo ThinkPad P16v G1 AMD | |
| Lenovo ThinkPad P1 G4-20Y4Z9DVUS | |
| Lenovo ThinkPad P16s G2 21K9000CGE | |
| HP ZBook Firefly 16 G9-6B897EA | |
| Dota 2 Reborn - 1920x1080 ultra (3/3) best looking | |
| HP ZBook Fury 16 G11 | |
| HP ZBook Fury 16 G9 | |
| MSI CreatorPro Z16P B12UKST | |
| Asus ExpertBook B6 Flip B6602FC2 | |
| Dell Precision 5690 | |
| HP ZBook Power 15 G10 | |
| Dell Precision 5000 5490 | |
| HP ZBook Power 16 G11 A | |
| Lenovo ThinkPad P16v G1 AMD | |
| Lenovo ThinkPad P1 G4-20Y4Z9DVUS | |
| HP ZBook Firefly 16 G9-6B897EA | |
| Lenovo ThinkPad P16s G2 21K9000CGE | |
Cyberpunk 2077 ultra FPS Chart
| low | med. | high | ultra | QHD | |
|---|---|---|---|---|---|
| GTA V (2015) | 180.6 | 162.7 | 90.3 | 63.4 | |
| Dota 2 Reborn (2015) | 145.2 | 142 | 126.1 | 119.9 | |
| Final Fantasy XV Benchmark (2018) | 166.1 | 89.3 | 66.3 | 49.4 | |
| X-Plane 11.11 (2018) | 83.2 | 72.1 | 60.6 | ||
| Far Cry 5 (2018) | 138 | 111 | 104 | 98 | 67 |
| Strange Brigade (2018) | 329 | 187.8 | 158.1 | 138.5 | 99.5 |
| Tiny Tina's Wonderlands (2022) | 139.1 | 115.1 | 80 | 64.4 | 46.3 |
| F1 22 (2022) | 186.6 | 171.1 | 129.1 | 46.2 | 29.8 |
| Baldur's Gate 3 (2023) | 87.1 | 75.7 | 67.6 | 66.1 | 45.6 |
| Cyberpunk 2077 2.2 Phantom Liberty (2023) | 81.1 | 61.4 | 51.7 | 44.8 | 29.7 |
Emisje
Hałas systemowy
Poziom hałasu wentylatorów i ich zachowanie są podobne do tego, co zaobserwowaliśmy w zeszłorocznym modelu. System pozostaje cichy na poziomie zaledwie 25,4 dB(A) nawet po uruchomieniu pierwszej sceny benchmarku 3DMark 06, który jest znacznie cichszy niż konkurencyjne modele, takie jak ThinkPad P16s G2 czy Precision 5690 w podobnych warunkach.
Proszę pamiętać, że hałas wentylatora jest zauważalnie cichszy w trybie zrównoważonym; uruchomienie gry Cyberpunk 2077 w trybie wydajności może być głośne nawet do 43 dB(A) w porównaniu do zaledwie 37,5 dB(A) w trybie zrównoważonym.
Hałas
| luz |
| 23.8 / 24.2 / 24.2 dB |
| obciążenie |
| 25.4 / 45 dB |
 | ||
30 dB cichy 40 dB(A) słyszalny 50 dB(A) irytujący |
||
min: | ||
| HP ZBook Power 16 G11 A NVIDIA RTX 2000 Ada Generation Laptop GPU, R7 8845HS, Samsung PM9A1 MZVL22T0HBLB | HP ZBook Power 15 G10 NVIDIA RTX 2000 Ada Generation Laptop GPU, R7 PRO 7840HS, WDC PC SN810 2TB | HP ZBook Fury 16 G11 NVIDIA RTX 3500 Ada Generation Laptop GPU, i9-14900HX, SK hynix PC801 HFS001TEJ9X101N | Lenovo ThinkPad P1 Gen 7 21KV001SGE NVIDIA GeForce RTX 4060 Laptop GPU, Ultra 7 155H, Kioxia XG8 KXG8AZNV1T02 | Lenovo ThinkPad P16s G2 21K9000CGE Radeon 780M, R7 PRO 7840U, SK hynix PC801 HFS001TEJ9X162N | Dell Precision 5690 NVIDIA RTX 5000 Ada Generation Laptop GPU, Ultra 9 185H, 2x Samsung PM9A1 1TB (RAID 0) | |
|---|---|---|---|---|---|---|
| Noise | -3% | -15% | -18% | -3% | -17% | |
| wyłączone / środowisko * | 23.5 | 24.2 -3% | 23.2 1% | 24.7 -5% | 22.6 4% | 23.4 -0% |
| Idle Minimum * | 23.8 | 24.4 -3% | 23.2 3% | 24.7 -4% | 22.6 5% | 23.6 1% |
| Idle Average * | 24.2 | 24.4 -1% | 23.2 4% | 24.7 -2% | 22.6 7% | 24.9 -3% |
| Idle Maximum * | 24.2 | 24.4 -1% | 29.5 -22% | 24.7 -2% | 22.6 7% | 30.9 -28% |
| Load Average * | 25.4 | 27.4 -8% | 43 -69% | 43.7 -72% | 37.8 -49% | 40.4 -59% |
| Cyberpunk 2077 ultra * | 43 | 48.2 -12% | 53.2 -24% | |||
| Load Maximum * | 45 | 46.8 -4% | 48.2 -7% | 53.3 -18% | 40.5 10% | 51.9 -15% |
| Witcher 3 ultra * | 43.3 | 40.3 | 48.3 |
* ... im mniej tym lepiej
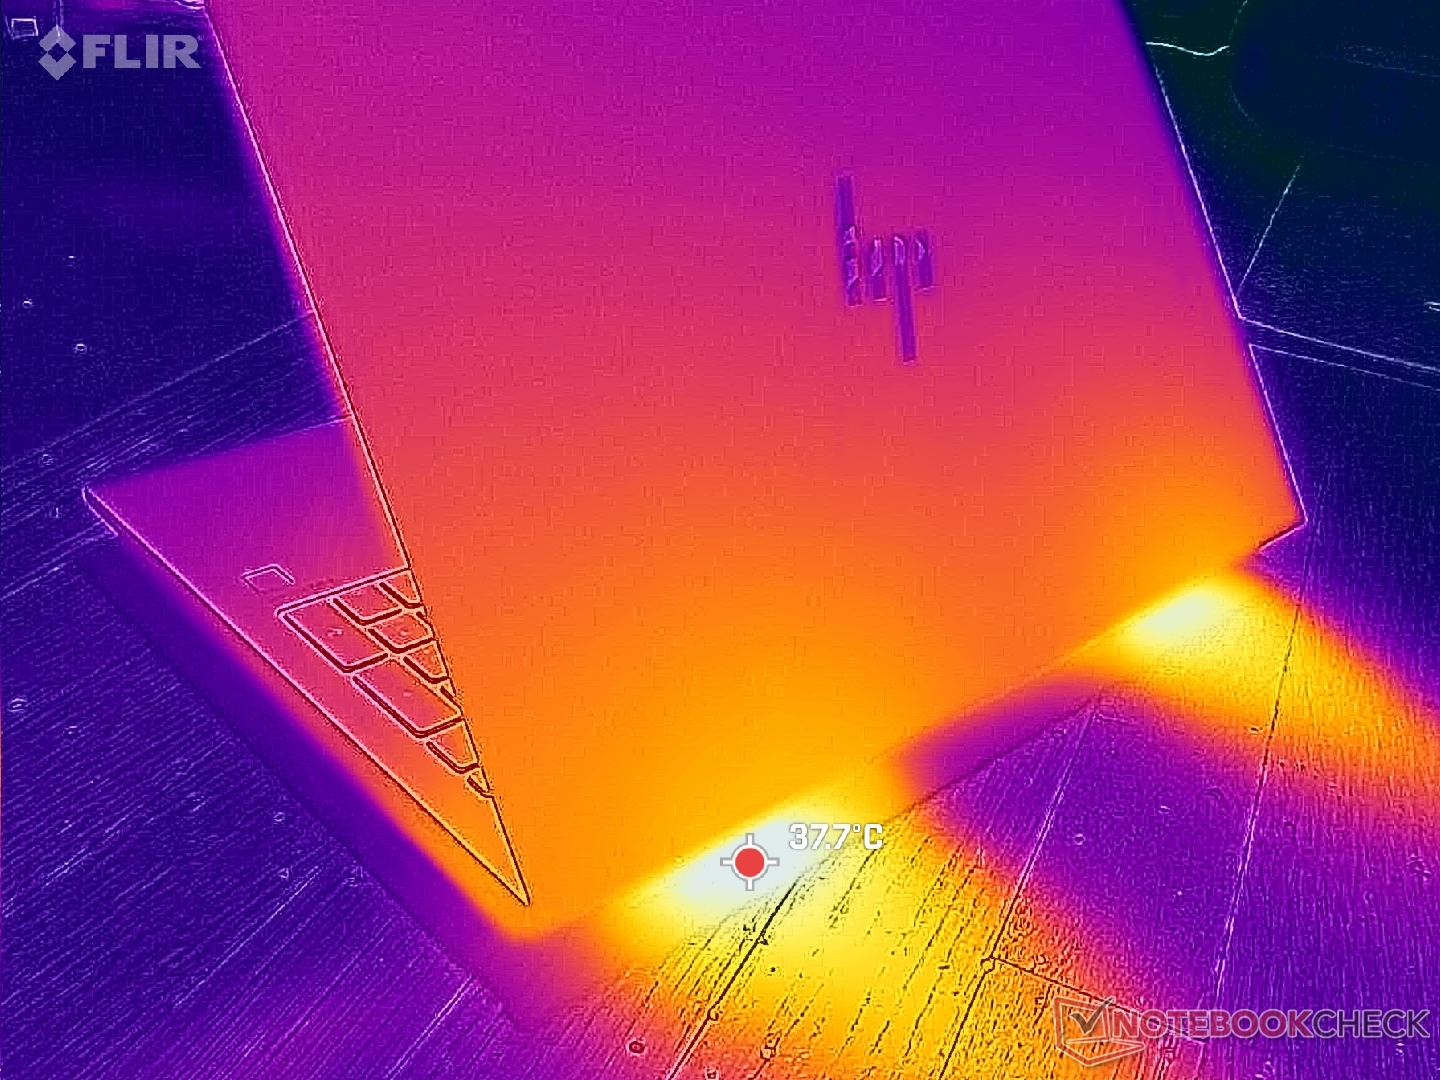
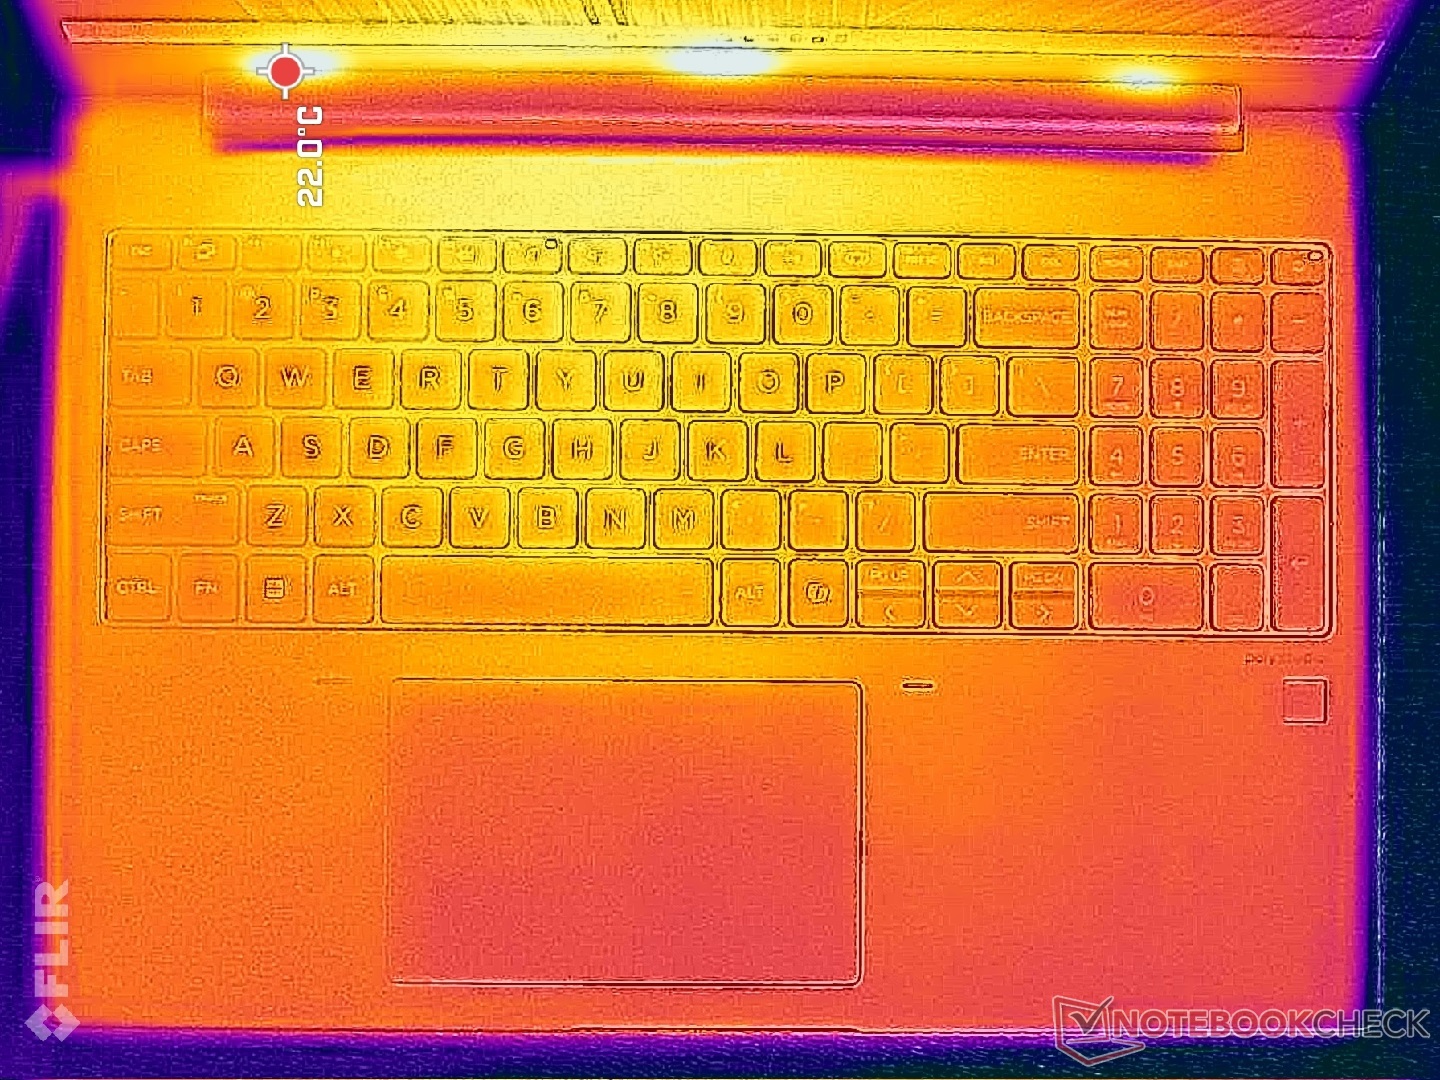
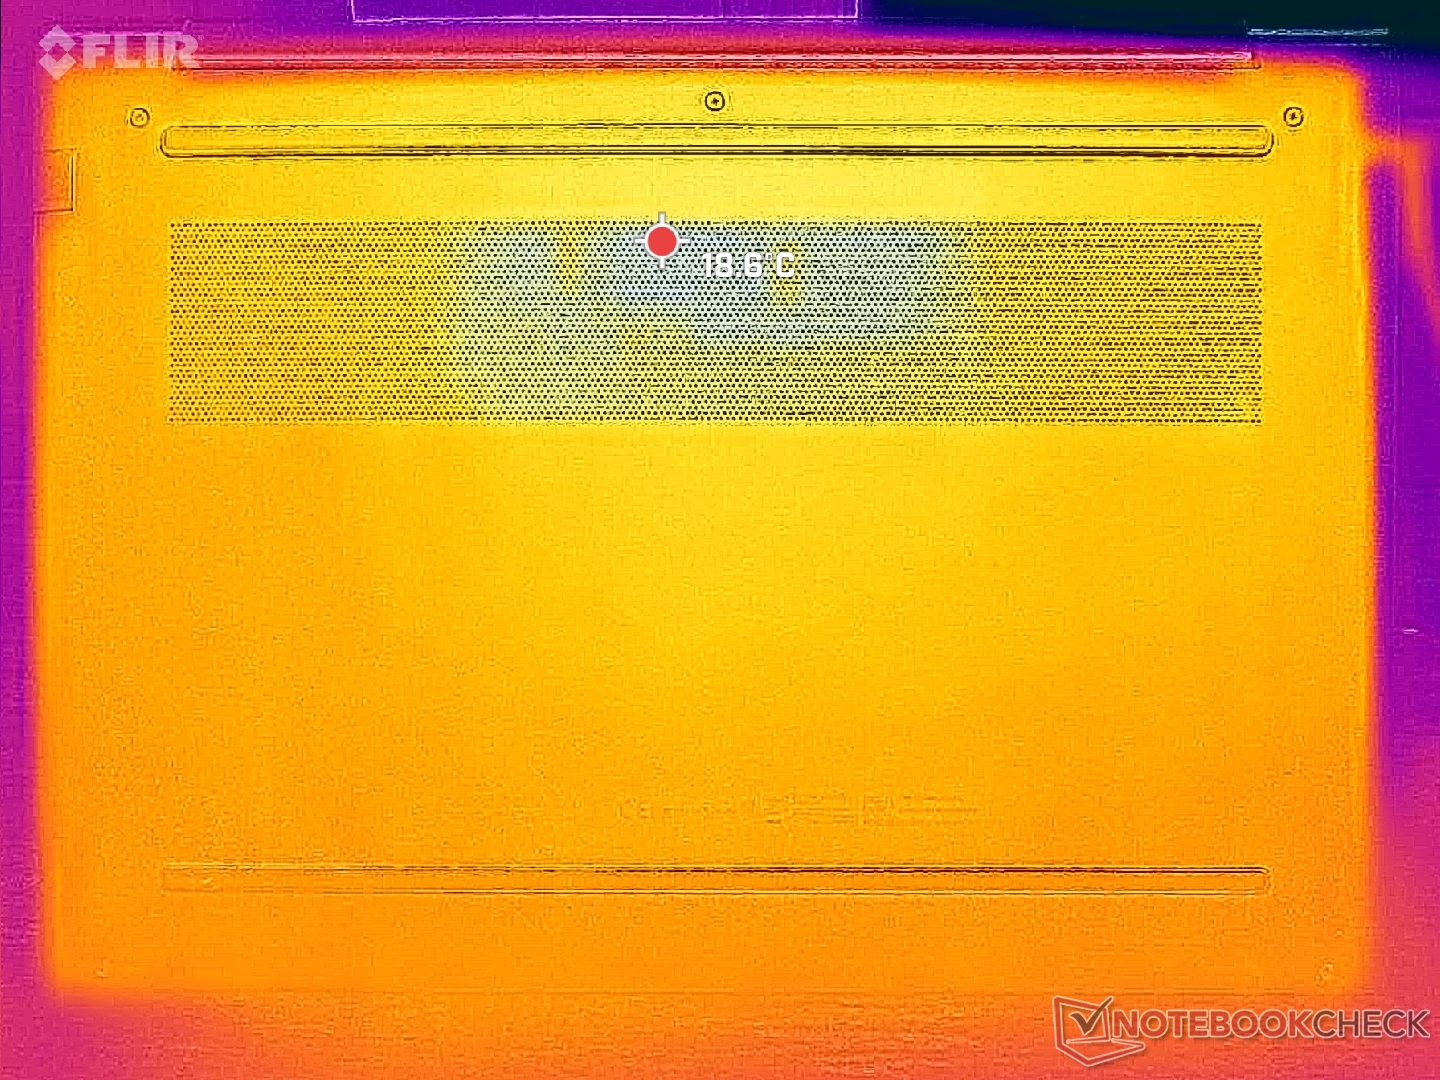
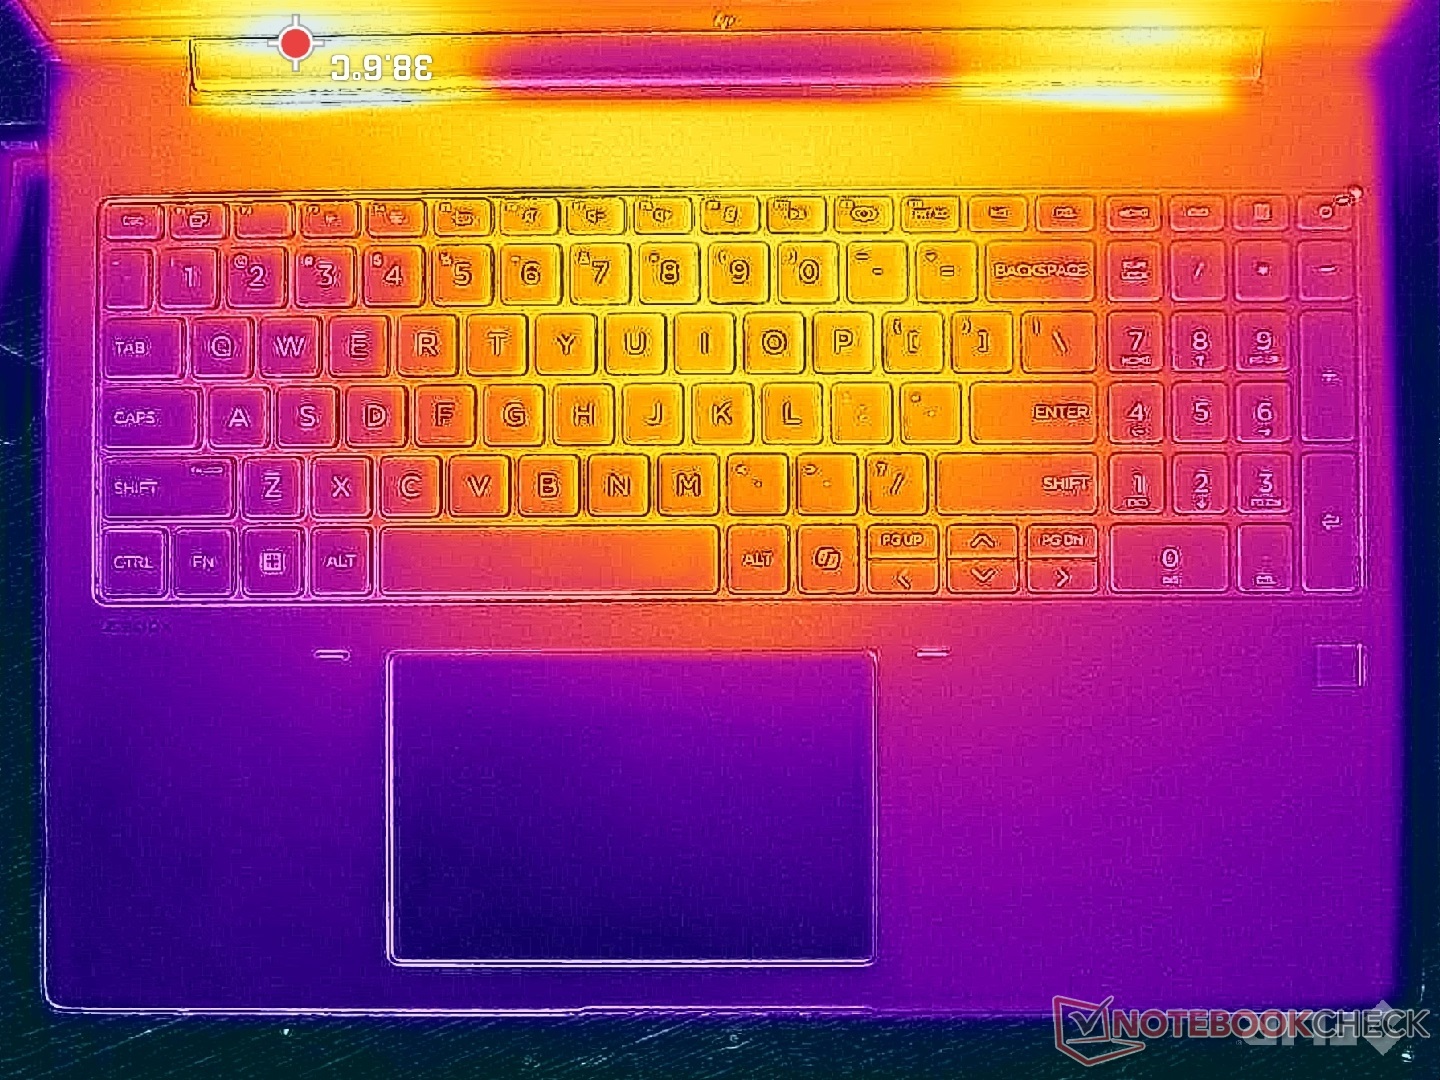
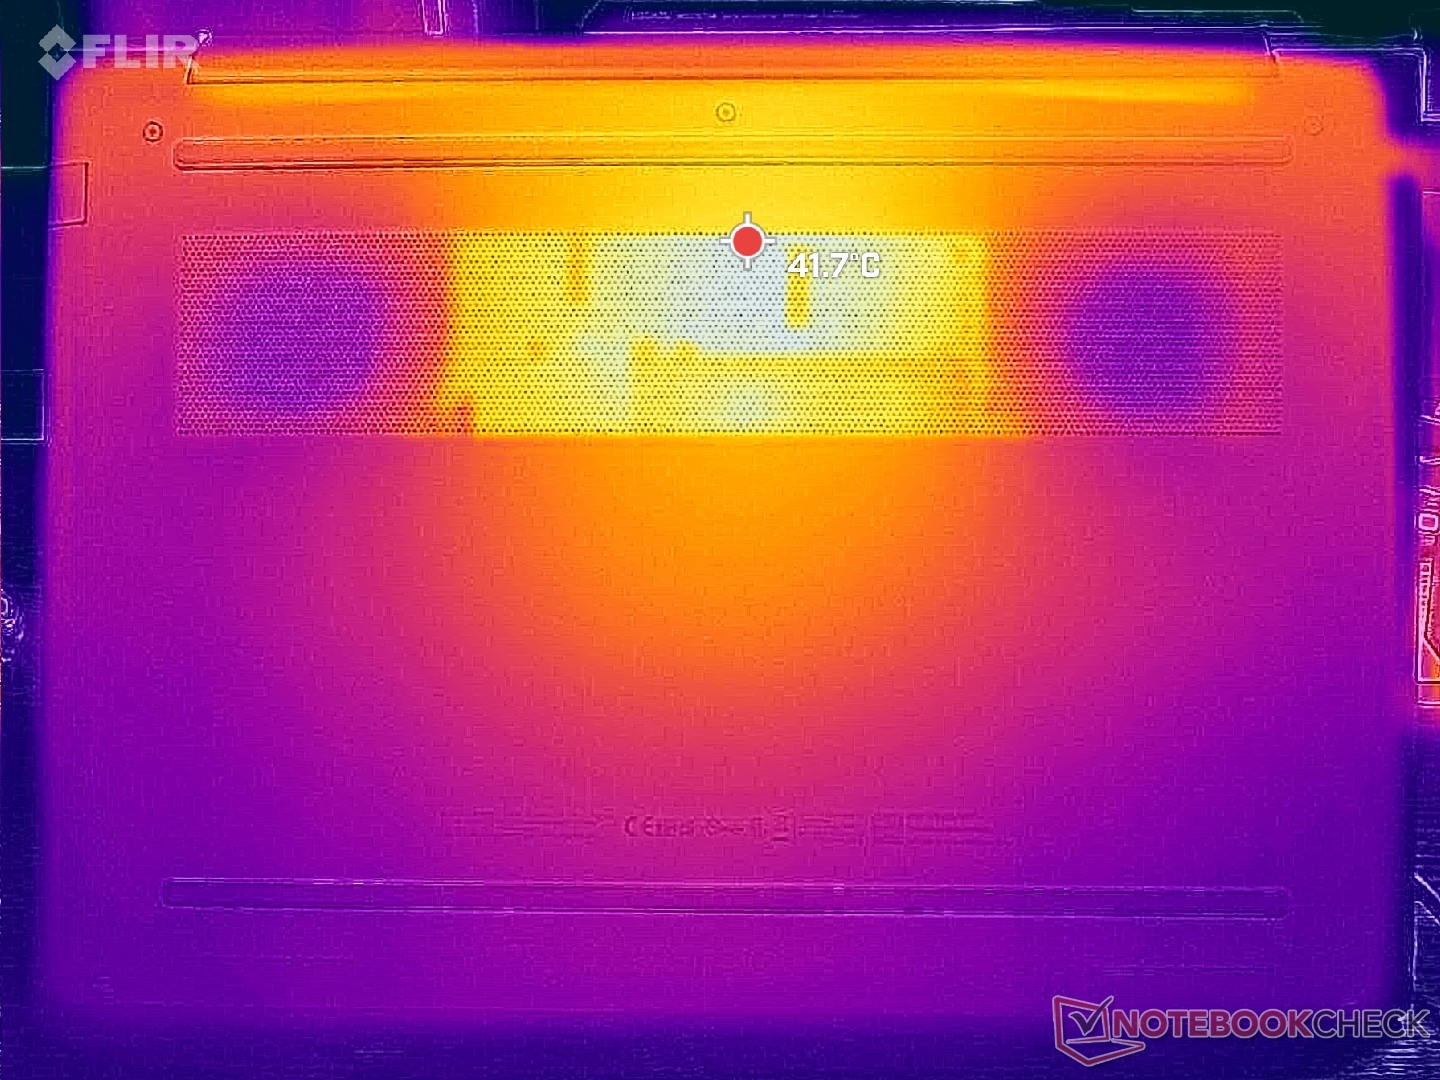
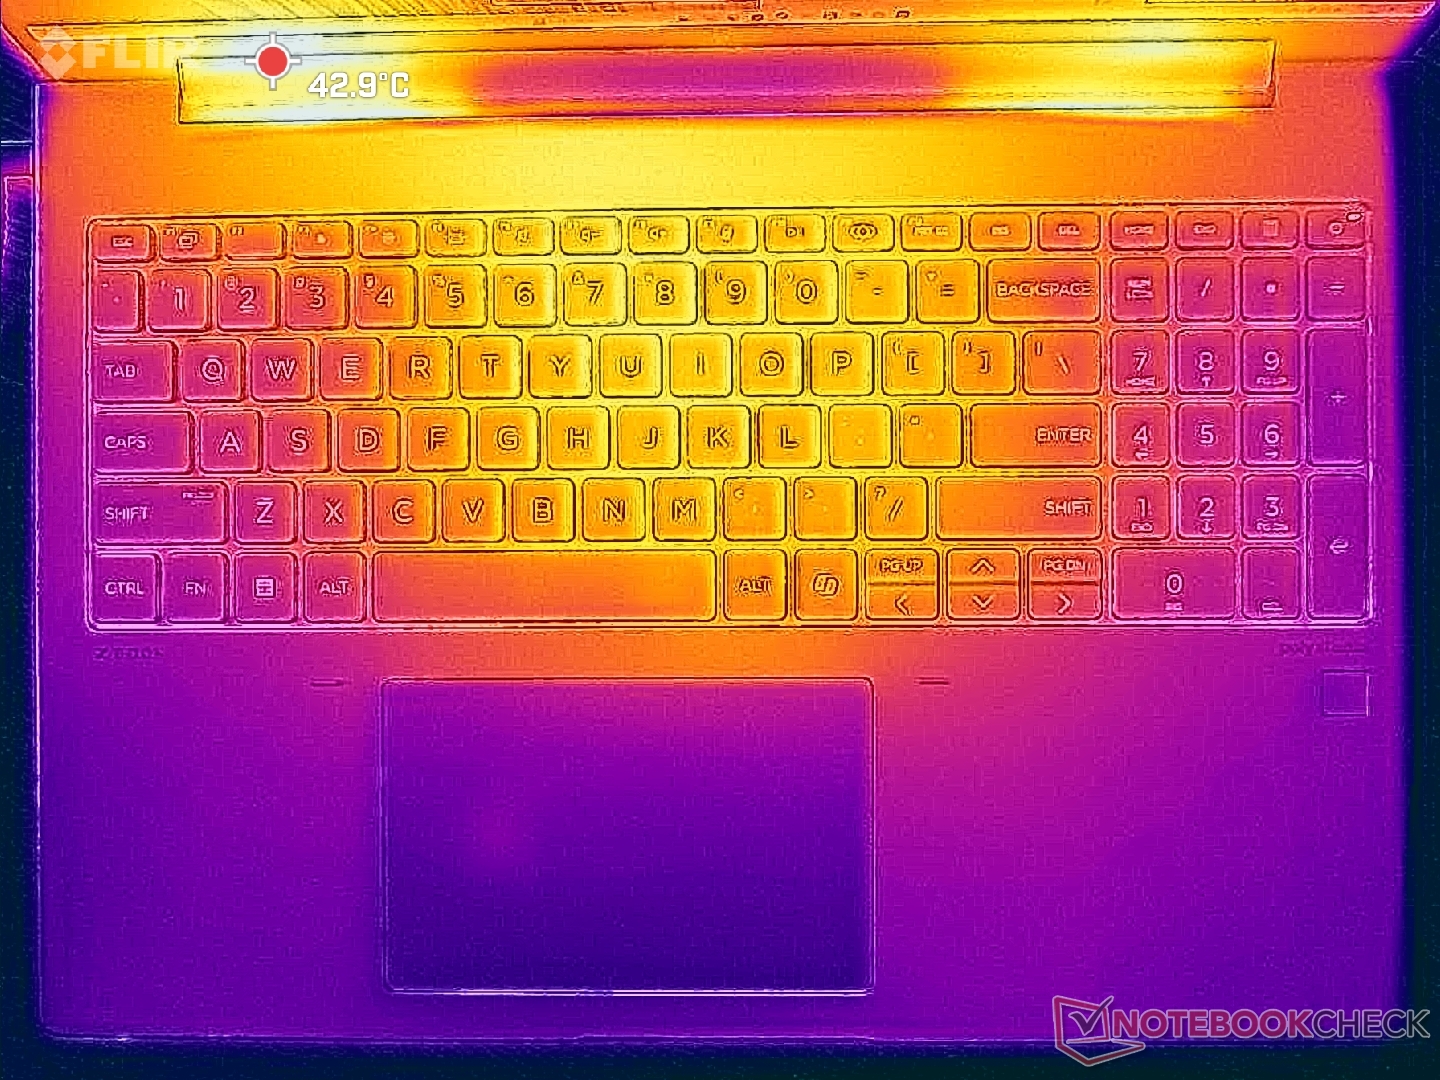
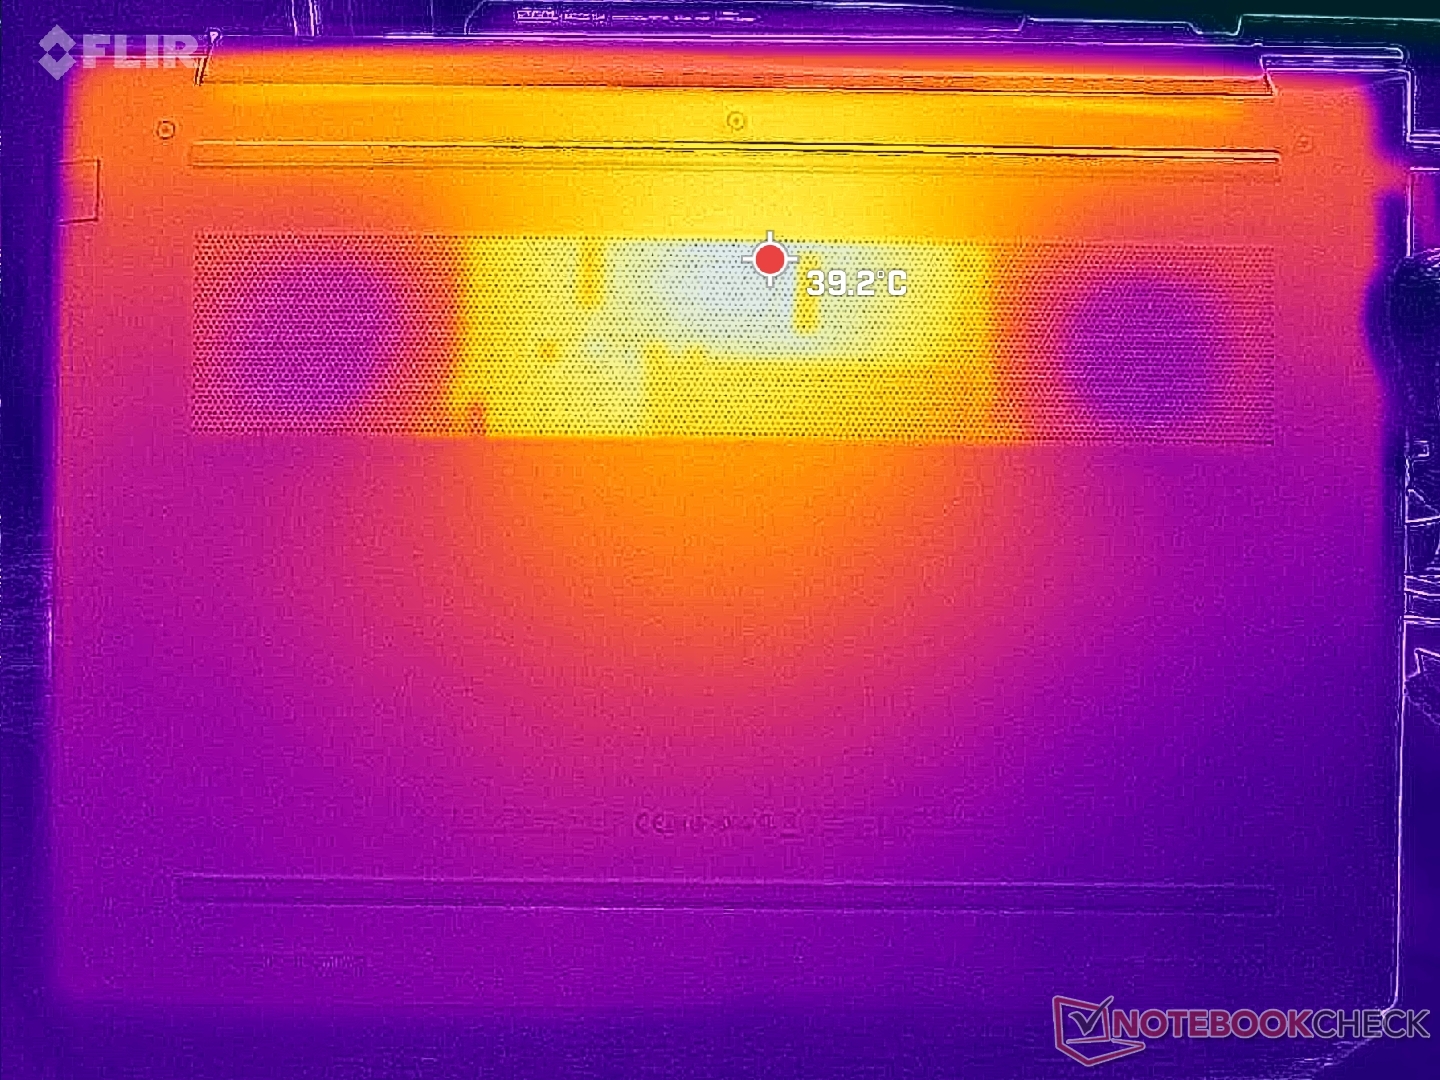
Temperatura
Temperatury powierzchni są generalnie niższe w naszej nowej 16-calowej obudowie, szczególnie w odniesieniu do dolnej pokrywy. Gorące punkty na spodzie osiągają zaledwie 41 C podczas pracy z wymagającymi obciążeniami w porównaniu do 48 C w starszym ZBooku Power 15 G10. Gorący punkt na środku klawiatury również osiąga 41 C, podczas gdy podpórki pod nadgarstki i boki pozostają chłodniejsze i wygodniejsze dla dłoni i palców.
W porównaniu do bardziej wydajnego Precision 5690dell jest jeszcze cieplejszy na klawiaturze, a jednocześnie chłodniejszy na dolnej powierzchni.
(±) Maksymalna temperatura w górnej części wynosi 40.6 °C / 105 F, w porównaniu do średniej 38.2 °C / 101 F , począwszy od 22.2 do 69.8 °C dla klasy Workstation.
(±) Dno nagrzewa się maksymalnie do 40.6 °C / 105 F, w porównaniu do średniej 41.2 °C / 106 F
(+) W stanie bezczynności średnia temperatura górnej części wynosi 24.6 °C / 76 F, w porównaniu ze średnią temperaturą urządzenia wynoszącą 32 °C / ### class_avg_f### F.
(+) 3: The average temperature for the upper side is 30.1 °C / 86 F, compared to the average of 32 °C / 90 F for the class Workstation.
(+) Podpórki pod nadgarstki i touchpad są chłodniejsze niż temperatura skóry i maksymalnie 27.2 °C / 81 F i dlatego są chłodne w dotyku.
(±) Średnia temperatura obszaru podparcia dłoni w podobnych urządzeniach wynosiła 27.8 °C / 82 F (+0.6 °C / 1 F).
| HP ZBook Power 16 G11 A AMD Ryzen 7 8845HS, NVIDIA RTX 2000 Ada Generation Laptop GPU | HP ZBook Power 15 G10 AMD Ryzen 7 PRO 7840HS, NVIDIA RTX 2000 Ada Generation Laptop GPU | HP ZBook Fury 16 G11 Intel Core i9-14900HX, NVIDIA RTX 3500 Ada Generation Laptop GPU | Lenovo ThinkPad P1 Gen 7 21KV001SGE Intel Core Ultra 7 155H, NVIDIA GeForce RTX 4060 Laptop GPU | Lenovo ThinkPad P16s G2 21K9000CGE AMD Ryzen 7 PRO 7840U, AMD Radeon 780M | Dell Precision 5690 Intel Core Ultra 9 185H, Nvidia RTX 5000 Ada Generation Laptop GPU | |
|---|---|---|---|---|---|---|
| Heat | -7% | -26% | -8% | -9% | -8% | |
| Maximum Upper Side * | 40.6 | 42.4 -4% | 42.2 -4% | 50.3 -24% | 42.7 -5% | 46.6 -15% |
| Maximum Bottom * | 40.6 | 47.8 -18% | 48 -18% | 38 6% | 47.2 -16% | 33 19% |
| Idle Upper Side * | 26 | 26.8 -3% | 37 -42% | 28.3 -9% | 27.8 -7% | 32.4 -25% |
| Idle Bottom * | 26.6 | 27.2 -2% | 36.8 -38% | 27.3 -3% | 28.4 -7% | 29.4 -11% |
* ... im mniej tym lepiej
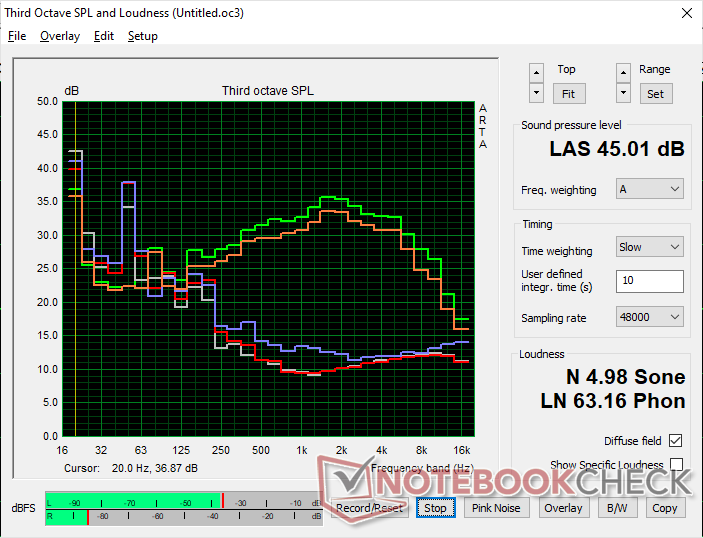
Głośniki
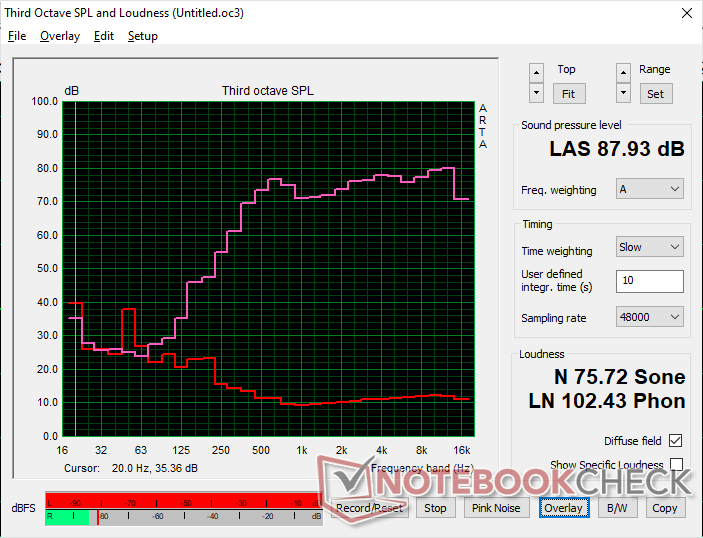
HP ZBook Power 16 G11 A analiza dźwięku
(+) | głośniki mogą odtwarzać stosunkowo głośno (87.9 dB)
Bas 100 - 315 Hz
(-) | prawie brak basu - średnio 28.1% niższa od mediany
(±) | liniowość basu jest średnia (9% delta do poprzedniej częstotliwości)
Średnie 400 - 2000 Hz
(+) | zbalansowane środki średnie - tylko 1.9% od mediany
(+) | średnie są liniowe (4.8% delta do poprzedniej częstotliwości)
Wysokie 2–16 kHz
(+) | zrównoważone maksima - tylko 3.6% od mediany
(+) | wzloty są liniowe (2.4% delta do poprzedniej częstotliwości)
Ogólnie 100 - 16.000 Hz
(±) | liniowość ogólnego dźwięku jest średnia (15.1% różnicy w stosunku do mediany)
W porównaniu do tej samej klasy
» 29% wszystkich testowanych urządzeń w tej klasie było lepszych, 7% podobnych, 63% gorszych
» Najlepszy miał deltę 7%, średnia wynosiła ###średnia###%, najgorsza wynosiła 35%
W porównaniu do wszystkich testowanych urządzeń
» 19% wszystkich testowanych urządzeń było lepszych, 4% podobnych, 77% gorszych
» Najlepszy miał deltę 4%, średnia wynosiła ###średnia###%, najgorsza wynosiła 134%
Apple MacBook Pro 16 2021 M1 Pro analiza dźwięku
(+) | głośniki mogą odtwarzać stosunkowo głośno (84.7 dB)
Bas 100 - 315 Hz
(+) | dobry bas - tylko 3.8% od mediany
(+) | bas jest liniowy (5.2% delta do poprzedniej częstotliwości)
Średnie 400 - 2000 Hz
(+) | zbalansowane środki średnie - tylko 1.3% od mediany
(+) | średnie są liniowe (2.1% delta do poprzedniej częstotliwości)
Wysokie 2–16 kHz
(+) | zrównoważone maksima - tylko 1.9% od mediany
(+) | wzloty są liniowe (2.7% delta do poprzedniej częstotliwości)
Ogólnie 100 - 16.000 Hz
(+) | ogólny dźwięk jest liniowy (4.6% różnicy w stosunku do mediany)
W porównaniu do tej samej klasy
» 0% wszystkich testowanych urządzeń w tej klasie było lepszych, 0% podobnych, 100% gorszych
» Najlepszy miał deltę 5%, średnia wynosiła ###średnia###%, najgorsza wynosiła 45%
W porównaniu do wszystkich testowanych urządzeń
» 0% wszystkich testowanych urządzeń było lepszych, 0% podobnych, 100% gorszych
» Najlepszy miał deltę 4%, średnia wynosiła ###średnia###%, najgorsza wynosiła 134%
Zarządzanie energią
Zużycie energii
Poziomy zużycia i zachowanie są podobne do tego, co zaobserwowaliśmy na ZBook Power 15 G10, co nie jest zaskakujące, biorąc pod uwagę, że koperta mocy pozostaje taka sama między nimi. Być może najbardziej zauważalna różnica dotyczy niższego zużycia energii o około 25 W podczas jednoczesnego uruchamiania Prime95 i FurMark. Można to przypisać silniejszemu dławieniu temperatur rdzenia chłodzącego podczas uruchamiania takich obciążeń, jak wspomniano w sekcji Stress Test powyżej.
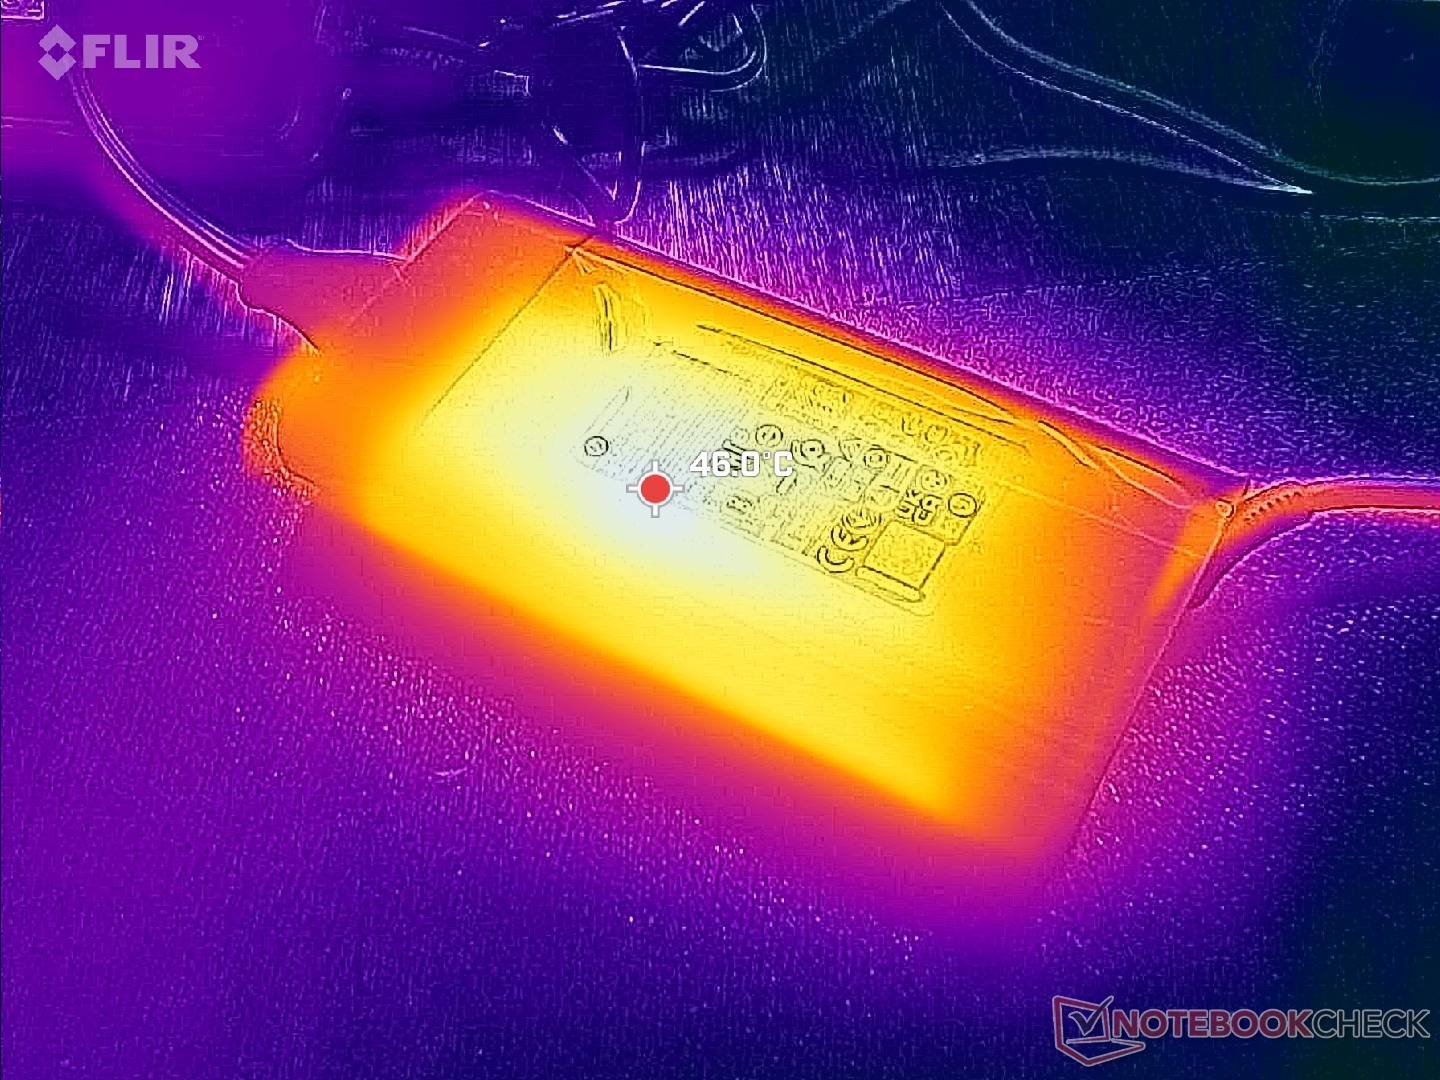
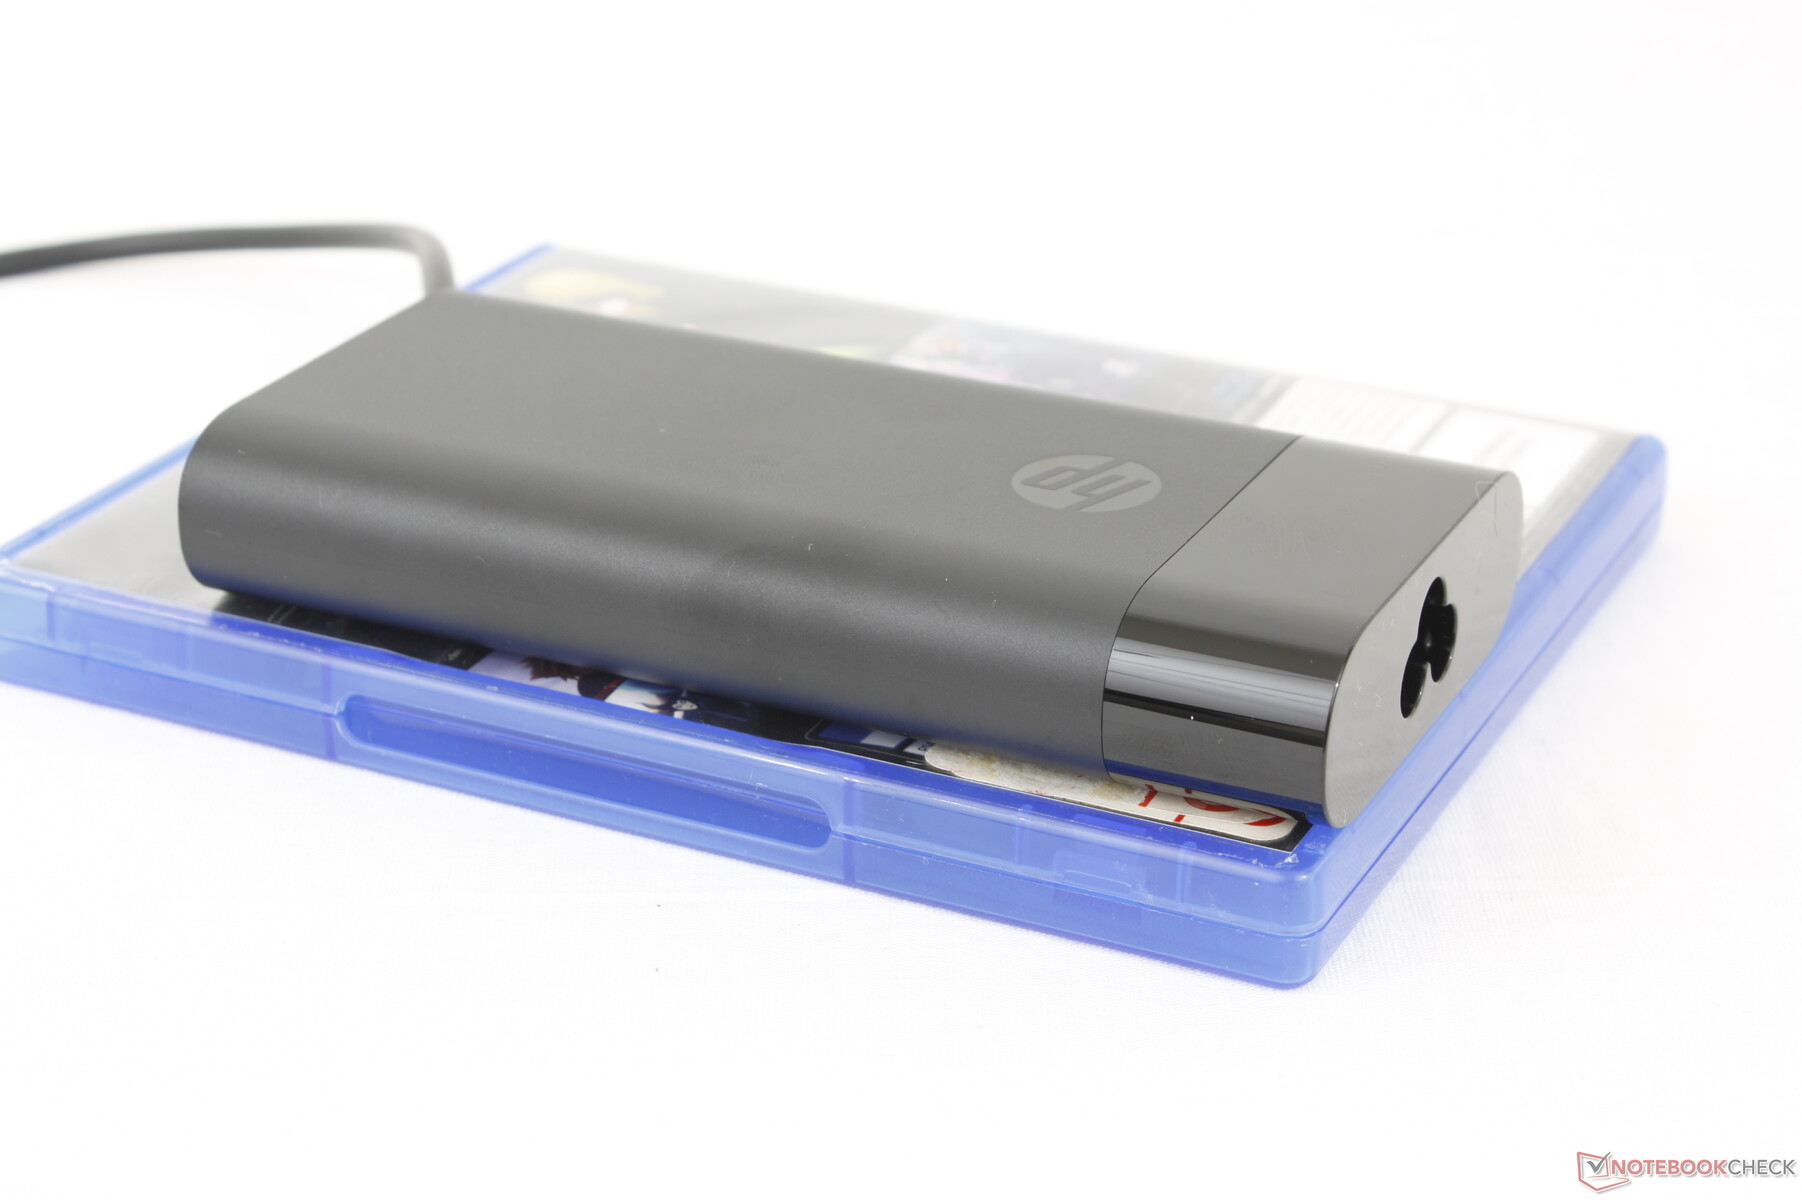
Jesteśmy w stanie zarejestrować tymczasowy maksymalny pobór mocy 155 W ze średniej wielkości (~13,8 x 6,5 x 2,2 cm) zasilacza sieciowego 150 W.
| wyłączony / stan wstrzymania | |
| luz | |
| obciążenie |
|
Legenda:
min: | |
| HP ZBook Power 16 G11 A R7 8845HS, NVIDIA RTX 2000 Ada Generation Laptop GPU, Samsung PM9A1 MZVL22T0HBLB, IPS, 2560x1600, 16" | HP ZBook Power 15 G10 R7 PRO 7840HS, NVIDIA RTX 2000 Ada Generation Laptop GPU, WDC PC SN810 2TB, IPS, 2560x1440, 15.6" | HP ZBook Fury 16 G11 i9-14900HX, NVIDIA RTX 3500 Ada Generation Laptop GPU, SK hynix PC801 HFS001TEJ9X101N, IPS, 3840x2400, 16" | Lenovo ThinkPad P1 Gen 7 21KV001SGE Ultra 7 155H, NVIDIA GeForce RTX 4060 Laptop GPU, Kioxia XG8 KXG8AZNV1T02, IPS LED, 2560x1600, 16" | Lenovo ThinkPad P16s G2 21K9000CGE R7 PRO 7840U, Radeon 780M, SK hynix PC801 HFS001TEJ9X162N, OLED, 3840x2400, 16" | Dell Precision 5690 Ultra 9 185H, NVIDIA RTX 5000 Ada Generation Laptop GPU, 2x Samsung PM9A1 1TB (RAID 0), OLED, 3840x2400, 16" | |
|---|---|---|---|---|---|---|
| Power Consumption | -13% | -80% | -35% | 20% | -67% | |
| Idle Minimum * | 4.6 | 5.3 -15% | 8.6 -87% | 7.3 -59% | 6.1 -33% | 7.9 -72% |
| Idle Average * | 10 | 9.9 1% | 14.8 -48% | 12.3 -23% | 6.5 35% | 12 -20% |
| Idle Maximum * | 10.6 | 16.7 -58% | 15.7 -48% | 17.9 -69% | 7 34% | 28.6 -170% |
| Load Average * | 60.9 | 61.3 -1% | 129.4 -112% | 78.2 -28% | 56.6 7% | 98.8 -62% |
| Cyberpunk 2077 ultra external monitor * | 92.8 | 192.6 -108% | 117.7 -27% | |||
| Cyberpunk 2077 ultra * | 96.8 | 199.4 -106% | 123.5 -28% | |||
| Load Maximum * | 154.8 | 145.3 6% | 236.1 -53% | 167.5 -8% | 68.3 56% | 174.8 -13% |
| Witcher 3 ultra * | 87.9 | 61.2 | 144.5 |
* ... im mniej tym lepiej
Power Consumption Cyberpunk / Stress Test
Power Consumption external Monitor
Żywotność baterii
Pojemność akumulatora nie zmieniła się w porównaniu do zeszłorocznego modelu ZBook Power 15 G10, pomimo aktualizacji obudowy. Być może przypadkowo, czas pracy pozostaje prawie taki sam i wynosi nieco ponad 9,5 godziny rzeczywistego przeglądania sieci WLAN przed automatycznym wyłączeniem.
Ładowanie od stanu pustego do pełnej pojemności jest stosunkowo szybkie i trwa poniżej 70 minut. Ładowanie przez USB-C jest obsługiwane, choć z mniejszą prędkością.
| HP ZBook Power 16 G11 A R7 8845HS, NVIDIA RTX 2000 Ada Generation Laptop GPU, 83 Wh | HP ZBook Power 15 G10 R7 PRO 7840HS, NVIDIA RTX 2000 Ada Generation Laptop GPU, 83 Wh | HP ZBook Fury 16 G11 i9-14900HX, NVIDIA RTX 3500 Ada Generation Laptop GPU, 95 Wh | Lenovo ThinkPad P1 Gen 7 21KV001SGE Ultra 7 155H, NVIDIA GeForce RTX 4060 Laptop GPU, 90 Wh | Lenovo ThinkPad P16s G2 21K9000CGE R7 PRO 7840U, Radeon 780M, 84 Wh | Dell Precision 5690 Ultra 9 185H, NVIDIA RTX 5000 Ada Generation Laptop GPU, 98 Wh | |
|---|---|---|---|---|---|---|
| Czasy pracy | 3% | -31% | 7% | -1% | -6% | |
| Reader / Idle | 1566 | |||||
| WiFi v1.3 | 582 | 601 3% | 402 -31% | 595 2% | 635 9% | 549 -6% |
| Load | 103 | 114 11% | 92 -11% | |||
| H.264 | 797 |
Za
Przeciw
Werdykt - Większy ekran, ale taka sama wydajność
ZBook Power 16 G11 zastępuje serię ZBook Power 15 większą i cięższą 16-calową konstrukcją. Można by przypuszczać, że większa obudowa prowadzi do szybszej wydajności, ale niestety tak nie jest. Nowe procesory Hawk Point nie oferują zbyt wiele w porównaniu z zeszłorocznymi opcjami Phoenix, podczas gdy opcje GPU są dokładnie takie same, aż do sufitów TGP. Przeprojektowanie obudowy było szansą HP na ulepszenie rozwiązania chłodzącego i wyciśnięcie większej wydajności z procesorów, ale przypuszczamy, że producent nie chciał zbytnio wkraczać na terytorium wyższej klasy ZBook Fury.
Opcje wyświetlania są również nieco rozczarowujące jak na stację roboczą. Poza unikalną opcją 1000 nitów, nie ma żadnych godnych uwagi funkcji, takich jak OLED, kolory P3 lub rozdzielczość 4K. Takie panele sprawiłyby, że większy rozmiar ekranu byłby znacznie bardziej atrakcyjny w porównaniu z poprzednią 15,6-calową wersją. Zamiast tego użytkownicy są ograniczeni do 2K i IPS.
ZBook Power 16 G11 nie oferuje wiele więcej w porównaniu do swojego poprzednika poza większym 16-calowym ekranem. Wydajność i funkcje są prawie takie same w obu modelach.
HP nadal jest mocną stacją roboczą średniej klasy, pomimo braku ulepszeń wydajności i nowych funkcji. Wydajność procesora jest nadal zauważalnie szybsza niż w ThinkPad P16s G2 który jest ograniczony do procesorów z serii Ryzen-U, a jednocześnie jest tańszy niż popularny Dell Precision 5690 w konfiguracji z tym samym GPU. Jeśli jednak posiadają już Państwo ZBook Power 15 G10, cięższa 16-calowa wersja może wydawać się krokiem w bok.
Cena i dostępność
HP dostarcza obecnie ZBook Power 16 G11 A w cenie od 1140 USD w podstawowej konfiguracji z procesorem Ryzen 5 i iGPU. Nasza konfiguracja testowa z procesorem Ryzen 7, kartą graficzną RTX 2000 Ada i wyświetlaczem 1600p kosztuje około 2000 USD.
Uwaga: Niedawno zaktualizowaliśmy nasz system oceny i wyniki wersji 8 nie są porównywalne z wynikami wersji 7. Więcej informacji znajdą Państwo tutaj .
HP ZBook Power 16 G11 A
- 30/09/2024 v8
Allen Ngo
 Total Sustainability Score:
 Przezroczystość
Wyboru urządzeń do recenzji dokonuje nasza redakcja. Próbka testowa została udostępniona autorowi jako pożyczka od producenta lub sprzedawcy detalicznego na potrzeby tej recenzji. Pożyczkodawca nie miał wpływu na tę recenzję, producent nie otrzymał też kopii tej recenzji przed publikacją. Nie było obowiązku publikowania tej recenzji. Nigdy nie przyjmujemy rekompensaty ani płatności w zamian za nasze recenzje. Jako niezależna firma medialna, Notebookcheck nie podlega władzy producentów, sprzedawców detalicznych ani wydawców.
Tak testuje Notebookcheck
Każdego roku Notebookcheck niezależnie sprawdza setki laptopów i smartfonów, stosując standardowe procedury, aby zapewnić porównywalność wszystkich wyników. Od około 20 lat stale rozwijamy nasze metody badawcze, ustanawiając przy tym standardy branżowe. W naszych laboratoriach testowych doświadczeni technicy i redaktorzy korzystają z wysokiej jakości sprzętu pomiarowego. Testy te obejmują wieloetapowy proces walidacji. Nasz kompleksowy system ocen opiera się na setkach uzasadnionych pomiarów i benchmarków, co pozwala zachować obiektywizm.Price comparison

