Notebookcheck Logo

Debiut wydajności Nvidia RTX 3500 Ada: Recenzja stacji roboczej HP ZBook Fury 16 G11
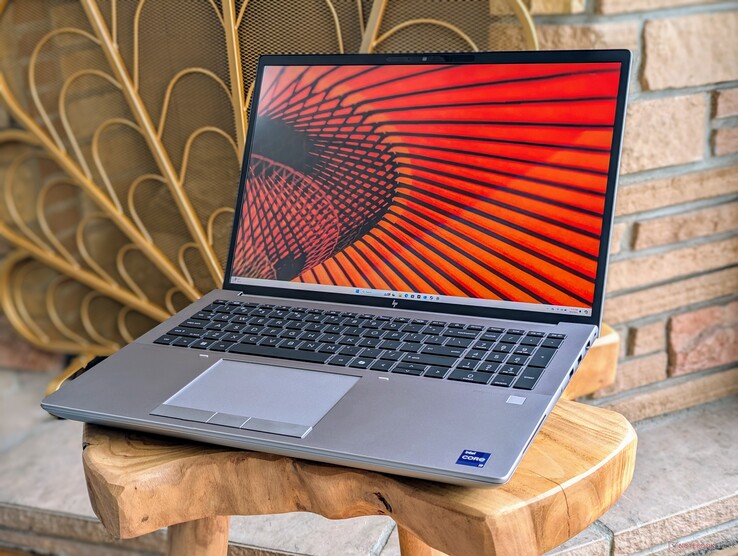
Odświeżony Core i9-14900HX Raptor Lake-HX.

Seria ZBook Fury 16 została zaktualizowana o nowe opcje procesorów Raptor Lake-HX, które zapewniają szybszą wydajność. Różnica jest jednak mniejsza niż byśmy chcieli i w większości scenariuszy niezauważalna.
Workstation Meteor Lake Laptop / Notebook

ZBook Fury 16 G11 z roku 2024 jest następcą modelu 2023 Fury 16 G10 dzięki wymianie procesorów Raptor Lake-HX na nowsze opcje Raptor Lake-HX Refresh. Poza tym, obudowa pozostaje identyczna z Fury 16 G10 lub Fury 16 G9, podobnie jak wiele konfigurowalnych opcji. Zalecamy zapoznanie się z naszą recenzją Fury 16 G9 aby dowiedzieć się więcej o fizycznych cechach tego modelu.

Nasza jednostka testowa to konfiguracja z górnej półki średniej z procesorem Core i9-14900HX, GPU RTX 3500 Ada i wyświetlaczem IPS 120 Hz 3840 x 2400 za około 3300 USD. Inne jednostki SKU zaczynają się od Core i5-13600HX do RTX 5000 Ada i ekranu dotykowego OLED 2400p. Nie ma opcji procesorów Meteor Lake.

Konkurentami ZBook Fury 16 G11 są inne 16-calowe stacje robocze, takie jak Dell Precision 5690, Lenovo ThinkPad P16 G2lub Asus ProArt Studiobook 16.

Więcej recenzji HP:

HP ZBook Fury 16 G11 (ZBook Fury 16 Rodzina)
Procesor
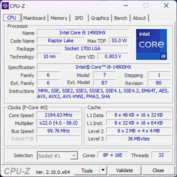
Intel Core i9-14900HX 24 x 1.6 - 5.8 GHz, 139 W PL2 / Short Burst, 69 W PL1 / Sustained, Raptor Lake-HX Refresh
Karta grafiki
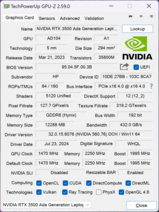
NVIDIA RTX 3500 Ada Generation Laptop GPU - 12 GB VRAM, rdzeń: 1995 MHz, pamięć: 2250 MHz, 105 W TDP, GDDR6, 560.76, Optimus
Pamięć
64 GB 
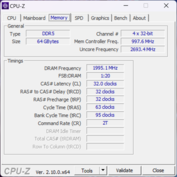
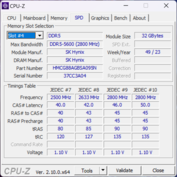
, SK Hynix, DDR5-5600, Dual-Channel, 32-32-32-63
Matryca
16.00 cali 16:10, 3840 x 2400 pikseli 283 PPI, AUO87A8, IPS, refleksująca: nie, 120 Hz
Chipset
Intel WM790 (Raptor Lake-S PCH)
Dysk twardy
SK hynix PC801 HFS001TEJ9X101N, 1024 GB 
Karta dźwiękowa
Intel Raptor Lake-S PCH - cAVS
Złącza
2 USB 3.0, 2 USB 3.1 Gen2, 2 Thunderbolt, USB-C Power Delivery (PD), 1 HDMI, 3 DisplayPort, 1 blokada Kensingtona, czytnik kart: SD, 1 czytnik linii papilarnych, Brightness Sensor
Łączność
Intel Ethernet Connection I219-V (10/100/1000MBit/s), Bluetooth 5.3
Gabaryty
wysokość x szerokość x głębokość (mm): 28.5 x 363 x 250
Akumulator
95 Wh
System operacyjny
Microsoft Windows 11 Pro
Camera
kamerka: 1440p30
Primary Camera: 5 MPix
Inne
głośniki: Stereo, klawiatura: Chiclet, podświetlanie klawiatury: tak, MyHP, Audio Control, Wolf Security, Z Light Space, 36 miesiące(y) gwarancji
Waga
2.55 kg, zasilacz: 795 g
Cena
3300 USD
Note: The manufacturer may use components from different suppliers including display panels, drives or memory sticks with similar specifications.


Potencjalni konkurenci w porównaniu

Rating
Version
Date
Model
Weight
Height
Size
Resolution
Price
85.9 %v8
08/2024
HP ZBook Fury 16 G11
i9-14900HX, NVIDIA RTX 3500 Ada Generation Laptop GPU
2.6 kg28.5 mm16.00"3840x2400
92.3 %
v7 (old)
v7 (old)
09/2023
HP ZBook Fury 16 G10
i9-13950HX, NVIDIA RTX 5000 Ada Generation Laptop GPU
2.6 kg28.5 mm16.00"3840x2400
91 %
v7 (old)
v7 (old)
06/2023
HP ZBook Fury 16 G9
i9-12950HX, RTX A5500 Laptop GPU
2.6 kg28.5 mm16.00"3840x2400
88.3 %
v7 (old)
v7 (old)
05/2024
Dell Precision 5690
Ultra 9 185H, NVIDIA RTX 5000 Ada Generation Laptop GPU
2.3 kg22.17 mm16.00"3840x2400
90.2 %
v7 (old)
v7 (old)
03/2024
Lenovo ThinkPad P16 G2 21FA000FGE
i7-13700HX, NVIDIA RTX 2000 Ada Generation Laptop GPU
3 kg30.23 mm16.00"2560x1600
90.1 %
v7 (old)
v7 (old)
12/2023
Lenovo ThinkPad P1 G6 21FV001KUS
i7-13800H, NVIDIA GeForce RTX 4080 Laptop GPU
1.9 kg17.5 mm16.00"3480x2400
86.1 %
v7 (old)
v7 (old)
06/2023
Asus ProArt Studiobook 16 OLED H7604
i9-13980HX, NVIDIA GeForce RTX 4070 Laptop GPU
2.4 kg23.9 mm16.00"3200x2000

Wskazówka: Nasz system ocen został niedawno zaktualizowany, a wyniki wersji 8 nie są porównywalne z wynikami wersji 7. Dodatkowe informacje znajdą Państwo hier verfügbar.

Uwaga: Niedawno zaktualizowaliśmy nasz system oceniania i wyniki wersji 8 nie są porównywalne z wynikami wersji 7. Więcej informacji znajdą Państwo tutaj .

Sprawa

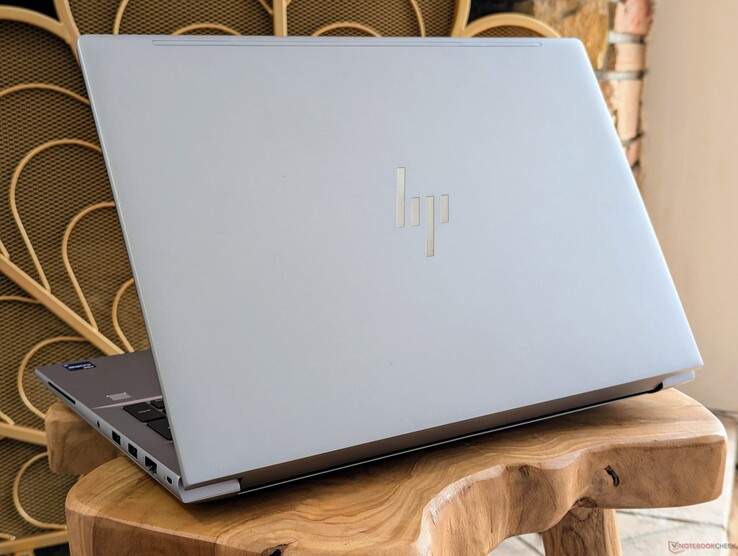
Łatwym sposobem na odróżnienie ZBook Fury 16 G11 od wcześniejszych iteracji jest poszukiwanie klawisza Co-Pilot na klawiaturze. Poza tym, konstrukcja obudowy pozostaje taka sama jak wcześniej.

Porównanie rozmiarów

364 mm 266 mm 30.23 mm 3 kg363 mm 250 mm 28.5 mm 2.6 kg363 mm 250 mm 28.5 mm 2.6 kg363 mm 250 mm 28.5 mm 2.6 kg356 mm 271 mm 23.9 mm 2.4 kg359.5 mm 253.8 mm 17.5 mm 1.9 kg353.68 mm 240.33 mm 22.17 mm 2.3 kg297 mm 210 mm 1 mm 5.7 g

Łączność

Po prawej stronie: Czytnik kart inteligentnych, zestaw słuchawkowy 3,5 mm, 2x USB-A 5 Gb/s, RJ-45 1 Gb/s, Nano lock
Po lewej: zasilacz sieciowy, 2x USB-C 3.2 Gen. 2 z Thunderbolt 4 + DisplayPort 1.4, mini-DisplayPort 1.4, HDMI 2.1, czytnik kart SD. Proszę zwrócić uwagę na ciasno upakowane porty USB-C i zasilacza sieciowego

Czytnik kart SD

SD Card Reader
average JPG Copy Test (av. of 3 runs)
Lenovo ThinkPad P1 G6 21FV001KUS
Intel Core i7-13800H (Toshiba Exceria Pro SDXC 64 GB UHS-II)
86.2 MB/s +1%
HP ZBook Fury 16 G11
Intel Core i9-14900HX (Toshiba Exceria Pro SDXC 64 GB UHS-II)
85.7 MB/s
HP ZBook Fury 16 G10
Intel Core i9-13950HX (Toshiba Exceria Pro SDXC 64 GB UHS-II)
80.1 MB/s -7%
HP ZBook Fury 16 G9
Intel Core i9-12950HX (PNY EliteX-PRO60)
76.3 MB/s -11%
Asus ProArt Studiobook 16 OLED H7604
Intel Core i9-13980HX (Angelibird AV Pro V60)
73.7 MB/s -14%
Lenovo ThinkPad P16 G2 21FA000FGE
Intel Core i7-13700HX
54.8 MB/s -36%
maximum AS SSD Seq Read Test (1GB)
HP ZBook Fury 16 G11
Intel Core i9-14900HX (Toshiba Exceria Pro SDXC 64 GB UHS-II)
91.6 MB/s
Lenovo ThinkPad P1 G6 21FV001KUS
Intel Core i7-13800H (Toshiba Exceria Pro SDXC 64 GB UHS-II)
91.3 MB/s 0%
HP ZBook Fury 16 G10
Intel Core i9-13950HX (Toshiba Exceria Pro SDXC 64 GB UHS-II)
87.62 MB/s -4%
HP ZBook Fury 16 G9
Intel Core i9-12950HX (PNY EliteX-PRO60)
86.6 MB/s -5%
Lenovo ThinkPad P16 G2 21FA000FGE
Intel Core i7-13700HX
85.1 MB/s -7%
Asus ProArt Studiobook 16 OLED H7604
Intel Core i9-13980HX (Angelibird AV Pro V60)
83.1 MB/s -9%

Komunikacja

WLAN został zaktualizowany z Intel AX211 do BE200 w celu zapewnienia właściwej obsługi Wi-Fi 7. W praktyce jednak większość użytkowników nadal będzie łączyć się z punktami dostępowymi Wi-Fi 6 lub 6E.

Networking
iperf3 transmit AXE11000
Asus ProArt Studiobook 16 OLED H7604
Intel Wi-Fi 6E AX211
1612 (1550min, 1553.77P1 - 1667max) MBit/s +84%
HP ZBook Fury 16 G10
Intel Wi-Fi 6E AX211
1416 (736min - 1514max) MBit/s +61%
Dell Precision 5690
Intel Wi-Fi 7 BE200 320MHz
1143 (813min - 1407max) MBit/s +30%
Lenovo ThinkPad P1 G6 21FV001KUS
Intel Wi-Fi 6E AX211
944 (576min - 1252max) MBit/s +8%
HP ZBook Fury 16 G11
 
878 (829min - 937max) MBit/s
HP ZBook Fury 16 G9
Intel Wi-Fi 6E AX211
849 (754min - 910max) MBit/s -3%
Lenovo ThinkPad P16 G2 21FA000FGE
Intel Wi-Fi 6E AX211
565 (508min - 662max) MBit/s -36%
iperf3 receive AXE11000
Asus ProArt Studiobook 16 OLED H7604
Intel Wi-Fi 6E AX211
1735 (1691min, 1696.22P1 - 1753max) MBit/s +104%
Lenovo ThinkPad P16 G2 21FA000FGE
Intel Wi-Fi 6E AX211
1583 (1445min - 1648max) MBit/s +86%
Dell Precision 5690
Intel Wi-Fi 7 BE200 320MHz
1459 (1375min - 1525max) MBit/s +71%
HP ZBook Fury 16 G9
Intel Wi-Fi 6E AX211
1344 (1230min - 1441max) MBit/s +58%
HP ZBook Fury 16 G10
Intel Wi-Fi 6E AX211
1324 (1224min - 1385max) MBit/s +55%
Lenovo ThinkPad P1 G6 21FV001KUS
Intel Wi-Fi 6E AX211
944 (570min - 1329max) MBit/s +11%
HP ZBook Fury 16 G11
 
852 (750min - 875max) MBit/s
iperf3 transmit AXE11000 6GHz
HP ZBook Fury 16 G11
 
1505 (760min - 1591max) MBit/s
HP ZBook Fury 16 G10
Intel Wi-Fi 6E AX211
1440 (730min - 1604max) MBit/s -4%
Dell Precision 5690
Intel Wi-Fi 7 BE200 320MHz
1228 (666min - 1448max) MBit/s -18%
Lenovo ThinkPad P1 G6 21FV001KUS
Intel Wi-Fi 6E AX211
827 (613min - 886max) MBit/s -45%
Lenovo ThinkPad P16 G2 21FA000FGE
Intel Wi-Fi 6E AX211
632 (556min - 717max) MBit/s -58%
iperf3 receive AXE11000 6GHz
Lenovo ThinkPad P16 G2 21FA000FGE
Intel Wi-Fi 6E AX211
1696 (1632min - 1734max) MBit/s +6%
HP ZBook Fury 16 G11
 
1599 (1565min - 1622max) MBit/s
Dell Precision 5690
Intel Wi-Fi 7 BE200 320MHz
1523 (1429min - 1570max) MBit/s -5%
HP ZBook Fury 16 G10
Intel Wi-Fi 6E AX211
1425 (1357min - 1461max) MBit/s -11%
Lenovo ThinkPad P1 G6 21FV001KUS
Intel Wi-Fi 6E AX211
1106 (1069min - 1138max) MBit/s -31%
0501001502002503003504004505005506006507007508008509009501000105011001150120012501300135014001450150015501600Tooltip
HP ZBook Fury 16 G11; iperf3 transmit AXE11000 6GHz; iperf 3.1.3: Ø1480 (760-1591)
HP ZBook Fury 16 G11; iperf3 receive AXE11000 6GHz; iperf 3.1.3: Ø1598 (1565-1622)

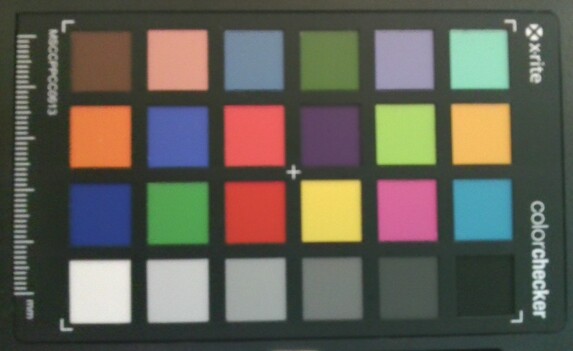
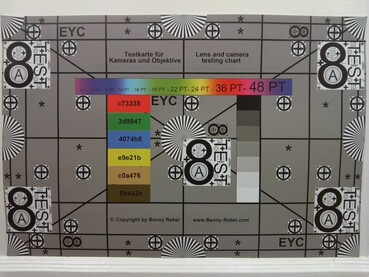
Kamera internetowa

ColorChecker
3.8 ∆E
6.2 ∆E
8 ∆E
8.5 ∆E
11.6 ∆E
10.3 ∆E
6.9 ∆E
2.1 ∆E
10.4 ∆E
5.6 ∆E
8 ∆E
7.5 ∆E
4.3 ∆E
3.8 ∆E
9.4 ∆E
5.9 ∆E
8.7 ∆E
10.4 ∆E
4.9 ∆E
1.9 ∆E
4.5 ∆E
5.4 ∆E
7.8 ∆E
9 ∆E
ColorChecker HP ZBook Fury 16 G11: 6.87 ∆E min: 1.86 - max: 11.57 ∆E

Konserwacja

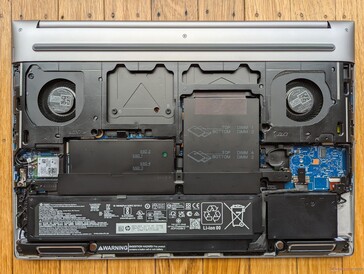
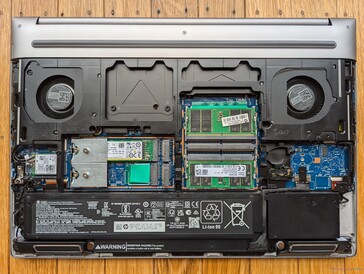
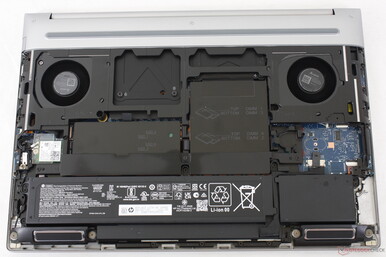
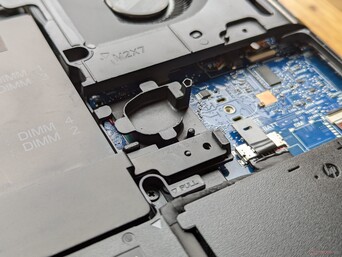
HP chwali się beznarzędziowym serwisowaniem swojej serii Fury 16 od modelu G9 na początku zeszłego roku. Podczas gdy dolny panel można było łatwo zsunąć bez użycia narzędzi, pamięć RAM i moduły SODIMM były nadal chronione przez aluminiową osłonę, której zdjęcie wymagało użycia śrubokręta. Aluminiowa osłona została przeprojektowana z zatrzaskami zamiast śrub w modelu G11, co oznacza, że użytkownicy mogą teraz instalować moduły pamięci RAM bez użycia jakichkolwiek narzędzi.

Dyski SSD są jednak nadal przymocowane do płyty głównej za pomocą śrub, więc podczas wymiany dysków nadal potrzebny jest śrubokręt. System może obsługiwać do czterech dysków SSD i czterech modułów pamięci RAM.

ZBook Fury 16 G11 z założoną metalową płytką
ZBook Fury 16 G11 z usuniętą metalową płytką
ZBook Fury 16 G9 dla porównania. Proszę zwrócić uwagę na dwie śruby mocujące metalową płytkę
Zbliżenie na nowe zatrzaski w Fury 16 G11. W modelach G9 i G10 poprzedniej generacji zastosowano zamiast nich śruby

Zrównoważony rozwój

Opakowanie w pełni nadaje się do recyklingu i składa się głównie z papieru. Zasilacz sieciowy jest jedynym elementem zapakowanym w folię.

Akcesoria i gwarancja

Pudełko detaliczne nie zawiera żadnych dodatków poza zasilaczem sieciowym i dokumentacją. Trzyletnia gwarancja producenta jest standardem w przypadku zakupu w USA.

Wyświetlacz

Dostępnych jest pięć opcji wyświetlania. Nasza konkretna jednostka testowa jest wyposażona w pogrubiony panel.

  • 3840 x 2400, OLED, ekran dotykowy, błyszczący, 400 nitów, 100% DCI-P3, 60 Hz
  • 3840 x 2400, IPS, bezdotykowy, matowy, 500 nitów, 100% DCI-P3, 120 Hz
  • 1920 x 1200, IPS, bezdotykowy, matowy, 400 nitów, 100% sRGB, 60 Hz
  • 1920 x 1200, IPS, bezdotykowy, matowy, 1000 nitów, 100% sRGB, 60 Hz, Sure View Integrated
  • 1920 x 1200, IPS, ekran dotykowy, błyszczący, 400 nitów, 100% sRGB, 60 Hz

Ten konkretny panel jest tym samym, który został dostarczony z naszym ZBook Fury 16 G10, więc wrażenia wizualne pozostają identyczne. Nabywcy, którzy zamierzają korzystać z laptopa na zewnątrz, mogą rozważyć opcję 1000 nitów, ale ten panel jest niestety powiązany z Sure View, co znacznie ogranicza kąty widzenia, utrudniając dzielenie się ekranem z innymi. Tymczasem opcja OLED oferuje znacznie lepsze poziomy czerni, aby zaspokoić potrzeby artystów cyfrowych i aplikacji do edycji multimediów, ale jej błyszcząca nakładka i skromna częstotliwość odświeżania 60 Hz mogą być wyłączone.

Dynamiczna częstotliwość odświeżania systemu Windows jest obsługiwana tylko do 60 Hz na naszym skonfigurowanym panelu.

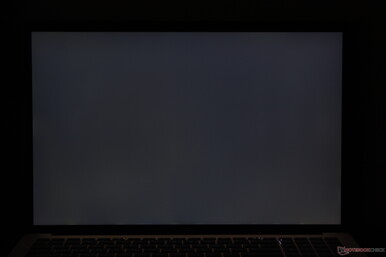
W naszej jednostce testowej nie wystąpiło nierównomierne podświetlenie
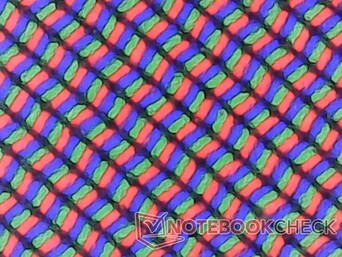
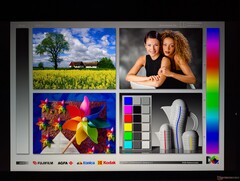
Obraz może wyglądać na lekko ziarnisty od matowej nakładki
466
cd/m²
496.6
cd/m²
502.2
cd/m²
418.3
cd/m²
457.6
cd/m²
476.4
cd/m²
427.9
cd/m²
464.5
cd/m²
488.3
cd/m²
podświetlenie ekranu
AUO87A8 tested with X-Rite i1Pro 2
maksimum: 502.2 cd/m² (Nits) średnia: 466.4 cd/m² Minimum: 24 cd/m²
rozświetlenie: 83 %
na akumulatorze: 457.6 cd/m²
kontrast: 1064:1 (czerń: 0.43 cd/m²)
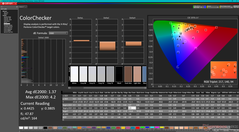
ΔE Color 2.78 | 0.5-29.43 Ø4.9, calibrated: 1.37
ΔE Greyscale 2 | 0.5-98 Ø5.2
86% AdobeRGB 1998 (Argyll 2.2.0 3D)
99.9% sRGB (Argyll 2.2.0 3D)
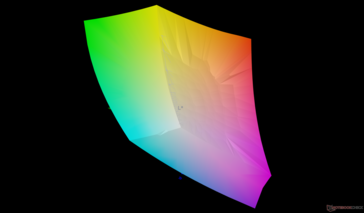
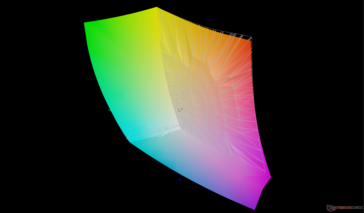
98.4% Display P3 (Argyll 2.2.0 3D)
Gamma: 2.28
HP ZBook Fury 16 G11
AUO87A8, IPS, 3840x2400, 16", 120 Hz
HP ZBook Fury 16 G10
AUO87A8, IPS, 3840x2400, 16", 120 Hz
HP ZBook Fury 16 G9
BOE0A52, IPS, 3840x2400, 16", 60 Hz
Dell Precision 5690
Samsung 160YV03, OLED, 3840x2400, 16", 60 Hz
Lenovo ThinkPad P16 G2 21FA000FGE
MNG007DA1-9, IPS LED, 2560x1600, 16", 165 Hz
Lenovo ThinkPad P1 G6 21FV001KUS
Samsung ATNA60YV04-0, OLED, 3480x2400, 16", 60 Hz
Asus ProArt Studiobook 16 OLED H7604
ATNA60BX01-1, OLED, 3200x2000, 16", 120 Hz
Display
0%
-0%
4%
-15%
5%
2%
Display P3 Coverage
98.4
98
0%
97.4
-1%
99.8
1%
71
-28%
99.8
1%
99.6
1%
sRGB Coverage
99.9
99.9
0%
99.9
0%
100
0%
99.2
-1%
100
0%
100
0%
AdobeRGB 1998 Coverage
86
86.2
0%
86.3
0%
96.6
12%
73.2
-15%
97.9
14%
89.4
4%
Response Times
-9%
-11%
83%
-16%
82%
93%
Response Time Grey 50% / Grey 80% *
11.4 ?(5.3, 6.1)
11.9 ?(5.9, 6)
-4%
13.7 ?(6.6, 7.1)
-20%
1.7 ?(0.88, 0.82)
85%
12.8 ?(61, 6.8)
-12%
1.69 ?(0.89, 0.8)
85%
0.59 ?(0.29, 0.3)
95%
Response Time Black / White *
8.4 ?(4.7, 3.7)
9.6 ?(5.1, 4.5)
-14%
8.6 ?(4.7, 3.9)
-2%
1.7 ?(0.74, 0.96)
80%
10.1 ?(5.8, 4.3)
-20%
1.73 ?(0.77, 0.96)
79%
0.79 ?(0.34, 0.45)
91%
PWM Frequency
60 ?(100)
60 ?(100)
240 ?(100)
Screen
19%
-25%
-8%
-7%
19%
179%
Brightness middle
457.6
514.6
12%
530.5
16%
348.1
-24%
510
11%
375.1
-18%
349
-24%
Brightness
466
495
6%
476
2%
351
-25%
517
11%
379
-19%
350
-25%
Brightness Distribution
83
90
8%
83
0%
97
17%
89
7%
98
18%
95
14%
Black Level *
0.43
0.46
-7%
0.57
-33%
0.37
14%
0.02
95%
Contrast
1064
1119
5%
931
-12%
1378
30%
17450
1540%
Colorchecker dE 2000 *
2.78
2.4
14%
2.26
19%
4.18
-50%
2.6
6%
1.16
58%
2.1
24%
Colorchecker dE 2000 max. *
5.53
4.86
12%
6.68
-21%
5.2
6%
2.94
47%
5.5
1%
Colorchecker dE 2000 calibrated *
1.37
0.4
71%
4.73
-245%
0.97
29%
2.3
-68%
2.1
-53%
Greyscale dE 2000 *
2
1
50%
1
50%
1.7
15%
3.6
-80%
1.4
30%
1.2
40%
Gamma
2.28 96%
2.3 96%
2.28 96%
2.2 100%
2.26 97%
2.2 100%
2.19 100%
CCT
6806 96%
6553 99%
6543 99%
6198 105%
5969 109%
6325 103%
6545 99%
Total Average (Program / Settings)
3% / 11%
-12% / -17%
26% / 10%
-13% / -10%
35% / 27%
91% / 129%

* ... im mniej tym lepiej

vs. sRGB
vs. sRGB
vs. P3
vs. P3

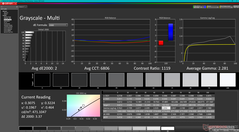
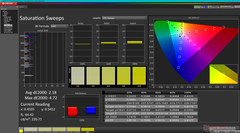
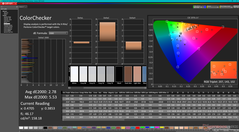
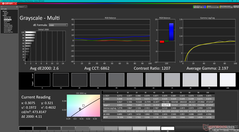
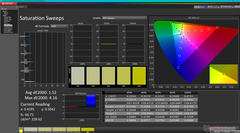
Wyświetlacz jest dobrze skalibrowany względem standardu P3 ze średnimi wartościami deltaE skali szarości i kolorów wynoszącymi odpowiednio zaledwie 2 i 2,18. Dalsza kalibracja panelu za pomocą naszego kolorymetru X-Rite poprawiłaby dokładność tylko nieznacznie i byłaby w większości niepotrzebna dla większości użytkowników.

Skala szarości przed kalibracją
Pomiary nasycenia przed kalibracją
ColorChecker przed kalibracją
Skala szarości po kalibracji
Pomiary nasycenia po kalibracji
ColorChecker po kalibracji

Display Response Times

Display response times show how fast the screen is able to change from one color to the next. Slow response times can lead to afterimages and can cause moving objects to appear blurry (ghosting). Gamers of fast-paced 3D titles should pay special attention to fast response times.
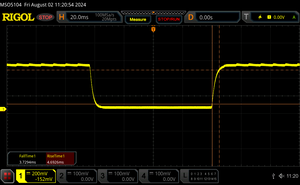
       Response Time Black to White
8.4 ms ... rise ↗ and fall ↘ combined↗ 4.7 ms rise
↘ 3.7 ms fall
The screen shows fast response rates in our tests and should be suited for gaming.
In comparison, all tested devices range from 0.1 (minimum) to 240 (maximum) ms. » 20 % of all devices are better.
This means that the measured response time is better than the average of all tested devices (21 ms).
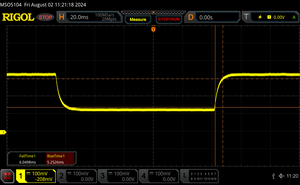
       Response Time 50% Grey to 80% Grey
11.4 ms ... rise ↗ and fall ↘ combined↗ 5.3 ms rise
↘ 6.1 ms fall
The screen shows good response rates in our tests, but may be too slow for competitive gamers.
In comparison, all tested devices range from 0.165 (minimum) to 636 (maximum) ms. » 22 % of all devices are better.
This means that the measured response time is better than the average of all tested devices (32.8 ms).

Screen Flickering / PWM (Pulse-Width Modulation)

To dim the screen, some notebooks will simply cycle the backlight on and off in rapid succession - a method called Pulse Width Modulation (PWM) . This cycling frequency should ideally be undetectable to the human eye. If said frequency is too low, users with sensitive eyes may experience strain or headaches or even notice the flickering altogether.
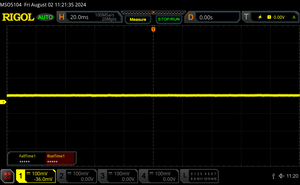
Screen flickering / PWM not detected

In comparison: 53 % of all tested devices do not use PWM to dim the display. If PWM was detected, an average of 8684 (minimum: 5 - maximum: 343500) Hz was measured.

Na zewnątrz przy dużym zachmurzeniu
Na zewnątrz w cieniu. Odblaski są obecne, ale tolerowane
Na zewnątrz przy dużym zachmurzeniu
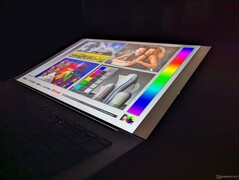
Szerokie kąty widzenia IPS

Wydajność - wyższy potencjał doładowania


Warunki testowania

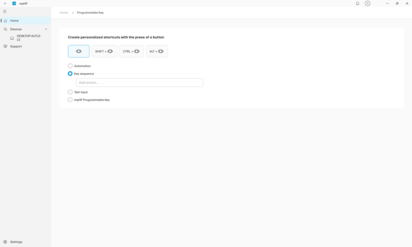
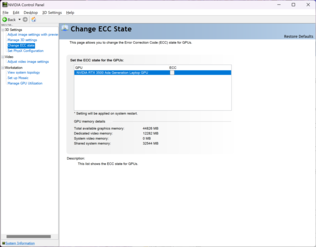
Przed wykonaniem poniższych testów ustawiliśmy zarówno system Windows, jak i MyHP w tryb wydajności. Wyłączyliśmy również tryb GPU ECC za pośrednictwem Panelu sterowania Nvidia.

Ekran główny MyHP
Ekran główny MyHP
Profile zasilania
Profile zasilania
Klucz konfigurowany przez użytkownika
Przełączanie stanu GPU ECC

Procesor

Przeskok z Core i9-12950HX w ZBook Fury 16 G9 do Core i9-13950HX w ZBook Fury 16 G10 przyniósł znaczący wzrost wydajności. Niestety, tego samego nie można powiedzieć o przeskoku z Core i9-13950HX w Fury 16 G10 na Core i9-14900HX w naszej konfiguracji Fury 16 G11. Zyski są znacznie mniejsze o około 10 do 15 procent, zanim uwzględnimy jakikolwiek throttling. Po uwzględnieniu throttlingu, ogólna wydajność procesora byłaby zasadniczo identyczna jak w przypadku Core i9-13950HX, o czym świadczą poniższe wyniki testów w pętli CineBench R15 xT. Core i9-14900HX wykorzystuje tę samą architekturę bazową co Core i9-13950HX, więc można go uznać za rebranding zeszłorocznych opcji. Tym samym wyższy pułap Turbo Boost jest jego główną przewagą nad ustępującym procesorem, nawet jeśli te wyższe prędkości Turbo Boost są krótkotrwałe.

W przypadku Lenovo Legion 9 16IRX9który jest dostarczany z tym samym procesorem Core i9-14900HX co nasz HP, działałby do 20 procent szybciej, prawdopodobnie ze względu na bardziej wydajne rozwiązanie chłodzące, aby utrzymać wyższe częstotliwości taktowania Turbo Boost.

Cinebench R15 Multi Loop

0245490735980122514701715196022052450269529403185343036753920416544104655Tooltip
HP ZBook Fury 16 G11 Intel Core i9-14900HX: Ø3302 (2849.61-4173.19)
HP ZBook Fury 16 G10 Intel Core i9-13950HX: Ø3353 (3034.67-3625.49)
HP ZBook Fury 16 G9 Intel Core i9-12950HX: Ø2011 (1905.94-2464.42)
Dell Precision 5690 Intel Core Ultra 9 185H: Ø2340 (2218.28-3164.56)
Lenovo ThinkPad P16 G2 21FA000FGE Intel Core i7-13700HX: Ø2785 (2533.57-3082.38)
Lenovo ThinkPad P1 G6 21FV001KUS Intel Core i7-13800H: Ø2489 (2398.94-2765.3)
Asus ProArt Studiobook 16 OLED H7604 Intel Core i9-13980HX: Ø4477 (4374.45-4604.05)
Lenovo Legion 9 16IRX9, RTX 4090 Intel Core i9-14900HX: Ø4648 (4505.52-4878.64)
CPU Performance Rating: Percent
Cinebench R23: Multi Core | Single Core
Cinebench R20: CPU (Multi Core) | CPU (Single Core)
Cinebench R15: CPU Multi 64Bit | CPU Single 64Bit
Blender: v2.79 BMW27 CPU
7-Zip 18.03: 7z b 4 | 7z b 4 -mmt1
Geekbench 6.3: Multi-Core | Single-Core
Geekbench 5.5: Multi-Core | Single-Core
HWBOT x265 Benchmark v2.2: 4k Preset
LibreOffice : 20 Documents To PDF
R Benchmark 2.5: Overall mean
CPU Performance Rating
Asus ProArt Studiobook 16 OLED H7604 -2!
Intel Core i9-13980HX
85.2 pt
Average Intel Core i9-14900HX
 
84.8 pt
HP ZBook Fury 16 G11
Intel Core i9-14900HX
80.2 pt
HP ZBook Fury 16 G10
Intel Core i9-13950HX
78.4 pt
Dell Precision 5000 5680
Intel Core i9-13900H
66.9 pt
Lenovo ThinkPad P1 G6 21FV001KUS
Intel Core i7-13800H
65.6 pt
Asus ExpertBook B6 Flip B6602FC2 -2!
Intel Core i9-12950HX
65.2 pt
Lenovo ThinkPad P16 G2 21FA000FGE -2!
Intel Core i7-13700HX
64.9 pt
Lenovo ThinkPad P1 G6-21FV000DGE
Intel Core i9-13900H
64.8 pt
Dell Precision 5690
Intel Core Ultra 9 185H
64.4 pt
HP ZBook Fury 16 G9 -2!
Intel Core i9-12950HX
61.5 pt
MSI CreatorPro Z16P B12UKST -2!
Intel Core i7-12700H
57.4 pt
Lenovo ThinkPad P16v G1 AMD
AMD Ryzen 7 PRO 7840HS
57.2 pt
Lenovo ThinkPad P1 G4-20Y4S0KS00 -2!
Intel Core i7-11850H
45.9 pt
Cinebench R23 / Multi Core
Asus ProArt Studiobook 16 OLED H7604
Intel Core i9-13980HX
30789 Points +13%
Average Intel Core i9-14900HX
  (17078 - 36249, n=37)
28851 Points +6%
HP ZBook Fury 16 G11
Intel Core i9-14900HX
27130 (20747.4min - 27130max) Points
HP ZBook Fury 16 G10
Intel Core i9-13950HX
24560 (20848.8min - 24559.5max) Points -9%
Lenovo ThinkPad P16 G2 21FA000FGE
Intel Core i7-13700HX
20479 Points -25%
Asus ExpertBook B6 Flip B6602FC2
Intel Core i9-12950HX
20263 Points -25%
Dell Precision 5690
Intel Core Ultra 9 185H
19158 (13886.3min - 19158.4max) Points -29%
HP ZBook Fury 16 G9
Intel Core i9-12950HX
19153 (17138min - 19152.9max) Points -29%
Dell Precision 5000 5680
Intel Core i9-13900H
18886 (15052.4min - 18886.3max) Points -30%
Lenovo ThinkPad P1 G6-21FV000DGE
Intel Core i9-13900H
18556 Points -32%
Lenovo ThinkPad P1 G6 21FV001KUS
Intel Core i7-13800H
17591 (15401.5min - 17590.8max) Points -35%
MSI CreatorPro Z16P B12UKST
Intel Core i7-12700H
17228 Points -36%
Lenovo ThinkPad P16v G1 AMD
AMD Ryzen 7 PRO 7840HS
14240 Points -48%
Lenovo ThinkPad P1 G4-20Y4S0KS00
Intel Core i7-11850H
11935 Points -56%
Cinebench R23 / Single Core
HP ZBook Fury 16 G11
Intel Core i9-14900HX
2178 Points
Average Intel Core i9-14900HX
  (1720 - 2245, n=37)
2149 Points -1%
Asus ProArt Studiobook 16 OLED H7604
Intel Core i9-13980HX
2110 Points -3%
HP ZBook Fury 16 G10
Intel Core i9-13950HX
2106 Points -3%
Lenovo ThinkPad P1 G6-21FV000DGE
Intel Core i9-13900H
2033 Points -7%
Dell Precision 5000 5680
Intel Core i9-13900H
2023 Points -7%
Lenovo ThinkPad P1 G6 21FV001KUS
Intel Core i7-13800H
2017 Points -7%
HP ZBook Fury 16 G9
Intel Core i9-12950HX
1922 Points -12%
Lenovo ThinkPad P16 G2 21FA000FGE
Intel Core i7-13700HX
1889 Points -13%
Asus ExpertBook B6 Flip B6602FC2
Intel Core i9-12950HX
1885 Points -13%
Dell Precision 5690
Intel Core Ultra 9 185H
1858 Points -15%
MSI CreatorPro Z16P B12UKST
Intel Core i7-12700H
1738 Points -20%
Lenovo ThinkPad P16v G1 AMD
AMD Ryzen 7 PRO 7840HS
1691 Points -22%
Lenovo ThinkPad P1 G4-20Y4S0KS00
Intel Core i7-11850H
1552 Points -29%
Cinebench R20 / CPU (Multi Core)
Asus ProArt Studiobook 16 OLED H7604
Intel Core i9-13980HX
11768 Points +17%
Average Intel Core i9-14900HX
  (6579 - 13832, n=37)
10970 Points +9%
HP ZBook Fury 16 G11
Intel Core i9-14900HX
10069 Points
HP ZBook Fury 16 G10
Intel Core i9-13950HX
9329 Points -7%
Asus ExpertBook B6 Flip B6602FC2
Intel Core i9-12950HX
7971 Points -21%
Lenovo ThinkPad P16 G2 21FA000FGE
Intel Core i7-13700HX
7870 Points -22%
Dell Precision 5690
Intel Core Ultra 9 185H
7387 Points -27%
HP ZBook Fury 16 G9
Intel Core i9-12950HX
7364 Points -27%
Dell Precision 5000 5680
Intel Core i9-13900H
7214 Points -28%
Lenovo ThinkPad P1 G6-21FV000DGE
Intel Core i9-13900H
6995 Points -31%
MSI CreatorPro Z16P B12UKST
Intel Core i7-12700H
6742 Points -33%
Lenovo ThinkPad P1 G6 21FV001KUS
Intel Core i7-13800H
6714 Points -33%
Lenovo ThinkPad P16v G1 AMD
AMD Ryzen 7 PRO 7840HS
5327 Points -47%
Lenovo ThinkPad P1 G4-20Y4S0KS00
Intel Core i7-11850H
4663 Points -54%
Cinebench R20 / CPU (Single Core)
HP ZBook Fury 16 G11
Intel Core i9-14900HX
827 Points
Average Intel Core i9-14900HX
  (657 - 859, n=37)
824 Points 0%
HP ZBook Fury 16 G10
Intel Core i9-13950HX
816 Points -1%
Asus ProArt Studiobook 16 OLED H7604
Intel Core i9-13980HX
812 Points -2%
Lenovo ThinkPad P1 G6-21FV000DGE
Intel Core i9-13900H
782 Points -5%
Dell Precision 5000 5680
Intel Core i9-13900H
781 Points -6%
Lenovo ThinkPad P1 G6 21FV001KUS
Intel Core i7-13800H
776 Points -6%
HP ZBook Fury 16 G9
Intel Core i9-12950HX
739 Points -11%
Asus ExpertBook B6 Flip B6602FC2
Intel Core i9-12950HX
727 Points -12%
Lenovo ThinkPad P16 G2 21FA000FGE
Intel Core i7-13700HX
727 Points -12%
Dell Precision 5690
Intel Core Ultra 9 185H
708 Points -14%
MSI CreatorPro Z16P B12UKST
Intel Core i7-12700H
675 Points -18%
Lenovo ThinkPad P16v G1 AMD
AMD Ryzen 7 PRO 7840HS
651 Points -21%
Lenovo ThinkPad P1 G4-20Y4S0KS00
Intel Core i7-11850H
607 Points -27%
Cinebench R15 / CPU Multi 64Bit
Asus ProArt Studiobook 16 OLED H7604
Intel Core i9-13980HX
4604 (4374.45min - 4604.05max) Points +10%
Average Intel Core i9-14900HX
  (3263 - 5589, n=38)
4427 Points +6%
HP ZBook Fury 16 G11
Intel Core i9-14900HX
4173 (2849.61min - 4173.19max) Points
HP ZBook Fury 16 G10
Intel Core i9-13950HX
3625 (3034.67min - 3625.49max) Points -13%
Asus ExpertBook B6 Flip B6602FC2
Intel Core i9-12950HX
3520 (2404.42min - 3485.54max) Points -16%
Dell Precision 5690
Intel Core Ultra 9 185H
3165 (2218.28min - 3164.56max) Points -24%
Lenovo ThinkPad P16 G2 21FA000FGE
Intel Core i7-13700HX
3082 (2533.57min - 3082.38max) Points -26%
Lenovo ThinkPad P1 G6 21FV001KUS
Intel Core i7-13800H
2765 (2398.94min - 2765.3max) Points -34%
Lenovo ThinkPad P1 G6-21FV000DGE
Intel Core i9-13900H
2627 (2237.64min - 2626.57max) Points -37%
HP ZBook Fury 16 G9
Intel Core i9-12950HX
2464 (1905.94min - 2464.42max) Points -41%
Lenovo ThinkPad P16v G1 AMD
AMD Ryzen 7 PRO 7840HS
2361 (2257.08min - 2361.28max) Points -43%
Dell Precision 5000 5680
Intel Core i9-13900H
2354 (2200.22min - 2354.19max) Points -44%
MSI CreatorPro Z16P B12UKST
Intel Core i7-12700H
2211 (2130.95min, 2137.41P1 - 2274.54max) Points -47%
Lenovo ThinkPad P1 G4-20Y4S0KS00
Intel Core i7-11850H
1988 (1759.48min - 1988.07max) Points -52%
Cinebench R15 / CPU Single 64Bit
Asus ProArt Studiobook 16 OLED H7604
Intel Core i9-13980HX
308 Points +4%
Average Intel Core i9-14900HX
  (247 - 323, n=37)
305 Points +3%
HP ZBook Fury 16 G10
Intel Core i9-13950HX
301 Points +1%
HP ZBook Fury 16 G11
Intel Core i9-14900HX
297 Points
Dell Precision 5000 5680
Intel Core i9-13900H
289 Points -3%
Lenovo ThinkPad P1 G6-21FV000DGE
Intel Core i9-13900H
287 Points -3%
Lenovo ThinkPad P1 G6 21FV001KUS
Intel Core i7-13800H
287 Points -3%
Lenovo ThinkPad P16 G2 21FA000FGE
Intel Core i7-13700HX
279 Points -6%
Asus ExpertBook B6 Flip B6602FC2
Intel Core i9-12950HX
274 Points -8%
Dell Precision 5690
Intel Core Ultra 9 185H
270 Points -9%
Lenovo ThinkPad P16v G1 AMD
AMD Ryzen 7 PRO 7840HS
262 Points -12%
MSI CreatorPro Z16P B12UKST
Intel Core i7-12700H
238 Points -20%
Lenovo ThinkPad P1 G4-20Y4S0KS00
Intel Core i7-11850H
233 Points -22%
HP ZBook Fury 16 G9
Intel Core i9-12950HX
167 Points -44%
Blender / v2.79 BMW27 CPU
Lenovo ThinkPad P1 G4-20Y4S0KS00
Intel Core i7-11850H
257 Seconds * -92%
Dell Precision 5690
Intel Core Ultra 9 185H
208 Seconds * -55%
Lenovo ThinkPad P16v G1 AMD
AMD Ryzen 7 PRO 7840HS
205 Seconds * -53%
MSI CreatorPro Z16P B12UKST
Intel Core i7-12700H
201 Seconds * -50%
Dell Precision 5000 5680
Intel Core i9-13900H
199 Seconds * -49%
Lenovo ThinkPad P1 G6-21FV000DGE
Intel Core i9-13900H
193 Seconds * -44%
Lenovo ThinkPad P1 G6 21FV001KUS
Intel Core i7-13800H
191 Seconds * -43%
Asus ExpertBook B6 Flip B6602FC2
Intel Core i9-12950HX
189 Seconds * -41%
HP ZBook Fury 16 G9
Intel Core i9-12950HX
176 Seconds * -31%
Lenovo ThinkPad P16 G2 21FA000FGE
Intel Core i7-13700HX
161 Seconds * -20%
HP ZBook Fury 16 G10
Intel Core i9-13950HX
137 Seconds * -2%
HP ZBook Fury 16 G11
Intel Core i9-14900HX
134 Seconds *
Average Intel Core i9-14900HX
  (91 - 206, n=37)
121.2 Seconds * +10%
Asus ProArt Studiobook 16 OLED H7604
Intel Core i9-13980HX
107 Seconds * +20%
7-Zip 18.03 / 7z b 4
Asus ProArt Studiobook 16 OLED H7604
Intel Core i9-13980HX
119900 MIPS +19%
Average Intel Core i9-14900HX
  (66769 - 136645, n=37)
111239 MIPS +10%
HP ZBook Fury 16 G11
Intel Core i9-14900HX
101027 MIPS
HP ZBook Fury 16 G10
Intel Core i9-13950HX
99351 MIPS -2%
Lenovo ThinkPad P16 G2 21FA000FGE
Intel Core i7-13700HX
78900 MIPS -22%
HP ZBook Fury 16 G9
Intel Core i9-12950HX
76646 MIPS -24%
Dell Precision 5690
Intel Core Ultra 9 185H
74187 MIPS -27%
Asus ExpertBook B6 Flip B6602FC2
Intel Core i9-12950HX
73450 MIPS -27%
Lenovo ThinkPad P1 G6-21FV000DGE
Intel Core i9-13900H
70581 MIPS -30%
Lenovo ThinkPad P1 G6 21FV001KUS
Intel Core i7-13800H
70500 MIPS -30%
Dell Precision 5000 5680
Intel Core i9-13900H
70166 MIPS -31%
MSI CreatorPro Z16P B12UKST
Intel Core i7-12700H
66768 MIPS -34%
Lenovo ThinkPad P16v G1 AMD
AMD Ryzen 7 PRO 7840HS
62497 MIPS -38%
Lenovo ThinkPad P1 G4-20Y4S0KS00
Intel Core i7-11850H
50552 MIPS -50%
7-Zip 18.03 / 7z b 4 -mmt1
Asus ProArt Studiobook 16 OLED H7604
Intel Core i9-13980HX
7163 MIPS +3%
Average Intel Core i9-14900HX
  (5452 - 7545, n=37)
7021 MIPS +1%
HP ZBook Fury 16 G11
Intel Core i9-14900HX
6960 MIPS
HP ZBook Fury 16 G10
Intel Core i9-13950HX
6670 MIPS -4%
Lenovo ThinkPad P1 G6-21FV000DGE
Intel Core i9-13900H
6570 MIPS -6%
Lenovo ThinkPad P16v G1 AMD
AMD Ryzen 7 PRO 7840HS
6498 MIPS -7%
Lenovo ThinkPad P16 G2 21FA000FGE
Intel Core i7-13700HX
6355 MIPS -9%
Lenovo ThinkPad P1 G6 21FV001KUS
Intel Core i7-13800H
6310 MIPS -9%
Asus ExpertBook B6 Flip B6602FC2
Intel Core i9-12950HX
6197 MIPS -11%
Dell Precision 5000 5680
Intel Core i9-13900H
6194 MIPS -11%
HP ZBook Fury 16 G9
Intel Core i9-12950HX
6050 MIPS -13%
MSI CreatorPro Z16P B12UKST
Intel Core i7-12700H
5765 MIPS -17%
Lenovo ThinkPad P1 G4-20Y4S0KS00
Intel Core i7-11850H
5762 MIPS -17%
Dell Precision 5690
Intel Core Ultra 9 185H
4981 MIPS -28%
Geekbench 6.3 / Multi-Core
Average Intel Core i9-14900HX
  (13158 - 19665, n=37)
17321 Points +13%
HP ZBook Fury 16 G10
Intel Core i9-13950HX
15878 Points +4%
HP ZBook Fury 16 G11
Intel Core i9-14900HX
15279 Points
Dell Precision 5000 5680
Intel Core i9-13900H
14404 Points -6%
Dell Precision 5690
Intel Core Ultra 9 185H
14160 Points -7%
Lenovo ThinkPad P1 G6 21FV001KUS
Intel Core i7-13800H
12876 Points -16%
Lenovo ThinkPad P1 G6-21FV000DGE
Intel Core i9-13900H
12578 Points -18%
Lenovo ThinkPad P16v G1 AMD
AMD Ryzen 7 PRO 7840HS
10518 Points -31%
Geekbench 6.3 / Single-Core
Average Intel Core i9-14900HX
  (2419 - 3129, n=37)
2967 Points +1%
HP ZBook Fury 16 G10
Intel Core i9-13950HX
2949 Points +1%
HP ZBook Fury 16 G11
Intel Core i9-14900HX
2924 Points
Lenovo ThinkPad P1 G6 21FV001KUS
Intel Core i7-13800H
2766 Points -5%
Lenovo ThinkPad P1 G6-21FV000DGE
Intel Core i9-13900H
2728 Points -7%
Dell Precision 5000 5680
Intel Core i9-13900H
2600 Points -11%
Lenovo ThinkPad P16v G1 AMD
AMD Ryzen 7 PRO 7840HS
2581 Points -12%
Dell Precision 5690
Intel Core Ultra 9 185H
2531 Points -13%
Geekbench 5.5 / Multi-Core
Asus ProArt Studiobook 16 OLED H7604
Intel Core i9-13980HX
20053 Points +9%
Average Intel Core i9-14900HX
  (8618 - 23194, n=37)
19449 Points +6%
HP ZBook Fury 16 G11
Intel Core i9-14900HX
18407 Points
HP ZBook Fury 16 G10
Intel Core i9-13950HX
17487 Points -5%
Asus ExpertBook B6 Flip B6602FC2
Intel Core i9-12950HX
15483 Points -16%
Dell Precision 5000 5680
Intel Core i9-13900H
14661 Points -20%
Lenovo ThinkPad P16 G2 21FA000FGE
Intel Core i7-13700HX
14422 Points -22%
Dell Precision 5690
Intel Core Ultra 9 185H
14230 Points -23%
HP ZBook Fury 16 G9
Intel Core i9-12950HX
14028 Points -24%
Lenovo ThinkPad P1 G6 21FV001KUS
Intel Core i7-13800H
12880 Points -30%
MSI CreatorPro Z16P B12UKST
Intel Core i7-12700H
12125 Points -34%
Lenovo ThinkPad P1 G6-21FV000DGE
Intel Core i9-13900H
11611 Points -37%
Lenovo ThinkPad P16v G1 AMD
AMD Ryzen 7 PRO 7840HS
10034 Points -45%
Lenovo ThinkPad P1 G4-20Y4S0KS00
Intel Core i7-11850H
9451 Points -49%
Geekbench 5.5 / Single-Core
Asus ProArt Studiobook 16 OLED H7604
Intel Core i9-13980HX
2137 Points +5%
HP ZBook Fury 16 G10
Intel Core i9-13950HX
2095 Points +3%
Average Intel Core i9-14900HX
  (1669 - 2210, n=37)
2092 Points +3%
Dell Precision 5000 5680
Intel Core i9-13900H
2041 Points +1%
HP ZBook Fury 16 G11
Intel Core i9-14900HX
2030 Points
Lenovo ThinkPad P1 G6 21FV001KUS
Intel Core i7-13800H
1972 Points -3%
Lenovo ThinkPad P1 G6-21FV000DGE
Intel Core i9-13900H
1960 Points -3%
HP ZBook Fury 16 G9
Intel Core i9-12950HX
1945 Points -4%
Asus ExpertBook B6 Flip B6602FC2
Intel Core i9-12950HX
1886 Points -7%
Lenovo ThinkPad P16 G2 21FA000FGE
Intel Core i7-13700HX
1873 Points -8%
Dell Precision 5690
Intel Core Ultra 9 185H
1864 Points -8%
Lenovo ThinkPad P16v G1 AMD
AMD Ryzen 7 PRO 7840HS
1822 Points -10%
MSI CreatorPro Z16P B12UKST
Intel Core i7-12700H
1788 Points -12%
Lenovo ThinkPad P1 G4-20Y4S0KS00
Intel Core i7-11850H
1659 Points -18%
HWBOT x265 Benchmark v2.2 / 4k Preset
Asus ProArt Studiobook 16 OLED H7604
Intel Core i9-13980HX
30.5 fps +13%
Average Intel Core i9-14900HX
  (16.8 - 38.9, n=37)
29.3 fps +9%
HP ZBook Fury 16 G11
Intel Core i9-14900HX
27 fps
HP ZBook Fury 16 G10
Intel Core i9-13950HX
26 fps -4%
Lenovo ThinkPad P16 G2 21FA000FGE
Intel Core i7-13700HX
22.2 fps -18%
Dell Precision 5690
Intel Core Ultra 9 185H
22 fps -19%
Asus ExpertBook B6 Flip B6602FC2
Intel Core i9-12950HX
21.3 fps -21%
Dell Precision 5000 5680
Intel Core i9-13900H
20.2 fps -25%
Lenovo ThinkPad P1 G6 21FV001KUS
Intel Core i7-13800H
20 fps -26%
HP ZBook Fury 16 G9
Intel Core i9-12950HX
19.6 fps -27%
MSI CreatorPro Z16P B12UKST
Intel Core i7-12700H
19.4 fps -28%
Lenovo ThinkPad P1 G6-21FV000DGE
Intel Core i9-13900H
19.1 fps -29%
Lenovo ThinkPad P16v G1 AMD
AMD Ryzen 7 PRO 7840HS
18.1 fps -33%
Lenovo ThinkPad P1 G4-20Y4S0KS00
Intel Core i7-11850H
14.4 fps -47%
LibreOffice / 20 Documents To PDF
Lenovo ThinkPad P16 G2 21FA000FGE
Intel Core i7-13700HX
49 s * -2%
HP ZBook Fury 16 G11
Intel Core i9-14900HX
48 s *
Lenovo ThinkPad P1 G6-21FV000DGE
Intel Core i9-13900H
47.4 s * +1%
Lenovo ThinkPad P16v G1 AMD
AMD Ryzen 7 PRO 7840HS
45.9 s * +4%
Lenovo ThinkPad P1 G4-20Y4S0KS00
Intel Core i7-11850H
45.8 s * +5%
Lenovo ThinkPad P1 G6 21FV001KUS
Intel Core i7-13800H
44.3 s * +8%
Asus ProArt Studiobook 16 OLED H7604
Intel Core i9-13980HX
44.2 s * +8%
HP ZBook Fury 16 G10
Intel Core i9-13950HX
43.7 s * +9%
Average Intel Core i9-14900HX
  (19 - 85.1, n=37)
42.6 s * +11%
Asus ExpertBook B6 Flip B6602FC2
Intel Core i9-12950HX
42.2 s * +12%
Dell Precision 5690
Intel Core Ultra 9 185H
41.9 s * +13%
Dell Precision 5000 5680
Intel Core i9-13900H
40.4 s * +16%
MSI CreatorPro Z16P B12UKST
Intel Core i7-12700H
38.2 s * +20%
HP ZBook Fury 16 G9
Intel Core i9-12950HX
36.5 s * +24%
R Benchmark 2.5 / Overall mean
Lenovo ThinkPad P1 G4-20Y4S0KS00
Intel Core i7-11850H
0.541 sec * -41%
Dell Precision 5690
Intel Core Ultra 9 185H
0.4601 sec * -20%
MSI CreatorPro Z16P B12UKST
Intel Core i7-12700H
0.4541 sec * -19%
Asus ExpertBook B6 Flip B6602FC2
Intel Core i9-12950HX
0.4515 sec * -18%
Lenovo ThinkPad P16 G2 21FA000FGE
Intel Core i7-13700HX
0.4407 sec * -15%
Lenovo ThinkPad P16v G1 AMD
AMD Ryzen 7 PRO 7840HS
0.44 sec * -15%
HP ZBook Fury 16 G9
Intel Core i9-12950HX
0.4328 sec * -13%
Lenovo ThinkPad P1 G6-21FV000DGE
Intel Core i9-13900H
0.4173 sec * -9%
Dell Precision 5000 5680
Intel Core i9-13900H
0.4115 sec * -8%
Lenovo ThinkPad P1 G6 21FV001KUS
Intel Core i7-13800H
0.4103 sec * -7%
HP ZBook Fury 16 G10
Intel Core i9-13950HX
0.3876 sec * -1%
Average Intel Core i9-14900HX
  (0.3604 - 0.4859, n=37)
0.385 sec * -1%
Asus ProArt Studiobook 16 OLED H7604
Intel Core i9-13980HX
0.3826 sec * -0%
HP ZBook Fury 16 G11
Intel Core i9-14900HX
0.3825 sec *
CPU Performance Rating: Percent
Cinebench R23: Multi Core | Single Core
Cinebench R20: CPU (Multi Core) | CPU (Single Core)
Cinebench R15: CPU Multi 64Bit | CPU Single 64Bit
Blender: v2.79 BMW27 CPU
7-Zip 18.03: 7z b 4 | 7z b 4 -mmt1
Geekbench 6.3: Multi-Core | Single-Core
Geekbench 5.5: Multi-Core | Single-Core
HWBOT x265 Benchmark v2.2: 4k Preset
LibreOffice : 20 Documents To PDF
R Benchmark 2.5: Overall mean

* ... im mniej tym lepiej

Cinebench R15 CPU Multi 64Bit
4173 Points
Cinebench R15 OpenGL 64Bit
317 fps
Cinebench R15 Ref. Match 64Bit
99.6 %
Cinebench R15 CPU Single 64Bit
297 Points
Cinebench R20 CPU (Multi Core)
10069 Points
Cinebench R20 CPU (Single Core)
827 Points
Cinebench R23 Single Core
2178 Points
Cinebench R23 Multi Core
27130 Points
Cinebench 2024 CPU Multi Core
1286 Points
Cinebench 2024 CPU Single Core
125.9 Points
Pomoc
Performance Rating
Asus ProArt Studiobook 16 OLED H7604
Intel Core i9-13980HX, NVIDIA GeForce RTX 4070 Laptop GPU
98.5 pt
Average Intel Core i9-14900HX
 
94 pt
HP ZBook Fury 16 G10
Intel Core i9-13950HX, NVIDIA RTX 5000 Ada Generation Laptop GPU
78.4 pt
HP ZBook Fury 16 G11
Intel Core i9-14900HX, NVIDIA RTX 3500 Ada Generation Laptop GPU
77.9 pt
Dell Precision 5690
Intel Core Ultra 9 185H, NVIDIA RTX 5000 Ada Generation Laptop GPU
71.6 pt
Lenovo ThinkPad P16 G2 21FA000FGE
Intel Core i7-13700HX, NVIDIA RTX 2000 Ada Generation Laptop GPU
68.4 pt
HP ZBook Fury 16 G9
Intel Core i9-12950HX, RTX A5500 Laptop GPU
67.8 pt
Lenovo ThinkPad P1 G6 21FV001KUS
Intel Core i7-13800H, NVIDIA GeForce RTX 4080 Laptop GPU
62.9 pt
AIDA64 / FP32 Ray-Trace
Asus ProArt Studiobook 16 OLED H7604
Intel Core i9-13980HX, NVIDIA GeForce RTX 4070 Laptop GPU
27340 KRay/s +36%
Average Intel Core i9-14900HX
  (13098 - 33474, n=36)
24763 KRay/s +23%
HP ZBook Fury 16 G10
Intel Core i9-13950HX, NVIDIA RTX 5000 Ada Generation Laptop GPU
20187 KRay/s +1%
HP ZBook Fury 16 G11
Intel Core i9-14900HX, NVIDIA RTX 3500 Ada Generation Laptop GPU
20058 KRay/s
Dell Precision 5690
Intel Core Ultra 9 185H, NVIDIA RTX 5000 Ada Generation Laptop GPU
18502 KRay/s -8%
Lenovo ThinkPad P16 G2 21FA000FGE
Intel Core i7-13700HX, NVIDIA RTX 2000 Ada Generation Laptop GPU
18420 KRay/s -8%
HP ZBook Fury 16 G9
Intel Core i9-12950HX, RTX A5500 Laptop GPU
17221 KRay/s -14%
Lenovo ThinkPad P1 G6 21FV001KUS
Intel Core i7-13800H, NVIDIA GeForce RTX 4080 Laptop GPU
16745 KRay/s -17%
AIDA64 / FPU Julia
Asus ProArt Studiobook 16 OLED H7604
Intel Core i9-13980HX, NVIDIA GeForce RTX 4070 Laptop GPU
136048 Points +33%
Average Intel Core i9-14900HX
  (67573 - 166040, n=36)
124114 Points +22%
HP ZBook Fury 16 G10
Intel Core i9-13950HX, NVIDIA RTX 5000 Ada Generation Laptop GPU
102591 Points +1%
HP ZBook Fury 16 G11
Intel Core i9-14900HX, NVIDIA RTX 3500 Ada Generation Laptop GPU
101926 Points
HP ZBook Fury 16 G9
Intel Core i9-12950HX, RTX A5500 Laptop GPU
96505 Points -5%
Dell Precision 5690
Intel Core Ultra 9 185H, NVIDIA RTX 5000 Ada Generation Laptop GPU
94737 Points -7%
Lenovo ThinkPad P16 G2 21FA000FGE
Intel Core i7-13700HX, NVIDIA RTX 2000 Ada Generation Laptop GPU
94499 Points -7%
Lenovo ThinkPad P1 G6 21FV001KUS
Intel Core i7-13800H, NVIDIA GeForce RTX 4080 Laptop GPU
85724 Points -16%
AIDA64 / CPU SHA3
Asus ProArt Studiobook 16 OLED H7604
Intel Core i9-13980HX, NVIDIA GeForce RTX 4070 Laptop GPU
6681 MB/s +34%
Average Intel Core i9-14900HX
  (3589 - 7979, n=36)
6130 MB/s +23%
HP ZBook Fury 16 G10
Intel Core i9-13950HX, NVIDIA RTX 5000 Ada Generation Laptop GPU
4981 MB/s 0%
HP ZBook Fury 16 G11
Intel Core i9-14900HX, NVIDIA RTX 3500 Ada Generation Laptop GPU
4972 MB/s
Dell Precision 5690
Intel Core Ultra 9 185H, NVIDIA RTX 5000 Ada Generation Laptop GPU
4382 MB/s -12%
Lenovo ThinkPad P16 G2 21FA000FGE
Intel Core i7-13700HX, NVIDIA RTX 2000 Ada Generation Laptop GPU
4265 MB/s -14%
HP ZBook Fury 16 G9
Intel Core i9-12950HX, RTX A5500 Laptop GPU
4085 MB/s -18%
Lenovo ThinkPad P1 G6 21FV001KUS
Intel Core i7-13800H, NVIDIA GeForce RTX 4080 Laptop GPU
3869 MB/s -22%
AIDA64 / CPU Queen
Average Intel Core i9-14900HX
  (118405 - 148966, n=36)
138261 Points +1%
HP ZBook Fury 16 G11
Intel Core i9-14900HX, NVIDIA RTX 3500 Ada Generation Laptop GPU
136844 Points
Asus ProArt Studiobook 16 OLED H7604
Intel Core i9-13980HX, NVIDIA GeForce RTX 4070 Laptop GPU
134321 Points -2%
HP ZBook Fury 16 G10
Intel Core i9-13950HX, NVIDIA RTX 5000 Ada Generation Laptop GPU
131931 Points -4%
Lenovo ThinkPad P1 G6 21FV001KUS
Intel Core i7-13800H, NVIDIA GeForce RTX 4080 Laptop GPU
114997 Points -16%
Lenovo ThinkPad P16 G2 21FA000FGE
Intel Core i7-13700HX, NVIDIA RTX 2000 Ada Generation Laptop GPU
109246 Points -20%
HP ZBook Fury 16 G9
Intel Core i9-12950HX, RTX A5500 Laptop GPU
102752 Points -25%
Dell Precision 5690
Intel Core Ultra 9 185H, NVIDIA RTX 5000 Ada Generation Laptop GPU
94433 Points -31%
AIDA64 / FPU SinJulia
Asus ProArt Studiobook 16 OLED H7604
Intel Core i9-13980HX, NVIDIA GeForce RTX 4070 Laptop GPU
15484 Points +16%
Average Intel Core i9-14900HX
  (10475 - 18517, n=36)
15241 Points +14%
HP ZBook Fury 16 G11
Intel Core i9-14900HX, NVIDIA RTX 3500 Ada Generation Laptop GPU
13331 Points
HP ZBook Fury 16 G10
Intel Core i9-13950HX, NVIDIA RTX 5000 Ada Generation Laptop GPU
13321 Points 0%
Lenovo ThinkPad P16 G2 21FA000FGE
Intel Core i7-13700HX, NVIDIA RTX 2000 Ada Generation Laptop GPU
12013 Points -10%
HP ZBook Fury 16 G9
Intel Core i9-12950HX, RTX A5500 Laptop GPU
11637 Points -13%
Dell Precision 5690
Intel Core Ultra 9 185H, NVIDIA RTX 5000 Ada Generation Laptop GPU
11351 Points -15%
Lenovo ThinkPad P1 G6 21FV001KUS
Intel Core i7-13800H, NVIDIA GeForce RTX 4080 Laptop GPU
10696 Points -20%
AIDA64 / FPU Mandel
Asus ProArt Studiobook 16 OLED H7604
Intel Core i9-13980HX, NVIDIA GeForce RTX 4070 Laptop GPU
68591 Points +36%
Average Intel Core i9-14900HX
  (32543 - 83662, n=36)
61081 Points +21%
HP ZBook Fury 16 G10
Intel Core i9-13950HX, NVIDIA RTX 5000 Ada Generation Laptop GPU
50712 Points 0%
HP ZBook Fury 16 G11
Intel Core i9-14900HX, NVIDIA RTX 3500 Ada Generation Laptop GPU
50518 Points
Dell Precision 5690
Intel Core Ultra 9 185H, NVIDIA RTX 5000 Ada Generation Laptop GPU
46868 Points -7%
HP ZBook Fury 16 G9
Intel Core i9-12950HX, RTX A5500 Laptop GPU
46341 Points -8%
Lenovo ThinkPad P16 G2 21FA000FGE
Intel Core i7-13700HX, NVIDIA RTX 2000 Ada Generation Laptop GPU
45667 Points -10%
Lenovo ThinkPad P1 G6 21FV001KUS
Intel Core i7-13800H, NVIDIA GeForce RTX 4080 Laptop GPU
41603 Points -18%
AIDA64 / CPU AES
Average Intel Core i9-14900HX
  (86964 - 241777, n=36)
139038 MB/s +40%
Asus ProArt Studiobook 16 OLED H7604
Intel Core i9-13980HX, NVIDIA GeForce RTX 4070 Laptop GPU
128312 MB/s +30%
HP ZBook Fury 16 G10
Intel Core i9-13950HX, NVIDIA RTX 5000 Ada Generation Laptop GPU
99981 MB/s +1%
HP ZBook Fury 16 G11
Intel Core i9-14900HX, NVIDIA RTX 3500 Ada Generation Laptop GPU
99014 MB/s
HP ZBook Fury 16 G9
Intel Core i9-12950HX, RTX A5500 Laptop GPU
89024 MB/s -10%
Dell Precision 5690
Intel Core Ultra 9 185H, NVIDIA RTX 5000 Ada Generation Laptop GPU
88875 MB/s -10%
Lenovo ThinkPad P16 G2 21FA000FGE
Intel Core i7-13700HX, NVIDIA RTX 2000 Ada Generation Laptop GPU
88115 MB/s -11%
Lenovo ThinkPad P1 G6 21FV001KUS
Intel Core i7-13800H, NVIDIA GeForce RTX 4080 Laptop GPU
78683 MB/s -21%
AIDA64 / CPU ZLib
Asus ProArt Studiobook 16 OLED H7604
Intel Core i9-13980HX, NVIDIA GeForce RTX 4070 Laptop GPU
1901 MB/s +29%
Average Intel Core i9-14900HX
  (1054 - 2292, n=36)
1791 MB/s +22%
HP ZBook Fury 16 G11
Intel Core i9-14900HX, NVIDIA RTX 3500 Ada Generation Laptop GPU
1473 MB/s
HP ZBook Fury 16 G10
Intel Core i9-13950HX, NVIDIA RTX 5000 Ada Generation Laptop GPU
1472 MB/s 0%
Dell Precision 5690
Intel Core Ultra 9 185H, NVIDIA RTX 5000 Ada Generation Laptop GPU
1341 MB/s -9%
HP ZBook Fury 16 G9
Intel Core i9-12950HX, RTX A5500 Laptop GPU
1199 MB/s -19%
Lenovo ThinkPad P1 G6 21FV001KUS
Intel Core i7-13800H, NVIDIA GeForce RTX 4080 Laptop GPU
1167 MB/s -21%
Lenovo ThinkPad P16 G2 21FA000FGE
Intel Core i7-13700HX, NVIDIA RTX 2000 Ada Generation Laptop GPU
1126 MB/s -24%
AIDA64 / FP64 Ray-Trace
Asus ProArt Studiobook 16 OLED H7604
Intel Core i9-13980HX, NVIDIA GeForce RTX 4070 Laptop GPU
14155 KRay/s +30%
Average Intel Core i9-14900HX
  (6809 - 18349, n=36)
13332 KRay/s +23%
HP ZBook Fury 16 G10
Intel Core i9-13950HX, NVIDIA RTX 5000 Ada Generation Laptop GPU
10986 KRay/s +1%
HP ZBook Fury 16 G11
Intel Core i9-14900HX, NVIDIA RTX 3500 Ada Generation Laptop GPU
10878 KRay/s
Lenovo ThinkPad P16 G2 21FA000FGE
Intel Core i7-13700HX, NVIDIA RTX 2000 Ada Generation Laptop GPU
9876 KRay/s -9%
Dell Precision 5690
Intel Core Ultra 9 185H, NVIDIA RTX 5000 Ada Generation Laptop GPU
9707 KRay/s -11%
Lenovo ThinkPad P1 G6 21FV001KUS
Intel Core i7-13800H, NVIDIA GeForce RTX 4080 Laptop GPU
9125 KRay/s -16%
HP ZBook Fury 16 G9
Intel Core i9-12950HX, RTX A5500 Laptop GPU
8868 KRay/s -18%
AIDA64 / CPU PhotoWorxx
Dell Precision 5690
Intel Core Ultra 9 185H, NVIDIA RTX 5000 Ada Generation Laptop GPU
51647 MPixel/s +39%
Asus ProArt Studiobook 16 OLED H7604
Intel Core i9-13980HX, NVIDIA GeForce RTX 4070 Laptop GPU
49474 MPixel/s +33%
Average Intel Core i9-14900HX
  (23903 - 54702, n=36)
46878 MPixel/s +26%
HP ZBook Fury 16 G10
Intel Core i9-13950HX, NVIDIA RTX 5000 Ada Generation Laptop GPU
40233 MPixel/s +8%
HP ZBook Fury 16 G9
Intel Core i9-12950HX, RTX A5500 Laptop GPU
39531 MPixel/s +6%
HP ZBook Fury 16 G11
Intel Core i9-14900HX, NVIDIA RTX 3500 Ada Generation Laptop GPU
37151 MPixel/s
Lenovo ThinkPad P16 G2 21FA000FGE
Intel Core i7-13700HX, NVIDIA RTX 2000 Ada Generation Laptop GPU
35176 MPixel/s -5%
Lenovo ThinkPad P1 G6 21FV001KUS
Intel Core i7-13800H, NVIDIA GeForce RTX 4080 Laptop GPU
26822 MPixel/s -28%

Test warunków skrajnych

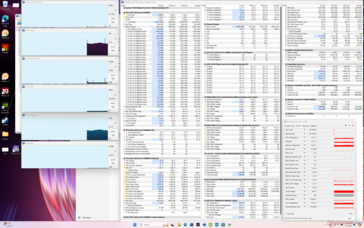
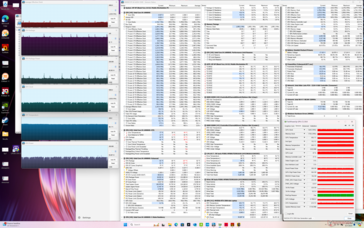
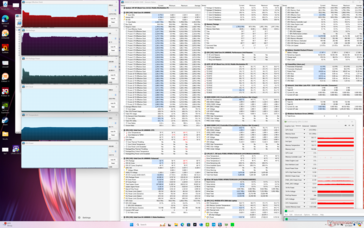
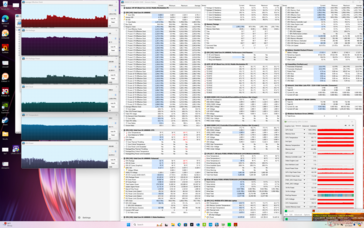
Po uruchomieniu programu Prime95 w celu obciążenia procesora, częstotliwość taktowania rdzenia i pobór mocy pakietu wzrosły odpowiednio do 3,7 GHz i 139 W, trwając najwyżej minutę, a temperatura rdzenia również wzrosła do 99 C. Procesor ostatecznie ustabilizował się na poziomie 2,3 GHz i 69 W, aby utrzymać łatwiejszą do opanowania temperaturę rdzenia 82 C. Stosunkowo gwałtowny spadek wydajności w czasie prowadzi do stopniowo niższych wyników pętli CineBench R15 xT, o których wspomniano powyżej.

Temperatury CPU i GPU przy wyższych obciążeniach, takich jak gry, ustabilizowałyby się na prawie takich samych odczytach, jakie odnotowaliśmy na zeszłorocznym ZBook Fury 16 G10, pomimo różnic w ich wydajności.

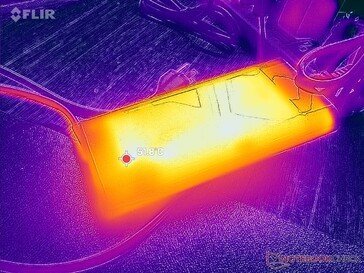
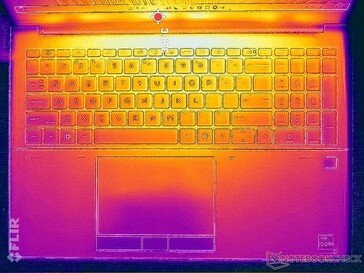
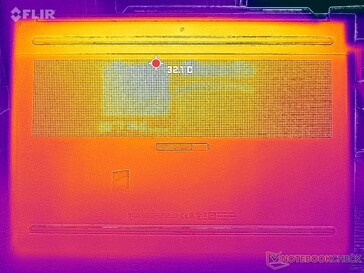
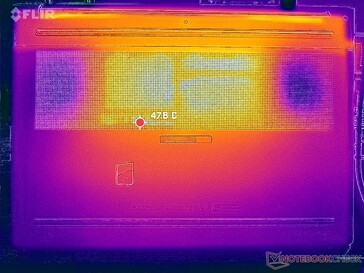
System bezczynny
System bezczynny
Cyberpunk 2077 - stres
Stres Prime95
Stres Prime95
Prime95+FurMark stres
Średnie taktowanie CPU (GHz) Taktowanie GPU (MHz) Średnia temperatura CPU (°C) Średnia temperatura GPU (°C)
System w stanie spoczynku -- -- 51 42
Prime95 Stress 2.2 - 2.6 -- 82 57
Prime95 + FurMark Stress 1.8 1995 81 65
Cyberpunk 2077 Stress 1.1 1845 81 69

Wydajność systemu

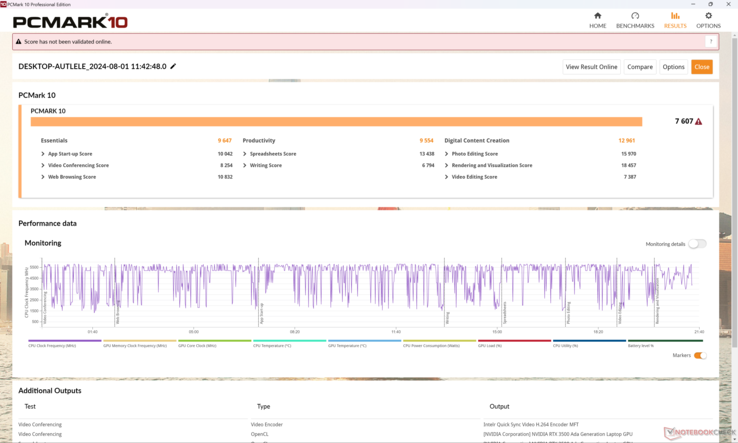
Wyniki PCMark są podobne do tych, które zanotowaliśmy na zeszłorocznym ZBook Fury 16 G10, co sugeruje, że ZBook Fury 16 G11 nie będzie wykonywał większości codziennych zadań szybciej niż jego poprzednik.

Proszę pamiętać, że maksymalna prędkość pamięci RAM jest ograniczona do zaledwie 4000 MT/s w konfiguracji z 128 GB pamięci ze względu na ograniczenia standardu SODIMM. Model ten obsługuje zarówno pamięć RAM ECC, jak i non-ECC.

PCMark 10 Standard
PCMark 10 Standard
PCMark 10 / Score
HP ZBook Fury 16 G10
NVIDIA RTX 5000 Ada Generation Laptop GPU, i9-13950HX, SK hynix PC801 HFS001TEJ9X101N
8102 Points +7%
Dell Precision 5690
NVIDIA RTX 5000 Ada Generation Laptop GPU, Ultra 9 185H, 2x Samsung PM9A1 1TB (RAID 0)
8065 Points +6%
Lenovo ThinkPad P1 G6 21FV001KUS
NVIDIA GeForce RTX 4080 Laptop GPU, i7-13800H, Kioxia XG8 KXG8AZNV1T02
8019 Points +5%
HP ZBook Fury 16 G11
NVIDIA RTX 3500 Ada Generation Laptop GPU, i9-14900HX, SK hynix PC801 HFS001TEJ9X101N
7607 Points
Average Intel Core i9-14900HX, NVIDIA RTX 3500 Ada Generation Laptop GPU
  ()
7607 Points 0%
Asus ProArt Studiobook 16 OLED H7604
NVIDIA GeForce RTX 4070 Laptop GPU, i9-13980HX, Phison EM2804TBMTCB47
7491 Points -2%
Lenovo ThinkPad P16 G2 21FA000FGE
NVIDIA RTX 2000 Ada Generation Laptop GPU, i7-13700HX, SK hynix PC801 HFS001TEJ9X162N
7154 Points -6%
HP ZBook Fury 16 G9
RTX A5500 Laptop GPU, i9-12950HX, Micron 3400 1TB MTFDKBA1T0TFH
6918 Points -9%
PCMark 10 / Essentials
Lenovo ThinkPad P1 G6 21FV001KUS
NVIDIA GeForce RTX 4080 Laptop GPU, i7-13800H, Kioxia XG8 KXG8AZNV1T02
11195 Points +16%
HP ZBook Fury 16 G10
NVIDIA RTX 5000 Ada Generation Laptop GPU, i9-13950HX, SK hynix PC801 HFS001TEJ9X101N
11072 Points +15%
Dell Precision 5690
NVIDIA RTX 5000 Ada Generation Laptop GPU, Ultra 9 185H, 2x Samsung PM9A1 1TB (RAID 0)
11011 Points +14%
Lenovo ThinkPad P16 G2 21FA000FGE
NVIDIA RTX 2000 Ada Generation Laptop GPU, i7-13700HX, SK hynix PC801 HFS001TEJ9X162N
10987 Points +14%
HP ZBook Fury 16 G9
RTX A5500 Laptop GPU, i9-12950HX, Micron 3400 1TB MTFDKBA1T0TFH
10958 Points +14%
Asus ProArt Studiobook 16 OLED H7604
NVIDIA GeForce RTX 4070 Laptop GPU, i9-13980HX, Phison EM2804TBMTCB47
10928 Points +13%
HP ZBook Fury 16 G11
NVIDIA RTX 3500 Ada Generation Laptop GPU, i9-14900HX, SK hynix PC801 HFS001TEJ9X101N
9647 Points
Average Intel Core i9-14900HX, NVIDIA RTX 3500 Ada Generation Laptop GPU
  ()
9647 Points 0%
PCMark 10 / Productivity
Dell Precision 5690
NVIDIA RTX 5000 Ada Generation Laptop GPU, Ultra 9 185H, 2x Samsung PM9A1 1TB (RAID 0)
10548 Points +10%
Lenovo ThinkPad P1 G6 21FV001KUS
NVIDIA GeForce RTX 4080 Laptop GPU, i7-13800H, Kioxia XG8 KXG8AZNV1T02
10029 Points +5%
Asus ProArt Studiobook 16 OLED H7604
NVIDIA GeForce RTX 4070 Laptop GPU, i9-13980HX, Phison EM2804TBMTCB47
9886 Points +3%
HP ZBook Fury 16 G11
NVIDIA RTX 3500 Ada Generation Laptop GPU, i9-14900HX, SK hynix PC801 HFS001TEJ9X101N
9554 Points
Average Intel Core i9-14900HX, NVIDIA RTX 3500 Ada Generation Laptop GPU
  ()
9554 Points 0%
Lenovo ThinkPad P16 G2 21FA000FGE
NVIDIA RTX 2000 Ada Generation Laptop GPU, i7-13700HX, SK hynix PC801 HFS001TEJ9X162N
9388 Points -2%
HP ZBook Fury 16 G10
NVIDIA RTX 5000 Ada Generation Laptop GPU, i9-13950HX, SK hynix PC801 HFS001TEJ9X101N
9344 Points -2%
HP ZBook Fury 16 G9
RTX A5500 Laptop GPU, i9-12950HX, Micron 3400 1TB MTFDKBA1T0TFH
8956 Points -6%
PCMark 10 / Digital Content Creation
HP ZBook Fury 16 G10
NVIDIA RTX 5000 Ada Generation Laptop GPU, i9-13950HX, SK hynix PC801 HFS001TEJ9X101N
13947 Points +8%
HP ZBook Fury 16 G11
NVIDIA RTX 3500 Ada Generation Laptop GPU, i9-14900HX, SK hynix PC801 HFS001TEJ9X101N
12961 Points
Average Intel Core i9-14900HX, NVIDIA RTX 3500 Ada Generation Laptop GPU
  ()
12961 Points 0%
Lenovo ThinkPad P1 G6 21FV001KUS
NVIDIA GeForce RTX 4080 Laptop GPU, i7-13800H, Kioxia XG8 KXG8AZNV1T02
12466 Points -4%
Dell Precision 5690
NVIDIA RTX 5000 Ada Generation Laptop GPU, Ultra 9 185H, 2x Samsung PM9A1 1TB (RAID 0)
12259 Points -5%
Asus ProArt Studiobook 16 OLED H7604
NVIDIA GeForce RTX 4070 Laptop GPU, i9-13980HX, Phison EM2804TBMTCB47
10558 Points -19%
Lenovo ThinkPad P16 G2 21FA000FGE
NVIDIA RTX 2000 Ada Generation Laptop GPU, i7-13700HX, SK hynix PC801 HFS001TEJ9X162N
9633 Points -26%
HP ZBook Fury 16 G9
RTX A5500 Laptop GPU, i9-12950HX, Micron 3400 1TB MTFDKBA1T0TFH
9155 Points -29%
CrossMark / Overall
Asus ProArt Studiobook 16 OLED H7604
NVIDIA GeForce RTX 4070 Laptop GPU, i9-13980HX, Phison EM2804TBMTCB47
2114 Points +4%
HP ZBook Fury 16 G11
NVIDIA RTX 3500 Ada Generation Laptop GPU, i9-14900HX, SK hynix PC801 HFS001TEJ9X101N
2037 Points
Average Intel Core i9-14900HX, NVIDIA RTX 3500 Ada Generation Laptop GPU
  ()
2037 Points 0%
HP ZBook Fury 16 G10
NVIDIA RTX 5000 Ada Generation Laptop GPU, i9-13950HX, SK hynix PC801 HFS001TEJ9X101N
1911 Points -6%
HP ZBook Fury 16 G9
RTX A5500 Laptop GPU, i9-12950HX, Micron 3400 1TB MTFDKBA1T0TFH
1889 Points -7%
Lenovo ThinkPad P16 G2 21FA000FGE
NVIDIA RTX 2000 Ada Generation Laptop GPU, i7-13700HX, SK hynix PC801 HFS001TEJ9X162N
1831 Points -10%
Lenovo ThinkPad P1 G6 21FV001KUS
NVIDIA GeForce RTX 4080 Laptop GPU, i7-13800H, Kioxia XG8 KXG8AZNV1T02
1823 Points -11%
Dell Precision 5690
NVIDIA RTX 5000 Ada Generation Laptop GPU, Ultra 9 185H, 2x Samsung PM9A1 1TB (RAID 0)
1823 Points -11%
CrossMark / Productivity
Asus ProArt Studiobook 16 OLED H7604
NVIDIA GeForce RTX 4070 Laptop GPU, i9-13980HX, Phison EM2804TBMTCB47
1950 Points +3%
HP ZBook Fury 16 G11
NVIDIA RTX 3500 Ada Generation Laptop GPU, i9-14900HX, SK hynix PC801 HFS001TEJ9X101N
1902 Points
Average Intel Core i9-14900HX, NVIDIA RTX 3500 Ada Generation Laptop GPU
  ()
1902 Points 0%
HP ZBook Fury 16 G10
NVIDIA RTX 5000 Ada Generation Laptop GPU, i9-13950HX, SK hynix PC801 HFS001TEJ9X101N
1836 Points -3%
HP ZBook Fury 16 G9
RTX A5500 Laptop GPU, i9-12950HX, Micron 3400 1TB MTFDKBA1T0TFH
1785 Points -6%
Dell Precision 5690
NVIDIA RTX 5000 Ada Generation Laptop GPU, Ultra 9 185H, 2x Samsung PM9A1 1TB (RAID 0)
1739 Points -9%
Lenovo ThinkPad P1 G6 21FV001KUS
NVIDIA GeForce RTX 4080 Laptop GPU, i7-13800H, Kioxia XG8 KXG8AZNV1T02
1729 Points -9%
Lenovo ThinkPad P16 G2 21FA000FGE
NVIDIA RTX 2000 Ada Generation Laptop GPU, i7-13700HX, SK hynix PC801 HFS001TEJ9X162N
1704 Points -10%
CrossMark / Creativity
Asus ProArt Studiobook 16 OLED H7604
NVIDIA GeForce RTX 4070 Laptop GPU, i9-13980HX, Phison EM2804TBMTCB47
2414 Points +5%
HP ZBook Fury 16 G11
NVIDIA RTX 3500 Ada Generation Laptop GPU, i9-14900HX, SK hynix PC801 HFS001TEJ9X101N
2304 Points
Average Intel Core i9-14900HX, NVIDIA RTX 3500 Ada Generation Laptop GPU
  ()
2304 Points 0%
Lenovo ThinkPad P16 G2 21FA000FGE
NVIDIA RTX 2000 Ada Generation Laptop GPU, i7-13700HX, SK hynix PC801 HFS001TEJ9X162N
2123 Points -8%
HP ZBook Fury 16 G9
RTX A5500 Laptop GPU, i9-12950HX, Micron 3400 1TB MTFDKBA1T0TFH
2119 Points -8%
HP ZBook Fury 16 G10
NVIDIA RTX 5000 Ada Generation Laptop GPU, i9-13950HX, SK hynix PC801 HFS001TEJ9X101N
2091 Points -9%
Lenovo ThinkPad P1 G6 21FV001KUS
NVIDIA GeForce RTX 4080 Laptop GPU, i7-13800H, Kioxia XG8 KXG8AZNV1T02
2039 Points -12%
Dell Precision 5690
NVIDIA RTX 5000 Ada Generation Laptop GPU, Ultra 9 185H, 2x Samsung PM9A1 1TB (RAID 0)
2025 Points -12%
CrossMark / Responsiveness
Asus ProArt Studiobook 16 OLED H7604
NVIDIA GeForce RTX 4070 Laptop GPU, i9-13980HX, Phison EM2804TBMTCB47
1811 Points +5%
HP ZBook Fury 16 G11
NVIDIA RTX 3500 Ada Generation Laptop GPU, i9-14900HX, SK hynix PC801 HFS001TEJ9X101N
1730 Points
Average Intel Core i9-14900HX, NVIDIA RTX 3500 Ada Generation Laptop GPU
  ()
1730 Points 0%
HP ZBook Fury 16 G10
NVIDIA RTX 5000 Ada Generation Laptop GPU, i9-13950HX, SK hynix PC801 HFS001TEJ9X101N
1645 Points -5%
HP ZBook Fury 16 G9
RTX A5500 Laptop GPU, i9-12950HX, Micron 3400 1TB MTFDKBA1T0TFH
1585 Points -8%
Dell Precision 5690
NVIDIA RTX 5000 Ada Generation Laptop GPU, Ultra 9 185H, 2x Samsung PM9A1 1TB (RAID 0)
1533 Points -11%
Lenovo ThinkPad P1 G6 21FV001KUS
NVIDIA GeForce RTX 4080 Laptop GPU, i7-13800H, Kioxia XG8 KXG8AZNV1T02
1529 Points -12%
Lenovo ThinkPad P16 G2 21FA000FGE
NVIDIA RTX 2000 Ada Generation Laptop GPU, i7-13700HX, SK hynix PC801 HFS001TEJ9X162N
1457 Points -16%
WebXPRT 3 / Overall
HP ZBook Fury 16 G10
NVIDIA RTX 5000 Ada Generation Laptop GPU, i9-13950HX, SK hynix PC801 HFS001TEJ9X101N
339 Points +6%
Asus ProArt Studiobook 16 OLED H7604
NVIDIA GeForce RTX 4070 Laptop GPU, i9-13980HX, Phison EM2804TBMTCB47
332 Points +4%
Lenovo ThinkPad P16 G2 21FA000FGE
NVIDIA RTX 2000 Ada Generation Laptop GPU, i7-13700HX, SK hynix PC801 HFS001TEJ9X162N
324 Points +2%
HP ZBook Fury 16 G11
NVIDIA RTX 3500 Ada Generation Laptop GPU, i9-14900HX, SK hynix PC801 HFS001TEJ9X101N
319 Points
Average Intel Core i9-14900HX, NVIDIA RTX 3500 Ada Generation Laptop GPU
  ()
319 Points 0%
Lenovo ThinkPad P1 G6 21FV001KUS
NVIDIA GeForce RTX 4080 Laptop GPU, i7-13800H, Kioxia XG8 KXG8AZNV1T02
314 Points -2%
HP ZBook Fury 16 G9
RTX A5500 Laptop GPU, i9-12950HX, Micron 3400 1TB MTFDKBA1T0TFH
305 Points -4%
Dell Precision 5690
NVIDIA RTX 5000 Ada Generation Laptop GPU, Ultra 9 185H, 2x Samsung PM9A1 1TB (RAID 0)
293 Points -8%
WebXPRT 4 / Overall
HP ZBook Fury 16 G11
NVIDIA RTX 3500 Ada Generation Laptop GPU, i9-14900HX, SK hynix PC801 HFS001TEJ9X101N
302 Points
Average Intel Core i9-14900HX, NVIDIA RTX 3500 Ada Generation Laptop GPU
  ()
302 Points 0%
HP ZBook Fury 16 G10
NVIDIA RTX 5000 Ada Generation Laptop GPU, i9-13950HX, SK hynix PC801 HFS001TEJ9X101N
301 Points 0%
Asus ProArt Studiobook 16 OLED H7604
NVIDIA GeForce RTX 4070 Laptop GPU, i9-13980HX, Phison EM2804TBMTCB47
299 Points -1%
Lenovo ThinkPad P1 G6 21FV001KUS
NVIDIA GeForce RTX 4080 Laptop GPU, i7-13800H, Kioxia XG8 KXG8AZNV1T02
283 Points -6%
HP ZBook Fury 16 G9
RTX A5500 Laptop GPU, i9-12950HX, Micron 3400 1TB MTFDKBA1T0TFH
274 Points -9%
Dell Precision 5690
NVIDIA RTX 5000 Ada Generation Laptop GPU, Ultra 9 185H, 2x Samsung PM9A1 1TB (RAID 0)
269 Points -11%
Mozilla Kraken 1.1 / Total
Dell Precision 5690
NVIDIA RTX 5000 Ada Generation Laptop GPU, Ultra 9 185H, 2x Samsung PM9A1 1TB (RAID 0)
506 ms * -13%
HP ZBook Fury 16 G9
RTX A5500 Laptop GPU, i9-12950HX, Micron 3400 1TB MTFDKBA1T0TFH
498 ms * -11%
Lenovo ThinkPad P16 G2 21FA000FGE
NVIDIA RTX 2000 Ada Generation Laptop GPU, i7-13700HX, SK hynix PC801 HFS001TEJ9X162N
489 ms * -9%
Lenovo ThinkPad P1 G6 21FV001KUS
NVIDIA GeForce RTX 4080 Laptop GPU, i7-13800H, Kioxia XG8 KXG8AZNV1T02
477 ms * -7%
HP ZBook Fury 16 G10
NVIDIA RTX 5000 Ada Generation Laptop GPU, i9-13950HX, SK hynix PC801 HFS001TEJ9X101N
451 ms * -1%
HP ZBook Fury 16 G11
NVIDIA RTX 3500 Ada Generation Laptop GPU, i9-14900HX, SK hynix PC801 HFS001TEJ9X101N
447 ms *
Average Intel Core i9-14900HX, NVIDIA RTX 3500 Ada Generation Laptop GPU
  ()
447 ms * -0%
Asus ProArt Studiobook 16 OLED H7604
NVIDIA GeForce RTX 4070 Laptop GPU, i9-13980HX, Phison EM2804TBMTCB47
446 ms * -0%

* ... im mniej tym lepiej

PCMark 10 Score
7607 pkt.
Pomoc
AIDA64 / Memory Copy
Dell Precision 5690
Intel Core Ultra 9 185H, NVIDIA RTX 5000 Ada Generation Laptop GPU
91273 MB/s +51%
Average Intel Core i9-14900HX
  (38028 - 83392, n=36)
75105 MB/s +25%
Asus ProArt Studiobook 16 OLED H7604
Intel Core i9-13980HX, NVIDIA GeForce RTX 4070 Laptop GPU
74320 MB/s +23%
HP ZBook Fury 16 G10
Intel Core i9-13950HX, NVIDIA RTX 5000 Ada Generation Laptop GPU
61938 MB/s +3%
HP ZBook Fury 16 G9
Intel Core i9-12950HX, RTX A5500 Laptop GPU
61129 MB/s +1%
HP ZBook Fury 16 G11
Intel Core i9-14900HX, NVIDIA RTX 3500 Ada Generation Laptop GPU
60295 MB/s
Lenovo ThinkPad P16 G2 21FA000FGE
Intel Core i7-13700HX, NVIDIA RTX 2000 Ada Generation Laptop GPU
56335 MB/s -7%
Lenovo ThinkPad P1 G6 21FV001KUS
Intel Core i7-13800H, NVIDIA GeForce RTX 4080 Laptop GPU
41052 MB/s -32%
AIDA64 / Memory Read
Dell Precision 5690
Intel Core Ultra 9 185H, NVIDIA RTX 5000 Ada Generation Laptop GPU
86584 MB/s +45%
Average Intel Core i9-14900HX
  (43306 - 87568, n=36)
81377 MB/s +36%
Asus ProArt Studiobook 16 OLED H7604
Intel Core i9-13980HX, NVIDIA GeForce RTX 4070 Laptop GPU
77376 MB/s +29%
HP ZBook Fury 16 G10
Intel Core i9-13950HX, NVIDIA RTX 5000 Ada Generation Laptop GPU
62368 MB/s +4%
HP ZBook Fury 16 G11
Intel Core i9-14900HX, NVIDIA RTX 3500 Ada Generation Laptop GPU
59863 MB/s
HP ZBook Fury 16 G9
Intel Core i9-12950HX, RTX A5500 Laptop GPU
59744 MB/s 0%
Lenovo ThinkPad P16 G2 21FA000FGE
Intel Core i7-13700HX, NVIDIA RTX 2000 Ada Generation Laptop GPU
57623 MB/s -4%
Lenovo ThinkPad P1 G6 21FV001KUS
Intel Core i7-13800H, NVIDIA GeForce RTX 4080 Laptop GPU
45114 MB/s -25%
AIDA64 / Memory Write
Dell Precision 5690
Intel Core Ultra 9 185H, NVIDIA RTX 5000 Ada Generation Laptop GPU
73682 MB/s +29%
Average Intel Core i9-14900HX
  (37146 - 80589, n=36)
72406 MB/s +27%
Asus ProArt Studiobook 16 OLED H7604
Intel Core i9-13980HX, NVIDIA GeForce RTX 4070 Laptop GPU
71784 MB/s +26%
HP ZBook Fury 16 G10
Intel Core i9-13950HX, NVIDIA RTX 5000 Ada Generation Laptop GPU
59501 MB/s +4%
HP ZBook Fury 16 G9
Intel Core i9-12950HX, RTX A5500 Laptop GPU
57750 MB/s +1%
Lenovo ThinkPad P16 G2 21FA000FGE
Intel Core i7-13700HX, NVIDIA RTX 2000 Ada Generation Laptop GPU
57477 MB/s +1%
HP ZBook Fury 16 G11
Intel Core i9-14900HX, NVIDIA RTX 3500 Ada Generation Laptop GPU
56987 MB/s
Lenovo ThinkPad P1 G6 21FV001KUS
Intel Core i7-13800H, NVIDIA GeForce RTX 4080 Laptop GPU
39946 MB/s -30%
AIDA64 / Memory Latency
Dell Precision 5690
Intel Core Ultra 9 185H, NVIDIA RTX 5000 Ada Generation Laptop GPU
140.8 ns * -46%
HP ZBook Fury 16 G10
Intel Core i9-13950HX, NVIDIA RTX 5000 Ada Generation Laptop GPU
98.7 ns * -2%
Lenovo ThinkPad P16 G2 21FA000FGE
Intel Core i7-13700HX, NVIDIA RTX 2000 Ada Generation Laptop GPU
97.9 ns * -2%
HP ZBook Fury 16 G11
Intel Core i9-14900HX, NVIDIA RTX 3500 Ada Generation Laptop GPU
96.3 ns *
HP ZBook Fury 16 G9
Intel Core i9-12950HX, RTX A5500 Laptop GPU
91.4 ns * +5%
Asus ProArt Studiobook 16 OLED H7604
Intel Core i9-13980HX, NVIDIA GeForce RTX 4070 Laptop GPU
85.6 ns * +11%
Lenovo ThinkPad P1 G6 21FV001KUS
Intel Core i7-13800H, NVIDIA GeForce RTX 4080 Laptop GPU
85.4 ns * +11%
Average Intel Core i9-14900HX
  (76.1 - 105, n=36)
84.7 ns * +12%

* ... im mniej tym lepiej

Opóźnienie DPC

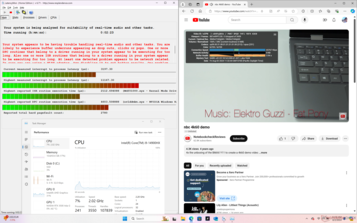
LatencyMon ujawnia problemy z DPC podczas otwierania wielu kart przeglądarki na naszej stronie głównej. odtwarzanie wideo 4K przy 60 FPS jest poza tym idealne i nie odnotowano żadnych spadków klatek.

LatencyMon
LatencyMon
Lista kierowców
Lista kierowców
DPC Latencies / LatencyMon - interrupt to process latency (max), Web, Youtube, Prime95
HP ZBook Fury 16 G11
NVIDIA RTX 3500 Ada Generation Laptop GPU, i9-14900HX, SK hynix PC801 HFS001TEJ9X101N
11167.3 μs *
HP ZBook Fury 16 G10
NVIDIA RTX 5000 Ada Generation Laptop GPU, i9-13950HX, SK hynix PC801 HFS001TEJ9X101N
2684.8 μs * +76%
HP ZBook Fury 16 G9
RTX A5500 Laptop GPU, i9-12950HX, Micron 3400 1TB MTFDKBA1T0TFH
2293.9 μs * +79%
Asus ProArt Studiobook 16 OLED H7604
NVIDIA GeForce RTX 4070 Laptop GPU, i9-13980HX, Phison EM2804TBMTCB47
2025.1 μs * +82%
Lenovo ThinkPad P1 G6 21FV001KUS
NVIDIA GeForce RTX 4080 Laptop GPU, i7-13800H, Kioxia XG8 KXG8AZNV1T02
1395.8 μs * +88%
Lenovo ThinkPad P16 G2 21FA000FGE
NVIDIA RTX 2000 Ada Generation Laptop GPU, i7-13700HX, SK hynix PC801 HFS001TEJ9X162N
1004.2 μs * +91%
Dell Precision 5690
NVIDIA RTX 5000 Ada Generation Laptop GPU, Ultra 9 185H, 2x Samsung PM9A1 1TB (RAID 0)
505.5 μs * +95%

* ... im mniej tym lepiej

Urządzenia pamięci masowej

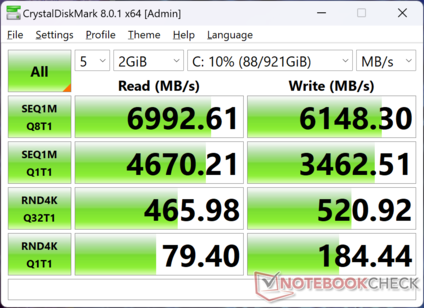
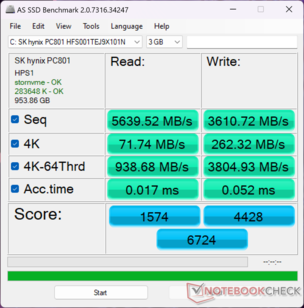
Nasza jednostka testowa jest dostarczana z tym samym dyskiem 1 TB SK Hynix PC801 HFS001TEJ9X101N PCIe4 M.2 SSD, który znalazł się w zeszłorocznym ZBook Fury 16 G10. Niestety, dysk ten cierpi również na te same problemy z dławieniem wydajności. Po uruchomieniu DiskSpd w pętli, szybkość transferu zaczynała się od bardzo wysokiego poziomu prawie 7000 MB/s, a następnie spadała do 3400 MB/s zaledwie kilka minut później, jak pokazano na poniższym wykresie. Można to przypisać niewystarczającemu chłodzeniu dysków, ale być może jest to cena za obsługę większej liczby pojedynczych dysków niż w większości innych laptopów.

CDM 8
CDM 8
AS SSD
AS SSD
SK hynix PC801 HFS001TEJ9X101N
CDM 5/6 Read Seq Q32T1: 6944 MB/s
CDM 5/6 Write Seq Q32T1: 5975 MB/s
CDM 5/6 Read 4K Q32T1: 464.6 MB/s
CDM 5/6 Write 4K Q32T1: 533.5 MB/s
CDM 5 Read Seq: 4708 MB/s
CDM 5 Write Seq: 3454 MB/s
CDM 5/6 Read 4K: 73.95 MB/s
CDM 5/6 Write 4K: 180.2 MB/s
Drive Performance Rating - Percent
HP ZBook Fury 16 G9
Micron 3400 1TB MTFDKBA1T0TFH
71 pt
Asus ProArt Studiobook 16 OLED H7604
Phison EM2804TBMTCB47
70.8 pt
HP ZBook Fury 16 G11
SK hynix PC801 HFS001TEJ9X101N
69.2 pt
Dell Precision 5690
2x Samsung PM9A1 1TB (RAID 0)
66.1 pt
HP ZBook Fury 16 G10
SK hynix PC801 HFS001TEJ9X101N
64.1 pt
Lenovo ThinkPad P16 G2 21FA000FGE
SK hynix PC801 HFS001TEJ9X162N
56.8 pt
Lenovo ThinkPad P1 G6 21FV001KUS
Kioxia XG8 KXG8AZNV1T02
55 pt
DiskSpd
seq read
Dell Precision 5690
2x Samsung PM9A1 1TB (RAID 0)
5715 (5635.1min - 5715.37max) MB/s +18%
HP ZBook Fury 16 G11
SK hynix PC801 HFS001TEJ9X101N
4835 (4788.71min - 4834.56max) MB/s
Lenovo ThinkPad P16 G2 21FA000FGE
SK hynix PC801 HFS001TEJ9X162N
4658 (4604.53min - 4657.77max) MB/s -4%
Asus ProArt Studiobook 16 OLED H7604
Phison EM2804TBMTCB47
3687 (3440.34min - 3686.58max) MB/s -24%
Lenovo ThinkPad P1 G6 21FV001KUS
Kioxia XG8 KXG8AZNV1T02
3503 (3488.82min - 3503.08max) MB/s -28%
HP ZBook Fury 16 G10
SK hynix PC801 HFS001TEJ9X101N
3491 (3465.76min - 3491.19max) MB/s -28%
HP ZBook Fury 16 G9
Micron 3400 1TB MTFDKBA1T0TFH
2966 (2946.31min - 2966.15max) MB/s -39%
seq write
Dell Precision 5690
2x Samsung PM9A1 1TB (RAID 0)
7289 (7243.34min - 7289.49max) MB/s +105%
HP ZBook Fury 16 G9
Micron 3400 1TB MTFDKBA1T0TFH
3916 (3819.63min - 3916.36max) MB/s +10%
Asus ProArt Studiobook 16 OLED H7604
Phison EM2804TBMTCB47
3783 MB/s +7%
Lenovo ThinkPad P1 G6 21FV001KUS
Kioxia XG8 KXG8AZNV1T02
3660 (3397.18min - 3659.74max) MB/s +3%
Lenovo ThinkPad P16 G2 21FA000FGE
SK hynix PC801 HFS001TEJ9X162N
3564 (3288.75min - 3564.11max) MB/s 0%
HP ZBook Fury 16 G11
SK hynix PC801 HFS001TEJ9X101N
3548 (3467.85min - 3547.93max) MB/s
HP ZBook Fury 16 G10
SK hynix PC801 HFS001TEJ9X101N
3329 (3125.64min - 3329.18max) MB/s -6%
seq q8 t1 read
Dell Precision 5690
2x Samsung PM9A1 1TB (RAID 0)
12631 (9772.1min - 12631.4max) MB/s +81%
Lenovo ThinkPad P16 G2 21FA000FGE
SK hynix PC801 HFS001TEJ9X162N
7157 (6238.19min - 7156.53max) MB/s +3%
Asus ProArt Studiobook 16 OLED H7604
Phison EM2804TBMTCB47
7020 (6541.02min - 7019.8max) MB/s +1%
HP ZBook Fury 16 G11
SK hynix PC801 HFS001TEJ9X101N
6961 (6365.34min - 6960.66max) MB/s
HP ZBook Fury 16 G10
SK hynix PC801 HFS001TEJ9X101N
6777 (5485.73min - 6777.16max) MB/s -3%
Lenovo ThinkPad P1 G6 21FV001KUS
Kioxia XG8 KXG8AZNV1T02
6636 (5448.61min - 6636.23max) MB/s -5%
HP ZBook Fury 16 G9
Micron 3400 1TB MTFDKBA1T0TFH
6519 (5611.35min - 6518.79max) MB/s -6%
seq q8 t1 write
Dell Precision 5690
2x Samsung PM9A1 1TB (RAID 0)
9890 (9840.5min - 9889.75max) MB/s +61%
Asus ProArt Studiobook 16 OLED H7604
Phison EM2804TBMTCB47
6454 (6410.36min - 6454.19max) MB/s +5%
HP ZBook Fury 16 G11
SK hynix PC801 HFS001TEJ9X101N
6159 (6120.41min - 6159.34max) MB/s
Lenovo ThinkPad P16 G2 21FA000FGE
SK hynix PC801 HFS001TEJ9X162N
6125 (6104.39min - 6125.07max) MB/s -1%
HP ZBook Fury 16 G10
SK hynix PC801 HFS001TEJ9X101N
5947 (5906.91min - 5946.83max) MB/s -3%
Lenovo ThinkPad P1 G6 21FV001KUS
Kioxia XG8 KXG8AZNV1T02
5451 (5419.81min - 5451.12max) MB/s -11%
HP ZBook Fury 16 G9
Micron 3400 1TB MTFDKBA1T0TFH
4869 (4421.43min - 4869.17max) MB/s -21%
4k q1 t1 read
Dell Precision 5690
2x Samsung PM9A1 1TB (RAID 0)
73.6 (72.71min - 73.64max) MB/s +14%
Asus ProArt Studiobook 16 OLED H7604
Phison EM2804TBMTCB47
71.1 (70.39min - 71.1max) MB/s +11%
HP ZBook Fury 16 G10
SK hynix PC801 HFS001TEJ9X101N
67.7 (66.87min - 67.69max) MB/s +5%
HP ZBook Fury 16 G11
SK hynix PC801 HFS001TEJ9X101N
64.3 (64.19min - 64.33max) MB/s
HP ZBook Fury 16 G9
Micron 3400 1TB MTFDKBA1T0TFH
64.1 (61.53min - 64.12max) MB/s 0%
Lenovo ThinkPad P1 G6 21FV001KUS
Kioxia XG8 KXG8AZNV1T02
59.7 (58.3min - 59.71max) MB/s -7%
Lenovo ThinkPad P16 G2 21FA000FGE
SK hynix PC801 HFS001TEJ9X162N
55.2 (54.95min - 55.23max) MB/s -14%
4k q1 t1 write
Asus ProArt Studiobook 16 OLED H7604
Phison EM2804TBMTCB47
183.3 (141.67min - 183.25max) MB/s +13%
HP ZBook Fury 16 G10
SK hynix PC801 HFS001TEJ9X101N
168.1 (166.5min - 168.07max) MB/s +4%
HP ZBook Fury 16 G11
SK hynix PC801 HFS001TEJ9X101N
162.1 (160.38min - 162.08max) MB/s
Dell Precision 5690
2x Samsung PM9A1 1TB (RAID 0)
152.4 (152.02min - 152.36max) MB/s -6%
Lenovo ThinkPad P1 G6 21FV001KUS
Kioxia XG8 KXG8AZNV1T02
145.6 (142.59min - 145.61max) MB/s -10%
HP ZBook Fury 16 G9
Micron 3400 1TB MTFDKBA1T0TFH
145 (142.99min - 144.96max) MB/s -11%
Lenovo ThinkPad P16 G2 21FA000FGE
SK hynix PC801 HFS001TEJ9X162N
122.2 (121.67min - 122.17max) MB/s -25%
4k q32 t16 read
HP ZBook Fury 16 G9
Micron 3400 1TB MTFDKBA1T0TFH
2855 (2838.05min - 2855.41max) MB/s +215%
Dell Precision 5690
2x Samsung PM9A1 1TB (RAID 0)
1184 (1095.52min - 1183.72max) MB/s +31%
HP ZBook Fury 16 G10
SK hynix PC801 HFS001TEJ9X101N
921 (877.33min - 921.47max) MB/s +2%
Lenovo ThinkPad P16 G2 21FA000FGE
SK hynix PC801 HFS001TEJ9X162N
909 (877.94min - 908.91max) MB/s 0%
HP ZBook Fury 16 G11
SK hynix PC801 HFS001TEJ9X101N
905 (889.91min - 905max) MB/s
Lenovo ThinkPad P1 G6 21FV001KUS
Kioxia XG8 KXG8AZNV1T02
899 (889.43min - 899max) MB/s -1%
Asus ProArt Studiobook 16 OLED H7604
Phison EM2804TBMTCB47
694 (677.77min - 693.63max) MB/s -23%
4k q32 t16 write
HP ZBook Fury 16 G9
Micron 3400 1TB MTFDKBA1T0TFH
2697 (2651.14min - 2697.47max) MB/s +413%
Dell Precision 5690
2x Samsung PM9A1 1TB (RAID 0)
1146 (1126.09min - 1146.07max) MB/s +118%
Asus ProArt Studiobook 16 OLED H7604
Phison EM2804TBMTCB47
558 (516.09min - 558.29max) MB/s +6%
HP ZBook Fury 16 G11
SK hynix PC801 HFS001TEJ9X101N
526 (510.99min - 525.65max) MB/s
HP ZBook Fury 16 G10
SK hynix PC801 HFS001TEJ9X101N
524 (499.38min - 523.63max) MB/s 0%
Lenovo ThinkPad P16 G2 21FA000FGE
SK hynix PC801 HFS001TEJ9X162N
457 (451.72min - 456.57max) MB/s -13%
Lenovo ThinkPad P1 G6 21FV001KUS
Kioxia XG8 KXG8AZNV1T02
448 (431.88min - 448.49max) MB/s -15%
AS SSD
Score Total
Asus ProArt Studiobook 16 OLED H7604
Phison EM2804TBMTCB47
7095 Points +6%
HP ZBook Fury 16 G9
Micron 3400 1TB MTFDKBA1T0TFH
6969 Points +4%
HP ZBook Fury 16 G11
SK hynix PC801 HFS001TEJ9X101N
6724 Points
HP ZBook Fury 16 G10
SK hynix PC801 HFS001TEJ9X101N
6420 Points -5%
Lenovo ThinkPad P16 G2 21FA000FGE
SK hynix PC801 HFS001TEJ9X162N
5943 Points -12%
Lenovo ThinkPad P1 G6 21FV001KUS
Kioxia XG8 KXG8AZNV1T02
5124 Points -24%
Dell Precision 5690
2x Samsung PM9A1 1TB (RAID 0)
4034 Points -40%
Score Read
HP ZBook Fury 16 G9
Micron 3400 1TB MTFDKBA1T0TFH
2650 Points +68%
Dell Precision 5690
2x Samsung PM9A1 1TB (RAID 0)
1643 Points +4%
HP ZBook Fury 16 G11
SK hynix PC801 HFS001TEJ9X101N
1574 Points
Asus ProArt Studiobook 16 OLED H7604
Phison EM2804TBMTCB47
1570 Points 0%
HP ZBook Fury 16 G10
SK hynix PC801 HFS001TEJ9X101N
1554 Points -1%
Lenovo ThinkPad P1 G6 21FV001KUS
Kioxia XG8 KXG8AZNV1T02
1514 Points -4%
Lenovo ThinkPad P16 G2 21FA000FGE
SK hynix PC801 HFS001TEJ9X162N
1490 Points -5%
Score Write
Asus ProArt Studiobook 16 OLED H7604
Phison EM2804TBMTCB47
4813 Points +9%
HP ZBook Fury 16 G11
SK hynix PC801 HFS001TEJ9X101N
4428 Points
HP ZBook Fury 16 G10
SK hynix PC801 HFS001TEJ9X101N
4189 Points -5%
Lenovo ThinkPad P16 G2 21FA000FGE
SK hynix PC801 HFS001TEJ9X162N
3831 Points -13%
HP ZBook Fury 16 G9
Micron 3400 1TB MTFDKBA1T0TFH
3114 Points -30%
Lenovo ThinkPad P1 G6 21FV001KUS
Kioxia XG8 KXG8AZNV1T02
2929 Points -34%
Dell Precision 5690
2x Samsung PM9A1 1TB (RAID 0)
1606 Points -64%
Seq Read
Dell Precision 5690
2x Samsung PM9A1 1TB (RAID 0)
7244.14 MB/s +28%
HP ZBook Fury 16 G11
SK hynix PC801 HFS001TEJ9X101N
5639.52 MB/s
HP ZBook Fury 16 G10
SK hynix PC801 HFS001TEJ9X101N
5596.17 MB/s -1%
Lenovo ThinkPad P1 G6 21FV001KUS
Kioxia XG8 KXG8AZNV1T02
5478.37 MB/s -3%
Asus ProArt Studiobook 16 OLED H7604
Phison EM2804TBMTCB47
5350 MB/s -5%
HP ZBook Fury 16 G9
Micron 3400 1TB MTFDKBA1T0TFH
5238.16 MB/s -7%
Lenovo ThinkPad P16 G2 21FA000FGE
SK hynix PC801 HFS001TEJ9X162N
4939 MB/s -12%
Seq Write
Dell Precision 5690
2x Samsung PM9A1 1TB (RAID 0)
5881.98 MB/s +63%
HP ZBook Fury 16 G11
SK hynix PC801 HFS001TEJ9X101N
3610.72 MB/s
Lenovo ThinkPad P1 G6 21FV001KUS
Kioxia XG8 KXG8AZNV1T02
3321.62 MB/s -8%
Asus ProArt Studiobook 16 OLED H7604
Phison EM2804TBMTCB47
3138 MB/s -13%
HP ZBook Fury 16 G10
SK hynix PC801 HFS001TEJ9X101N
2896.03 MB/s -20%
HP ZBook Fury 16 G9
Micron 3400 1TB MTFDKBA1T0TFH
2223.02 MB/s -38%
Lenovo ThinkPad P16 G2 21FA000FGE
SK hynix PC801 HFS001TEJ9X162N
2028 MB/s -44%
4K Read
Asus ProArt Studiobook 16 OLED H7604
Phison EM2804TBMTCB47
74.1 MB/s +3%
HP ZBook Fury 16 G11
SK hynix PC801 HFS001TEJ9X101N
71.74 MB/s
HP ZBook Fury 16 G10
SK hynix PC801 HFS001TEJ9X101N
69.7 MB/s -3%
Dell Precision 5690
2x Samsung PM9A1 1TB (RAID 0)
63.22 MB/s -12%
Lenovo ThinkPad P1 G6 21FV001KUS
Kioxia XG8 KXG8AZNV1T02
62.07 MB/s -13%
HP ZBook Fury 16 G9
Micron 3400 1TB MTFDKBA1T0TFH
60.97 MB/s -15%
Lenovo ThinkPad P16 G2 21FA000FGE
SK hynix PC801 HFS001TEJ9X162N
46.6 MB/s -35%
4K Write
HP ZBook Fury 16 G11
SK hynix PC801 HFS001TEJ9X101N
262.32 MB/s
HP ZBook Fury 16 G10
SK hynix PC801 HFS001TEJ9X101N
252.18 MB/s -4%
Asus ProArt Studiobook 16 OLED H7604
Phison EM2804TBMTCB47
235 MB/s -10%
Lenovo ThinkPad P1 G6 21FV001KUS
Kioxia XG8 KXG8AZNV1T02
202.77 MB/s -23%
HP ZBook Fury 16 G9
Micron 3400 1TB MTFDKBA1T0TFH
194.91 MB/s -26%
Dell Precision 5690
2x Samsung PM9A1 1TB (RAID 0)
138.37 MB/s -47%
Lenovo ThinkPad P16 G2 21FA000FGE
SK hynix PC801 HFS001TEJ9X162N
113.7 MB/s -57%
4K-64 Read
HP ZBook Fury 16 G9
Micron 3400 1TB MTFDKBA1T0TFH
2065.28 MB/s +120%
Asus ProArt Studiobook 16 OLED H7604
Phison EM2804TBMTCB47
961 MB/s +2%
Lenovo ThinkPad P16 G2 21FA000FGE
SK hynix PC801 HFS001TEJ9X162N
949 MB/s +1%
HP ZBook Fury 16 G11
SK hynix PC801 HFS001TEJ9X101N
938.68 MB/s
HP ZBook Fury 16 G10
SK hynix PC801 HFS001TEJ9X101N
924.95 MB/s -1%
Lenovo ThinkPad P1 G6 21FV001KUS
Kioxia XG8 KXG8AZNV1T02
904.56 MB/s -4%
Dell Precision 5690
2x Samsung PM9A1 1TB (RAID 0)
855.44 MB/s -9%
4K-64 Write
Asus ProArt Studiobook 16 OLED H7604
Phison EM2804TBMTCB47
4265 MB/s +12%
HP ZBook Fury 16 G11
SK hynix PC801 HFS001TEJ9X101N
3804.93 MB/s
HP ZBook Fury 16 G10
SK hynix PC801 HFS001TEJ9X101N
3646.75 MB/s -4%
Lenovo ThinkPad P16 G2 21FA000FGE
SK hynix PC801 HFS001TEJ9X162N
3514 MB/s -8%
HP ZBook Fury 16 G9
Micron 3400 1TB MTFDKBA1T0TFH
2697.14 MB/s -29%
Lenovo ThinkPad P1 G6 21FV001KUS
Kioxia XG8 KXG8AZNV1T02
2394.1 MB/s -37%
Dell Precision 5690
2x Samsung PM9A1 1TB (RAID 0)
879.16 MB/s -77%
Access Time Read
Lenovo ThinkPad P1 G6 21FV001KUS
Kioxia XG8 KXG8AZNV1T02
0.086 ms * -406%
Lenovo ThinkPad P16 G2 21FA000FGE
SK hynix PC801 HFS001TEJ9X162N
0.067 ms * -294%
Dell Precision 5690
2x Samsung PM9A1 1TB (RAID 0)
0.055 ms * -224%
HP ZBook Fury 16 G10
SK hynix PC801 HFS001TEJ9X101N
0.052 ms * -206%
HP ZBook Fury 16 G9
Micron 3400 1TB MTFDKBA1T0TFH
0.038 ms * -124%
Asus ProArt Studiobook 16 OLED H7604
Phison EM2804TBMTCB47
0.036 ms * -112%
HP ZBook Fury 16 G11
SK hynix PC801 HFS001TEJ9X101N
0.017 ms *
Access Time Write
Dell Precision 5690
2x Samsung PM9A1 1TB (RAID 0)
0.088 ms * -69%
HP ZBook Fury 16 G9
Micron 3400 1TB MTFDKBA1T0TFH
0.064 ms * -23%
Lenovo ThinkPad P1 G6 21FV001KUS
Kioxia XG8 KXG8AZNV1T02
0.058 ms * -12%
HP ZBook Fury 16 G10
SK hynix PC801 HFS001TEJ9X101N
0.053 ms * -2%
HP ZBook Fury 16 G11
SK hynix PC801 HFS001TEJ9X101N
0.052 ms *
Lenovo ThinkPad P16 G2 21FA000FGE
SK hynix PC801 HFS001TEJ9X162N
0.034 ms * +35%
Asus ProArt Studiobook 16 OLED H7604
Phison EM2804TBMTCB47
0.013 ms * +75%

* ... im mniej tym lepiej

Disk Throttling: DiskSpd Read Loop, Queue Depth 8

035070010501400175021002450280031503500385042004550490052505600595063006650Tooltip
HP ZBook Fury 16 G11 SK hynix PC801 HFS001TEJ9X101N; diskspd 2.0.17 f: Ø5610 (3481.65-6919.34)
HP ZBook Fury 16 G10 SK hynix PC801 HFS001TEJ9X101N: Ø4482 (3435.97-6784.43)
HP ZBook Fury 16 G9 Micron 3400 1TB MTFDKBA1T0TFH: Ø2655 (1616.82-6560.52)

Wydajność GPU

Użytkownicy mogą spodziewać się RTX 3500 Ada będzie działał około 20 do 30 procent wolniej niż RTX 5000 Ada. Ponieważ Nvidia nie wprowadziła jeszcze nowej generacji mobilnych procesorów graficznych, ZBook Fury 16 G11 jest dostarczany z tymi samymi opcjami GPU, co w zeszłorocznym modelu, bez godnego uwagi wzrostu wydajności. RTA 5000 Ada pozostaje najszybszym dostępnym procesorem graficznym dla mobilnych stacji roboczych.

Profil zasilaniaWynik grafikiWynik fizykiWynik łączny
Tryb wydajności292483668211830
Tryb zrównoważony28214 (-4%)33094 (-10%)10246 (-13%)
Zasilanie bateryjne16618 (-43%)25118 (-32%)4101 (-65%)

Praca w trybie zrównoważonym zamiast w trybie wydajnościowym wpłynęłaby na wydajność nawet o 10 do 15 procent, jak wynika z powyższej tabeli Fire Strike. Deficyt wydajności wzrasta jeszcze bardziej w przypadku pracy na zasilaniu bateryjnym, czego należy oczekiwać od większości laptopów o wysokiej wydajności.

3DMark 11
3DMark 11
Steel Nomad
Steel Nomad
Fire Strike
Fire Strike
Speed Way
Speed Way
Time Spy
Time Spy
 
3DMark Performance Rating - Percent
HP ZBook Fury 16 G10 -2!
NVIDIA RTX 5000 Ada Generation Laptop GPU, Intel Core i9-13950HX
93.8 pt
Dell Precision 5690 -2!
NVIDIA RTX 5000 Ada Generation Laptop GPU, Intel Core Ultra 9 185H
88.1 pt
Dell Precision 5000 5680 -2!
NVIDIA RTX 5000 Ada Generation Laptop GPU, Intel Core i9-13900H
87.2 pt
HP ZBook Fury 16 G11
NVIDIA RTX 3500 Ada Generation Laptop GPU, Intel Core i9-14900HX
84.5 pt
Average NVIDIA RTX 3500 Ada Generation Laptop GPU
 
84.5 pt
Lenovo ThinkPad P1 G6 21FV001KUS -2!
NVIDIA GeForce RTX 4080 Laptop GPU, Intel Core i7-13800H
65 pt
Lenovo ThinkPad P1 G6-21FV000DGE -17!
NVIDIA RTX 2000 Ada Generation Laptop GPU, Intel Core i9-13900H
62.6 pt
HP ZBook Fury 16 G9 -2!
NVIDIA RTX A5500 Laptop GPU, Intel Core i9-12950HX
62.5 pt
Lenovo ThinkPad P16 G2 21FA000FGE -17!
NVIDIA RTX 2000 Ada Generation Laptop GPU, Intel Core i7-13700HX
59.8 pt
MSI CreatorPro Z16P B12UKST -17!
NVIDIA RTX A3000 Laptop GPU, Intel Core i7-12700H
52.8 pt
Asus ProArt Studiobook 16 OLED H7604 -17!
NVIDIA GeForce RTX 4070 Laptop GPU, Intel Core i9-13980HX
50.9 pt
Asus ExpertBook B6 Flip B6602FC2 -17!
NVIDIA RTX A2000 Laptop GPU, Intel Core i9-12950HX
44.4 pt
Lenovo ThinkPad P1 G4-20Y4S0KS00 -10!
NVIDIA GeForce RTX 3070 Laptop GPU, Intel Core i7-11850H
39.4 pt
Lenovo ThinkPad P16v G1 AMD -17!
NVIDIA RTX A1000 Laptop GPU, AMD Ryzen 7 PRO 7840HS
38.9 pt
3DMark 11 - 1280x720 Performance GPU
HP ZBook Fury 16 G10
NVIDIA RTX 5000 Ada Generation Laptop GPU, Intel Core i9-13950HX
54334 Points +31%
Dell Precision 5000 5680
NVIDIA RTX 5000 Ada Generation Laptop GPU, Intel Core i9-13900H
51771 Points +24%
Dell Precision 5690
NVIDIA RTX 5000 Ada Generation Laptop GPU, Intel Core Ultra 9 185H
49833 Points +20%
Lenovo ThinkPad P1 G6 21FV001KUS
NVIDIA GeForce RTX 4080 Laptop GPU, Intel Core i7-13800H
49352 Points +19%
HP ZBook Fury 16 G11
NVIDIA RTX 3500 Ada Generation Laptop GPU, Intel Core i9-14900HX
41630 Points
Average NVIDIA RTX 3500 Ada Generation Laptop GPU
  ()
41630 Points 0%
Asus ProArt Studiobook 16 OLED H7604
NVIDIA GeForce RTX 4070 Laptop GPU, Intel Core i9-13980HX
40331 Points -3%
HP ZBook Fury 16 G9
NVIDIA RTX A5500 Laptop GPU, Intel Core i9-12950HX
33715 Points -19%
Lenovo ThinkPad P16 G2 21FA000FGE
NVIDIA RTX 2000 Ada Generation Laptop GPU, Intel Core i7-13700HX
33001 Points -21%
Lenovo ThinkPad P1 G6-21FV000DGE
NVIDIA RTX 2000 Ada Generation Laptop GPU, Intel Core i9-13900H
30262 Points -27%
Lenovo ThinkPad P1 G4-20Y4S0KS00
NVIDIA GeForce RTX 3070 Laptop GPU, Intel Core i7-11850H
30237 Points -27%
MSI CreatorPro Z16P B12UKST
NVIDIA RTX A3000 Laptop GPU, Intel Core i7-12700H
25990 Points -38%
Asus ExpertBook B6 Flip B6602FC2
NVIDIA RTX A2000 Laptop GPU, Intel Core i9-12950HX
19823 Points -52%
Lenovo ThinkPad P16v G1 AMD
NVIDIA RTX A1000 Laptop GPU, AMD Ryzen 7 PRO 7840HS
15867 Points -62%
3DMark
1920x1080 Fire Strike Graphics
HP ZBook Fury 16 G10
NVIDIA RTX 5000 Ada Generation Laptop GPU, Intel Core i9-13950HX
35868 Points +23%
Lenovo ThinkPad P1 G6 21FV001KUS
NVIDIA GeForce RTX 4080 Laptop GPU, Intel Core i7-13800H
33402 Points +14%
Dell Precision 5000 5680
NVIDIA RTX 5000 Ada Generation Laptop GPU, Intel Core i9-13900H
30422 Points +4%
Dell Precision 5690
NVIDIA RTX 5000 Ada Generation Laptop GPU, Intel Core Ultra 9 185H
29664 Points +1%
HP ZBook Fury 16 G11
NVIDIA RTX 3500 Ada Generation Laptop GPU, Intel Core i9-14900HX
29248 Points
Average NVIDIA RTX 3500 Ada Generation Laptop GPU
  ()
29248 Points 0%
Asus ProArt Studiobook 16 OLED H7604
NVIDIA GeForce RTX 4070 Laptop GPU, Intel Core i9-13980HX
28700 Points -2%
HP ZBook Fury 16 G9
NVIDIA RTX A5500 Laptop GPU, Intel Core i9-12950HX
25713 Points -12%
Lenovo ThinkPad P16 G2 21FA000FGE
NVIDIA RTX 2000 Ada Generation Laptop GPU, Intel Core i7-13700HX
24596 Points -16%
Lenovo ThinkPad P1 G4-20Y4S0KS00
NVIDIA GeForce RTX 3070 Laptop GPU, Intel Core i7-11850H
22472 Points -23%
Lenovo ThinkPad P1 G6-21FV000DGE
NVIDIA RTX 2000 Ada Generation Laptop GPU, Intel Core i9-13900H
22039 Points -25%
MSI CreatorPro Z16P B12UKST
NVIDIA RTX A3000 Laptop GPU, Intel Core i7-12700H
19710 Points -33%
Asus ExpertBook B6 Flip B6602FC2
NVIDIA RTX A2000 Laptop GPU, Intel Core i9-12950HX
15988 Points -45%
Lenovo ThinkPad P16v G1 AMD
NVIDIA RTX A1000 Laptop GPU, AMD Ryzen 7 PRO 7840HS
11728 Points -60%
2560x1440 Time Spy Graphics
HP ZBook Fury 16 G10
NVIDIA RTX 5000 Ada Generation Laptop GPU, Intel Core i9-13950HX
16218 Points +27%
Dell Precision 5000 5680
NVIDIA RTX 5000 Ada Generation Laptop GPU, Intel Core i9-13900H
14861 Points +16%
Dell Precision 5690
NVIDIA RTX 5000 Ada Generation Laptop GPU, Intel Core Ultra 9 185H
14472 Points +13%
Lenovo ThinkPad P1 G6 21FV001KUS
NVIDIA GeForce RTX 4080 Laptop GPU, Intel Core i7-13800H
14099 Points +10%
HP ZBook Fury 16 G11
NVIDIA RTX 3500 Ada Generation Laptop GPU, Intel Core i9-14900HX
12806 Points
Average NVIDIA RTX 3500 Ada Generation Laptop GPU
  ()
12806 Points 0%
Asus ProArt Studiobook 16 OLED H7604
NVIDIA GeForce RTX 4070 Laptop GPU, Intel Core i9-13980HX
11730 Points -8%
Lenovo ThinkPad P16 G2 21FA000FGE
NVIDIA RTX 2000 Ada Generation Laptop GPU, Intel Core i7-13700HX
9158 Points -28%
HP ZBook Fury 16 G9
NVIDIA RTX A5500 Laptop GPU, Intel Core i9-12950HX
8940 Points -30%
Lenovo ThinkPad P1 G6-21FV000DGE
NVIDIA RTX 2000 Ada Generation Laptop GPU, Intel Core i9-13900H
8433 Points -34%
Lenovo ThinkPad P1 G4-20Y4S0KS00
NVIDIA GeForce RTX 3070 Laptop GPU, Intel Core i7-11850H
8391 Points -34%
MSI CreatorPro Z16P B12UKST
NVIDIA RTX A3000 Laptop GPU, Intel Core i7-12700H
7320 Points -43%
Asus ExpertBook B6 Flip B6602FC2
NVIDIA RTX A2000 Laptop GPU, Intel Core i9-12950HX
6108 Points -52%
Lenovo ThinkPad P16v G1 AMD
NVIDIA RTX A1000 Laptop GPU, AMD Ryzen 7 PRO 7840HS
4410 Points -66%
SPECviewperf 12
1900x1060 Solidworks (sw-03)
HP ZBook Fury 16 G10
NVIDIA RTX 5000 Ada Generation Laptop GPU, Intel Core i9-13950HX
225.04 fps +7%
Average NVIDIA RTX 3500 Ada Generation Laptop GPU
  ()
211 fps 0%
HP ZBook Fury 16 G11
NVIDIA RTX 3500 Ada Generation Laptop GPU, Intel Core i9-14900HX
210.7 fps
Dell Precision 5000 5680
NVIDIA RTX 5000 Ada Generation Laptop GPU, Intel Core i9-13900H
201.1 fps -5%
Dell Precision 5690
NVIDIA RTX 5000 Ada Generation Laptop GPU, Intel Core Ultra 9 185H
189.92 fps -10%
HP ZBook Fury 16 G9
NVIDIA RTX A5500 Laptop GPU, Intel Core i9-12950HX
167.74 fps -20%
Lenovo ThinkPad P1 G6 21FV001KUS
NVIDIA GeForce RTX 4080 Laptop GPU, Intel Core i7-13800H
88.78 fps -58%
1900x1060 Siemens NX (snx-02)
HP ZBook Fury 16 G10
NVIDIA RTX 5000 Ada Generation Laptop GPU, Intel Core i9-13950HX
308.58 fps +29%
Dell Precision 5690
NVIDIA RTX 5000 Ada Generation Laptop GPU, Intel Core Ultra 9 185H
292 fps +22%
Dell Precision 5000 5680
NVIDIA RTX 5000 Ada Generation Laptop GPU, Intel Core i9-13900H
291.54 fps +22%
HP ZBook Fury 16 G11
NVIDIA RTX 3500 Ada Generation Laptop GPU, Intel Core i9-14900HX
239.13 fps
Average NVIDIA RTX 3500 Ada Generation Laptop GPU
  ()
239 fps 0%
HP ZBook Fury 16 G9
NVIDIA RTX A5500 Laptop GPU, Intel Core i9-12950HX
176.66 fps -26%
Lenovo ThinkPad P1 G6 21FV001KUS
NVIDIA GeForce RTX 4080 Laptop GPU, Intel Core i7-13800H
27.18 fps -89%
1900x1060 Showcase (showcase-01)
HP ZBook Fury 16 G10
NVIDIA RTX 5000 Ada Generation Laptop GPU, Intel Core i9-13950HX
172.49 fps +18%
Lenovo ThinkPad P1 G6 21FV001KUS
NVIDIA GeForce RTX 4080 Laptop GPU, Intel Core i7-13800H
159.56 fps +9%
Dell Precision 5000 5680
NVIDIA RTX 5000 Ada Generation Laptop GPU, Intel Core i9-13900H
153.14 fps +5%
Dell Precision 5690
NVIDIA RTX 5000 Ada Generation Laptop GPU, Intel Core Ultra 9 185H
150.65 fps +3%
Average NVIDIA RTX 3500 Ada Generation Laptop GPU
  ()
145.8 fps 0%
HP ZBook Fury 16 G11
NVIDIA RTX 3500 Ada Generation Laptop GPU, Intel Core i9-14900HX
145.77 fps
HP ZBook Fury 16 G9
NVIDIA RTX A5500 Laptop GPU, Intel Core i9-12950HX
131.53 fps -10%
1900x1060 Medical (medical-01)
HP ZBook Fury 16 G10
NVIDIA RTX 5000 Ada Generation Laptop GPU, Intel Core i9-13950HX
136.68 fps +33%
Dell Precision 5000 5680
NVIDIA RTX 5000 Ada Generation Laptop GPU, Intel Core i9-13900H
132.41 fps +28%
Lenovo ThinkPad P1 G6 21FV001KUS
NVIDIA GeForce RTX 4080 Laptop GPU, Intel Core i7-13800H
104.12 fps +1%
HP ZBook Fury 16 G11
NVIDIA RTX 3500 Ada Generation Laptop GPU, Intel Core i9-14900HX
103.14 fps
Average NVIDIA RTX 3500 Ada Generation Laptop GPU
  ()
103.1 fps 0%
HP ZBook Fury 16 G9
NVIDIA RTX A5500 Laptop GPU, Intel Core i9-12950HX
84.87 fps -18%
1900x1060 Maya (maya-04)
Lenovo ThinkPad P1 G6 21FV001KUS
NVIDIA GeForce RTX 4080 Laptop GPU, Intel Core i7-13800H
231.84 fps +29%
HP ZBook Fury 16 G10
NVIDIA RTX 5000 Ada Generation Laptop GPU, Intel Core i9-13950HX
190.08 fps +6%
Dell Precision 5000 5680
NVIDIA RTX 5000 Ada Generation Laptop GPU, Intel Core i9-13900H
181.58 fps +1%
Average NVIDIA RTX 3500 Ada Generation Laptop GPU
  ()
179.1 fps 0%
HP ZBook Fury 16 G11
NVIDIA RTX 3500 Ada Generation Laptop GPU, Intel Core i9-14900HX
179.06 fps
Dell Precision 5690
NVIDIA RTX 5000 Ada Generation Laptop GPU, Intel Core Ultra 9 185H
170.7 fps -5%
HP ZBook Fury 16 G9
NVIDIA RTX A5500 Laptop GPU, Intel Core i9-12950HX
121.02 fps -32%
1900x1060 Energy (energy-01)
HP ZBook Fury 16 G10
NVIDIA RTX 5000 Ada Generation Laptop GPU, Intel Core i9-13950HX
31.48 fps +33%
Dell Precision 5000 5680
NVIDIA RTX 5000 Ada Generation Laptop GPU, Intel Core i9-13900H
29.61 fps +25%
Lenovo ThinkPad P1 G6 21FV001KUS
NVIDIA GeForce RTX 4080 Laptop GPU, Intel Core i7-13800H
28.32 fps +19%
HP ZBook Fury 16 G11
NVIDIA RTX 3500 Ada Generation Laptop GPU, Intel Core i9-14900HX
23.74 fps
Average NVIDIA RTX 3500 Ada Generation Laptop GPU
  ()
23.7 fps 0%
HP ZBook Fury 16 G9
NVIDIA RTX A5500 Laptop GPU, Intel Core i9-12950HX
16.41 fps -31%
1900x1060 Creo (creo-01)
HP ZBook Fury 16 G10
NVIDIA RTX 5000 Ada Generation Laptop GPU, Intel Core i9-13950HX
203.54 fps +6%
Dell Precision 5000 5680
NVIDIA RTX 5000 Ada Generation Laptop GPU, Intel Core i9-13900H
193.92 fps +1%
HP ZBook Fury 16 G11
NVIDIA RTX 3500 Ada Generation Laptop GPU, Intel Core i9-14900HX
192.32 fps
Average NVIDIA RTX 3500 Ada Generation Laptop GPU
  ()
192.3 fps 0%
Dell Precision 5690
NVIDIA RTX 5000 Ada Generation Laptop GPU, Intel Core Ultra 9 185H
178.71 fps -7%
HP ZBook Fury 16 G9
NVIDIA RTX A5500 Laptop GPU, Intel Core i9-12950HX
165.88 fps -14%
Lenovo ThinkPad P1 G6 21FV001KUS
NVIDIA GeForce RTX 4080 Laptop GPU, Intel Core i7-13800H
86.94 fps -55%
1900x1060 Catia (catia-04)
HP ZBook Fury 16 G10
NVIDIA RTX 5000 Ada Generation Laptop GPU, Intel Core i9-13950HX
267.81 fps +8%
Average NVIDIA RTX 3500 Ada Generation Laptop GPU
  ()
248 fps 0%
HP ZBook Fury 16 G11
NVIDIA RTX 3500 Ada Generation Laptop GPU, Intel Core i9-14900HX
247.83 fps
Dell Precision 5000 5680
NVIDIA RTX 5000 Ada Generation Laptop GPU, Intel Core i9-13900H
236.39 fps -5%
Dell Precision 5690
NVIDIA RTX 5000 Ada Generation Laptop GPU, Intel Core Ultra 9 185H
221.81 fps -10%
HP ZBook Fury 16 G9
NVIDIA RTX A5500 Laptop GPU, Intel Core i9-12950HX
189.79 fps -23%
Lenovo ThinkPad P1 G6 21FV001KUS
NVIDIA GeForce RTX 4080 Laptop GPU, Intel Core i7-13800H
152.57 fps -38%
SPECviewperf 13
Solidworks (sw-04)
HP ZBook Fury 16 G10
NVIDIA RTX 5000 Ada Generation Laptop GPU, Intel Core i9-13950HX
226.6 fps +5%
HP ZBook Fury 16 G11
NVIDIA RTX 3500 Ada Generation Laptop GPU, Intel Core i9-14900HX
215.39 fps
Average NVIDIA RTX 3500 Ada Generation Laptop GPU
  ()
215 fps 0%
Dell Precision 5000 5680
NVIDIA RTX 5000 Ada Generation Laptop GPU, Intel Core i9-13900H
209.31 fps -3%
Dell Precision 5690
NVIDIA RTX 5000 Ada Generation Laptop GPU, Intel Core Ultra 9 185H
195.09 fps -9%
Lenovo ThinkPad P1 G6-21FV000DGE
NVIDIA RTX 2000 Ada Generation Laptop GPU, Intel Core i9-13900H
194.75 fps -10%
HP ZBook Fury 16 G9
NVIDIA RTX A5500 Laptop GPU, Intel Core i9-12950HX
186.09 fps -14%
Lenovo ThinkPad P16 G2 21FA000FGE
NVIDIA RTX 2000 Ada Generation Laptop GPU, Intel Core i7-13700HX
174.68 fps -19%
Asus ExpertBook B6 Flip B6602FC2
NVIDIA RTX A2000 Laptop GPU, Intel Core i9-12950HX
153 fps -29%
MSI CreatorPro Z16P B12UKST
NVIDIA RTX A3000 Laptop GPU, Intel Core i7-12700H
151.63 fps -30%
Lenovo ThinkPad P16v G1 AMD
NVIDIA RTX A1000 Laptop GPU, AMD Ryzen 7 PRO 7840HS
147.92 fps -31%
Lenovo ThinkPad P1 G6 21FV001KUS
NVIDIA GeForce RTX 4080 Laptop GPU, Intel Core i7-13800H
131.36 fps -39%
Asus ProArt Studiobook 16 OLED H7604
NVIDIA GeForce RTX 4070 Laptop GPU, Intel Core i9-13980HX
109.63 fps -49%
Lenovo ThinkPad P1 G4-20Y4S0KS00
NVIDIA GeForce RTX 3070 Laptop GPU, Intel Core i7-11850H
91.6 fps -57%
Siemens NX (snx-03)
HP ZBook Fury 16 G10
NVIDIA RTX 5000 Ada Generation Laptop GPU, Intel Core i9-13950HX
550.94 fps +26%
Dell Precision 5000 5680
NVIDIA RTX 5000 Ada Generation Laptop GPU, Intel Core i9-13900H
530.43 fps +21%
Dell Precision 5690
NVIDIA RTX 5000 Ada Generation Laptop GPU, Intel Core Ultra 9 185H
524.73 fps +20%
Average NVIDIA RTX 3500 Ada Generation Laptop GPU
  ()
437 fps 0%
HP ZBook Fury 16 G11
NVIDIA RTX 3500 Ada Generation Laptop GPU, Intel Core i9-14900HX
436.96 fps
Lenovo ThinkPad P16 G2 21FA000FGE
NVIDIA RTX 2000 Ada Generation Laptop GPU, Intel Core i7-13700HX
356.29 fps -18%
HP ZBook Fury 16 G9
NVIDIA RTX A5500 Laptop GPU, Intel Core i9-12950HX
334.23 fps -24%
Lenovo ThinkPad P1 G6-21FV000DGE
NVIDIA RTX 2000 Ada Generation Laptop GPU, Intel Core i9-13900H
329.98 fps -24%
MSI CreatorPro Z16P B12UKST
NVIDIA RTX A3000 Laptop GPU, Intel Core i7-12700H
279.21 fps -36%
Asus ExpertBook B6 Flip B6602FC2
NVIDIA RTX A2000 Laptop GPU, Intel Core i9-12950HX
214 fps -51%
Lenovo ThinkPad P16v G1 AMD
NVIDIA RTX A1000 Laptop GPU, AMD Ryzen 7 PRO 7840HS
195.81 fps -55%
Lenovo ThinkPad P1 G6 21FV001KUS
NVIDIA GeForce RTX 4080 Laptop GPU, Intel Core i7-13800H
48.87 fps -89%
Asus ProArt Studiobook 16 OLED H7604
NVIDIA GeForce RTX 4070 Laptop GPU, Intel Core i9-13980HX
22.75 fps -95%
Lenovo ThinkPad P1 G4-20Y4S0KS00
NVIDIA GeForce RTX 3070 Laptop GPU, Intel Core i7-11850H
17.36 fps -96%
Showcase (showcase-02)
HP ZBook Fury 16 G10
NVIDIA RTX 5000 Ada Generation Laptop GPU, Intel Core i9-13950HX
190.3 fps +45%
Lenovo ThinkPad P1 G6 21FV001KUS
NVIDIA GeForce RTX 4080 Laptop GPU, Intel Core i7-13800H
157.24 fps +20%
Dell Precision 5000 5680
NVIDIA RTX 5000 Ada Generation Laptop GPU, Intel Core i9-13900H
154.11 fps +17%
Dell Precision 5690
NVIDIA RTX 5000 Ada Generation Laptop GPU, Intel Core Ultra 9 185H
150.88 fps +15%
HP ZBook Fury 16 G9
NVIDIA RTX A5500 Laptop GPU, Intel Core i9-12950HX
132.86 fps +1%
Average NVIDIA RTX 3500 Ada Generation Laptop GPU
  ()
131.5 fps 0%
HP ZBook Fury 16 G11
NVIDIA RTX 3500 Ada Generation Laptop GPU, Intel Core i9-14900HX
131.45 fps
Lenovo ThinkPad P1 G4-20Y4S0KS00
NVIDIA GeForce RTX 3070 Laptop GPU, Intel Core i7-11850H
114 fps -13%
Asus ProArt Studiobook 16 OLED H7604
NVIDIA GeForce RTX 4070 Laptop GPU, Intel Core i9-13980HX
111.17 fps -15%
MSI CreatorPro Z16P B12UKST
NVIDIA RTX A3000 Laptop GPU, Intel Core i7-12700H
99.91 fps -24%
Lenovo ThinkPad P1 G6-21FV000DGE
NVIDIA RTX 2000 Ada Generation Laptop GPU, Intel Core i9-13900H
95.04 fps -28%
Lenovo ThinkPad P16 G2 21FA000FGE
NVIDIA RTX 2000 Ada Generation Laptop GPU, Intel Core i7-13700HX
79.97 fps -39%
Asus ExpertBook B6 Flip B6602FC2
NVIDIA RTX A2000 Laptop GPU, Intel Core i9-12950HX
79.2 fps -40%
Lenovo ThinkPad P16v G1 AMD
NVIDIA RTX A1000 Laptop GPU, AMD Ryzen 7 PRO 7840HS
55.66 fps -58%
Medical (medical-02)
Dell Precision 5690
NVIDIA RTX 5000 Ada Generation Laptop GPU, Intel Core Ultra 9 185H
249.87 fps +16%
HP ZBook Fury 16 G11
NVIDIA RTX 3500 Ada Generation Laptop GPU, Intel Core i9-14900HX
215.19 fps
Average NVIDIA RTX 3500 Ada Generation Laptop GPU
  ()
215 fps 0%
Dell Precision 5000 5680
NVIDIA RTX 5000 Ada Generation Laptop GPU, Intel Core i9-13900H
176.21 fps -18%
HP ZBook Fury 16 G10
NVIDIA RTX 5000 Ada Generation Laptop GPU, Intel Core i9-13950HX
169 fps -21%
Lenovo ThinkPad P1 G6-21FV000DGE
NVIDIA RTX 2000 Ada Generation Laptop GPU, Intel Core i9-13900H
165.27 fps -23%
HP ZBook Fury 16 G9
NVIDIA RTX A5500 Laptop GPU, Intel Core i9-12950HX
116.87 fps -46%
Lenovo ThinkPad P16 G2 21FA000FGE
NVIDIA RTX 2000 Ada Generation Laptop GPU, Intel Core i7-13700HX
110.66 fps -49%
Lenovo ThinkPad P16v G1 AMD
NVIDIA RTX A1000 Laptop GPU, AMD Ryzen 7 PRO 7840HS
105.45 fps -51%
MSI CreatorPro Z16P B12UKST
NVIDIA RTX A3000 Laptop GPU, Intel Core i7-12700H
102.82 fps -52%
Lenovo ThinkPad P1 G6 21FV001KUS
NVIDIA GeForce RTX 4080 Laptop GPU, Intel Core i7-13800H
90.1 fps -58%
Asus ExpertBook B6 Flip B6602FC2
NVIDIA RTX A2000 Laptop GPU, Intel Core i9-12950HX
76.8 fps -64%
Asus ProArt Studiobook 16 OLED H7604
NVIDIA GeForce RTX 4070 Laptop GPU, Intel Core i9-13980HX
74.35 fps -65%
Lenovo ThinkPad P1 G4-20Y4S0KS00
NVIDIA GeForce RTX 3070 Laptop GPU, Intel Core i7-11850H
60.7 fps -72%
Maya (maya-05)
Lenovo ThinkPad P1 G6 21FV001KUS
NVIDIA GeForce RTX 4080 Laptop GPU, Intel Core i7-13800H
449.44 fps +17%
HP ZBook Fury 16 G10
NVIDIA RTX 5000 Ada Generation Laptop GPU, Intel Core i9-13950HX
424.73 fps +10%
Dell Precision 5000 5680
NVIDIA RTX 5000 Ada Generation Laptop GPU, Intel Core i9-13900H
391.57 fps +2%
Dell Precision 5690
NVIDIA RTX 5000 Ada Generation Laptop GPU, Intel Core Ultra 9 185H
385.99 fps 0%
HP ZBook Fury 16 G11
NVIDIA RTX 3500 Ada Generation Laptop GPU, Intel Core i9-14900HX
385.36 fps
Average NVIDIA RTX 3500 Ada Generation Laptop GPU
  ()
385 fps 0%
Asus ProArt Studiobook 16 OLED H7604
NVIDIA GeForce RTX 4070 Laptop GPU, Intel Core i9-13980HX
319.16 fps -17%
Lenovo ThinkPad P1 G6-21FV000DGE
NVIDIA RTX 2000 Ada Generation Laptop GPU, Intel Core i9-13900H
293.61 fps -24%
Lenovo ThinkPad P16 G2 21FA000FGE
NVIDIA RTX 2000 Ada Generation Laptop GPU, Intel Core i7-13700HX
276.68 fps -28%
HP ZBook Fury 16 G9
NVIDIA RTX A5500 Laptop GPU, Intel Core i9-12950HX
265.99 fps -31%
Lenovo ThinkPad P1 G4-20Y4S0KS00
NVIDIA GeForce RTX 3070 Laptop GPU, Intel Core i7-11850H
231.5 fps -40%
MSI CreatorPro Z16P B12UKST
NVIDIA RTX A3000 Laptop GPU, Intel Core i7-12700H
228.37 fps -41%
Asus ExpertBook B6 Flip B6602FC2
NVIDIA RTX A2000 Laptop GPU, Intel Core i9-12950HX
195 fps -49%
Lenovo ThinkPad P16v G1 AMD
NVIDIA RTX A1000 Laptop GPU, AMD Ryzen 7 PRO 7840HS
169 fps -56%
Energy (energy-02)
HP ZBook Fury 16 G10
NVIDIA RTX 5000 Ada Generation Laptop GPU, Intel Core i9-13950HX
109.73 fps +43%
Dell Precision 5690
NVIDIA RTX 5000 Ada Generation Laptop GPU, Intel Core Ultra 9 185H
108.19 fps +41%
Dell Precision 5000 5680
NVIDIA RTX 5000 Ada Generation Laptop GPU, Intel Core i9-13900H
105.16 fps +37%
HP ZBook Fury 16 G11
NVIDIA RTX 3500 Ada Generation Laptop GPU, Intel Core i9-14900HX
76.83 fps
Average NVIDIA RTX 3500 Ada Generation Laptop GPU
  ()
76.8 fps 0%
HP ZBook Fury 16 G9
NVIDIA RTX A5500 Laptop GPU, Intel Core i9-12950HX
61.15 fps -20%
Lenovo ThinkPad P1 G6 21FV001KUS
NVIDIA GeForce RTX 4080 Laptop GPU, Intel Core i7-13800H
51.45 fps -33%
Lenovo ThinkPad P1 G6-21FV000DGE
NVIDIA RTX 2000 Ada Generation Laptop GPU, Intel Core i9-13900H
49.58 fps -35%
Lenovo ThinkPad P16 G2 21FA000FGE
NVIDIA RTX 2000 Ada Generation Laptop GPU, Intel Core i7-13700HX
49.36 fps -36%
MSI CreatorPro Z16P B12UKST
NVIDIA RTX A3000 Laptop GPU, Intel Core i7-12700H
44.09 fps -43%
Asus ProArt Studiobook 16 OLED H7604
NVIDIA GeForce RTX 4070 Laptop GPU, Intel Core i9-13980HX
42.07 fps -45%
Asus ExpertBook B6 Flip B6602FC2
NVIDIA RTX A2000 Laptop GPU, Intel Core i9-12950HX
36.8 fps -52%
Lenovo ThinkPad P16v G1 AMD
NVIDIA RTX A1000 Laptop GPU, AMD Ryzen 7 PRO 7840HS
30.29 fps -61%
Lenovo ThinkPad P1 G4-20Y4S0KS00
NVIDIA GeForce RTX 3070 Laptop GPU, Intel Core i7-11850H
22.6 fps -71%
Creo (creo-02)
HP ZBook Fury 16 G10
NVIDIA RTX 5000 Ada Generation Laptop GPU, Intel Core i9-13950HX
397.76 fps +10%
Dell Precision 5000 5680
NVIDIA RTX 5000 Ada Generation Laptop GPU, Intel Core i9-13900H
375.06 fps +4%
HP ZBook Fury 16 G11
NVIDIA RTX 3500 Ada Generation Laptop GPU, Intel Core i9-14900HX
361.4 fps
Average NVIDIA RTX 3500 Ada Generation Laptop GPU
  ()
361 fps 0%
Dell Precision 5690
NVIDIA RTX 5000 Ada Generation Laptop GPU, Intel Core Ultra 9 185H
354.77 fps -2%
Lenovo ThinkPad P1 G6 21FV001KUS
NVIDIA GeForce RTX 4080 Laptop GPU, Intel Core i7-13800H
348.81 fps -3%
Lenovo ThinkPad P1 G6-21FV000DGE
NVIDIA RTX 2000 Ada Generation Laptop GPU, Intel Core i9-13900H
265.15 fps -27%
Lenovo ThinkPad P16 G2 21FA000FGE
NVIDIA RTX 2000 Ada Generation Laptop GPU, Intel Core i7-13700HX
261.41 fps -28%
HP ZBook Fury 16 G9
NVIDIA RTX A5500 Laptop GPU, Intel Core i9-12950HX
243.69 fps -33%
Asus ProArt Studiobook 16 OLED H7604
NVIDIA GeForce RTX 4070 Laptop GPU, Intel Core i9-13980HX
241.03 fps -33%
MSI CreatorPro Z16P B12UKST
NVIDIA RTX A3000 Laptop GPU, Intel Core i7-12700H
235.49 fps -35%
Asus ExpertBook B6 Flip B6602FC2
NVIDIA RTX A2000 Laptop GPU, Intel Core i9-12950HX
189 fps -48%
Lenovo ThinkPad P1 G4-20Y4S0KS00
NVIDIA GeForce RTX 3070 Laptop GPU, Intel Core i7-11850H
168.8 fps -53%
Lenovo ThinkPad P16v G1 AMD
NVIDIA RTX A1000 Laptop GPU, AMD Ryzen 7 PRO 7840HS
164.76 fps -54%
Catia (catia-05)
HP ZBook Fury 16 G10
NVIDIA RTX 5000 Ada Generation Laptop GPU, Intel Core i9-13950HX
409.2 fps +7%
Average NVIDIA RTX 3500 Ada Generation Laptop GPU
  ()
383 fps 0%
HP ZBook Fury 16 G11
NVIDIA RTX 3500 Ada Generation Laptop GPU, Intel Core i9-14900HX
382.79 fps
Dell Precision 5000 5680
NVIDIA RTX 5000 Ada Generation Laptop GPU, Intel Core i9-13900H
374.43 fps -2%
Dell Precision 5690
NVIDIA RTX 5000 Ada Generation Laptop GPU, Intel Core Ultra 9 185H
352.35 fps -8%
Lenovo ThinkPad P16 G2 21FA000FGE
NVIDIA RTX 2000 Ada Generation Laptop GPU, Intel Core i7-13700HX
312.95 fps -18%
Lenovo ThinkPad P1 G6-21FV000DGE
NVIDIA RTX 2000 Ada Generation Laptop GPU, Intel Core i9-13900H
309.47 fps -19%
HP ZBook Fury 16 G9
NVIDIA RTX A5500 Laptop GPU, Intel Core i9-12950HX
302.32 fps -21%
MSI CreatorPro Z16P B12UKST
NVIDIA RTX A3000 Laptop GPU, Intel Core i7-12700H
252.25 fps -34%
Asus ExpertBook B6 Flip B6602FC2
NVIDIA RTX A2000 Laptop GPU, Intel Core i9-12950HX
233 fps -39%
Lenovo ThinkPad P1 G6 21FV001KUS
NVIDIA GeForce RTX 4080 Laptop GPU, Intel Core i7-13800H
223.45 fps -42%
Lenovo ThinkPad P16v G1 AMD
NVIDIA RTX A1000 Laptop GPU, AMD Ryzen 7 PRO 7840HS
218.18 fps -43%
Asus ProArt Studiobook 16 OLED H7604
NVIDIA GeForce RTX 4070 Laptop GPU, Intel Core i9-13980HX
150.22 fps -61%
Lenovo ThinkPad P1 G4-20Y4S0KS00
NVIDIA GeForce RTX 3070 Laptop GPU, Intel Core i7-11850H
133.1 fps -65%
3ds Max (3dsmax-06)
Lenovo ThinkPad P1 G6 21FV001KUS
NVIDIA GeForce RTX 4080 Laptop GPU, Intel Core i7-13800H
284.41 fps +22%
HP ZBook Fury 16 G10
NVIDIA RTX 5000 Ada Generation Laptop GPU, Intel Core i9-13950HX
278.36 fps +19%
Dell Precision 5000 5680
NVIDIA RTX 5000 Ada Generation Laptop GPU, Intel Core i9-13900H
272.05 fps +16%
Dell Precision 5690
NVIDIA RTX 5000 Ada Generation Laptop GPU, Intel Core Ultra 9 185H
258.63 fps +11%
Average NVIDIA RTX 3500 Ada Generation Laptop GPU
  ()
234 fps 0%
HP ZBook Fury 16 G11
NVIDIA RTX 3500 Ada Generation Laptop GPU, Intel Core i9-14900HX
233.81 fps
HP ZBook Fury 16 G9
NVIDIA RTX A5500 Laptop GPU, Intel Core i9-12950HX
223.61 fps -4%
Asus ProArt Studiobook 16 OLED H7604
NVIDIA GeForce RTX 4070 Laptop GPU, Intel Core i9-13980HX
215.97 fps -8%
Lenovo ThinkPad P1 G6-21FV000DGE
NVIDIA RTX 2000 Ada Generation Laptop GPU, Intel Core i9-13900H
200.54 fps -14%
Lenovo ThinkPad P1 G4-20Y4S0KS00
NVIDIA GeForce RTX 3070 Laptop GPU, Intel Core i7-11850H
193.3 fps -17%
MSI CreatorPro Z16P B12UKST
NVIDIA RTX A3000 Laptop GPU, Intel Core i7-12700H
181.04 fps -23%
Asus ExpertBook B6 Flip B6602FC2
NVIDIA RTX A2000 Laptop GPU, Intel Core i9-12950HX
165 fps -29%
Lenovo ThinkPad P16 G2 21FA000FGE
NVIDIA RTX 2000 Ada Generation Laptop GPU, Intel Core i7-13700HX
155.94 fps -33%
Lenovo ThinkPad P16v G1 AMD
NVIDIA RTX A1000 Laptop GPU, AMD Ryzen 7 PRO 7840HS
127.82 fps -45%
SPECviewperf 2020
3840x2160 Solidworks (solidworks-07) 4k
Dell Precision 5690
NVIDIA RTX 5000 Ada Generation Laptop GPU, Intel Core Ultra 9 185H
128.1 fps +10%
Average NVIDIA RTX 3500 Ada Generation Laptop GPU
  ()
116 fps 0%
HP ZBook Fury 16 G11
NVIDIA RTX 3500 Ada Generation Laptop GPU, Intel Core i9-14900HX
115.99 fps
1920x1080 Solidworks (solidworks-07)
Dell Precision 5690
NVIDIA RTX 5000 Ada Generation Laptop GPU, Intel Core Ultra 9 185H
307.21 fps +6%
HP ZBook Fury 16 G11
NVIDIA RTX 3500 Ada Generation Laptop GPU, Intel Core i9-14900HX
289.07 fps
Average NVIDIA RTX 3500 Ada Generation Laptop GPU
  ()
289 fps 0%
1920x1080 Siemens NX (snx-04)
HP ZBook Fury 16 G10
NVIDIA RTX 5000 Ada Generation Laptop GPU, Intel Core i9-13950HX
554.23 fps +27%
Dell Precision 5690
NVIDIA RTX 5000 Ada Generation Laptop GPU, Intel Core Ultra 9 185H
525.61 fps +20%
Dell Precision 5000 5680
NVIDIA RTX 5000 Ada Generation Laptop GPU, Intel Core i9-13900H
520.25 fps +19%
Average NVIDIA RTX 3500 Ada Generation Laptop GPU
  ()
437 fps 0%
HP ZBook Fury 16 G11
NVIDIA RTX 3500 Ada Generation Laptop GPU, Intel Core i9-14900HX
436.85 fps
Lenovo ThinkPad P16 G2 21FA000FGE
NVIDIA RTX 2000 Ada Generation Laptop GPU, Intel Core i7-13700HX
381.32 fps -13%
Lenovo ThinkPad P1 G6-21FV000DGE
NVIDIA RTX 2000 Ada Generation Laptop GPU, Intel Core i9-13900H
327.89 fps -25%
HP ZBook Fury 16 G9
NVIDIA RTX A5500 Laptop GPU, Intel Core i9-12950HX
308.7 fps -29%
MSI CreatorPro Z16P B12UKST
NVIDIA RTX A3000 Laptop GPU, Intel Core i7-12700H
284.49 fps -35%
Asus ExpertBook B6 Flip B6602FC2
NVIDIA RTX A2000 Laptop GPU, Intel Core i9-12950HX
215 fps -51%
Lenovo ThinkPad P16v G1 AMD
NVIDIA RTX A1000 Laptop GPU, AMD Ryzen 7 PRO 7840HS
194.8 fps -55%
Lenovo ThinkPad P1 G6 21FV001KUS
NVIDIA GeForce RTX 4080 Laptop GPU, Intel Core i7-13800H
48.5 fps -89%
Asus ProArt Studiobook 16 OLED H7604
NVIDIA GeForce RTX 4070 Laptop GPU, Intel Core i9-13980HX
22.52 fps -95%
Lenovo ThinkPad P1 G4-20Y4S0KS00
NVIDIA GeForce RTX 3070 Laptop GPU, Intel Core i7-11850H
17.03 fps -96%
1920x1080 Medical (medical-03)
Dell Precision 5690
NVIDIA RTX 5000 Ada Generation Laptop GPU, Intel Core Ultra 9 185H
140.89 fps +13%
Average NVIDIA RTX 3500 Ada Generation Laptop GPU
  ()
124.7 fps 0%
HP ZBook Fury 16 G11
NVIDIA RTX 3500 Ada Generation Laptop GPU, Intel Core i9-14900HX
124.65 fps
Lenovo ThinkPad P1 G6-21FV000DGE
NVIDIA RTX 2000 Ada Generation Laptop GPU, Intel Core i9-13900H
92.01 fps -26%
Dell Precision 5000 5680
NVIDIA RTX 5000 Ada Generation Laptop GPU, Intel Core i9-13900H
86.29 fps -31%
HP ZBook Fury 16 G10
NVIDIA RTX 5000 Ada Generation Laptop GPU, Intel Core i9-13950HX
85.08 fps -32%
HP ZBook Fury 16 G9
NVIDIA RTX A5500 Laptop GPU, Intel Core i9-12950HX
61.01 fps -51%
Lenovo ThinkPad P16v G1 AMD
NVIDIA RTX A1000 Laptop GPU, AMD Ryzen 7 PRO 7840HS
57.3 fps -54%
Lenovo ThinkPad P16 G2 21FA000FGE
NVIDIA RTX 2000 Ada Generation Laptop GPU, Intel Core i7-13700HX
57.2 fps -54%
MSI CreatorPro Z16P B12UKST
NVIDIA RTX A3000 Laptop GPU, Intel Core i7-12700H
46.59 fps -63%
Lenovo ThinkPad P1 G6 21FV001KUS
NVIDIA GeForce RTX 4080 Laptop GPU, Intel Core i7-13800H
43.28 fps -65%
Asus ExpertBook B6 Flip B6602FC2
NVIDIA RTX A2000 Laptop GPU, Intel Core i9-12950HX
35.9 fps -71%
Asus ProArt Studiobook 16 OLED H7604
NVIDIA GeForce RTX 4070 Laptop GPU, Intel Core i9-13980HX
34.67 fps -72%
Lenovo ThinkPad P1 G4-20Y4S0KS00
NVIDIA GeForce RTX 3070 Laptop GPU, Intel Core i7-11850H
27.94 fps -78%
1920x1080 Maya (maya-06)
HP ZBook Fury 16 G10
NVIDIA RTX 5000 Ada Generation Laptop GPU, Intel Core i9-13950HX
459.91 fps +3%
Lenovo ThinkPad P1 G6 21FV001KUS
NVIDIA GeForce RTX 4080 Laptop GPU, Intel Core i7-13800H
448.27 fps 0%
HP ZBook Fury 16 G11
NVIDIA RTX 3500 Ada Generation Laptop GPU, Intel Core i9-14900HX
446.29 fps
Average NVIDIA RTX 3500 Ada Generation Laptop GPU
  ()
446 fps 0%
Dell Precision 5690
NVIDIA RTX 5000 Ada Generation Laptop GPU, Intel Core Ultra 9 185H
433.58 fps -3%
Dell Precision 5000 5680
NVIDIA RTX 5000 Ada Generation Laptop GPU, Intel Core i9-13900H
419.68 fps -6%
Asus ProArt Studiobook 16 OLED H7604
NVIDIA GeForce RTX 4070 Laptop GPU, Intel Core i9-13980HX
363.61 fps -19%
Lenovo ThinkPad P16 G2 21FA000FGE
NVIDIA RTX 2000 Ada Generation Laptop GPU, Intel Core i7-13700HX
355.25 fps -20%
Lenovo ThinkPad P1 G6-21FV000DGE
NVIDIA RTX 2000 Ada Generation Laptop GPU, Intel Core i9-13900H
329.51 fps -26%
HP ZBook Fury 16 G9
NVIDIA RTX A5500 Laptop GPU, Intel Core i9-12950HX
293.35 fps -34%
MSI CreatorPro Z16P B12UKST
NVIDIA RTX A3000 Laptop GPU, Intel Core i7-12700H
286.54 fps -36%
Lenovo ThinkPad P1 G4-20Y4S0KS00
NVIDIA GeForce RTX 3070 Laptop GPU, Intel Core i7-11850H
268.3 fps -40%
Asus ExpertBook B6 Flip B6602FC2
NVIDIA RTX A2000 Laptop GPU, Intel Core i9-12950HX
221 fps -50%
Lenovo ThinkPad P16v G1 AMD
NVIDIA RTX A1000 Laptop GPU, AMD Ryzen 7 PRO 7840HS
201.79 fps -55%
1920x1080 Energy (energy-03)
HP ZBook Fury 16 G10
NVIDIA RTX 5000 Ada Generation Laptop GPU, Intel Core i9-13950HX
109.65 fps +43%
Dell Precision 5690
NVIDIA RTX 5000 Ada Generation Laptop GPU, Intel Core Ultra 9 185H
108.18 fps +41%
Dell Precision 5000 5680
NVIDIA RTX 5000 Ada Generation Laptop GPU, Intel Core i9-13900H
104.5 fps +36%
HP ZBook Fury 16 G11
NVIDIA RTX 3500 Ada Generation Laptop GPU, Intel Core i9-14900HX
76.82 fps
Average NVIDIA RTX 3500 Ada Generation Laptop GPU
  ()
76.8 fps 0%
HP ZBook Fury 16 G9
NVIDIA RTX A5500 Laptop GPU, Intel Core i9-12950HX
62.08 fps -19%
Lenovo ThinkPad P16 G2 21FA000FGE
NVIDIA RTX 2000 Ada Generation Laptop GPU, Intel Core i7-13700HX
54.54 fps -29%
Lenovo ThinkPad P1 G6 21FV001KUS
NVIDIA GeForce RTX 4080 Laptop GPU, Intel Core i7-13800H
52.07 fps -32%
Lenovo ThinkPad P1 G6-21FV000DGE
NVIDIA RTX 2000 Ada Generation Laptop GPU, Intel Core i9-13900H
49.66 fps -35%
MSI CreatorPro Z16P B12UKST
NVIDIA RTX A3000 Laptop GPU, Intel Core i7-12700H
44.7 fps -42%
Asus ProArt Studiobook 16 OLED H7604
NVIDIA GeForce RTX 4070 Laptop GPU, Intel Core i9-13980HX
41.97 fps -45%
Asus ExpertBook B6 Flip B6602FC2
NVIDIA RTX A2000 Laptop GPU, Intel Core i9-12950HX
36.9 fps -52%
Lenovo ThinkPad P16v G1 AMD
NVIDIA RTX A1000 Laptop GPU, AMD Ryzen 7 PRO 7840HS
30.27 fps -61%
Lenovo ThinkPad P1 G4-20Y4S0KS00
NVIDIA GeForce RTX 3070 Laptop GPU, Intel Core i7-11850H
22.47 fps -71%
1920x1080 Creo (creo-03)
HP ZBook Fury 16 G10
NVIDIA RTX 5000 Ada Generation Laptop GPU, Intel Core i9-13950HX
169.52 fps +61%
Dell Precision 5690
NVIDIA RTX 5000 Ada Generation Laptop GPU, Intel Core Ultra 9 185H
153.83 fps +46%
Lenovo ThinkPad P1 G6-21FV000DGE
NVIDIA RTX 2000 Ada Generation Laptop GPU, Intel Core i9-13900H
137.93 fps +31%
Dell Precision 5000 5680
NVIDIA RTX 5000 Ada Generation Laptop GPU, Intel Core i9-13900H
133.03 fps +26%
Lenovo ThinkPad P1 G6 21FV001KUS
NVIDIA GeForce RTX 4080 Laptop GPU, Intel Core i7-13800H
122.06 fps +16%
Asus ExpertBook B6 Flip B6602FC2
NVIDIA RTX A2000 Laptop GPU, Intel Core i9-12950HX
113 fps +7%
Asus ProArt Studiobook 16 OLED H7604
NVIDIA GeForce RTX 4070 Laptop GPU, Intel Core i9-13980HX
112.95 fps +7%
HP ZBook Fury 16 G11
NVIDIA RTX 3500 Ada Generation Laptop GPU, Intel Core i9-14900HX
105.43 fps
Average NVIDIA RTX 3500 Ada Generation Laptop GPU
  ()
105.4 fps 0%
HP ZBook Fury 16 G9
NVIDIA RTX A5500 Laptop GPU, Intel Core i9-12950HX
104.45 fps -1%
MSI CreatorPro Z16P B12UKST
NVIDIA RTX A3000 Laptop GPU, Intel Core i7-12700H
101.07 fps -4%
Lenovo ThinkPad P16 G2 21FA000FGE
NVIDIA RTX 2000 Ada Generation Laptop GPU, Intel Core i7-13700HX
96.6 fps -8%
Lenovo ThinkPad P16v G1 AMD
NVIDIA RTX A1000 Laptop GPU, AMD Ryzen 7 PRO 7840HS
90.91 fps -14%
Lenovo ThinkPad P1 G4-20Y4S0KS00
NVIDIA GeForce RTX 3070 Laptop GPU, Intel Core i7-11850H
64.2 fps -39%
1920x1080 CATIA (catia-06)
HP ZBook Fury 16 G10
NVIDIA RTX 5000 Ada Generation Laptop GPU, Intel Core i9-13950HX
130.04 fps +13%
Dell Precision 5000 5680
NVIDIA RTX 5000 Ada Generation Laptop GPU, Intel Core i9-13900H
122.66 fps +6%
Dell Precision 5690
NVIDIA RTX 5000 Ada Generation Laptop GPU, Intel Core Ultra 9 185H
121.41 fps +5%
Average NVIDIA RTX 3500 Ada Generation Laptop GPU
  ()
115.3 fps 0%
HP ZBook Fury 16 G11
NVIDIA RTX 3500 Ada Generation Laptop GPU, Intel Core i9-14900HX
115.25 fps
HP ZBook Fury 16 G9
NVIDIA RTX A5500 Laptop GPU, Intel Core i9-12950HX
96.23 fps -17%
Lenovo ThinkPad P16 G2 21FA000FGE
NVIDIA RTX 2000 Ada Generation Laptop GPU, Intel Core i7-13700HX
91.24 fps -21%
Lenovo ThinkPad P1 G6 21FV001KUS
NVIDIA GeForce RTX 4080 Laptop GPU, Intel Core i7-13800H
85.39 fps -26%
Lenovo ThinkPad P1 G6-21FV000DGE
NVIDIA RTX 2000 Ada Generation Laptop GPU, Intel Core i9-13900H
84.02 fps -27%
MSI CreatorPro Z16P B12UKST
NVIDIA RTX A3000 Laptop GPU, Intel Core i7-12700H
80.27 fps -30%
Asus ExpertBook B6 Flip B6602FC2
NVIDIA RTX A2000 Laptop GPU, Intel Core i9-12950HX
67.9 fps -41%
Asus ProArt Studiobook 16 OLED H7604
NVIDIA GeForce RTX 4070 Laptop GPU, Intel Core i9-13980HX
63.45 fps -45%
Lenovo ThinkPad P1 G4-20Y4S0KS00
NVIDIA GeForce RTX 3070 Laptop GPU, Intel Core i7-11850H
54.9 fps -52%
Lenovo ThinkPad P16v G1 AMD
NVIDIA RTX A1000 Laptop GPU, AMD Ryzen 7 PRO 7840HS
52.17 fps -55%
1920x1080 3ds Max (3dsmax-07)
HP ZBook Fury 16 G10
NVIDIA RTX 5000 Ada Generation Laptop GPU, Intel Core i9-13950HX
174.72 fps +30%
Dell Precision 5000 5680
NVIDIA RTX 5000 Ada Generation Laptop GPU, Intel Core i9-13900H
161.47 fps +20%
Dell Precision 5690
NVIDIA RTX 5000 Ada Generation Laptop GPU, Intel Core Ultra 9 185H
161.08 fps +20%
Lenovo ThinkPad P1 G6 21FV001KUS
NVIDIA GeForce RTX 4080 Laptop GPU, Intel Core i7-13800H
151.5 fps +13%
Average NVIDIA RTX 3500 Ada Generation Laptop GPU
  ()
134.2 fps 0%
HP ZBook Fury 16 G11
NVIDIA RTX 3500 Ada Generation Laptop GPU, Intel Core i9-14900HX
134.15 fps
HP ZBook Fury 16 G9
NVIDIA RTX A5500 Laptop GPU, Intel Core i9-12950HX
125.82 fps -6%
MSI CreatorPro Z16P B12UKST
NVIDIA RTX A3000 Laptop GPU, Intel Core i7-12700H
103.02 fps -23%
Lenovo ThinkPad P1 G4-20Y4S0KS00
NVIDIA GeForce RTX 3070 Laptop GPU, Intel Core i7-11850H
97.2 fps -28%
Asus ProArt Studiobook 16 OLED H7604
NVIDIA GeForce RTX 4070 Laptop GPU, Intel Core i9-13980HX
96.87 fps -28%
Lenovo ThinkPad P16 G2 21FA000FGE
NVIDIA RTX 2000 Ada Generation Laptop GPU, Intel Core i7-13700HX
95.09 fps -29%
Lenovo ThinkPad P1 G6-21FV000DGE
NVIDIA RTX 2000 Ada Generation Laptop GPU, Intel Core i9-13900H
84.61 fps -37%
Asus ExpertBook B6 Flip B6602FC2
NVIDIA RTX A2000 Laptop GPU, Intel Core i9-12950HX
72.9 fps -46%
Lenovo ThinkPad P16v G1 AMD
NVIDIA RTX A1000 Laptop GPU, AMD Ryzen 7 PRO 7840HS
55.43 fps -59%
3840x2160 Siemens NX (snx-04)
HP ZBook Fury 16 G10
NVIDIA RTX 5000 Ada Generation Laptop GPU, Intel Core i9-13950HX
362.19 fps +12%
Average NVIDIA RTX 3500 Ada Generation Laptop GPU
  ()
324 fps 0%
HP ZBook Fury 16 G11
NVIDIA RTX 3500 Ada Generation Laptop GPU, Intel Core i9-14900HX
323.69 fps
Dell Precision 5000 5680
NVIDIA RTX 5000 Ada Generation Laptop GPU, Intel Core i9-13900H
237 fps -27%
Dell Precision 5690
NVIDIA RTX 5000 Ada Generation Laptop GPU, Intel Core Ultra 9 185H
214.15 fps -34%
HP ZBook Fury 16 G9
NVIDIA RTX A5500 Laptop GPU, Intel Core i9-12950HX
195.95 fps -39%
Lenovo ThinkPad P1 G6 21FV001KUS
NVIDIA GeForce RTX 4080 Laptop GPU, Intel Core i7-13800H
34.36 fps -89%
Lenovo ThinkPad P1 G4-20Y4S0KS00
NVIDIA GeForce RTX 3070 Laptop GPU, Intel Core i7-11850H
14.36 fps -96%
3840x2160 Medical (medical-03)
Dell Precision 5690
NVIDIA RTX 5000 Ada Generation Laptop GPU, Intel Core Ultra 9 185H
58.46 fps +16%
HP ZBook Fury 16 G11
NVIDIA RTX 3500 Ada Generation Laptop GPU, Intel Core i9-14900HX
50.24 fps
Average NVIDIA RTX 3500 Ada Generation Laptop GPU
  ()
50.2 fps 0%
Dell Precision 5000 5680
NVIDIA RTX 5000 Ada Generation Laptop GPU, Intel Core i9-13900H
36.81 fps -27%
HP ZBook Fury 16 G10
NVIDIA RTX 5000 Ada Generation Laptop GPU, Intel Core i9-13950HX
36.13 fps -28%
HP ZBook Fury 16 G9
NVIDIA RTX A5500 Laptop GPU, Intel Core i9-12950HX
23.31 fps -54%
Lenovo ThinkPad P1 G6 21FV001KUS
NVIDIA GeForce RTX 4080 Laptop GPU, Intel Core i7-13800H
17.83 fps -65%
Lenovo ThinkPad P1 G4-20Y4S0KS00
NVIDIA GeForce RTX 3070 Laptop GPU, Intel Core i7-11850H
9.93 fps -80%
3840x2160 Maya (maya-06)
Lenovo ThinkPad P1 G6 21FV001KUS
NVIDIA GeForce RTX 4080 Laptop GPU, Intel Core i7-13800H
263.3 fps +21%
HP ZBook Fury 16 G10
NVIDIA RTX 5000 Ada Generation Laptop GPU, Intel Core i9-13950HX
241.7 fps +11%
HP ZBook Fury 16 G11
NVIDIA RTX 3500 Ada Generation Laptop GPU, Intel Core i9-14900HX
218.02 fps
Average NVIDIA RTX 3500 Ada Generation Laptop GPU
  ()
218 fps 0%
Dell Precision 5000 5680
NVIDIA RTX 5000 Ada Generation Laptop GPU, Intel Core i9-13900H
207.19 fps -5%
Dell Precision 5690
NVIDIA RTX 5000 Ada Generation Laptop GPU, Intel Core Ultra 9 185H
184.05 fps -16%
Lenovo ThinkPad P1 G4-20Y4S0KS00
NVIDIA GeForce RTX 3070 Laptop GPU, Intel Core i7-11850H
138.6 fps -36%
HP ZBook Fury 16 G9
NVIDIA RTX A5500 Laptop GPU, Intel Core i9-12950HX
132.18 fps -39%
3840x2160 Energy (energy-03)
Average NVIDIA RTX 3500 Ada Generation Laptop GPU
  ()
74.3 fps 0%
HP ZBook Fury 16 G11
NVIDIA RTX 3500 Ada Generation Laptop GPU, Intel Core i9-14900HX
74.26 fps
Dell Precision 5000 5680
NVIDIA RTX 5000 Ada Generation Laptop GPU, Intel Core i9-13900H
49.16 fps -34%
Lenovo ThinkPad P1 G6 21FV001KUS
NVIDIA GeForce RTX 4080 Laptop GPU, Intel Core i7-13800H
49.12 fps -34%
HP ZBook Fury 16 G10
NVIDIA RTX 5000 Ada Generation Laptop GPU, Intel Core i9-13950HX
39.61 fps -47%
Dell Precision 5690
NVIDIA RTX 5000 Ada Generation Laptop GPU, Intel Core Ultra 9 185H
38.09 fps -49%
Lenovo ThinkPad P1 G4-20Y4S0KS00
NVIDIA GeForce RTX 3070 Laptop GPU, Intel Core i7-11850H
35.24 fps -53%
HP ZBook Fury 16 G9
NVIDIA RTX A5500 Laptop GPU, Intel Core i9-12950HX
21.54 fps -71%
3840x2160 Creo (creo-03)
Average NVIDIA RTX 3500 Ada Generation Laptop GPU
  ()
123.8 fps 0%
HP ZBook Fury 16 G11
NVIDIA RTX 3500 Ada Generation Laptop GPU, Intel Core i9-14900HX
123.79 fps
Dell Precision 5000 5680
NVIDIA RTX 5000 Ada Generation Laptop GPU, Intel Core i9-13900H
116.47 fps -6%
HP ZBook Fury 16 G10
NVIDIA RTX 5000 Ada Generation Laptop GPU, Intel Core i9-13950HX
115.93 fps -6%
Dell Precision 5690
NVIDIA RTX 5000 Ada Generation Laptop GPU, Intel Core Ultra 9 185H
100.9 fps -18%
Lenovo ThinkPad P1 G6 21FV001KUS
NVIDIA GeForce RTX 4080 Laptop GPU, Intel Core i7-13800H
99.16 fps -20%
HP ZBook Fury 16 G9
NVIDIA RTX A5500 Laptop GPU, Intel Core i9-12950HX
91.29 fps -26%
Lenovo ThinkPad P1 G4-20Y4S0KS00
NVIDIA GeForce RTX 3070 Laptop GPU, Intel Core i7-11850H
56.1 fps -55%
3840x2160 CATIA (catia-06)
HP ZBook Fury 16 G10
NVIDIA RTX 5000 Ada Generation Laptop GPU, Intel Core i9-13950HX
75.33 fps +10%
Dell Precision 5000 5680
NVIDIA RTX 5000 Ada Generation Laptop GPU, Intel Core i9-13900H
68.66 fps 0%
Average NVIDIA RTX 3500 Ada Generation Laptop GPU
  ()
68.6 fps 0%
HP ZBook Fury 16 G11
NVIDIA RTX 3500 Ada Generation Laptop GPU, Intel Core i9-14900HX
68.58 fps
Dell Precision 5690
NVIDIA RTX 5000 Ada Generation Laptop GPU, Intel Core Ultra 9 185H
67.17 fps -2%
HP ZBook Fury 16 G9
NVIDIA RTX A5500 Laptop GPU, Intel Core i9-12950HX
55.52 fps -19%
Lenovo ThinkPad P1 G6 21FV001KUS
NVIDIA GeForce RTX 4080 Laptop GPU, Intel Core i7-13800H
46.58 fps -32%
Lenovo ThinkPad P1 G4-20Y4S0KS00
NVIDIA GeForce RTX 3070 Laptop GPU, Intel Core i7-11850H
32.27 fps -53%
3840x2160 3ds Max (3dsmax-07)
Lenovo ThinkPad P1 G6 21FV001KUS
NVIDIA GeForce RTX 4080 Laptop GPU, Intel Core i7-13800H
99.53 fps +14%
Dell Precision 5000 5680
NVIDIA RTX 5000 Ada Generation Laptop GPU, Intel Core i9-13900H
97.75 fps +12%
Dell Precision 5690
NVIDIA RTX 5000 Ada Generation Laptop GPU, Intel Core Ultra 9 185H
94.56 fps +8%
HP ZBook Fury 16 G11
NVIDIA RTX 3500 Ada Generation Laptop GPU, Intel Core i9-14900HX
87.61 fps
Average NVIDIA RTX 3500 Ada Generation Laptop GPU
  ()
87.6 fps 0%
HP ZBook Fury 16 G10
NVIDIA RTX 5000 Ada Generation Laptop GPU, Intel Core i9-13950HX
84.87 fps -3%
HP ZBook Fury 16 G9
NVIDIA RTX A5500 Laptop GPU, Intel Core i9-12950HX
73.53 fps -16%
Lenovo ThinkPad P1 G4-20Y4S0KS00
NVIDIA GeForce RTX 3070 Laptop GPU, Intel Core i7-11850H
64 fps -27%
3DMark 11 Performance
34779 pkt.
3DMark Fire Strike Score
26188 pkt.
3DMark Time Spy Score
13191 pkt.
3DMark Steel Nomad Score
2793 pkt.
Pomoc
Blender
v3.3 Classroom OPTIX/RTX
Lenovo ThinkPad P16v G1 AMD
NVIDIA RTX A1000 Laptop GPU, AMD Ryzen 7 PRO 7840HS
65 Seconds * -210%
Asus ExpertBook B6 Flip B6602FC2
NVIDIA RTX A2000 Laptop GPU, Intel Core i9-12950HX
45 Seconds * -114%
MSI CreatorPro Z16P B12UKST
NVIDIA RTX A3000 Laptop GPU, Intel Core i7-12700H
34 Seconds * -62%
Lenovo ThinkPad P1 G6-21FV000DGE
NVIDIA RTX 2000 Ada Generation Laptop GPU, Intel Core i9-13900H
28 Seconds * -33%
HP ZBook Fury 16 G9
NVIDIA RTX A5500 Laptop GPU, Intel Core i9-12950HX
25 Seconds * -19%
Lenovo ThinkPad P16 G2 21FA000FGE
NVIDIA RTX 2000 Ada Generation Laptop GPU, Intel Core i7-13700HX
25 Seconds * -19%
Asus ProArt Studiobook 16 OLED H7604
NVIDIA GeForce RTX 4070 Laptop GPU, Intel Core i9-13980HX
22 Seconds * -5%
HP ZBook Fury 16 G11
NVIDIA RTX 3500 Ada Generation Laptop GPU, Intel Core i9-14900HX
21 Seconds *
Average NVIDIA RTX 3500 Ada Generation Laptop GPU
  ()
21 Seconds * -0%
Dell Precision 5000 5680
NVIDIA RTX 5000 Ada Generation Laptop GPU, Intel Core i9-13900H
16 Seconds * +24%
Lenovo ThinkPad P1 G6 21FV001KUS
NVIDIA GeForce RTX 4080 Laptop GPU, Intel Core i7-13800H
16 Seconds * +24%
HP ZBook Fury 16 G10
NVIDIA RTX 5000 Ada Generation Laptop GPU, Intel Core i9-13950HX
15 Seconds * +29%
Dell Precision 5690
NVIDIA RTX 5000 Ada Generation Laptop GPU, Intel Core Ultra 9 185H
14 Seconds * +33%
v3.3 Classroom CUDA
Lenovo ThinkPad P16 G2 21FA000FGE
NVIDIA RTX 2000 Ada Generation Laptop GPU, Intel Core i7-13700HX
155 Seconds * -370%
Lenovo ThinkPad P16v G1 AMD
NVIDIA RTX A1000 Laptop GPU, AMD Ryzen 7 PRO 7840HS
108 Seconds * -227%
Asus ExpertBook B6 Flip B6602FC2
NVIDIA RTX A2000 Laptop GPU, Intel Core i9-12950HX
79 Seconds * -139%
MSI CreatorPro Z16P B12UKST
NVIDIA RTX A3000 Laptop GPU, Intel Core i7-12700H
60 Seconds * -82%
Lenovo ThinkPad P1 G6-21FV000DGE
NVIDIA RTX 2000 Ada Generation Laptop GPU, Intel Core i9-13900H
51 Seconds * -55%
HP ZBook Fury 16 G9
NVIDIA RTX A5500 Laptop GPU, Intel Core i9-12950HX
40 Seconds * -21%
Asus ProArt Studiobook 16 OLED H7604
NVIDIA GeForce RTX 4070 Laptop GPU, Intel Core i9-13980HX
36 Seconds * -9%
HP ZBook Fury 16 G11
NVIDIA RTX 3500 Ada Generation Laptop GPU, Intel Core i9-14900HX
33 Seconds *
Average NVIDIA RTX 3500 Ada Generation Laptop GPU
  ()
33 Seconds * -0%
Lenovo ThinkPad P1 G6 21FV001KUS
NVIDIA GeForce RTX 4080 Laptop GPU, Intel Core i7-13800H
27 Seconds * +18%
Dell Precision 5000 5680
NVIDIA RTX 5000 Ada Generation Laptop GPU, Intel Core i9-13900H
23 Seconds * +30%
Dell Precision 5690
NVIDIA RTX 5000 Ada Generation Laptop GPU, Intel Core Ultra 9 185H
23 Seconds * +30%
HP ZBook Fury 16 G10
NVIDIA RTX 5000 Ada Generation Laptop GPU, Intel Core i9-13950HX
21 Seconds * +36%
v3.3 Classroom CPU
Dell Precision 5690
NVIDIA RTX 5000 Ada Generation Laptop GPU, Intel Core Ultra 9 185H
386 Seconds * -57%
Dell Precision 5000 5680
NVIDIA RTX 5000 Ada Generation Laptop GPU, Intel Core i9-13900H
345 Seconds * -40%
MSI CreatorPro Z16P B12UKST
NVIDIA RTX A3000 Laptop GPU, Intel Core i7-12700H
339 Seconds * -38%
Lenovo ThinkPad P1 G6 21FV001KUS
NVIDIA GeForce RTX 4080 Laptop GPU, Intel Core i7-13800H
337 Seconds * -37%
Lenovo ThinkPad P1 G6-21FV000DGE
NVIDIA RTX 2000 Ada Generation Laptop GPU, Intel Core i9-13900H
329 Seconds * -34%
Lenovo ThinkPad P16v G1 AMD
NVIDIA RTX A1000 Laptop GPU, AMD Ryzen 7 PRO 7840HS
329 Seconds * -34%
Asus ExpertBook B6 Flip B6602FC2
NVIDIA RTX A2000 Laptop GPU, Intel Core i9-12950HX
326 Seconds * -33%
HP ZBook Fury 16 G9
NVIDIA RTX A5500 Laptop GPU, Intel Core i9-12950HX
302 Seconds * -23%
Lenovo ThinkPad P16 G2 21FA000FGE
NVIDIA RTX 2000 Ada Generation Laptop GPU, Intel Core i7-13700HX
291 Seconds * -18%
HP ZBook Fury 16 G10
NVIDIA RTX 5000 Ada Generation Laptop GPU, Intel Core i9-13950HX
254 Seconds * -3%
HP ZBook Fury 16 G11
NVIDIA RTX 3500 Ada Generation Laptop GPU, Intel Core i9-14900HX
246 Seconds *
Average NVIDIA RTX 3500 Ada Generation Laptop GPU
  ()
246 Seconds * -0%
Asus ProArt Studiobook 16 OLED H7604
NVIDIA GeForce RTX 4070 Laptop GPU, Intel Core i9-13980HX
190 Seconds * +23%

* ... im mniej tym lepiej

Wydajność w grach

Choć nie została zaprojektowana do gier, RTX 3500 Ada osiąga wyniki nieco powyżej mobilny GeForce RTX 4070 ale poniżej mobilnego RTX 4080, zwłaszcza biorąc pod uwagę liczbę zunifikowanych potoków, rdzeni tensorowych i przepustowość pamięci. Wydajność może jednak stopniowo spadać w miarę upływu czasu, ponieważ prędkości GPU nie są nieograniczone. Przykładowo, podczas bezczynności w grze Cyberpunk 2077 przy ustawieniach 1080p Ultra, wydajność zaczynała się od nieco ponad 70 FPS, po czym stopniowo spadała do niskiego zakresu 60 FPS po zaledwie 30 minutach, jak pokazano na poniższym wykresie.

Performance Rating - Percent
HP ZBook Fury 16 G10 -2!
Intel Core i9-13950HX, NVIDIA RTX 5000 Ada Generation Laptop GPU
97.6 pt
Lenovo ThinkPad P1 G6 21FV001KUS -1!
Intel Core i7-13800H, NVIDIA GeForce RTX 4080 Laptop GPU
89.7 pt
HP ZBook Fury 16 G11
Intel Core i9-14900HX, NVIDIA RTX 3500 Ada Generation Laptop GPU
86.1 pt
Asus ProArt Studiobook 16 OLED H7604 -1!
Intel Core i9-13980HX, NVIDIA GeForce RTX 4070 Laptop GPU
85.5 pt
Dell Precision 5690 -1!
Intel Core Ultra 9 185H, NVIDIA RTX 5000 Ada Generation Laptop GPU
85.4 pt
HP ZBook Fury 16 G9 -1!
Intel Core i9-12950HX, NVIDIA RTX A5500 Laptop GPU
78.4 pt
Lenovo ThinkPad P16 G2 21FA000FGE -1!
Intel Core i7-13700HX, NVIDIA RTX 2000 Ada Generation Laptop GPU
71.7 pt
GTA V - 1920x1080 Highest Settings possible AA:4xMSAA + FX AF:16x
Asus ProArt Studiobook 16 OLED H7604
Intel Core i9-13980HX, NVIDIA GeForce RTX 4070 Laptop GPU
123 (8.87min, 83.3P1) fps +6%
Lenovo ThinkPad P1 G6 21FV001KUS
Intel Core i7-13800H, NVIDIA GeForce RTX 4080 Laptop GPU
120.3 (5.22min, 83.3P1) fps +4%
HP ZBook Fury 16 G9
Intel Core i9-12950HX, NVIDIA RTX A5500 Laptop GPU
118.5 (5.38min, 52.6P1) fps +3%
HP ZBook Fury 16 G11
Intel Core i9-14900HX, NVIDIA RTX 3500 Ada Generation Laptop GPU
115.5 (4.64min, 76.9P1) fps
Lenovo ThinkPad P16 G2 21FA000FGE
Intel Core i7-13700HX, NVIDIA RTX 2000 Ada Generation Laptop GPU
98 (18.5min, 66.7P1) fps -15%
Final Fantasy XV Benchmark - 1920x1080 High Quality
HP ZBook Fury 16 G10
Intel Core i9-13950HX, NVIDIA RTX 5000 Ada Generation Laptop GPU
149.1 fps +16%
Lenovo ThinkPad P1 G6 21FV001KUS
Intel Core i7-13800H, NVIDIA GeForce RTX 4080 Laptop GPU
135.3 fps +5%
Dell Precision 5690
Intel Core Ultra 9 185H, NVIDIA RTX 5000 Ada Generation Laptop GPU
132.5 fps +3%
HP ZBook Fury 16 G11
Intel Core i9-14900HX, NVIDIA RTX 3500 Ada Generation Laptop GPU
128.9 fps
Asus ProArt Studiobook 16 OLED H7604
Intel Core i9-13980HX, NVIDIA GeForce RTX 4070 Laptop GPU
114.7 fps -11%
HP ZBook Fury 16 G9
Intel Core i9-12950HX, NVIDIA RTX A5500 Laptop GPU
103.5 fps -20%
Lenovo ThinkPad P16 G2 21FA000FGE
Intel Core i7-13700HX, NVIDIA RTX 2000 Ada Generation Laptop GPU
84.2 fps -35%
Strange Brigade - 1920x1080 ultra AA:ultra AF:16
HP ZBook Fury 16 G10
Intel Core i9-13950HX, NVIDIA RTX 5000 Ada Generation Laptop GPU
283 (35min, 198.2P1) fps +27%
Dell Precision 5690
Intel Core Ultra 9 185H, NVIDIA RTX 5000 Ada Generation Laptop GPU
252 (95min, 179P1) fps +13%
HP ZBook Fury 16 G11
Intel Core i9-14900HX, NVIDIA RTX 3500 Ada Generation Laptop GPU
223 (52.5min, 159.8P1) fps
HP ZBook Fury 16 G9
Intel Core i9-12950HX, NVIDIA RTX A5500 Laptop GPU
168.6 (63.3min, 124.8P1) fps -24%
Lenovo ThinkPad P16 G2 21FA000FGE
Intel Core i7-13700HX, NVIDIA RTX 2000 Ada Generation Laptop GPU
158.4 (22.5min, 117.2P1) fps -29%
Asus ProArt Studiobook 16 OLED H7604
Intel Core i9-13980HX, NVIDIA GeForce RTX 4070 Laptop GPU
142.7 (37.9min, 70.5P1) fps -36%
Dota 2 Reborn - 1920x1080 ultra (3/3) best looking
Asus ProArt Studiobook 16 OLED H7604
Intel Core i9-13980HX, NVIDIA GeForce RTX 4070 Laptop GPU
171.6 (147.3min) fps +12%
HP ZBook Fury 16 G10
Intel Core i9-13950HX, NVIDIA RTX 5000 Ada Generation Laptop GPU
166.7 (137.7min) fps +8%
HP ZBook Fury 16 G11
Intel Core i9-14900HX, NVIDIA RTX 3500 Ada Generation Laptop GPU
153.9 (131.9min) fps
HP ZBook Fury 16 G9
Intel Core i9-12950HX, NVIDIA RTX A5500 Laptop GPU
150.7 (128.4min) fps -2%
Lenovo ThinkPad P16 G2 21FA000FGE
Intel Core i7-13700HX, NVIDIA RTX 2000 Ada Generation Laptop GPU
150.2 (130.8min) fps -2%
Lenovo ThinkPad P1 G6 21FV001KUS
Intel Core i7-13800H, NVIDIA GeForce RTX 4080 Laptop GPU
147.3 (126min) fps -4%
Dell Precision 5690
Intel Core Ultra 9 185H, NVIDIA RTX 5000 Ada Generation Laptop GPU
139.9 (118min) fps -9%
X-Plane 11.11 - 1920x1080 high (fps_test=3)
Asus ProArt Studiobook 16 OLED H7604
Intel Core i9-13980HX, NVIDIA GeForce RTX 4070 Laptop GPU
131.1 fps +18%
HP ZBook Fury 16 G10
Intel Core i9-13950HX, NVIDIA RTX 5000 Ada Generation Laptop GPU
122.4 fps +10%
Lenovo ThinkPad P1 G6 21FV001KUS
Intel Core i7-13800H, NVIDIA GeForce RTX 4080 Laptop GPU
118.6 fps +7%
HP ZBook Fury 16 G11
Intel Core i9-14900HX, NVIDIA RTX 3500 Ada Generation Laptop GPU
110.9 fps
HP ZBook Fury 16 G9
Intel Core i9-12950HX, NVIDIA RTX A5500 Laptop GPU
103.6 fps -7%
Lenovo ThinkPad P16 G2 21FA000FGE
Intel Core i7-13700HX, NVIDIA RTX 2000 Ada Generation Laptop GPU
103.4 fps -7%
Dell Precision 5690
Intel Core Ultra 9 185H, NVIDIA RTX 5000 Ada Generation Laptop GPU
88.7 fps -20%
Cyberpunk 2077 2.1 Phantom Liberty - 1920x1080 Ultra Preset (FSR off)
Dell Precision 5690
Intel Core Ultra 9 185H, NVIDIA RTX 5000 Ada Generation Laptop GPU
108.5 (48.4min) fps +20%
Lenovo ThinkPad P1 G6 21FV001KUS
Intel Core i7-13800H, NVIDIA GeForce RTX 4080 Laptop GPU
90.9 (28min) fps +1%
HP ZBook Fury 16 G11
Intel Core i9-14900HX, NVIDIA RTX 3500 Ada Generation Laptop GPU
90.3 (73.1min) fps
Cyberpunk 2077 2.1 Phantom Liberty
1280x720 Low Preset (FSR off)
Dell Precision 5690
Intel Core Ultra 9 185H, NVIDIA RTX 5000 Ada Generation Laptop GPU
127.9 (27.3min) fps +4%
HP ZBook Fury 16 G11
Intel Core i9-14900HX, NVIDIA RTX 3500 Ada Generation Laptop GPU
123.4 (102.3min) fps
Average NVIDIA RTX 3500 Ada Generation Laptop GPU
  ()
123.4 fps 0%
1920x1080 Low Preset (FSR off)
Dell Precision 5690
Intel Core Ultra 9 185H, NVIDIA RTX 5000 Ada Generation Laptop GPU
125 (22.3min) fps +3%
HP ZBook Fury 16 G11
Intel Core i9-14900HX, NVIDIA RTX 3500 Ada Generation Laptop GPU
121.2 (100.2min) fps
Average NVIDIA RTX 3500 Ada Generation Laptop GPU
  ()
121.2 fps 0%
Lenovo ThinkPad P16v G1 AMD
AMD Ryzen 7 PRO 7840HS, NVIDIA RTX A1000 Laptop GPU
66.4 (51.3min) fps -45%
1920x1080 Medium Preset (FSR off)
Dell Precision 5690
Intel Core Ultra 9 185H, NVIDIA RTX 5000 Ada Generation Laptop GPU
116.6 (21.8min) fps +3%
HP ZBook Fury 16 G11
Intel Core i9-14900HX, NVIDIA RTX 3500 Ada Generation Laptop GPU
113.1 (93.8min) fps
Average NVIDIA RTX 3500 Ada Generation Laptop GPU
  ()
113.1 fps 0%
Lenovo ThinkPad P16v G1 AMD
AMD Ryzen 7 PRO 7840HS, NVIDIA RTX A1000 Laptop GPU
49.8 (39.1min) fps -56%
1920x1080 High Preset (FSR off)
Lenovo ThinkPad P1 G6 21FV001KUS
Intel Core i7-13800H, NVIDIA GeForce RTX 4080 Laptop GPU
103.8 (41.8min) fps +2%
HP ZBook Fury 16 G11
Intel Core i9-14900HX, NVIDIA RTX 3500 Ada Generation Laptop GPU
101.8 (84min) fps
Average NVIDIA RTX 3500 Ada Generation Laptop GPU
  ()
101.8 fps 0%
Dell Precision 5690
Intel Core Ultra 9 185H, NVIDIA RTX 5000 Ada Generation Laptop GPU
94.6 (39.9min) fps -7%
Lenovo ThinkPad P16v G1 AMD
AMD Ryzen 7 PRO 7840HS, NVIDIA RTX A1000 Laptop GPU
41.6 (31.9min) fps -59%
1920x1080 Ultra Preset (FSR off)
Dell Precision 5690
Intel Core Ultra 9 185H, NVIDIA RTX 5000 Ada Generation Laptop GPU
108.5 (48.4min) fps +20%
Lenovo ThinkPad P1 G6 21FV001KUS
Intel Core i7-13800H, NVIDIA GeForce RTX 4080 Laptop GPU
90.9 (28min) fps +1%
HP ZBook Fury 16 G11
Intel Core i9-14900HX, NVIDIA RTX 3500 Ada Generation Laptop GPU
90.3 (73.1min) fps
Average NVIDIA RTX 3500 Ada Generation Laptop GPU
  ()
90.3 fps 0%
Lenovo ThinkPad P16v G1 AMD
AMD Ryzen 7 PRO 7840HS, NVIDIA RTX A1000 Laptop GPU
34.7 (26.7min) fps -62%
2560x1440 Ultra Preset (FSR off)
Dell Precision 5690
Intel Core Ultra 9 185H, NVIDIA RTX 5000 Ada Generation Laptop GPU
63.7 (28min) fps +6%
HP ZBook Fury 16 G11
Intel Core i9-14900HX, NVIDIA RTX 3500 Ada Generation Laptop GPU
60.2 (51.5min) fps
Average NVIDIA RTX 3500 Ada Generation Laptop GPU
  ()
60.2 fps 0%
Lenovo ThinkPad P1 G6 21FV001KUS
Intel Core i7-13800H, NVIDIA GeForce RTX 4080 Laptop GPU
59.9 (14.1min) fps 0%
3840x2160 Ultra Preset (FSR off)
Dell Precision 5690
Intel Core Ultra 9 185H, NVIDIA RTX 5000 Ada Generation Laptop GPU
28.8 (21.2min) fps +35%
Lenovo ThinkPad P1 G6 21FV001KUS
Intel Core i7-13800H, NVIDIA GeForce RTX 4080 Laptop GPU
25.8 (20.3min) fps +21%
HP ZBook Fury 16 G11
Intel Core i9-14900HX, NVIDIA RTX 3500 Ada Generation Laptop GPU
21.3 (19.6min) fps
Average NVIDIA RTX 3500 Ada Generation Laptop GPU
  ()
21.3 fps 0%
GTA V
1920x1080 High/On (Advanced Graphics Off) AA:2xMSAA + FX AF:8x
Asus ProArt Studiobook 16 OLED H7604
Intel Core i9-13980HX, NVIDIA GeForce RTX 4070 Laptop GPU
179 (2.07min, 125P1) fps +5%
Dell Precision 5000 5680
Intel Core i9-13900H, NVIDIA RTX 5000 Ada Generation Laptop GPU
175.3 (3.07min, 125P1) fps +3%
Lenovo ThinkPad P1 G6-21FV000DGE
Intel Core i9-13900H, NVIDIA RTX 2000 Ada Generation Laptop GPU
173 (4.48min, 125P1) fps +2%
Lenovo ThinkPad P16 G2 21FA000FGE
Intel Core i7-13700HX, NVIDIA RTX 2000 Ada Generation Laptop GPU
171.9 (3.32min, 111.1P1) fps +1%
Lenovo ThinkPad P16 G2 21FA000FGE
Intel Core i7-13700HX, NVIDIA RTX 2000 Ada Generation Laptop GPU
163.6 (3.8min, 100P1) fps -4%
HP ZBook Fury 16 G9
Intel Core i9-12950HX, NVIDIA RTX A5500 Laptop GPU
170.7 (3.17min, 40P1) fps 0%
HP ZBook Fury 16 G11
Intel Core i9-14900HX, NVIDIA RTX 3500 Ada Generation Laptop GPU
170.1 (2.88min, 100P1) fps
Average NVIDIA RTX 3500 Ada Generation Laptop GPU
  ()
170.1 fps 0%
MSI CreatorPro Z16P B12UKST
Intel Core i7-12700H, NVIDIA RTX A3000 Laptop GPU
168.5 (3.91min, 111.1P1) fps -1%
Lenovo ThinkPad P1 G4-20Y4S0KS00
Intel Core i7-11850H, NVIDIA GeForce RTX 3070 Laptop GPU
164 (5.21min, 90.9P1) fps -4%
Asus ExpertBook B6 Flip B6602FC2
Intel Core i9-12950HX, NVIDIA RTX A2000 Laptop GPU
163.5 (3.57min, 111.1P1) fps -4%
Lenovo ThinkPad P16v G1 AMD
AMD Ryzen 7 PRO 7840HS, NVIDIA RTX A1000 Laptop GPU
129.4 (13.7min, 90.9P1) fps -24%
1920x1080 Highest Settings possible AA:4xMSAA + FX AF:16x
Asus ProArt Studiobook 16 OLED H7604
Intel Core i9-13980HX, NVIDIA GeForce RTX 4070 Laptop GPU
123 (8.87min, 83.3P1) fps +6%
Lenovo ThinkPad P1 G6 21FV001KUS
Intel Core i7-13800H, NVIDIA GeForce RTX 4080 Laptop GPU
120.3 (5.22min, 83.3P1) fps +4%
HP ZBook Fury 16 G9
Intel Core i9-12950HX, NVIDIA RTX A5500 Laptop GPU
118.5 (5.38min, 52.6P1) fps +3%
Dell Precision 5000 5680
Intel Core i9-13900H, NVIDIA RTX 5000 Ada Generation Laptop GPU
117.1 (6.83min, 76.9P1) fps +1%
HP ZBook Fury 16 G11
Intel Core i9-14900HX, NVIDIA RTX 3500 Ada Generation Laptop GPU
115.5 (4.64min, 76.9P1) fps
Average NVIDIA RTX 3500 Ada Generation Laptop GPU
  ()
115.5 fps 0%
Lenovo ThinkPad P1 G6-21FV000DGE
Intel Core i9-13900H, NVIDIA RTX 2000 Ada Generation Laptop GPU
101.6 (8.29min, 66.7P1) fps -12%
Lenovo ThinkPad P16 G2 21FA000FGE
Intel Core i7-13700HX, NVIDIA RTX 2000 Ada Generation Laptop GPU
98 (18.5min, 66.7P1) fps -15%
MSI CreatorPro Z16P B12UKST
Intel Core i7-12700H, NVIDIA RTX A3000 Laptop GPU
95.3 (6.43min, 66.7P1) fps -17%
Lenovo ThinkPad P1 G4-20Y4S0KS00
Intel Core i7-11850H, NVIDIA GeForce RTX 3070 Laptop GPU
88.1 (6.6min, 55.6P1) fps -24%
Asus ExpertBook B6 Flip B6602FC2
Intel Core i9-12950HX, NVIDIA RTX A2000 Laptop GPU
84 (7.33min, 55.6P1) fps -27%
Lenovo ThinkPad P16v G1 AMD
AMD Ryzen 7 PRO 7840HS, NVIDIA RTX A1000 Laptop GPU
62.7 (5.69min, 41.7P1) fps -46%
2560x1440 Highest Settings possible AA:4xMSAA + FX AF:16x
Dell Precision 5000 5680
Intel Core i9-13900H, NVIDIA RTX 5000 Ada Generation Laptop GPU
106.6 (4.29min, 71.4P1) fps +7%
Lenovo ThinkPad P1 G6 21FV001KUS
Intel Core i7-13800H, NVIDIA GeForce RTX 4080 Laptop GPU
106.4 (4.56min, 66.7P1) fps +7%
HP ZBook Fury 16 G11
Intel Core i9-14900HX, NVIDIA RTX 3500 Ada Generation Laptop GPU
99.7 (3.73min, 66.7P1) fps
HP ZBook Fury 16 G11
Intel Core i9-14900HX, NVIDIA RTX 3500 Ada Generation Laptop GPU
97.5 (16.9min, 66.7P1) fps -2%
Average NVIDIA RTX 3500 Ada Generation Laptop GPU
  (97.5 - 99.7, n=2)
98.6 fps -1%
HP ZBook Fury 16 G9
Intel Core i9-12950HX, NVIDIA RTX A5500 Laptop GPU
97.5 (5min, 62.5P1) fps -2%
Asus ProArt Studiobook 16 OLED H7604
Intel Core i9-13980HX, NVIDIA GeForce RTX 4070 Laptop GPU
94.5 (6.83min, 58.8P1) fps -5%
Lenovo ThinkPad P16 G2 21FA000FGE
Intel Core i7-13700HX, NVIDIA RTX 2000 Ada Generation Laptop GPU
76.8 (12.6min, 47.6P1) fps -23%
Lenovo ThinkPad P16 G2 21FA000FGE
Intel Core i7-13700HX, NVIDIA RTX 2000 Ada Generation Laptop GPU
69 (19.2min, 43.5P1) fps -31%
Lenovo ThinkPad P1 G6-21FV000DGE
Intel Core i9-13900H, NVIDIA RTX 2000 Ada Generation Laptop GPU
74.6 (5.74min, 47.6P1) fps -25%
Lenovo ThinkPad P1 G4-20Y4S0KS00
Intel Core i7-11850H, NVIDIA GeForce RTX 3070 Laptop GPU
74.5 (7.31min, 43.5P1) fps -25%
MSI CreatorPro Z16P B12UKST
Intel Core i7-12700H, NVIDIA RTX A3000 Laptop GPU
71.3 (7.74min, 50P1) fps -28%
3840x2160 Highest Settings possible AA:4xMSAA + FX AF:16x
Dell Precision 5000 5680
Intel Core i9-13900H, NVIDIA RTX 5000 Ada Generation Laptop GPU
55.3 (14.3min, 34.5P1) fps +14%
Lenovo ThinkPad P1 G6 21FV001KUS
Intel Core i7-13800H, NVIDIA GeForce RTX 4080 Laptop GPU
52.3 (4.16min, 37P1) fps +8%
Lenovo ThinkPad P1 G6 21FV001KUS
Intel Core i7-13800H, NVIDIA GeForce RTX 4080 Laptop GPU
51.6 (4.72min, 37P1) fps +6%
HP ZBook Fury 16 G9
Intel Core i9-12950HX, NVIDIA RTX A5500 Laptop GPU
49.8 (9.83min, 34.5P1) fps +2%
HP ZBook Fury 16 G11
Intel Core i9-14900HX, NVIDIA RTX 3500 Ada Generation Laptop GPU
48.6 (4.77min, 32.3P1) fps
Average NVIDIA RTX 3500 Ada Generation Laptop GPU
  ()
48.6 fps 0%
Lenovo ThinkPad P1 G4-20Y4S0KS00
Intel Core i7-11850H, NVIDIA GeForce RTX 3070 Laptop GPU
39.8 (7.97min, 29.4P1) fps -18%
Dota 2 Reborn
1920x1080 high (2/3)
HP ZBook Fury 16 G10
Intel Core i9-13950HX, NVIDIA RTX 5000 Ada Generation Laptop GPU
188.2 (149.9min) fps +16%
Asus ProArt Studiobook 16 OLED H7604
Intel Core i9-13980HX, NVIDIA GeForce RTX 4070 Laptop GPU
184.4 (160.5min) fps +14%
HP ZBook Fury 16 G9
Intel Core i9-12950HX, NVIDIA RTX A5500 Laptop GPU
162.4 (139.1min) fps 0%
HP ZBook Fury 16 G11
Intel Core i9-14900HX, NVIDIA RTX 3500 Ada Generation Laptop GPU
162.1 (138.3min) fps
Average NVIDIA RTX 3500 Ada Generation Laptop GPU
  ()
162.1 fps 0%
Lenovo ThinkPad P16 G2 21FA000FGE
Intel Core i7-13700HX, NVIDIA RTX 2000 Ada Generation Laptop GPU
160.7 (139.5min) fps -1%
MSI CreatorPro Z16P B12UKST
Intel Core i7-12700H, NVIDIA RTX A3000 Laptop GPU
155.8 (136min) fps -4%
Lenovo ThinkPad P1 G6 21FV001KUS
Intel Core i7-13800H, NVIDIA GeForce RTX 4080 Laptop GPU
155.8 (131.6min) fps -4%
Asus ExpertBook B6 Flip B6602FC2
Intel Core i9-12950HX, NVIDIA RTX A2000 Laptop GPU
154.3 (133.3min) fps -5%
Dell Precision 5000 5680
Intel Core i9-13900H, NVIDIA RTX 5000 Ada Generation Laptop GPU
154 (135.6min) fps -5%
Dell Precision 5690
Intel Core Ultra 9 185H, NVIDIA RTX 5000 Ada Generation Laptop GPU
150.1 (128.5min) fps -7%
Lenovo ThinkPad P1 G6-21FV000DGE
Intel Core i9-13900H, NVIDIA RTX 2000 Ada Generation Laptop GPU
143.9 (120.2min) fps -11%
Lenovo ThinkPad P16v G1 AMD
AMD Ryzen 7 PRO 7840HS, NVIDIA RTX A1000 Laptop GPU
125 (110.6min) fps -23%
Lenovo ThinkPad P1 G4-20Y4S0KS00
Intel Core i7-11850H, NVIDIA GeForce RTX 3070 Laptop GPU
124 (107.6min) fps -24%
1920x1080 ultra (3/3) best looking
Asus ProArt Studiobook 16 OLED H7604
Intel Core i9-13980HX, NVIDIA GeForce RTX 4070 Laptop GPU
171.6 (147.3min) fps +12%
HP ZBook Fury 16 G10
Intel Core i9-13950HX, NVIDIA RTX 5000 Ada Generation Laptop GPU
166.7 (137.7min) fps +8%
HP ZBook Fury 16 G11
Intel Core i9-14900HX, NVIDIA RTX 3500 Ada Generation Laptop GPU
153.9 (131.9min) fps
Average NVIDIA RTX 3500 Ada Generation Laptop GPU
  ()
153.9 fps 0%
HP ZBook Fury 16 G9
Intel Core i9-12950HX, NVIDIA RTX A5500 Laptop GPU
150.7 (128.4min) fps -2%
Lenovo ThinkPad P16 G2 21FA000FGE
Intel Core i7-13700HX, NVIDIA RTX 2000 Ada Generation Laptop GPU
150.2 (130.8min) fps -2%
Lenovo ThinkPad P1 G6 21FV001KUS
Intel Core i7-13800H, NVIDIA GeForce RTX 4080 Laptop GPU
147.3 (126min) fps -4%
MSI CreatorPro Z16P B12UKST
Intel Core i7-12700H, NVIDIA RTX A3000 Laptop GPU
147.1 (127.8min) fps -4%
Dell Precision 5000 5680
Intel Core i9-13900H, NVIDIA RTX 5000 Ada Generation Laptop GPU
144 (126.4min) fps -6%
Asus ExpertBook B6 Flip B6602FC2
Intel Core i9-12950HX, NVIDIA RTX A2000 Laptop GPU
142.5 (119.6min) fps -7%
Dell Precision 5690
Intel Core Ultra 9 185H, NVIDIA RTX 5000 Ada Generation Laptop GPU
139.9 (118min) fps -9%
Lenovo ThinkPad P1 G6-21FV000DGE
Intel Core i9-13900H, NVIDIA RTX 2000 Ada Generation Laptop GPU
133.4 (113.4min) fps -13%
Lenovo ThinkPad P16v G1 AMD
AMD Ryzen 7 PRO 7840HS, NVIDIA RTX A1000 Laptop GPU
118.2 (104.2min) fps -23%
Lenovo ThinkPad P1 G4-20Y4S0KS00
Intel Core i7-11850H, NVIDIA GeForce RTX 3070 Laptop GPU
106 (90.8min) fps -31%
3840x2160 ultra (3/3) best looking
HP ZBook Fury 16 G10
Intel Core i9-13950HX, NVIDIA RTX 5000 Ada Generation Laptop GPU
157.3 (129.2min) fps +17%
Lenovo ThinkPad P1 G6 21FV001KUS
Intel Core i7-13800H, NVIDIA GeForce RTX 4080 Laptop GPU
144.6 (120.8min) fps +8%
Dell Precision 5000 5680
Intel Core i9-13900H, NVIDIA RTX 5000 Ada Generation Laptop GPU
142.5 (119.6min) fps +6%
HP ZBook Fury 16 G11
Intel Core i9-14900HX, NVIDIA RTX 3500 Ada Generation Laptop GPU
134.4 (114.3min) fps
Average NVIDIA RTX 3500 Ada Generation Laptop GPU
  ()
134.4 fps 0%
Dell Precision 5690
Intel Core Ultra 9 185H, NVIDIA RTX 5000 Ada Generation Laptop GPU
130 (104.9min) fps -3%
HP ZBook Fury 16 G9
Intel Core i9-12950HX, NVIDIA RTX A5500 Laptop GPU
116.1 (86min) fps -14%
Lenovo ThinkPad P1 G4-20Y4S0KS00
Intel Core i7-11850H, NVIDIA GeForce RTX 3070 Laptop GPU
109 (93.1min) fps -19%
Asus ExpertBook B6 Flip B6602FC2
Intel Core i9-12950HX, NVIDIA RTX A2000 Laptop GPU
83.2 (76.6min) fps -38%
Final Fantasy XV Benchmark
1920x1080 High Quality
HP ZBook Fury 16 G10
Intel Core i9-13950HX, NVIDIA RTX 5000 Ada Generation Laptop GPU
149.1 fps +16%
Lenovo ThinkPad P1 G6 21FV001KUS
Intel Core i7-13800H, NVIDIA GeForce RTX 4080 Laptop GPU
135.3 fps +5%
Dell Precision 5690
Intel Core Ultra 9 185H, NVIDIA RTX 5000 Ada Generation Laptop GPU
132.5 fps +3%
HP ZBook Fury 16 G11
Intel Core i9-14900HX, NVIDIA RTX 3500 Ada Generation Laptop GPU
128.9 fps
Average NVIDIA RTX 3500 Ada Generation Laptop GPU
  ()
128.9 fps 0%
Dell Precision 5000 5680
Intel Core i9-13900H, NVIDIA RTX 5000 Ada Generation Laptop GPU
127.4 fps -1%
Asus ProArt Studiobook 16 OLED H7604
Intel Core i9-13980HX, NVIDIA GeForce RTX 4070 Laptop GPU
114.7 fps -11%
HP ZBook Fury 16 G9
Intel Core i9-12950HX, NVIDIA RTX A5500 Laptop GPU
103.5 fps -20%
Lenovo ThinkPad P16 G2 21FA000FGE
Intel Core i7-13700HX, NVIDIA RTX 2000 Ada Generation Laptop GPU
84.2 fps -35%
Lenovo ThinkPad P1 G6-21FV000DGE
Intel Core i9-13900H, NVIDIA RTX 2000 Ada Generation Laptop GPU
83.5 fps -35%
MSI CreatorPro Z16P B12UKST
Intel Core i7-12700H, NVIDIA RTX A3000 Laptop GPU
64.3 fps -50%
Asus ExpertBook B6 Flip B6602FC2
Intel Core i9-12950HX, NVIDIA RTX A2000 Laptop GPU
64 fps -50%
Lenovo ThinkPad P16v G1 AMD
AMD Ryzen 7 PRO 7840HS, NVIDIA RTX A1000 Laptop GPU
48.3 fps -63%
2560x1440 High Quality
HP ZBook Fury 16 G10
Intel Core i9-13950HX, NVIDIA RTX 5000 Ada Generation Laptop GPU
120 fps +23%
Dell Precision 5690
Intel Core Ultra 9 185H, NVIDIA RTX 5000 Ada Generation Laptop GPU
103.8 fps +6%
Lenovo ThinkPad P1 G6 21FV001KUS
Intel Core i7-13800H, NVIDIA GeForce RTX 4080 Laptop GPU
102.6 fps +5%
Dell Precision 5000 5680
Intel Core i9-13900H, NVIDIA RTX 5000 Ada Generation Laptop GPU
100.8 fps +3%
HP ZBook Fury 16 G11
Intel Core i9-14900HX, NVIDIA RTX 3500 Ada Generation Laptop GPU
97.5 fps
Average NVIDIA RTX 3500 Ada Generation Laptop GPU
  ()
97.5 fps 0%
Asus ProArt Studiobook 16 OLED H7604
Intel Core i9-13980HX, NVIDIA GeForce RTX 4070 Laptop GPU
85.2 fps -13%
HP ZBook Fury 16 G9
Intel Core i9-12950HX, NVIDIA RTX A5500 Laptop GPU
75.1 fps -23%
Lenovo ThinkPad P1 G6-21FV000DGE
Intel Core i9-13900H, NVIDIA RTX 2000 Ada Generation Laptop GPU
63.7 fps -35%
Lenovo ThinkPad P16 G2 21FA000FGE
Intel Core i7-13700HX, NVIDIA RTX 2000 Ada Generation Laptop GPU
61.3 fps -37%
Asus ExpertBook B6 Flip B6602FC2
Intel Core i9-12950HX, NVIDIA RTX A2000 Laptop GPU
47.1 fps -52%
MSI CreatorPro Z16P B12UKST
Intel Core i7-12700H, NVIDIA RTX A3000 Laptop GPU
45.6 fps -53%
3840x2160 High Quality
HP ZBook Fury 16 G10
Intel Core i9-13950HX, NVIDIA RTX 5000 Ada Generation Laptop GPU
68.7 fps +27%
Dell Precision 5690
Intel Core Ultra 9 185H, NVIDIA RTX 5000 Ada Generation Laptop GPU
63.2 fps +17%
Lenovo ThinkPad P1 G6 21FV001KUS
Intel Core i7-13800H, NVIDIA GeForce RTX 4080 Laptop GPU
61.5 fps +13%
Dell Precision 5000 5680
Intel Core i9-13900H, NVIDIA RTX 5000 Ada Generation Laptop GPU
60.4 fps +11%
HP ZBook Fury 16 G11
Intel Core i9-14900HX, NVIDIA RTX 3500 Ada Generation Laptop GPU
54.2 fps
Average NVIDIA RTX 3500 Ada Generation Laptop GPU
  ()
54.2 fps 0%
HP ZBook Fury 16 G9
Intel Core i9-12950HX, NVIDIA RTX A5500 Laptop GPU
39.4 fps -27%
X-Plane 11.11
1920x1080 high (fps_test=3)
Asus ProArt Studiobook 16 OLED H7604
Intel Core i9-13980HX, NVIDIA GeForce RTX 4070 Laptop GPU
131.1 fps +18%
HP ZBook Fury 16 G10
Intel Core i9-13950HX, NVIDIA RTX 5000 Ada Generation Laptop GPU
122.4 fps +10%
Lenovo ThinkPad P1 G6 21FV001KUS
Intel Core i7-13800H, NVIDIA GeForce RTX 4080 Laptop GPU
118.6 fps +7%
HP ZBook Fury 16 G11
Intel Core i9-14900HX, NVIDIA RTX 3500 Ada Generation Laptop GPU
110.9 fps
Average NVIDIA RTX 3500 Ada Generation Laptop GPU
  ()
110.9 fps 0%
Lenovo ThinkPad P1 G6-21FV000DGE
Intel Core i9-13900H, NVIDIA RTX 2000 Ada Generation Laptop GPU
108.9 fps -2%
Asus ExpertBook B6 Flip B6602FC2
Intel Core i9-12950HX, NVIDIA RTX A2000 Laptop GPU
105.1 fps -5%
HP ZBook Fury 16 G9
Intel Core i9-12950HX, NVIDIA RTX A5500 Laptop GPU
103.6 fps -7%
Lenovo ThinkPad P16 G2 21FA000FGE
Intel Core i7-13700HX, NVIDIA RTX 2000 Ada Generation Laptop GPU
103.4 fps -7%
Dell Precision 5000 5680
Intel Core i9-13900H, NVIDIA RTX 5000 Ada Generation Laptop GPU
102.4 fps -8%
MSI CreatorPro Z16P B12UKST
Intel Core i7-12700H, NVIDIA RTX A3000 Laptop GPU
97.5 fps -12%
Dell Precision 5690
Intel Core Ultra 9 185H, NVIDIA RTX 5000 Ada Generation Laptop GPU
88.7 fps -20%
Lenovo ThinkPad P1 G4-20Y4S0KS00
Intel Core i7-11850H, NVIDIA GeForce RTX 3070 Laptop GPU
76.8 fps -31%
Lenovo ThinkPad P16v G1 AMD
AMD Ryzen 7 PRO 7840HS, NVIDIA RTX A1000 Laptop GPU
71.9 fps -35%
3840x2160 high (fps_test=3)
Lenovo ThinkPad P1 G6 21FV001KUS
Intel Core i7-13800H, NVIDIA GeForce RTX 4080 Laptop GPU
103 fps +11%
HP ZBook Fury 16 G10
Intel Core i9-13950HX, NVIDIA RTX 5000 Ada Generation Laptop GPU
102.6 fps +11%
Asus ExpertBook B6 Flip B6602FC2
Intel Core i9-12950HX, NVIDIA RTX A2000 Laptop GPU
93.8 fps +1%
HP ZBook Fury 16 G11
Intel Core i9-14900HX, NVIDIA RTX 3500 Ada Generation Laptop GPU
92.7 fps
Average NVIDIA RTX 3500 Ada Generation Laptop GPU
  ()
92.7 fps 0%
Dell Precision 5000 5680
Intel Core i9-13900H, NVIDIA RTX 5000 Ada Generation Laptop GPU
86.2 fps -7%
HP ZBook Fury 16 G9
Intel Core i9-12950HX, NVIDIA RTX A5500 Laptop GPU
81.9 fps -12%
Dell Precision 5690
Intel Core Ultra 9 185H, NVIDIA RTX 5000 Ada Generation Laptop GPU
74.8 fps -19%
Lenovo ThinkPad P1 G4-20Y4S0KS00
Intel Core i7-11850H, NVIDIA GeForce RTX 3070 Laptop GPU
52.4 fps -43%
Far Cry 5
1920x1080 High Preset AA:T
Asus ProArt Studiobook 16 OLED H7604
Intel Core i9-13980HX, NVIDIA GeForce RTX 4070 Laptop GPU
154 fps +14%
HP ZBook Fury 16 G10
Intel Core i9-13950HX, NVIDIA RTX 5000 Ada Generation Laptop GPU
138 (102min) fps +2%
HP ZBook Fury 16 G11
Intel Core i9-14900HX, NVIDIA RTX 3500 Ada Generation Laptop GPU
135 (99min) fps
Average NVIDIA RTX 3500 Ada Generation Laptop GPU
  ()
135 fps 0%
Dell Precision 5000 5680
Intel Core i9-13900H, NVIDIA RTX 5000 Ada Generation Laptop GPU
129 (102min) fps -4%
Dell Precision 5690
Intel Core Ultra 9 185H, NVIDIA RTX 5000 Ada Generation Laptop GPU
127 (97min) fps -6%
Lenovo ThinkPad P1 G6-21FV000DGE
Intel Core i9-13900H, NVIDIA RTX 2000 Ada Generation Laptop GPU
120 fps -11%
MSI CreatorPro Z16P B12UKST
Intel Core i7-12700H, NVIDIA RTX A3000 Laptop GPU
117 fps -13%
Asus ExpertBook B6 Flip B6602FC2
Intel Core i9-12950HX, NVIDIA RTX A2000 Laptop GPU
103 (90min) fps -24%
Lenovo ThinkPad P16v G1 AMD
AMD Ryzen 7 PRO 7840HS, NVIDIA RTX A1000 Laptop GPU
79 fps -41%
1920x1080 Ultra Preset AA:T
Lenovo ThinkPad P1 G6 21FV001KUS
Intel Core i7-13800H, NVIDIA GeForce RTX 4080 Laptop GPU
149 (105min) fps +17%
Asus ProArt Studiobook 16 OLED H7604
Intel Core i9-13980HX, NVIDIA GeForce RTX 4070 Laptop GPU
145 fps +14%
Dell Precision 5000 5680
Intel Core i9-13900H, NVIDIA RTX 5000 Ada Generation Laptop GPU
132 (101min) fps +4%
HP ZBook Fury 16 G10
Intel Core i9-13950HX, NVIDIA RTX 5000 Ada Generation Laptop GPU
131 (98min) fps +3%
HP ZBook Fury 16 G11
Intel Core i9-14900HX, NVIDIA RTX 3500 Ada Generation Laptop GPU
127 (94min) fps
Average NVIDIA RTX 3500 Ada Generation Laptop GPU
  ()
127 fps 0%
Dell Precision 5690
Intel Core Ultra 9 185H, NVIDIA RTX 5000 Ada Generation Laptop GPU
119 (91min) fps -6%
Lenovo ThinkPad P1 G6-21FV000DGE
Intel Core i9-13900H, NVIDIA RTX 2000 Ada Generation Laptop GPU
113 fps -11%
MSI CreatorPro Z16P B12UKST
Intel Core i7-12700H, NVIDIA RTX A3000 Laptop GPU
108 fps -15%
Asus ExpertBook B6 Flip B6602FC2
Intel Core i9-12950HX, NVIDIA RTX A2000 Laptop GPU
96 (86min) fps -24%
Lenovo ThinkPad P16v G1 AMD
AMD Ryzen 7 PRO 7840HS, NVIDIA RTX A1000 Laptop GPU
73 fps -43%
2560x1440 Ultra Preset AA:T
HP ZBook Fury 16 G10
Intel Core i9-13950HX, NVIDIA RTX 5000 Ada Generation Laptop GPU
129 (94min) fps +18%
Lenovo ThinkPad P1 G6 21FV001KUS
Intel Core i7-13800H, NVIDIA GeForce RTX 4080 Laptop GPU
126 (112min) fps +16%
Asus ProArt Studiobook 16 OLED H7604
Intel Core i9-13980HX, NVIDIA GeForce RTX 4070 Laptop GPU
117 fps +7%
Dell Precision 5000 5680
Intel Core i9-13900H, NVIDIA RTX 5000 Ada Generation Laptop GPU
114 (65min) fps +5%
Dell Precision 5690
Intel Core Ultra 9 185H, NVIDIA RTX 5000 Ada Generation Laptop GPU
113 (88min) fps +4%
HP ZBook Fury 16 G11
Intel Core i9-14900HX, NVIDIA RTX 3500 Ada Generation Laptop GPU
109 (92min) fps
Average NVIDIA RTX 3500 Ada Generation Laptop GPU
  ()
109 fps 0%
Lenovo ThinkPad P1 G6-21FV000DGE
Intel Core i9-13900H, NVIDIA RTX 2000 Ada Generation Laptop GPU
81 fps -26%
MSI CreatorPro Z16P B12UKST
Intel Core i7-12700H, NVIDIA RTX A3000 Laptop GPU
76 fps -30%
3840x2160 Ultra Preset AA:T
Dell Precision 5690
Intel Core Ultra 9 185H, NVIDIA RTX 5000 Ada Generation Laptop GPU
72 (64min) fps +16%
Lenovo ThinkPad P1 G6 21FV001KUS
Intel Core i7-13800H, NVIDIA GeForce RTX 4080 Laptop GPU
71 (61min) fps +15%
Dell Precision 5000 5680
Intel Core i9-13900H, NVIDIA RTX 5000 Ada Generation Laptop GPU
70 (62min) fps +13%
HP ZBook Fury 16 G11
Intel Core i9-14900HX, NVIDIA RTX 3500 Ada Generation Laptop GPU
62 (57min) fps
Average NVIDIA RTX 3500 Ada Generation Laptop GPU
  ()
62 fps 0%
Strange Brigade
1920x1080 ultra AA:ultra AF:16
HP ZBook Fury 16 G10
Intel Core i9-13950HX, NVIDIA RTX 5000 Ada Generation Laptop GPU
283 (35min, 198.2P1) fps +27%
Dell Precision 5690
Intel Core Ultra 9 185H, NVIDIA RTX 5000 Ada Generation Laptop GPU
252 (95min, 179P1) fps +13%
HP ZBook Fury 16 G11
Intel Core i9-14900HX, NVIDIA RTX 3500 Ada Generation Laptop GPU
223 (52.5min, 159.8P1) fps
Average NVIDIA RTX 3500 Ada Generation Laptop GPU
  ()
223 fps 0%
HP ZBook Fury 16 G9
Intel Core i9-12950HX, NVIDIA RTX A5500 Laptop GPU
168.6 (63.3min, 124.8P1) fps -24%
Lenovo ThinkPad P16 G2 21FA000FGE
Intel Core i7-13700HX, NVIDIA RTX 2000 Ada Generation Laptop GPU
158.4 (22.5min, 117.2P1) fps -29%
Lenovo ThinkPad P1 G6-21FV000DGE
Intel Core i9-13900H, NVIDIA RTX 2000 Ada Generation Laptop GPU
158.2 (36.7min, 115.4P1) fps -29%
Lenovo ThinkPad P1 G4-20Y4S0KS00
Intel Core i7-11850H, NVIDIA GeForce RTX 3070 Laptop GPU
151 (39.5min, 110P1) fps -32%
Asus ProArt Studiobook 16 OLED H7604
Intel Core i9-13980HX, NVIDIA GeForce RTX 4070 Laptop GPU
142.7 (37.9min, 70.5P1) fps -36%
Asus ExpertBook B6 Flip B6602FC2
Intel Core i9-12950HX, NVIDIA RTX A2000 Laptop GPU
108.8 (68.6min, 83.3P1) fps -51%
MSI CreatorPro Z16P B12UKST
Intel Core i7-12700H, NVIDIA RTX A3000 Laptop GPU
108 fps -52%
Lenovo ThinkPad P16v G1 AMD
AMD Ryzen 7 PRO 7840HS, NVIDIA RTX A1000 Laptop GPU
78.4 (57.3min, 61.9P1) fps -65%
2560x1440 ultra AA:ultra AF:16
HP ZBook Fury 16 G10
Intel Core i9-13950HX, NVIDIA RTX 5000 Ada Generation Laptop GPU
216 (36.8min, 158.7P1) fps +36%
Dell Precision 5690
Intel Core Ultra 9 185H, NVIDIA RTX 5000 Ada Generation Laptop GPU
190.6 (44.7min, 135.8P1) fps +20%
HP ZBook Fury 16 G11
Intel Core i9-14900HX, NVIDIA RTX 3500 Ada Generation Laptop GPU
159.2 (39.8min, 126.8P1) fps
Average NVIDIA RTX 3500 Ada Generation Laptop GPU
  ()
159.2 fps 0%
HP ZBook Fury 16 G9
Intel Core i9-12950HX, NVIDIA RTX A5500 Laptop GPU
122 (88.9min, 98.3P1) fps -23%
Lenovo ThinkPad P1 G4-20Y4S0KS00
Intel Core i7-11850H, NVIDIA GeForce RTX 3070 Laptop GPU
113 (60.5min, 88.6P1) fps -29%
Lenovo ThinkPad P1 G6-21FV000DGE
Intel Core i9-13900H, NVIDIA RTX 2000 Ada Generation Laptop GPU
107.5 (57.7min, 86.9P1) fps -32%
Lenovo ThinkPad P16 G2 21FA000FGE
Intel Core i7-13700HX, NVIDIA RTX 2000 Ada Generation Laptop GPU
103.9 (32.8min, 84.8P1) fps -35%
Asus ProArt Studiobook 16 OLED H7604
Intel Core i9-13980HX, NVIDIA GeForce RTX 4070 Laptop GPU
95.3 (18.1min, 53.2P1) fps -40%
MSI CreatorPro Z16P B12UKST
Intel Core i7-12700H, NVIDIA RTX A3000 Laptop GPU
85 fps -47%
3840x2160 ultra AA:ultra AF:16
Dell Precision 5690
Intel Core Ultra 9 185H, NVIDIA RTX 5000 Ada Generation Laptop GPU
105.3 (44min, 89.3P1) fps +34%
HP ZBook Fury 16 G10
Intel Core i9-13950HX, NVIDIA RTX 5000 Ada Generation Laptop GPU
105.1 (42.4min, 85.1P1) fps +34%
HP ZBook Fury 16 G11
Intel Core i9-14900HX, NVIDIA RTX 3500 Ada Generation Laptop GPU
78.6 (24.4min, 65.2P1) fps
Average NVIDIA RTX 3500 Ada Generation Laptop GPU
  ()
78.6 fps 0%
HP ZBook Fury 16 G9
Intel Core i9-12950HX, NVIDIA RTX A5500 Laptop GPU
67.6 (35.4min, 56.7P1) fps -14%
Lenovo ThinkPad P1 G4-20Y4S0KS00
Intel Core i7-11850H, NVIDIA GeForce RTX 3070 Laptop GPU
61.1 (40.7min, 53P1) fps -22%
Tiny Tina's Wonderlands
1920x1080 High Preset (DX12)
HP ZBook Fury 16 G10
Intel Core i9-13950HX, NVIDIA RTX 5000 Ada Generation Laptop GPU
171.7 fps +25%
Dell Precision 5000 5680
Intel Core i9-13900H, NVIDIA RTX 5000 Ada Generation Laptop GPU
152.6 fps +11%
Dell Precision 5690
Intel Core Ultra 9 185H, NVIDIA RTX 5000 Ada Generation Laptop GPU
145.5 fps +6%
HP ZBook Fury 16 G11
Intel Core i9-14900HX, NVIDIA RTX 3500 Ada Generation Laptop GPU
137.9 fps
Average NVIDIA RTX 3500 Ada Generation Laptop GPU
  ()
137.9 fps 0%
HP ZBook Fury 16 G9
Intel Core i9-12950HX, NVIDIA RTX A5500 Laptop GPU
109.5 fps -21%
Asus ExpertBook B6 Flip B6602FC2
Intel Core i9-12950HX, NVIDIA RTX A2000 Laptop GPU
74 fps -46%
1920x1080 Badass Preset (DX12)
HP ZBook Fury 16 G10
Intel Core i9-13950HX, NVIDIA RTX 5000 Ada Generation Laptop GPU
139.4 fps +28%
Dell Precision 5000 5680
Intel Core i9-13900H, NVIDIA RTX 5000 Ada Generation Laptop GPU
125 fps +14%
Dell Precision 5690
Intel Core Ultra 9 185H, NVIDIA RTX 5000 Ada Generation Laptop GPU
124 fps +13%
Lenovo ThinkPad P1 G6 21FV001KUS
Intel Core i7-13800H, NVIDIA GeForce RTX 4080 Laptop GPU
118.6 fps +9%
HP ZBook Fury 16 G11
Intel Core i9-14900HX, NVIDIA RTX 3500 Ada Generation Laptop GPU
109.3 fps
Average NVIDIA RTX 3500 Ada Generation Laptop GPU
  ()
109.3 fps 0%
HP ZBook Fury 16 G9
Intel Core i9-12950HX, NVIDIA RTX A5500 Laptop GPU
87.5 fps -20%
Asus ExpertBook B6 Flip B6602FC2
Intel Core i9-12950HX, NVIDIA RTX A2000 Laptop GPU
57 fps -48%
2560x1440 Badass Preset (DX12)
HP ZBook Fury 16 G10
Intel Core i9-13950HX, NVIDIA RTX 5000 Ada Generation Laptop GPU
99.4 fps +34%
Dell Precision 5000 5680
Intel Core i9-13900H, NVIDIA RTX 5000 Ada Generation Laptop GPU
90.1 fps +21%
Dell Precision 5690
Intel Core Ultra 9 185H, NVIDIA RTX 5000 Ada Generation Laptop GPU
87.1 fps +17%
Lenovo ThinkPad P1 G6 21FV001KUS
Intel Core i7-13800H, NVIDIA GeForce RTX 4080 Laptop GPU
85 fps +14%
HP ZBook Fury 16 G11
Intel Core i9-14900HX, NVIDIA RTX 3500 Ada Generation Laptop GPU
74.4 fps
Average NVIDIA RTX 3500 Ada Generation Laptop GPU
  ()
74.4 fps 0%
HP ZBook Fury 16 G9
Intel Core i9-12950HX, NVIDIA RTX A5500 Laptop GPU
57.9 fps -22%
Asus ExpertBook B6 Flip B6602FC2
Intel Core i9-12950HX, NVIDIA RTX A2000 Laptop GPU
38.83 fps -48%
3840x2160 Badass Preset (DX12)
HP ZBook Fury 16 G10
Intel Core i9-13950HX, NVIDIA RTX 5000 Ada Generation Laptop GPU
53.9 fps +30%
Dell Precision 5000 5680
Intel Core i9-13900H, NVIDIA RTX 5000 Ada Generation Laptop GPU
50.9 fps +22%
Dell Precision 5690
Intel Core Ultra 9 185H, NVIDIA RTX 5000 Ada Generation Laptop GPU
48.4 fps +16%
Lenovo ThinkPad P1 G6 21FV001KUS
Intel Core i7-13800H, NVIDIA GeForce RTX 4080 Laptop GPU
46.4 fps +12%
HP ZBook Fury 16 G11
Intel Core i9-14900HX, NVIDIA RTX 3500 Ada Generation Laptop GPU
41.6 fps
Average NVIDIA RTX 3500 Ada Generation Laptop GPU
  ()
41.6 fps 0%
HP ZBook Fury 16 G9
Intel Core i9-12950HX, NVIDIA RTX A5500 Laptop GPU
29.6 fps -29%
F1 22
1920x1080 High Preset AA:T AF:16x
Dell Precision 5690
Intel Core Ultra 9 185H, NVIDIA RTX 5000 Ada Generation Laptop GPU
217 (166min, 110P1) fps +19%
HP ZBook Fury 16 G10
Intel Core i9-13950HX, NVIDIA RTX 5000 Ada Generation Laptop GPU
211 (162min, 86P1) fps +15%
Dell Precision 5000 5680
Intel Core i9-13900H, NVIDIA RTX 5000 Ada Generation Laptop GPU
202 (158min, 101P1) fps +11%
Lenovo ThinkPad P1 G6 21FV001KUS
Intel Core i7-13800H, NVIDIA GeForce RTX 4080 Laptop GPU
202 (163min, 110P1) fps +11%
HP ZBook Fury 16 G11
Intel Core i9-14900HX, NVIDIA RTX 3500 Ada Generation Laptop GPU
182.8 (143min, 93P1) fps
Average NVIDIA RTX 3500 Ada Generation Laptop GPU
  ()
182.8 fps 0%
HP ZBook Fury 16 G9
Intel Core i9-12950HX, NVIDIA RTX A5500 Laptop GPU
170.2 (149min, 97P1) fps -7%
Lenovo ThinkPad P1 G6-21FV000DGE
Intel Core i9-13900H, NVIDIA RTX 2000 Ada Generation Laptop GPU
138.5 (123min, 81P1) fps -24%
Asus ExpertBook B6 Flip B6602FC2
Intel Core i9-12950HX, NVIDIA RTX A2000 Laptop GPU
123.2 (118min, 68P1) fps -33%
MSI CreatorPro Z16P B12UKST
Intel Core i7-12700H, NVIDIA RTX A3000 Laptop GPU
120.9 (90min, 85P1) fps -34%
Asus ProArt Studiobook 16 OLED H7604
Intel Core i9-13980HX, NVIDIA GeForce RTX 4070 Laptop GPU
111.2 (80min, 52P1) fps -39%
Lenovo ThinkPad P16v G1 AMD
AMD Ryzen 7 PRO 7840HS, NVIDIA RTX A1000 Laptop GPU
104.3 (88min, 82P1) fps -43%
1920x1080 Ultra High Preset AA:T AF:16x
Dell Precision 5690
Intel Core Ultra 9 185H, NVIDIA RTX 5000 Ada Generation Laptop GPU
91.1 (75min, 64P1) fps +25%
HP ZBook Fury 16 G10
Intel Core i9-13950HX, NVIDIA RTX 5000 Ada Generation Laptop GPU
86.2 (74min, 37P1) fps +18%
Dell Precision 5000 5680
Intel Core i9-13900H, NVIDIA RTX 5000 Ada Generation Laptop GPU
84.5 (74min, 57P1) fps +16%
Lenovo ThinkPad P1 G6 21FV001KUS
Intel Core i7-13800H, NVIDIA GeForce RTX 4080 Laptop GPU
81.5 (71min, 59P1) fps +12%
HP ZBook Fury 16 G11
Intel Core i9-14900HX, NVIDIA RTX 3500 Ada Generation Laptop GPU
72.9 (62min, 40P1) fps
Average NVIDIA RTX 3500 Ada Generation Laptop GPU
  ()
72.9 fps 0%
HP ZBook Fury 16 G9
Intel Core i9-12950HX, NVIDIA RTX A5500 Laptop GPU
60.9 (51min, 48P1) fps -16%
Asus ProArt Studiobook 16 OLED H7604
Intel Core i9-13980HX, NVIDIA GeForce RTX 4070 Laptop GPU
59.4 (50min, 36P1) fps -19%
Lenovo ThinkPad P1 G6-21FV000DGE
Intel Core i9-13900H, NVIDIA RTX 2000 Ada Generation Laptop GPU
52.8 (45min, 39P1) fps -28%
Asus ExpertBook B6 Flip B6602FC2
Intel Core i9-12950HX, NVIDIA RTX A2000 Laptop GPU
39.4 (33min, 28P1) fps -46%
MSI CreatorPro Z16P B12UKST
Intel Core i7-12700H, NVIDIA RTX A3000 Laptop GPU
39 (32min, 31P1) fps -47%
Lenovo ThinkPad P16v G1 AMD
AMD Ryzen 7 PRO 7840HS, NVIDIA RTX A1000 Laptop GPU
30.6 (26min, 25P1) fps -58%
2560x1440 Ultra High Preset AA:T AF:16x
HP ZBook Fury 16 G10
Intel Core i9-13950HX, NVIDIA RTX 5000 Ada Generation Laptop GPU
64.4 (56min, 34P1) fps +33%
Dell Precision 5690
Intel Core Ultra 9 185H, NVIDIA RTX 5000 Ada Generation Laptop GPU
60.1 (52min, 48P1) fps +24%
Dell Precision 5000 5680
Intel Core i9-13900H, NVIDIA RTX 5000 Ada Generation Laptop GPU
56.1 (49min, 34P1) fps +16%
Lenovo ThinkPad P1 G6 21FV001KUS
Intel Core i7-13800H, NVIDIA GeForce RTX 4080 Laptop GPU
55.4 (49min, 41P1) fps +15%
HP ZBook Fury 16 G11
Intel Core i9-14900HX, NVIDIA RTX 3500 Ada Generation Laptop GPU
48.3 (41min, 39P1) fps
Average NVIDIA RTX 3500 Ada Generation Laptop GPU
  ()
48.3 fps 0%
Asus ProArt Studiobook 16 OLED H7604
Intel Core i9-13980HX, NVIDIA GeForce RTX 4070 Laptop GPU
42.4 (33min, 27P1) fps -12%
HP ZBook Fury 16 G9
Intel Core i9-12950HX, NVIDIA RTX A5500 Laptop GPU
37.2 (23min, 29P1) fps -23%
Lenovo ThinkPad P1 G6-21FV000DGE
Intel Core i9-13900H, NVIDIA RTX 2000 Ada Generation Laptop GPU
34.2 (29min, 28P1) fps -29%
MSI CreatorPro Z16P B12UKST
Intel Core i7-12700H, NVIDIA RTX A3000 Laptop GPU
26.2 (21min, 20P1) fps -46%
3840x2160 Ultra High Preset AA:T AF:16x
HP ZBook Fury 16 G10
Intel Core i9-13950HX, NVIDIA RTX 5000 Ada Generation Laptop GPU
33.4 (29min, 27P1) fps +39%
Lenovo ThinkPad P1 G6 21FV001KUS
Intel Core i7-13800H, NVIDIA GeForce RTX 4080 Laptop GPU
29.7 (25min, 24P1) fps +24%
Dell Precision 5690
Intel Core Ultra 9 185H, NVIDIA RTX 5000 Ada Generation Laptop GPU
29.6 (25min, 24P1) fps +23%
Dell Precision 5000 5680
Intel Core i9-13900H, NVIDIA RTX 5000 Ada Generation Laptop GPU
28.8 (24min, 23P1) fps +20%
HP ZBook Fury 16 G11
Intel Core i9-14900HX, NVIDIA RTX 3500 Ada Generation Laptop GPU
24 (20min, 20P1) fps
Average NVIDIA RTX 3500 Ada Generation Laptop GPU
  ()
24 fps 0%
HP ZBook Fury 16 G9
Intel Core i9-12950HX, NVIDIA RTX A5500 Laptop GPU
17.6 (15min, 14P1) fps -27%
Baldur's Gate 3
1920x1080 Ultra Preset
Dell Precision 5690
Intel Core Ultra 9 185H, NVIDIA RTX 5000 Ada Generation Laptop GPU
134.6 fps +15%
Lenovo ThinkPad P1 G6 21FV001KUS
Intel Core i7-13800H, NVIDIA GeForce RTX 4080 Laptop GPU
124.8 fps +6%
HP ZBook Fury 16 G11
Intel Core i9-14900HX, NVIDIA RTX 3500 Ada Generation Laptop GPU
117.3 fps
Average NVIDIA RTX 3500 Ada Generation Laptop GPU
  ()
117.3 fps 0%
2560x1440 Ultra Preset
Dell Precision 5690
Intel Core Ultra 9 185H, NVIDIA RTX 5000 Ada Generation Laptop GPU
100.5 fps +25%
Lenovo ThinkPad P1 G6 21FV001KUS
Intel Core i7-13800H, NVIDIA GeForce RTX 4080 Laptop GPU
88.7 fps +11%
HP ZBook Fury 16 G11
Intel Core i9-14900HX, NVIDIA RTX 3500 Ada Generation Laptop GPU
80.2 fps
Average NVIDIA RTX 3500 Ada Generation Laptop GPU
  ()
80.2 fps 0%
3840x2160 Ultra Preset
Dell Precision 5690
Intel Core Ultra 9 185H, NVIDIA RTX 5000 Ada Generation Laptop GPU
53.3 fps +29%
Lenovo ThinkPad P1 G6 21FV001KUS
Intel Core i7-13800H, NVIDIA GeForce RTX 4080 Laptop GPU
48.8 fps +18%
HP ZBook Fury 16 G11
Intel Core i9-14900HX, NVIDIA RTX 3500 Ada Generation Laptop GPU
41.2 fps
Average NVIDIA RTX 3500 Ada Generation Laptop GPU
  ()
41.2 fps 0%

Cyberpunk 2077 ultra FPS Chart

0510152025303540455055606570Tooltip
HP ZBook Fury 16 G11 i9-14900HX, NVIDIA RTX 3500 Ada Generation Laptop GPU: Ø67.6 (57.7-73.7)
lowmed.highultraQHD4K
GTA V (2015) 184.3 181 170.1 115.5 97.5 59.6
Dota 2 Reborn (2015) 201 177.7 162.1 153.9 134.4
Final Fantasy XV Benchmark (2018) 200 167.6 128.9 97.5 54.2
X-Plane 11.11 (2018) 144.6 137.8 110.9 92.7
Far Cry 5 (2018) 133 135 127 109 62
Strange Brigade (2018) 411 296 235 223 159.2 78.6
Tiny Tina's Wonderlands (2022) 232.5 195.4 137.9 109.3 74.4 41.6
F1 22 (2022) 228 223 182.8 72.9 48.3 24
Baldur's Gate 3 (2023) 164.8 136.2 118.6 117.3 80.2 41.2
Cyberpunk 2077 2.1 Phantom Liberty (2023) 121.2 113.1 101.8 90.3 60.2 21.3

Emisje

Hałas systemowy

Hałas i zachowanie wentylatorów są mniej więcej takie same jak w zeszłorocznym modelu, o ile nie są nieco głośniejsze przy wyższych obciążeniach. Wentylatory nadal okazjonalnie pulsowały na biegu jałowym na pulpicie, nawet gdy były ustawione na tryb zrównoważony bez uruchomionych aplikacji. Co gorsza, nasz konkretny egzemplarz cierpiał na zauważalne wycie cewki, które utrzymywało się przez cały okres testów.

Profil hałasu wentylatora (Biały: Tło, Czerwony: System bezczynny, Niebieski: 3DMark 06, Pomarańczowy: Cyberpunk 2077, Zielony: Prime95+FurMark stress)

Hałas

luz
23.2 / 23.2 / 29.5 dB
obciążenie
43 / 48.2 dB
  red to green bar
 
 
30 dB
cichy
40 dB(A)
słyszalny
50 dB(A)
irytujący
 
min: dark, med: mid, max: light   Earthworks M23R, Arta (odległość 15 cm)   environment noise: 23.2 dB(A)
dB(A) 0102030405060708090Deep BassMiddle BassHigh BassLower RangeMidsHigher MidsLower HighsMid HighsUpper HighsSuper Highs2031.63332.833.932.12521.422.926.124.424.93120.422.825.420.820.64019.521.321.321.220.95023.42322.820.124.16327.328.921.822.627.78029.524.321.422.129.710026.123.21818.525.612525.52217.314.224.816029.225.419.613.329.720029.22619.114.930.125032.829.421.113.131.931532.733.323.214.532.440036.93120.312.436.650035.830.819.711.735.46303429.618.210.934.48003529.917.810.534.6100038.533.920.69.438.4125037.833.118.59.537.5160039.334.218.69.939.3200038.733.417.810.238.8250037.331.115.910.437.3315037.130.819.311.136.6400036.331.114.311.236.1500031.925.612.711.731.7630029.922.612.311.929.8800026.519.412.712.126.61000024.116.612.412.323.91250021.31512.612.320.61600016.413.913.411.716.3SPL48.24329.523.248.1N6.24.11.20.56.1median 32.8median 29.6median 18median 11.7median 32.4Delta5.54.42.71.35.6hearing rangehide median Fan NoiseHP ZBook Fury 16 G11
HP ZBook Fury 16 G11
NVIDIA RTX 3500 Ada Generation Laptop GPU, i9-14900HX, SK hynix PC801 HFS001TEJ9X101N
HP ZBook Fury 16 G10
NVIDIA RTX 5000 Ada Generation Laptop GPU, i9-13950HX, SK hynix PC801 HFS001TEJ9X101N
HP ZBook Fury 16 G9
RTX A5500 Laptop GPU, i9-12950HX, Micron 3400 1TB MTFDKBA1T0TFH
Dell Precision 5690
NVIDIA RTX 5000 Ada Generation Laptop GPU, Ultra 9 185H, 2x Samsung PM9A1 1TB (RAID 0)
Lenovo ThinkPad P16 G2 21FA000FGE
NVIDIA RTX 2000 Ada Generation Laptop GPU, i7-13700HX, SK hynix PC801 HFS001TEJ9X162N
Lenovo ThinkPad P1 G6 21FV001KUS
NVIDIA GeForce RTX 4080 Laptop GPU, i7-13800H, Kioxia XG8 KXG8AZNV1T02
Asus ProArt Studiobook 16 OLED H7604
NVIDIA GeForce RTX 4070 Laptop GPU, i9-13980HX, Phison EM2804TBMTCB47
Noise
3%
4%
-3%
-4%
9%
-5%
off / environment *
23.2
22.9
1%
22.6
3%
23.4
-1%
23.5
-1%
22.5
3%
24.5
-6%
Idle Minimum *
23.2
22.9
1%
22.7
2%
23.6
-2%
23.5
-1%
22.5
3%
24.5
-6%
Idle Average *
23.2
22.9
1%
22.7
2%
24.9
-7%
29.2
-26%
22.5
3%
24.5
-6%
Idle Maximum *
29.5
28.5
3%
28.8
2%
30.9
-5%
29.5
-0%
22.5
24%
24.5
17%
Load Average *
43
40.6
6%
36.2
16%
40.4
6%
32.7
24%
28.7
33%
47.6
-11%
Cyberpunk 2077 ultra *
48.2
Load Maximum *
48.2
45.8
5%
49.3
-2%
51.9
-8%
56.6
-17%
54.4
-13%
56.7
-18%
Witcher 3 ultra *
44.1
49.5
48.3
50.6
47.5
55.9

* ... im mniej tym lepiej

Temperatura

Podwójny tylny układ wydechowy
Zasilacz AC osiąga ponad 52 C podczas pracy z wymagającymi obciążeniami
 37.8 °C41.4 °C39.4 °C 
 35.4 °C42.2 °C39.8 °C 
 31.8 °C36.6 °C33 °C 
maks. w ogóle: 42.2 °C
średnia: 37.5 °C
33.2 °C39.4 °C36 °C
32 °C48 °C44.6 °C
29.6 °C32.6 °C31.2 °C
maks. w ogóle: 48 °C
średnia: 36.3 °C
zasilacz  51.2 °C | temperatura otoczenia 20 °C | Fluke 62 Mini IR Thermometer
(±) The average temperature for the upper side under maximal load is 37.5 °C / 100 F, compared to the average of 32 °C / 90 F for the devices in the class Workstation.
(±) The maximum temperature on the upper side is 42.2 °C / 108 F, compared to the average of 38.2 °C / 101 F, ranging from 22.2 to 69.8 °C for the class Workstation.
(-) The bottom heats up to a maximum of 48 °C / 118 F, compared to the average of 41.3 °C / 106 F
(±) In idle usage, the average temperature for the upper side is 33.8 °C / 93 F, compared to the device average of 32 °C / 90 F.
(-) 3: The average temperature for the upper side is 38.5 °C / 101 F, compared to the average of 32 °C / 90 F for the class Workstation.
(±) The palmrests and touchpad can get very hot to the touch with a maximum of 37.6 °C / 99.7 F.
(-) The average temperature of the palmrest area of similar devices was 27.8 °C / 82 F (-9.8 °C / -17.7 F).
System bezczynny (pokrywa C)
System bezczynny (pokrywa D)
Cyberpunk 2077 stres (okładka C)
Cyberpunk 2077 stres (okładka D)
Prime95+FurMark stress (okładka C)
Prime95+FurMark stres (okładka D)
HP ZBook Fury 16 G11
Intel Core i9-14900HX, NVIDIA RTX 3500 Ada Generation Laptop GPU
HP ZBook Fury 16 G10
Intel Core i9-13950HX, NVIDIA RTX 5000 Ada Generation Laptop GPU
HP ZBook Fury 16 G9
Intel Core i9-12950HX, NVIDIA RTX A5500 Laptop GPU
Dell Precision 5690
Intel Core Ultra 9 185H, NVIDIA RTX 5000 Ada Generation Laptop GPU
Lenovo ThinkPad P16 G2 21FA000FGE
Intel Core i7-13700HX, NVIDIA RTX 2000 Ada Generation Laptop GPU
Lenovo ThinkPad P1 G6 21FV001KUS
Intel Core i7-13800H, NVIDIA GeForce RTX 4080 Laptop GPU
Asus ProArt Studiobook 16 OLED H7604
Intel Core i9-13980HX, NVIDIA GeForce RTX 4070 Laptop GPU
Heat
3%
10%
13%
15%
4%
3%
Maximum Upper Side *
42.2
44.8
-6%
43.2
-2%
46.6
-10%
47.2
-12%
42
-0%
44.1
-5%
Maximum Bottom *
48
50
-4%
50.4
-5%
33
31%
39.5
18%
45.2
6%
48
-0%
Idle Upper Side *
37
34.4
7%
28.6
23%
32.4
12%
28.1
24%
33
11%
32.7
12%
Idle Bottom *
36.8
31.8
14%
28.2
23%
29.4
20%
25.3
31%
37
-1%
34.9
5%

* ... im mniej tym lepiej

Głośniki

Szum różowy pokazuje głośną maksymalną głośność i stosunkowo zrównoważoną reprodukcję dźwięku
dB(A) 0102030405060708090Deep BassMiddle BassHigh BassLower RangeMidsHigher MidsLower HighsMid HighsUpper HighsSuper Highs2036.232.836.22530.526.130.53131.425.431.44031.221.331.2503422.8346334.321.834.38037.921.437.910043.71843.712552.617.352.616063.219.663.220068.419.168.425074.321.174.33157723.27740080.520.380.550079.519.779.563080.418.280.480077.817.877.810007520.675125077.218.577.2160076.818.676.8200075.117.875.1250075.415.975.4315076.219.376.2400077.314.377.3500078.412.778.4630079.112.379.1800069.112.769.11000064.312.464.31250060.312.660.31600052.713.452.7SPL88.929.588.9N891.289median 76.2median 18median 76.2Delta6.32.76.326.325.821.422.12624.925.127.622.532.523.448.72655.818.860.922.167.2267019.372.317.674.217.774.319.575.31571.711.871.311.27410.574.21072.710.17210.67210.97511.374.811.671.71269.71269.612.371.112.669.61270.111.269.824.784.70.666.6median 12median 71.73.42.2hearing rangehide median Pink NoiseHP ZBook Fury 16 G11Apple MacBook Pro 16 2021 M1 Pro
Frequency diagram (checkboxes can be checked and unchecked to compare devices)
HP ZBook Fury 16 G11 audio analysis

(+) | speakers can play relatively loud (88.9 dB)
Bass 100 - 315 Hz
(±) | reduced bass - on average 13.3% lower than median
(±) | linearity of bass is average (11.2% delta to prev. frequency)
Mids 400 - 2000 Hz
(+) | balanced mids - only 2.2% away from median
(+) | mids are linear (3.2% delta to prev. frequency)
Highs 2 - 16 kHz
(+) | balanced highs - only 3.7% away from median
(+) | highs are linear (4.6% delta to prev. frequency)
Overall 100 - 16.000 Hz
(+) | overall sound is linear (12.9% difference to median)
Compared to same class
» 17% of all tested devices in this class were better, 6% similar, 77% worse
» The best had a delta of 7%, average was 18%, worst was 35%
Compared to all devices tested
» 10% of all tested devices were better, 3% similar, 87% worse
» The best had a delta of 4%, average was 25%, worst was 134%

Apple MacBook Pro 16 2021 M1 Pro audio analysis

(+) | speakers can play relatively loud (84.7 dB)
Bass 100 - 315 Hz
(+) | good bass - only 3.8% away from median
(+) | bass is linear (5.2% delta to prev. frequency)
Mids 400 - 2000 Hz
(+) | balanced mids - only 1.3% away from median
(+) | mids are linear (2.1% delta to prev. frequency)
Highs 2 - 16 kHz
(+) | balanced highs - only 1.9% away from median
(+) | highs are linear (2.7% delta to prev. frequency)
Overall 100 - 16.000 Hz
(+) | overall sound is linear (4.6% difference to median)
Compared to same class
» 0% of all tested devices in this class were better, 0% similar, 100% worse
» The best had a delta of 5%, average was 18%, worst was 45%
Compared to all devices tested
» 0% of all tested devices were better, 0% similar, 100% worse
» The best had a delta of 4%, average was 25%, worst was 134%

Zarządzanie energią

Zużycie energii

System jest bardziej wydajny na biegu jałowym w porównaniu do naszego ZBook Fury 16 G10 g10. W przeciwnym razie zużycie energii staje się prawie takie samo podczas uruchamiania bardziej wymagających obciążeń, takich jak gry, mimo że skonfigurowane układy GPU różnią się między naszymi dwoma przykładami. Wydajność w przeliczeniu na wat wzrasta zatem przy wyborze konfiguracji GPU z wyższej półki w porównaniu do naszej średniej klasy RTX 3500 Ada.

Zużycie energii podczas uruchamiania Prime95 lub CineBench R15 xT byłoby zauważalnie wyższe na naszej jednostce w porównaniu do zeszłorocznego modelu ze względu na wyższy potencjał Turbo Boost naszego procesora Core i9-14900HX. Po około minucie zużycie energii spadło jednak do poziomu zbliżonego do tego, który zmierzyliśmy na zeszłorocznym modelu, jak pokazuje poniższy wykres porównawczy, który pokrywa się z naszymi obserwacjami pętli CineBench R15 xT z góry. Tak więc, wyższy początkowy potencjał Turbo Boost jest kluczową przewagą pomiędzy nowszymi modelami Core i9-14900HX a starszym Core i9-13950HX.

Udało nam się zarejestrować maksymalne zużycie energii na poziomie 236 W z dużego (~18 x 8,8 x 2,5 cm) zasilacza 230 W, gdy CPU i GPU są wykorzystywane w 100 procentach.

zużycie 3DMark 06
zużycie 3DMark 06
Cyberpunk 2077 1080p Ultra zużycie
Zużycie energii wzrosło do 196 W podczas inicjowania stresu Prime95, a następnie spadło do zaledwie 111 W około minutę później z powodu słabego Turbo Boost
Prime95+FurMark stres zainicjowany w 10s mark
Pobór mocy
wyłączony / stan wstrzymaniadarklight 0.05 / 0.07 W
luzdarkmidlight 8.6 / 14.8 / 15.7 W
obciążenie midlight 129.4 / 236.1 W
 color bar
Legenda: min: dark, med: mid, max: light        Metrahit Energy
HP ZBook Fury 16 G11
i9-14900HX, NVIDIA RTX 3500 Ada Generation Laptop GPU, SK hynix PC801 HFS001TEJ9X101N, IPS, 3840x2400, 16"
HP ZBook Fury 16 G10
i9-13950HX, NVIDIA RTX 5000 Ada Generation Laptop GPU, SK hynix PC801 HFS001TEJ9X101N, IPS, 3840x2400, 16"
HP ZBook Fury 16 G9
i9-12950HX, RTX A5500 Laptop GPU, Micron 3400 1TB MTFDKBA1T0TFH, IPS, 3840x2400, 16"
Dell Precision 5690
Ultra 9 185H, NVIDIA RTX 5000 Ada Generation Laptop GPU, 2x Samsung PM9A1 1TB (RAID 0), OLED, 3840x2400, 16"
Lenovo ThinkPad P16 G2 21FA000FGE
i7-13700HX, NVIDIA RTX 2000 Ada Generation Laptop GPU, SK hynix PC801 HFS001TEJ9X162N, IPS LED, 2560x1600, 16"
Lenovo ThinkPad P1 G6 21FV001KUS
i7-13800H, NVIDIA GeForce RTX 4080 Laptop GPU, Kioxia XG8 KXG8AZNV1T02, OLED, 3480x2400, 16"
Asus ProArt Studiobook 16 OLED H7604
i9-13980HX, NVIDIA GeForce RTX 4070 Laptop GPU, Phison EM2804TBMTCB47, OLED, 3200x2000, 16"
Power Consumption
-34%
-77%
-1%
4%
7%
-24%
Idle Minimum *
8.6
15.3
-78%
19.5
-127%
7.9
8%
9.3
-8%
8
7%
12.8
-49%
Idle Average *
14.8
18.2
-23%
29
-96%
12
19%
14.1
5%
9.5
36%
19.9
-34%
Idle Maximum *
15.7
28
-78%
40.7
-159%
28.6
-82%
15.5
1%
23.7
-51%
20.3
-29%
Load Average *
129.4
137.9
-7%
142.1
-10%
98.8
24%
133.6
-3%
97.2
25%
131.4
-2%
Cyberpunk 2077 ultra external monitor *
192.6
Cyberpunk 2077 ultra *
199.4
Load Maximum *
236.1
202
14%
224.4
5%
174.8
26%
179.6
24%
197.2
16%
246.8
-5%
Witcher 3 ultra *
189.4
188.6
144.5
144.9
144
196.5

* ... im mniej tym lepiej

Power Consumption Cyberpunk / Stress Test

0153045607590105120135150165180195210225Tooltip
HP ZBook Fury 16 G11 i9-14900HX, NVIDIA RTX 3500 Ada Generation Laptop GPU; 1280x720 Prime95 28.10 and Furmark 1.25: Ø177.3 (156.9-236)
HP ZBook Fury 16 G10 i9-13950HX, NVIDIA RTX 5000 Ada Generation Laptop GPU; 1280x720 Prime95 28.10 and Furmark 1.25: Ø171 (143.8-202)
HP ZBook Fury 16 G11 i9-14900HX, NVIDIA RTX 3500 Ada Generation Laptop GPU; Idle 150cd/m2: Ø9.03 (5.95-16.7)
HP ZBook Fury 16 G10 i9-13950HX, NVIDIA RTX 5000 Ada Generation Laptop GPU; Idle 150cd/m2: Ø15 (9.7-24.9)
HP ZBook Fury 16 G11 i9-14900HX, NVIDIA RTX 3500 Ada Generation Laptop GPU; Cyberpunk 2077 FHD ultra no FSR 150cd: Ø199.4 (186.2-223)

Power Consumption external Monitor

0153045607590105120135150165180195210Tooltip
HP ZBook Fury 16 G11 i9-14900HX, NVIDIA RTX 3500 Ada Generation Laptop GPU; Prime95 V2810 Stress (external Monitor): Ø132.3 (110.2-196.2)
HP ZBook Fury 16 G10 i9-13950HX, NVIDIA RTX 5000 Ada Generation Laptop GPU; Prime95 V2810 Stress (external Monitor): Ø139.2 (116.3-160.2)
HP ZBook Fury 16 G11 i9-14900HX, NVIDIA RTX 3500 Ada Generation Laptop GPU; Cinebench R15 Multi (external Monitor): Ø209 (207-221)
HP ZBook Fury 16 G10 i9-13950HX, NVIDIA RTX 5000 Ada Generation Laptop GPU; Cinebench R15 Multi (external Monitor): Ø145 (143-148.3)
HP ZBook Fury 16 G11 i9-14900HX, NVIDIA RTX 3500 Ada Generation Laptop GPU; 1280x720 FurMark 1.19 GPU Stress Test (external Monitor): Ø175.5 (160.4-203)
HP ZBook Fury 16 G10 i9-13950HX, NVIDIA RTX 5000 Ada Generation Laptop GPU; 1280x720 FurMark 1.19 GPU Stress Test (external Monitor): Ø176.1 (167.5-184.7)
HP ZBook Fury 16 G11 i9-14900HX, NVIDIA RTX 3500 Ada Generation Laptop GPU; Idle 1min (external Monitor): Ø8.59 (4.29-17.9)
HP ZBook Fury 16 G10 i9-13950HX, NVIDIA RTX 5000 Ada Generation Laptop GPU; Idle 1min (external Monitor): Ø15.1 (9.53-21.5)
HP ZBook Fury 16 G11 i9-14900HX, NVIDIA RTX 3500 Ada Generation Laptop GPU; Cyberpunk 2077 FHD ultra no FSR (external Monitor): Ø192.6 (181.9-209)

Żywotność baterii

Czasy pracy są bardzo podobne do zeszłorocznego ZBook Fury 16 G11, jeśli nie nieco krótsze, prawdopodobnie ze względu na wyższy pułap Turbo Boost dla procesora Raptor Lake-HX Refresh. Konkurencyjne modele, takie jak Precision 5690 lub ThinkPad P16 G2, mogą wytrzymać co najmniej godzinę dłużej.

Ładowanie od stanu pustego do pełnej pojemności za pomocą dołączonego zasilacza sieciowego jest stosunkowo szybkie i trwa nieco ponad 60 minut.

Wydajność akumulatora
WiFi Websurfing
6h 42min
HP ZBook Fury 16 G11
i9-14900HX, NVIDIA RTX 3500 Ada Generation Laptop GPU, 95 Wh
HP ZBook Fury 16 G10
i9-13950HX, NVIDIA RTX 5000 Ada Generation Laptop GPU, 95 Wh
HP ZBook Fury 16 G9
i9-12950HX, RTX A5500 Laptop GPU, 95 Wh
Dell Precision 5690
Ultra 9 185H, NVIDIA RTX 5000 Ada Generation Laptop GPU, 98 Wh
Lenovo ThinkPad P16 G2 21FA000FGE
i7-13700HX, NVIDIA RTX 2000 Ada Generation Laptop GPU, 94 Wh
Lenovo ThinkPad P1 G6 21FV001KUS
i7-13800H, NVIDIA GeForce RTX 4080 Laptop GPU, 90 Wh
Asus ProArt Studiobook 16 OLED H7604
i9-13980HX, NVIDIA GeForce RTX 4070 Laptop GPU, 90 Wh
Czasy pracy
8%
-10%
37%
28%
-37%
-17%
WiFi v1.3
402
435
8%
360
-10%
549
37%
515
28%
252
-37%
334
-17%
Reader / Idle
319
Load
71
65
H.264
358

Za

+ obsługa do czterech dysków SSD i czterech modułów SODIMM
+ łatwa i w większości beznarzędziowa obsługa serwisowa
+ bardzo jasny wyświetlacz o jasności 1000 nitów
+ wygodna klawiatura i touchpad
+ Obsługa pamięci ECC RAM i VRAM

Przeciw

- słaba stabilność Turbo Boost CPU
- zauważalne wycie cewki w naszej jednostce
- Wydajność dysku SSD może być ograniczona
- brak opcji Meteor Lake
- wentylatory mają tendencję do pulsowania

Werdykt - Mocna konstrukcja osłabiona przez ograniczone Turbo Boost

W recenzji: HP ZBook Fury 16 G11

Bardzo podoba nam się design ZBook Fury 16 G11. Choć pozostaje on taki sam jak w przypadku Fury 16 G9, to łatwość serwisowania, szerokie możliwości konfiguracji, obsługa pamięci RAM ECC oraz wygodna klawiatura i touchpad spełniają wszystkie wymagania użytkowników stacji roboczych.

Zamiast tego, główne problemy z ZBook Fury 16 G11 leżą w jego wydajności. Kiedy inny laptop, taki jak Lenovo Legion 9 16IRX9 może uruchomić dokładnie ten sam procesor Core i9-14900HX do 20 procent szybciej niż nasz ZBook, to rozwiązanie chłodzące w HP zdecydowanie przydałoby się ulepszyć, aby dłużej wspierać wyższe prędkości Turbo Boost. Podobnie, dyski SSD M.2 mogłyby skorzystać z rozpraszaczy ciepła z tego samego powodu, ponieważ również dławiłyby się pod obciążeniem. Ograniczenia te niwelują zalety procesora Core i9 i dysku SSD PCIe4, ponieważ mogą one potencjalnie działać szybciej na konkurencyjnych maszynach Dell lub Lenovo.
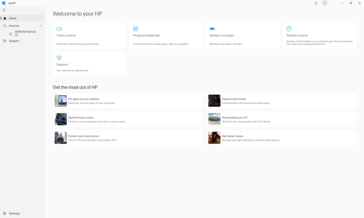
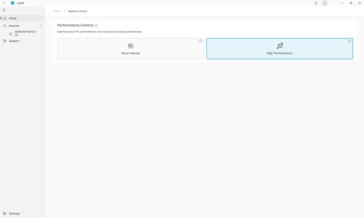
ZBook Fury 16 G11 to tylko niewielka aktualizacja w stosunku do zeszłorocznego ZBook Fury G10. Chociaż nadal wygląda i czuje się świetnie, wydajność ma tendencję do dławienia w przypadku cięższych scenariuszy użytkowania.

Wreszcie, trochę niefortunne jest to, że model ten nie oferuje opcji Meteor Lake bez lokalnej akceleracji AI. To prawda, że taka funkcja prawdopodobnie spodoba się tylko niewielkiej grupie użytkowników stacji roboczych, ale pomogłaby jeszcze bardziej odróżnić Fury 16 G11 od Fury 16 G10. Zasadniczo taką samą wydajność i funkcje można uzyskać z zaledwie rocznego modelu Fury 16 G10 co na najnowszym Fury 16 G11.

Cena i dostępność

ZBook Fury 16 G11 jest obecnie dostępny w sprzedaży w cenie od około 3400 USD w konfiguracji z procesorem Core i9-14900HX i kartą graficzną RTX 3500 Ada do ponad 5500 USD w przypadku pełnej konfiguracji z kartą graficzną RTX 5000 Ada.

Wskazówka: Nasz system ocen został niedawno zaktualizowany, a wyniki wersji 8 nie są porównywalne z wynikami wersji 7. Dodatkowe informacje znajdą Państwo hier verfügbar.

Uwaga: Niedawno zaktualizowaliśmy nasz system oceniania i wyniki wersji 8 nie są porównywalne z wynikami wersji 7. Więcej informacji znajdą Państwo tutaj .

HP ZBook Fury 16 G11 - 12/08/2024 v8
Allen Ngo

Wykonanie
84 / 98 → 85%
Klawiatura
90%
Myszka
94%
Komunikacja
65 / 80 → 81%
Waga
59 / 10-66 → 88%
Akumulator
73 / 95 → 76%
Wyświetlacz
84%
Wydajność w grach
84%
Wydajność w programach użytkowych
86%
Workstation
88%
Temperatura
85 / 95 → 90%
Hałas
77 / 90 → 85%
Głośniki
84%
Kamerka
45 / 75 → 59%
Średnio
70%
86%
Workstation - Ważona średnia
CO2 Emissions
No Data
Materials
50%
Packaging
100%
Power Use
90.9%
Repairability
50%
Software Updates
22.3%
Recycle Logo Total Sustainability Score: 52.2%

Transparency

The selection of devices to be reviewed is made by our editorial team. The test sample was provided to the author as a loan by the manufacturer or retailer for the purpose of this review. The lender had no influence on this review, nor did the manufacturer receive a copy of this review before publication. There was no obligation to publish this review. We never accept compensation or payment in return for our reviews. As an independent media company, Notebookcheck is not subjected to the authority of manufacturers, retailers or publishers.

This is how Notebookcheck is testing

Every year, Notebookcheck independently reviews hundreds of laptops and smartphones using standardized procedures to ensure that all results are comparable. We have continuously developed our test methods for around 20 years and set industry standards in the process. In our test labs, high-quality measuring equipment is utilized by experienced technicians and editors. These tests involve a multi-stage validation process. Our complex rating system is based on hundreds of well-founded measurements and benchmarks, which maintains objectivity. Further information on our test methods can be found here.

Price comparison

Please share our article, every link counts!
Mail Logo
> laptopy testy i recenzje notebooki > Laptopy > Debiut wydajności Nvidia RTX 3500 Ada: Recenzja stacji roboczej HP ZBook Fury 16 G11
Allen Ngo, 2024-08-13 (Update: 2024-08-13)