Notebookcheck Logo

Recenzja HP Envy x360 2-w-1 16: Ryzen 7 8840HS pokonuje Core Ultra 7 155U
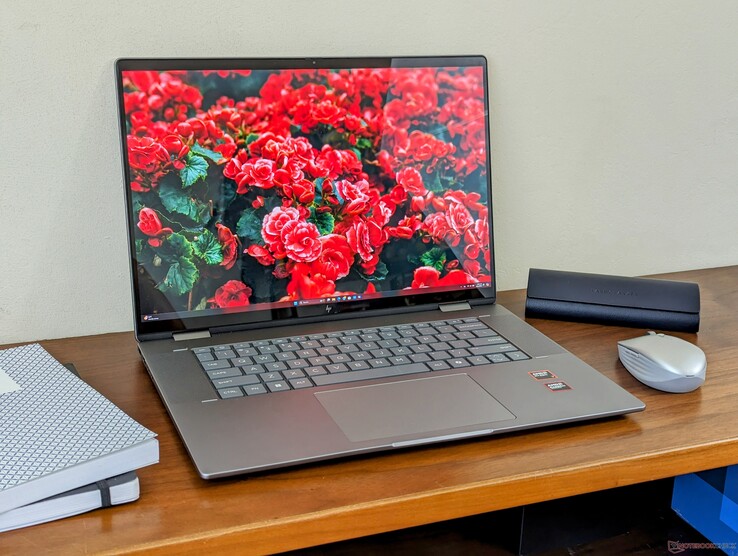
OLED z funkcją przyciemniania DC.

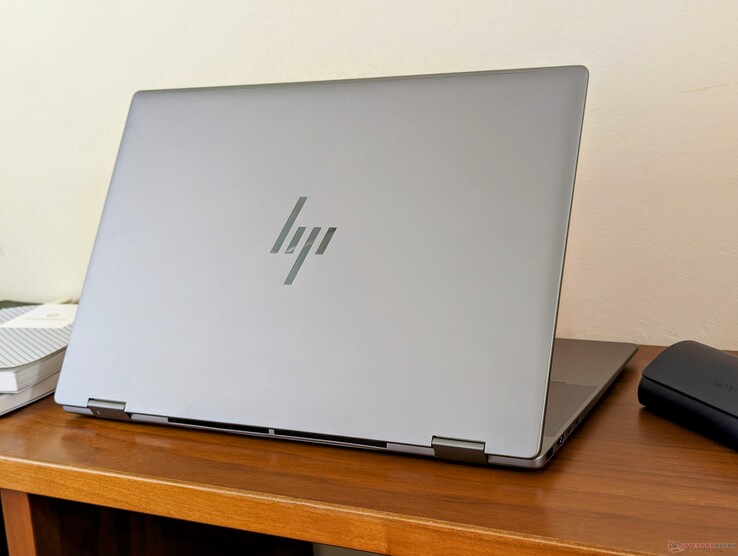
Najnowszy 16-calowy Envy został wyposażony w obudowę x360, dzięki czemu jest skutecznym rozwiązaniem średniej klasy pomiędzy Pavilion x360 15 i Spectre x360 16. Dostępny jest zarówno w wariantach Intel, jak i AMD, aby zadowolić użytkowników po obu stronach stawu.
Zen 4 Convertible / 2-in-1 Laptop / Notebook AMD
2024 HP Envy x360 16-ad0097nr

Seria Envy to rodzina komputerów HP ze średniej półki, plasująca się pomiędzy tańszą serią Pavilion a droższą flagową serią Spectre. W tym przypadku nowy Envy x360 16 może być postrzegany jako przystępna cenowo wersja Spectre x360 16 ale z mocniejszymi opcjami i bardziej luksusowymi funkcjami niż Pavilion x360 15.

Nasz testowany egzemplarz wyposażony jest w procesor AMD Ryzen 7 8840HS, zintegrowaną grafikę Radeon 780M i ekran dotykowy OLED 120 Hz 1800p w cenie detalicznej około 1300 USD. Wersje Intela są również dostępne z 14. generacją Core Ultra 5 125U lub Ultra 7 155U i ekranem dotykowym IPS 1200p, ale wszystkie konfiguracje są wyposażone tylko w zintegrowaną grafikę. Najnowszy Envy x360 16 skutecznie zastępuje zeszłoroczny model Envy x360 15.

Konkurenci obejmują inne 16-calowe laptopy multimedialne, takie jak Lenovo Yoga 7 2-w-1 16IML9, Samsung Galaxy Book4 Pro 360lub LG Gram 2-w-1 16.

Więcej recenzji HP:

HP Envy x360 2-in-1 16-ad0097nr (Envy 16 Rodzina)
Procesor
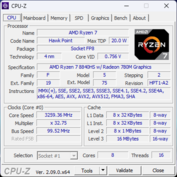
AMD Ryzen 7 8840HS 8 x 3.3 - 5.1 GHz, 40 W PL2 / Short Burst, 26 W PL1 / Sustained, Hawk Point-HS (Zen 4)
Karta grafiki
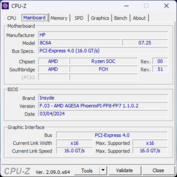
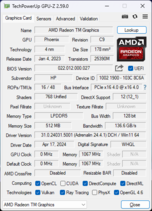
AMD Radeon 780M, rdzeń: 2180 MHz, LPDDR5, 31.0.24031.5001
Pamięć
16 GB 
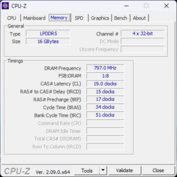
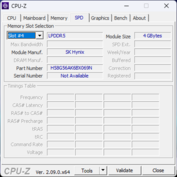
, LPDDR5-6400, Soldered, Dual-Channel
Matryca
16.00 cali 16:10, 2880 x 1800 pikseli 212 PPI, 10-point capacitive, native pen support, Samsung SDC41A6, OLED, refleksująca: tak, HDR, 120 Hz
Chipset
AMD Promontory/Bixby FCH
Dysk twardy
KIOXIA BG5 KBG50ZNV1T02, 1024 GB 
Karta dźwiękowa
AMD Zen - Audio Processor - HD Audio Controller
Złącza
4 USB 3.1 Gen2, USB-C Power Delivery (PD), 1 HDMI, 2 DisplayPort, gniazda audio: 3.5 mm combo, czujniki: Acclerometer
Łączność
MediaTek Wi-Fi 6E MT7922 160MHz Wireless LAN Card (a/b/g/n = Wi-Fi 4/ac = Wi-Fi 5/ax = Wi-Fi 6/ Wi-Fi 6E 6 GHz), Bluetooth 5.3
Gabaryty
wysokość x szerokość x głębokość (mm): 18.3 x 357 x 246
Akumulator
68 Wh litowo-polimerowy, 4-cell
System operacyjny
Microsoft Windows 11 Home
Camera
kamerka: 1440p30
Primary Camera: 5 MPix
Inne
głośniki: Stereo Poly Studio, klawiatura: Chiclet, podświetlanie klawiatury: tak, MyHP, Support Assistant, Smart, 12 miesiące(y) gwarancji
Waga
1.769 kg, zasilacz: 308 g
Cena
1300 USD
Note: The manufacturer may use components from different suppliers including display panels, drives or memory sticks with similar specifications.


Potencjalni konkurenci w porównaniu

Rating
Date
Model
Weight
Height
Size
Resolution
Price
87.2 %
v7 (old)
05/2024
HP Envy x360 2-in-1 16-ad0097nr
R7 8840HS, Radeon 780M
1.8 kg18.3 mm16.00"2880x1800
86.9 %
v7 (old)
09/2022
HP Envy 16 h0112nr
i7-12700H, GeForce RTX 3060 Laptop GPU
2.3 kg19.8 mm16.00"3840x2400
91.1 %
v7 (old)
03/2024
HP Spectre x360 16 RTX 4050
Ultra 7 155H, NVIDIA GeForce RTX 4050 Laptop GPU
2 kg19.8 mm16.00"2880x1800
86.7 %
v7 (old)
04/2024
Lenovo Yoga 7 2-in-1 16IML9
Ultra 5 125U, Graphics 4-Core
2.1 kg16.99 mm16.00"1920x1200
87.8 %
v7 (old)
03/2024
Samsung Galaxy Book4 Pro 360
Ultra 5 125H, Arc 7-Core
1.7 kg13 mm16.00"2880x1800
85.8 %
v7 (old)
11/2023
LG Gram 2in1 16 16T90R - G.AA78G
i7-1360P, Iris Xe G7 96EUs
1.5 kg17.2 mm16.00"2560x1600

Obudowa - gładka srebrna

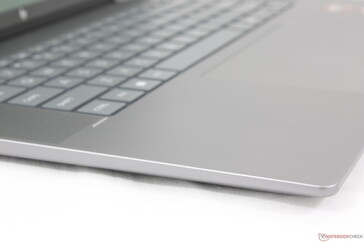
Szkielet składa się z podobnych materiałów aluminiowych i plastikowych klawiszy jak w modelu Envy x360 15 dla podobnego wyglądu i odczuć. Powierzchnie są sztywne i wysokiej jakości, nawet jeśli nie wyglądają tak luksusowo jak w Spectre. Obudowa ugina się nieco bardziej niż w Spectre podczas wywierania nacisku na środek klawiatury lub podczas próby przekręcenia podstawy, ale nie jest to zauważalnie gorsze lub lepsze niż w przypadku Yoga 7 2-in-1 16IML9.

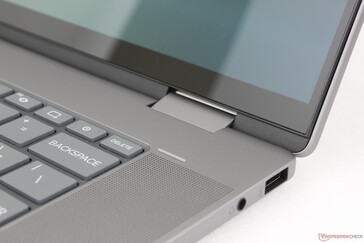
Zauważalną różnicą między Envy x360 16 a jego mniejszym rodzeństwem jest klawiatura, która teraz znajduje się niżej niż otaczające ją maskownice głośników i podpórki pod nadgarstki, podczas gdy klawiatura w Envy x360 15 lub Spectre x360 16 znajduje się wyżej. Nowa estetyka sprawia, że Envy x360 16 na pierwszy rzut oka wygląda bardziej jak MacBook Pro.

Nowy model jest zarówno grubszy, jak i większy niż ustępujący Envy x360 15, a jego waga pozostaje mniej więcej taka sama. Być może najbardziej godne uwagi jest to, że Envy x360 16 jest niemal identyczny z droższym Specture x360 16 we wszystkich trzech wymiarach, co oznacza, że nie jest mniej przyjazny w podróży pomimo różnic w cenie.

Co dziwne, dla nowego konwertowalnego Envy dostępna jest tylko jedna opcja kolorystyczna, niezależnie od konfiguracji. Dla porównania, mniejsze modele Envy x360 mają alternatywny aluminiowy kolor Nightfall Black, który towarzyszy zwykłemu srebrnemu kolorowi. Wielokolorowe opcje pomogłyby wizualnie rozróżnić SKU Intela i AMD serii Envy x360 16.

Część podwozia składa się z metalu i tworzyw sztucznych pochodzących z recyklingu
Brak innych opcji kolorystycznych z wyjątkiem srebrnego aluminium Meteor dla jednostek SKU Intel i AMD
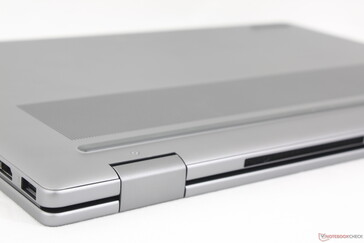
Sztywność zawiasów jest przyzwoita do pełnych 360 stopni, z jedynie niewielkim kołysaniem podczas regulacji kątów
Brak opcji przycisku zasilania z obsługą odcisków palców
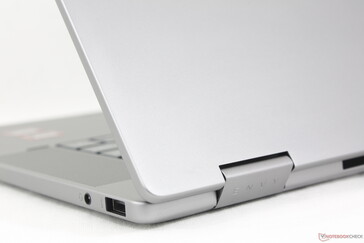
Gładka i jednolita tekstura metalu. Ciemnoszary kolor lepiej ukrywa odciski palców niż ciemniejsze modele Spectre
Zaokrąglone krawędzie i narożniki bez ostrych cięć zapewniają płynniejsze przejście między różnymi stronami obudowy

Porównanie rozmiarów

362.2 mm 250.1 mm 16.99 mm 2.1 kg358 mm 252 mm 19.8 mm 2.3 kg356.8 mm 245.5 mm 19.8 mm 2 kg357 mm 246 mm 18.3 mm 1.8 kg355 mm 248 mm 17.2 mm 1.5 kg355 mm 252 mm 13 mm 1.7 kg297 mm 210 mm 1 mm 5.7 g

Łączność - brak Thunderbolt lub USB4 dla AMD

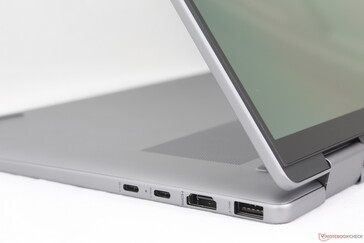
Wszystkie porty powróciły z Envy x360 15 2023 minus czytnik kart SD. W przypadku tak dużego laptopa multimedialnego brak zintegrowanego czytnika kart jest rozczarowujący dla fotografów, którzy polegają na nim przy przenoszeniu multimediów.

USB4 i Thunderbolt nie są niestety obsługiwane w nowym Envy, ponieważ dwa porty USB-C mają tylko 10 Gb / s. Zamiast tego użytkownicy będą musieli rozważyć wersję Envy x360 16 z procesorem Intela lub uaktualnić do serii Spectre x360 16, aby uzyskać kompatybilność z Thunderbolt.

Przód: Brak portów
Przód: Brak portów
Po prawej: zestaw słuchawkowy 3,5 mm, USB-A (10 Gb/s)
Tył: Brak portów
Tył: Brak portów
Po lewej: USB-A (10 Gb/s), HDMI 2.1, 2x USB-C (10 Gb/s z DisplayPort 1.4a + Power Delivery)

Komunikacja

Układ MediaTek MT7922 jest standardowo wyposażony w łączność Wi-Fi 6E i Bluetooth 5.3. Podczas naszych testów Wi-Fi 6 i Wi-Fi 6E doświadczyliśmy doskonałych prędkości transferu i braku problemów z łącznością.

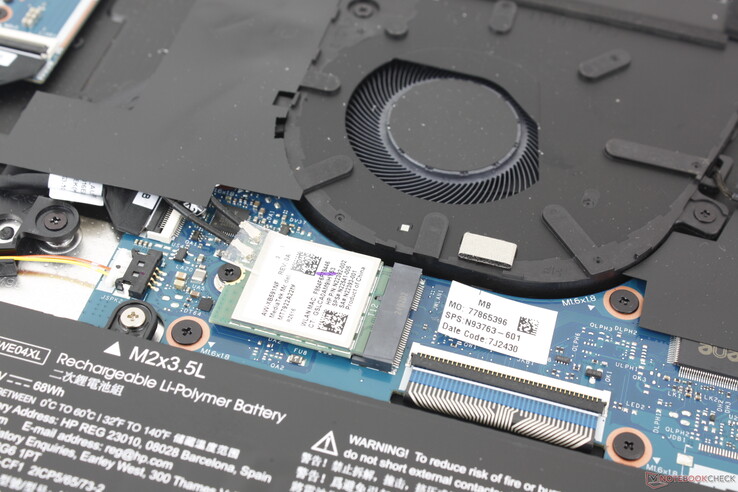
Wyjmowany moduł WLAN
Networking
iperf3 transmit AXE11000
Samsung Galaxy Book4 Pro 360
Intel Wi-Fi 6E AX211
1623 (1402min, 1436.8P1 - 1747max) MBit/s +1%
HP Envy x360 2-in-1 16-ad0097nr
MediaTek Wi-Fi 6E MT7922 160MHz Wireless LAN Card
1608 (1424min - 1752max) MBit/s
HP Spectre x360 16 RTX 4050
Intel Wi-Fi 6E AX211
1172 (756min - 1362max) MBit/s -27%
LG Gram 2in1 16 16T90R - G.AA78G
Intel Wi-Fi 6E AX211
947 (905min - 990max) MBit/s -41%
Lenovo Yoga 7 2-in-1 16IML9
Intel Wi-Fi 6E AX211
709 (595min - 781max) MBit/s -56%
iperf3 receive AXE11000
Samsung Galaxy Book4 Pro 360
Intel Wi-Fi 6E AX211
1664 (1553min, 1558.51P1 - 1710max) MBit/s +7%
HP Envy x360 2-in-1 16-ad0097nr
MediaTek Wi-Fi 6E MT7922 160MHz Wireless LAN Card
1551 (1450min - 1626max) MBit/s
HP Spectre x360 16 RTX 4050
Intel Wi-Fi 6E AX211
1429 (1235min - 1517max) MBit/s -8%
LG Gram 2in1 16 16T90R - G.AA78G
Intel Wi-Fi 6E AX211
907 (767min - 946max) MBit/s -42%
Lenovo Yoga 7 2-in-1 16IML9
Intel Wi-Fi 6E AX211
814 (710min - 867max) MBit/s -48%
iperf3 transmit AXE11000 6GHz
HP Envy x360 2-in-1 16-ad0097nr
MediaTek Wi-Fi 6E MT7922 160MHz Wireless LAN Card
1626 (1381min - 1818max) MBit/s
LG Gram 2in1 16 16T90R - G.AA78G
Intel Wi-Fi 6E AX211
1625 (1580min - 1676max) MBit/s 0%
HP Envy 16 h0112nr
Intel Wi-Fi 6E AX211
1351 (1012min - 1487max) MBit/s -17%
HP Spectre x360 16 RTX 4050
Intel Wi-Fi 6E AX211
1227 (1085min - 1274max) MBit/s -25%
Lenovo Yoga 7 2-in-1 16IML9
Intel Wi-Fi 6E AX211
1052 (678min - 1199max) MBit/s -35%
iperf3 receive AXE11000 6GHz
HP Envy x360 2-in-1 16-ad0097nr
MediaTek Wi-Fi 6E MT7922 160MHz Wireless LAN Card
1639 (1591min - 1742max) MBit/s
LG Gram 2in1 16 16T90R - G.AA78G
Intel Wi-Fi 6E AX211
1472 (1012min - 1576max) MBit/s -10%
HP Spectre x360 16 RTX 4050
Intel Wi-Fi 6E AX211
1320 (1256min - 1381max) MBit/s -19%
Lenovo Yoga 7 2-in-1 16IML9
Intel Wi-Fi 6E AX211
1300 (1261min - 1348max) MBit/s -21%
HP Envy 16 h0112nr
Intel Wi-Fi 6E AX211
1264 (1021min - 1320max) MBit/s -23%
05010015020025030035040045050055060065070075080085090095010001050110011501200125013001350140014501500155016001650170017501800Tooltip
HP Envy x360 2-in-1 16-ad0097nr; iperf3 transmit AXE11000 6GHz; iperf 3.1.3: Ø1626 (1381-1818)
HP Envy x360 2-in-1 16-ad0097nr; iperf3 receive AXE11000 6GHz; iperf 3.1.3: Ø1639 (1591-1742)

Kamera internetowa

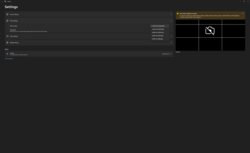
Wybór jakości kamery tylko do 3,7 MP

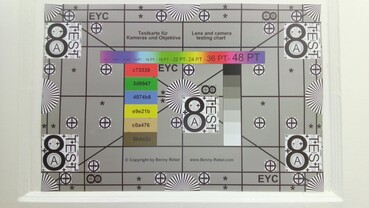
Podczas gdy HP reklamuje kamerę internetową 5 MP, aplikacja aparatu Windows pozwala tylko na 3,7 MP, jak pokazano na zrzucie ekranu po prawej stronie. Skontaktowaliśmy się z HP, aby sprawdzić, czy działa to zgodnie z przeznaczeniem, czy też może to być błąd.

Zarówno podczerwień, jak i fizyczna migawka prywatności są standardem.
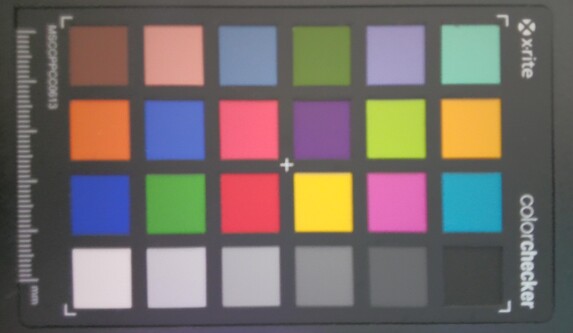
ColorChecker
5 ∆E
7.3 ∆E
8 ∆E
14.3 ∆E
9.8 ∆E
6.3 ∆E
8.1 ∆E
8.2 ∆E
12.1 ∆E
12.3 ∆E
7.5 ∆E
5.1 ∆E
6.6 ∆E
8.7 ∆E
15.5 ∆E
5.3 ∆E
11.2 ∆E
10.4 ∆E
8.7 ∆E
6.2 ∆E
7.9 ∆E
9.9 ∆E
9.1 ∆E
6.1 ∆E
ColorChecker HP Envy x360 2-in-1 16-ad0097nr: 8.73 ∆E min: 5.01 - max: 15.45 ∆E

Konserwacja

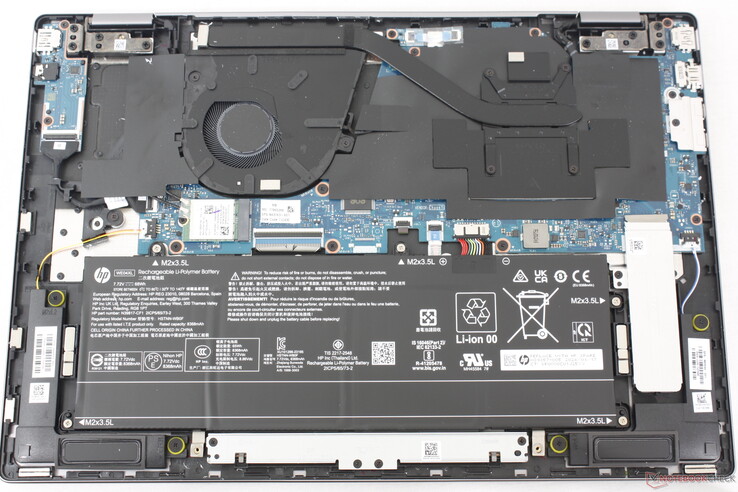
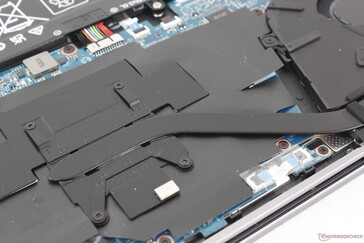
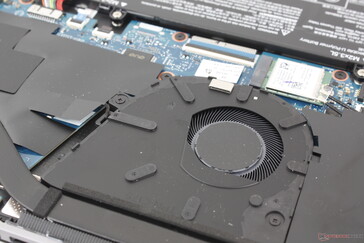
Dolny panel jest zabezpieczony tylko czterema śrubami Torx. Jego demontaż to jednak zupełnie inna historia, ponieważ krawędzie są ostre i niezwykle ciasne, co utrudnia serwisowanie. Doświadczyliśmy dokładnie tego samego problemu w Envy x360 15, co sugeruje, że HP nie zadało sobie trudu, aby poprawić ten aspekt w Envy x360 16. Wewnątrz nie ma zbyt wiele do ulepszenia, ponieważ pamięć RAM jest wlutowana.

Envy x360 2-w-1 16
Envy x360 2-w-1 16
2022 Envy 16 dla porównania

Akcesoria i gwarancja

Aktywny rysik jest opcjonalny. Standardowa roczna ograniczona gwarancja producenta ma zastosowanie w przypadku zakupu w USA.

Urządzenia wejściowe - przestronne i wygodne

Klawiatura

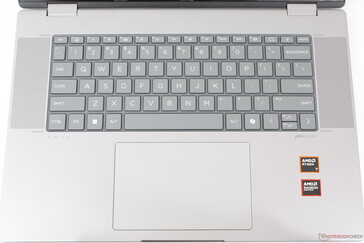
Układ klawiszy zmienił się w stosunku do Envy x360 15. Dedykowana kolumna klawiszy wzdłuż prawej krawędzi (PgDn, PgUp, End itp.) została usunięta, a jej funkcje zostały połączone z resztą klawiatury. Ta zmiana sprawia, że układ jest bardziej wizualnie podobny do Spectre x360 16, choć bez czytnika linii papilarnych.

Poza tym wrażenia z pisania są doskonałe i porównywalne do Spectre z wyraźniejszym sprzężeniem zwrotnym niż na konkurencyjnych VivoBook lub IdeaPad modele. W szczególności warto wspomnieć o GIF i konfigurowalnych klawiszach, ponieważ większość innych laptopów multimedialnych nie zawiera takich funkcji.

Panel dotykowy

Clickpad jest mniejszy niż ten w Spectre x360 16 (13,5 x 8,8 cm vs. 16 x 10 cm). Mimo to nadal wydaje się przestronny i wystarczająco duży, nawet jak na 16-calową obudowę. Trakcja jest płynna, z niewielkim zacinaniem się podczas przesuwania przy wolniejszych prędkościach, podczas gdy sprzężenie zwrotne podczas klikania jest nieco miękkie i mogłoby być mocniejsze.

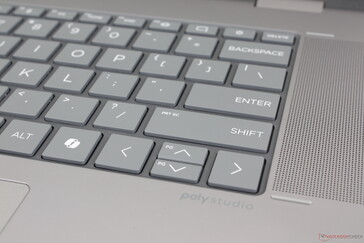
Układ klawiatury zawiera teraz zawsze ważny klawisz Co-Pilot. Dwupoziomowe białe podświetlenie jest standardem
Clickpad jest przestronny i niezawodny do przewijania. Klikanie jest jednak nieco gąbczaste
Nakładki na klawisze są teraz ciemnoszare zamiast białych, aby zapewnić lepszą widoczność, co było problemem w Envy 16 z 2022 roku
Klawisze PgUp, PgDn i Print Screen są teraz zintegrowane z klawiszami strzałek i Shift

Wyświetlacz - wysokiej klasy OLED w średniej cenie

Błyszczący OLED jest wyraźny z niewielkim efektem mory lub ziarnistości

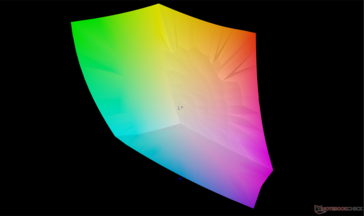
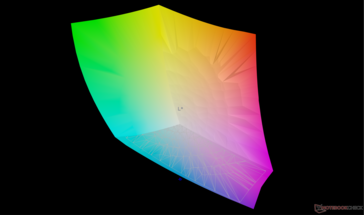
HP zastosowało ten sam panel Samsung SDC41A6 OLED zarówno w Envy x360 16, jak i Spectre x360 16, mimo że ten drugi jest znacznie droższy. Wrażenia wizualne są zatem identyczne między tymi dwoma modelami, aż do 100% kolorów DCI-P3, krótkich czasów reakcji, częstotliwości odświeżania 120 Hz, maksymalnej jasności 400 nitów, a nawet technologii przyciemniania OLED DC. Jest to wysokiej klasy wyświetlacz dla laptopa średniej klasy, który stawia Envy x360 16 o krok wyżej niż inne alternatywy w podobnej cenie.

Wyświetlacz może być tak jasny jak 616 nitów, gdy HDR jest włączony. W przeciwnym razie zawartość SDR jest ograniczona do ~ 400 nitów.

Wyświetlacz 120 Hz nie obsługuje zmiennej częstotliwości odświeżania, więc zamiast tego oferuje dwie opcje stałej częstotliwości odświeżania: 48 Hz i 120 Hz. Nie ma wyboru 60 Hz, w przeciwieństwie do większości innych paneli.

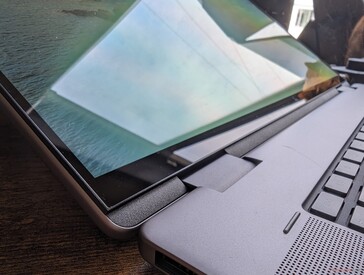
Szklany ekran dotykowy od krawędzi do krawędzi
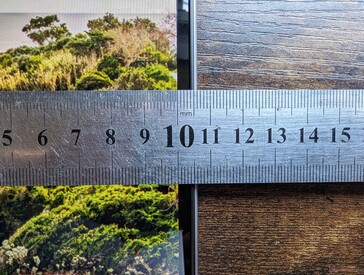
Wąskie ramki boczne z grubszymi ramkami górnymi i dolnymi
408.6
cd/m²
404
cd/m²
407.2
cd/m²
405.5
cd/m²
399.4
cd/m²
405.9
cd/m²
404.7
cd/m²
401.4
cd/m²
404.1
cd/m²
podświetlenie ekranu
Samsung SDC41A6 tested with X-Rite i1Pro 2
maksimum: 408.6 cd/m² (Nits) średnia: 404.5 cd/m² Minimum: 23.3 cd/m²
rozświetlenie: 98 %
na akumulatorze: 399.4 cd/m²
kontrast: ∞:1 (czerń: 0 cd/m²)
ΔE Color 4.05 | 0.5-29.43 Ø4.9, calibrated: 1.02
ΔE Greyscale 1.1 | 0.5-98 Ø5.2
96.5% AdobeRGB 1998 (Argyll 2.2.0 3D)
100% sRGB (Argyll 2.2.0 3D)
99.6% Display P3 (Argyll 2.2.0 3D)
Gamma: 2.27
HP Envy x360 2-in-1 16-ad0097nr
Samsung SDC41A6, OLED, 2880x1800, 16"
HP Envy 16 h0112nr
Samsung SDC4174, OLED, 3840x2400, 16"
HP Spectre x360 16 RTX 4050
Samsung SDC41A6, OLED, 2880x1800, 16"
Lenovo Yoga 7 2-in-1 16IML9
LEN160FHD, IPS, 1920x1200, 16"
Samsung Galaxy Book4 Pro 360
ATNA60CL09-0, OLED, 2880x1800, 16"
LG Gram 2in1 16 16T90R - G.AA78G
LP160WQ1-SPB2, IPS, 2560x1600, 16"
Display
-3%
0%
-51%
0%
-5%
Display P3 Coverage
99.6
99.3
0%
99.6
0%
40.9
-59%
99.9
0%
96.5
-3%
sRGB Coverage
100
100
0%
100
0%
61.4
-39%
100
0%
99.9
0%
AdobeRGB 1998 Coverage
96.5
88
-9%
96.7
0%
42.3
-56%
96.6
0%
84.6
-12%
Response Times
-105%
1%
-3131%
4%
-3502%
Response Time Grey 50% / Grey 80% *
0.8 ?(0.45, 0.35)
2 ?(1, 1)
-150%
0.78 ?(0.44, 0.34)
2%
32.1 ?(15.3, 16.8)
-3913%
0.49 ?(0.25, 0.24)
39%
38.4 ?(18.6, 19.8)
-4700%
Response Time Black / White *
0.89 ?(0.42, 0.47)
1.9 ?(0.8, 1.1)
-113%
0.86 ?(0.4, 0.46)
3%
21.8 ?(12.6, 9.2)
-2349%
0.67 ?(0.37, 0.3)
25%
21.4 ?(9.8, 11.6)
-2304%
PWM Frequency
491.8 ?(100)
240.4 ?(100)
-51%
480 ?(100)
-2%
240 ?(100)
-51%
Screen
3%
-8%
-84%
14%
-68%
Brightness middle
399.4
328.8
-18%
385.2
-4%
313.3
-22%
387
-3%
329
-18%
Brightness
405
332
-18%
387
-4%
294
-27%
392
-3%
310
-23%
Brightness Distribution
98
97
-1%
99
1%
82
-16%
98
0%
88
-10%
Black Level *
0.35
0.39
Colorchecker dE 2000 *
4.05
1.53
62%
1.73
57%
4.41
-9%
1
75%
3.52
13%
Colorchecker dE 2000 max. *
6.69
6.04
10%
3.95
41%
15.75
-135%
1.9
72%
6.96
-4%
Colorchecker dE 2000 calibrated *
1.02
1.84
-80%
1.15
-13%
Greyscale dE 2000 *
1.1
1.3
-18%
2.6
-136%
4.4
-300%
1.7
-55%
5.75
-423%
Gamma
2.27 97%
2.18 101%
2.17 101%
2.3 96%
2.25 98%
2.137 103%
CCT
6419 101%
6362 102%
6133 106%
7395 88%
6325 103%
7584 86%
Contrast
895
844
Total Average (Program / Settings)
-35% / -26%
-2% / -4%
-1089% / -584%
6% / 8%
-1192% / -625%

* ... im mniej tym lepiej

vs. sRGB
vs. sRGB
vs. P3
vs. P3

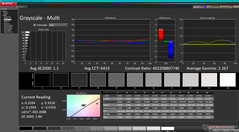
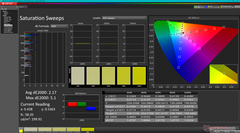
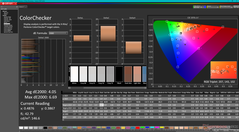
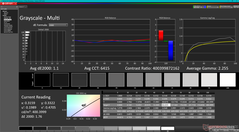
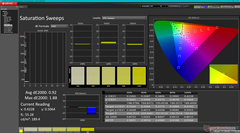
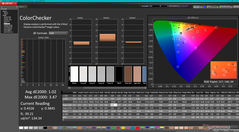
Wyświetlacz jest dobrze skalibrowany względem standardu P3, a średnie wartości deltaE dla skali szarości i kolorów wynoszą odpowiednio 1,1 i 4,05.

Skala szarości przed kalibracją (vs. P3)
Przemiatanie nasycenia przed kalibracją (vs. P3)
ColorChecker przed kalibracją (vs. P3)
Skala szarości po kalibracji
Pomiary nasycenia po kalibracji
ColorChecker po kalibracji

Display Response Times

Display response times show how fast the screen is able to change from one color to the next. Slow response times can lead to afterimages and can cause moving objects to appear blurry (ghosting). Gamers of fast-paced 3D titles should pay special attention to fast response times.
       Response Time Black to White
0.89 ms ... rise ↗ and fall ↘ combined↗ 0.42 ms rise
↘ 0.47 ms fall
The screen shows very fast response rates in our tests and should be very well suited for fast-paced gaming.
In comparison, all tested devices range from 0.1 (minimum) to 240 (maximum) ms. » 1 % of all devices are better.
This means that the measured response time is better than the average of all tested devices (20.9 ms).
       Response Time 50% Grey to 80% Grey
0.8 ms ... rise ↗ and fall ↘ combined↗ 0.45 ms rise
↘ 0.35 ms fall
The screen shows very fast response rates in our tests and should be very well suited for fast-paced gaming.
In comparison, all tested devices range from 0.165 (minimum) to 636 (maximum) ms. » 1 % of all devices are better.
This means that the measured response time is better than the average of all tested devices (32.8 ms).

Screen Flickering / PWM (Pulse-Width Modulation)

To dim the screen, some notebooks will simply cycle the backlight on and off in rapid succession - a method called Pulse Width Modulation (PWM) . This cycling frequency should ideally be undetectable to the human eye. If said frequency is too low, users with sensitive eyes may experience strain or headaches or even notice the flickering altogether.
Screen flickering / PWM detected 491.8 Hz ≤ 100 % brightness setting

The display backlight flickers at 491.8 Hz (worst case, e.g., utilizing PWM) Flickering detected at a brightness setting of 100 % and below. There should be no flickering or PWM above this brightness setting.

The frequency of 491.8 Hz is relatively high, so most users sensitive to PWM should not notice any flickering. However, there are reports that some users are still sensitive to PWM at 500 Hz and above, so be aware.

In comparison: 53 % of all tested devices do not use PWM to dim the display. If PWM was detected, an average of 8684 (minimum: 5 - maximum: 343500) Hz was measured.

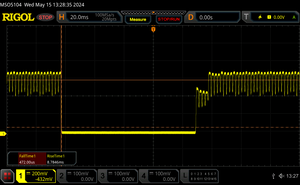
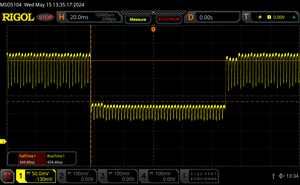
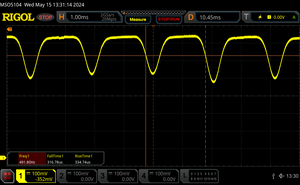
Modulacja szerokości impulsu jest obecna na wszystkich poziomach jasności, w tym na ustawieniu maksymalnym. Jej częstotliwość pozostaje na stałym poziomie 492 Hz w całym zakresie jasności, podczas gdy większość innych paneli OLED może zmieniać się między dwiema różnymi częstotliwościami w zależności od poziomu jasności. Wynika to z faktu, że HP wykorzystuje przyciemnianie DC, podczas gdy większość innych paneli OLED po prostu przełącza podświetlenie w celu kontrolowania jasności.
0 procent
0 procent
25 procent
25 procent
50 procent
50 procent
75 procent
75 procent
100 procent
100 procent

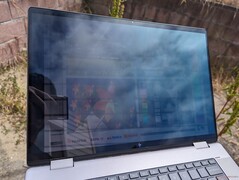
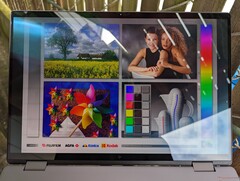
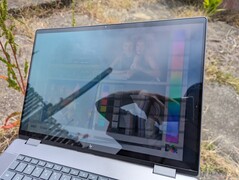
Odblaski na błyszczącym wyświetlaczu są prawie nieuniknione podczas pracy na zewnątrz. Podświetlenie nie jest wystarczająco mocne, aby pokonać oświetlenie otoczenia, ale odblaski można nadal zredukować do bardziej widocznych poziomów, jeśli znajdują się w cieniu.

Na zewnątrz w bezpośrednim świetle słonecznym
Na zewnątrz w cieniu
Na zewnątrz w bezpośrednim świetle słonecznym
Szerokie kąty widzenia OLED z charakterystycznym efektem tęczy pod ekstremalnymi kątami

Wydajność - Ryzen 7 8840HS niekoniecznie lepszy od Ryzena 7 7840HS


Warunki testowania

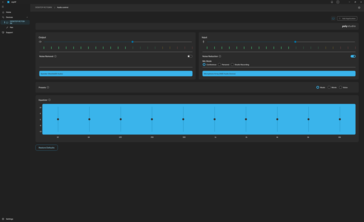
Przed uruchomieniem poniższych testów ustawiliśmy zarówno MyHP, jak i Windows w tryb wydajności. Irytujące jest to, że dostosowanie profilu zasilania w systemie Windows nie zmienia automatycznie profilu zasilania w MyHP i odwrotnie. Dla porównania, laptopy Dell umożliwiają wygodną synchronizację różnych zestawów profili zasilania.

Oprogramowanie MyHP z pewnością może wymagać trochę więcej pracy pod względem szybkości reakcji i funkcji. Sama aplikacja uruchamia się bardzo wolno, a opcje wyświetlania bledną w porównaniu z opcjami dostępnymi w modelach Asus ZenBook/VivoBook OLED, w których użytkownicy mogą dostosować temperaturę barwową, poziom niebieskiego światła, wygaszacz ekranu, zakres kolorów i inne.

Ekran główny MyHP
Ekran główny MyHP
Ekran profilu zasilania
Regulacja dźwięku
Regulacja dźwięku
Opcje wyświetlaczy HP są bardzo ograniczone

Procesor

Ryzen Ryzen 7 8840HS zastępuje zeszłoroczny model Ryzen 7 7840HS który był mobilnym procesorem klasy gamingowej, który można było znaleźć w laptopach o wysokiej wydajności, takich jak Lenovo Legion Slim 7 16. Podobnie jak w przypadku serii Intel Meteor Lake, nowy procesor AMD integruje NPU w celu przyspieszenia lokalnych aplikacji AI, które mają stać się powszechne w przyszłym roku.

Niestety, surowa wydajność wielowątkowa jest wolniejsza od starszego Ryzena 7 7840HS o około 15 do 20 procent, co nie jest bez znaczenia. Podobny deficyt zaobserwowano na najnowszym Asus Zenbook 14 który również jest dostarczany z tym samym procesorem co nasz HP. Deficyt ten można przypisać niższemu zakresowi TDP nowego procesora (od 20 do 30 W w porównaniu do 35 do 54 W) i "wciśniętemu" NPU, który zajmuje cenną przestrzeń matrycy, która w przeciwnym razie byłaby zarezerwowana dla funkcji innych niż SI. Ogólna wydajność jest zatem bliższa 12. generacji Core i7-12700H jaki można znaleźć w envy 16 clamshell 2022.

Ryzen 7 8840HS w żadnym wypadku nie jest wolny, ponieważ nadal przewyższa Intel Core Ultra 5 125U i Ultra 7 155U Envy x360 16 o 35 do 40 procent każdy. Aby jednak w pełni wykorzystać możliwości procesora AMD, warto uruchomić lokalne zadania AI, gdy staną się one bardziej dostępne.

Cinebench R15 Multi Loop

0130260390520650780910104011701300143015601690182019502080221023402470Tooltip
HP Envy x360 2-in-1 16-ad0097nr AMD Ryzen 7 8840HS: Ø1951 (1885.73-2044.68)
HP Envy 16 h0112nr Intel Core i7-12700H: Ø2325 (2293.84-2590.34)
HP Spectre x360 16 RTX 4050 Intel Core Ultra 7 155H: Ø1705 (1414.83-2302.95)
Lenovo Yoga 7 2-in-1 16IML9 Intel Core Ultra 5 125U: Ø1351 (1250.47-1657.34)
Samsung Galaxy Book4 Pro 360 Intel Core Ultra 5 125H: Ø1227 (1080.79-1700.25)
LG Gram 2in1 16 16T90R - G.AA78G Intel Core i7-1360P: Ø1547 (1472-2214.1)
CPU Performance Rating: Percent
Cinebench R23: Multi Core | Single Core
Cinebench R20: CPU (Multi Core) | CPU (Single Core)
Cinebench R15: CPU Multi 64Bit | CPU Single 64Bit
Blender: v2.79 BMW27 CPU
7-Zip 18.03: 7z b 4 | 7z b 4 -mmt1
Geekbench 6.3: Multi-Core | Single-Core
Geekbench 5.5: Multi-Core | Single-Core
HWBOT x265 Benchmark v2.2: 4k Preset
LibreOffice : 20 Documents To PDF
R Benchmark 2.5: Overall mean
CPU Performance Rating
Lenovo Yoga Pro 9 16IMH9
Intel Core Ultra 9 185H
88.6 pt
Framework Laptop 16
AMD Ryzen 9 7940HS
83.2 pt
Dell XPS 16 9640
Intel Core Ultra 7 155H
82.6 pt
Lenovo ThinkPad Z16 Gen 2
AMD Ryzen 9 PRO 7940HS
82.6 pt
Lenovo Legion Slim 7 16APH8
AMD Ryzen 7 7840HS
79.9 pt
HP Spectre x360 16 RTX 4050 -1!
Intel Core Ultra 7 155H
74.8 pt
Average AMD Ryzen 7 8840HS
 
74.5 pt
Acer Swift Go SFG16-71 -2!
Intel Core i7-13700H
74.4 pt
HP Envy 16 h0112nr -2!
Intel Core i7-12700H
72.2 pt
HP Envy x360 2-in-1 16-ad0097nr
AMD Ryzen 7 8840HS
71.6 pt
Acer Swift Edge SFE16 Ryzen 7 7840U
AMD Ryzen 7 7840U
71.6 pt
Samsung Galaxy Book4 Pro 360 -1!
Intel Core Ultra 5 125H
64 pt
LG Gram 2in1 16 16T90R - G.AA78G
Intel Core i7-1360P
63.7 pt
Lenovo Yoga Book 9 13IMU9
Intel Core Ultra 7 155U
60 pt
Lenovo Yoga 7 2-in-1 16IML9
Intel Core Ultra 5 125U
58.1 pt
Lenovo ThinkPad E16 G1 Core i5-1335U -2!
Intel Core i5-1335U
58 pt
Lenovo Thinkpad X1 Fold 16
Intel Core i7-1250U
50.7 pt
Cinebench R23 / Multi Core
Lenovo Yoga Pro 9 16IMH9
Intel Core Ultra 9 185H
19851 Points +52%
Dell XPS 16 9640
Intel Core Ultra 7 155H
18433 Points +41%
Lenovo ThinkPad Z16 Gen 2
AMD Ryzen 9 PRO 7940HS
16938 (16164.3min - 16938.4max) Points +29%
Framework Laptop 16
AMD Ryzen 9 7940HS
16519 (16352.4min - 16518.9max) Points +26%
Lenovo Legion Slim 7 16APH8
AMD Ryzen 7 7840HS
16364 Points +25%
HP Spectre x360 16 RTX 4050
Intel Core Ultra 7 155H
15154 (13865.9min - 15153.6max) Points +16%
Acer Swift Go SFG16-71
Intel Core i7-13700H
14099 Points +8%
Average AMD Ryzen 7 8840HS
  (12720 - 14621, n=5)
13674 Points +5%
HP Envy 16 h0112nr
Intel Core i7-12700H
13094 (11750.2min - 13094.1max) Points 0%
HP Envy x360 2-in-1 16-ad0097nr
AMD Ryzen 7 8840HS
13082 (12624.7min - 13082.1max) Points
Acer Swift Edge SFE16 Ryzen 7 7840U
AMD Ryzen 7 7840U
12032 (9372.55min - 12032.4max) Points -8%
LG Gram 2in1 16 16T90R - G.AA78G
Intel Core i7-1360P
11676 Points -11%
Samsung Galaxy Book4 Pro 360
Intel Core Ultra 5 125H
9965 Points -24%
Lenovo Yoga 7 2-in-1 16IML9
Intel Core Ultra 5 125U
9533 (8675.99min - 9532.96max) Points -27%
Lenovo Yoga Book 9 13IMU9
Intel Core Ultra 7 155U
9385 (8670.97min - 9384.63max) Points -28%
Lenovo ThinkPad E16 G1 Core i5-1335U
Intel Core i5-1335U
9157 (5866.85min - 9157.36max) Points -30%
Lenovo Thinkpad X1 Fold 16
Intel Core i7-1250U
7021 (5691.06min - 7020.54max) Points -46%
Cinebench R23 / Single Core
Lenovo Yoga Pro 9 16IMH9
Intel Core Ultra 9 185H
1906 Points +9%
Acer Swift Go SFG16-71
Intel Core i7-13700H
1891 Points +8%
Lenovo ThinkPad Z16 Gen 2
AMD Ryzen 9 PRO 7940HS
1794 Points +3%
Dell XPS 16 9640
Intel Core Ultra 7 155H
1791 Points +3%
HP Envy 16 h0112nr
Intel Core i7-12700H
1772 Points +2%
Lenovo Legion Slim 7 16APH8
AMD Ryzen 7 7840HS
1754 Points +1%
HP Envy x360 2-in-1 16-ad0097nr
AMD Ryzen 7 8840HS
1745 Points
Framework Laptop 16
AMD Ryzen 9 7940HS
1733 Points -1%
Average AMD Ryzen 7 8840HS
  (1712 - 1746, n=5)
1732 Points -1%
Acer Swift Edge SFE16 Ryzen 7 7840U
AMD Ryzen 7 7840U
1719 Points -1%
Lenovo ThinkPad E16 G1 Core i5-1335U
Intel Core i5-1335U
1714 Points -2%
Samsung Galaxy Book4 Pro 360
Intel Core Ultra 5 125H
1710 Points -2%
HP Spectre x360 16 RTX 4050
Intel Core Ultra 7 155H
1708 Points -2%
LG Gram 2in1 16 16T90R - G.AA78G
Intel Core i7-1360P
1705 Points -2%
Lenovo Yoga Book 9 13IMU9
Intel Core Ultra 7 155U
1675 Points -4%
Lenovo Thinkpad X1 Fold 16
Intel Core i7-1250U
1606 Points -8%
Lenovo Yoga 7 2-in-1 16IML9
Intel Core Ultra 5 125U
1548 Points -11%
Cinebench R20 / CPU (Multi Core)
Lenovo Yoga Pro 9 16IMH9
Intel Core Ultra 9 185H
7651 Points +53%
Dell XPS 16 9640
Intel Core Ultra 7 155H
7146 Points +43%
Lenovo ThinkPad Z16 Gen 2
AMD Ryzen 9 PRO 7940HS
6601 Points +32%
Framework Laptop 16
AMD Ryzen 9 7940HS
6402 Points +28%
Lenovo Legion Slim 7 16APH8
AMD Ryzen 7 7840HS
6379 Points +28%
HP Spectre x360 16 RTX 4050
Intel Core Ultra 7 155H
5609 Points +12%
Average AMD Ryzen 7 8840HS
  (4854 - 5760, n=5)
5316 Points +6%
Acer Swift Go SFG16-71
Intel Core i7-13700H
5310 Points +6%
HP Envy 16 h0112nr
Intel Core i7-12700H
5053 Points +1%
HP Envy x360 2-in-1 16-ad0097nr
AMD Ryzen 7 8840HS
4994 Points
Acer Swift Edge SFE16 Ryzen 7 7840U
AMD Ryzen 7 7840U
4740 Points -5%
LG Gram 2in1 16 16T90R - G.AA78G
Intel Core i7-1360P
4506 Points -10%
Samsung Galaxy Book4 Pro 360
Intel Core Ultra 5 125H
3870 Points -23%
Lenovo ThinkPad E16 G1 Core i5-1335U
Intel Core i5-1335U
3849 Points -23%
Lenovo Yoga 7 2-in-1 16IML9
Intel Core Ultra 5 125U
3720 Points -26%
Lenovo Yoga Book 9 13IMU9
Intel Core Ultra 7 155U
3613 Points -28%
Lenovo Thinkpad X1 Fold 16
Intel Core i7-1250U
2745 Points -45%
Cinebench R20 / CPU (Single Core)
Lenovo Yoga Pro 9 16IMH9
Intel Core Ultra 9 185H
735 Points +13%
Acer Swift Go SFG16-71
Intel Core i7-13700H
720 Points +11%
Lenovo ThinkPad Z16 Gen 2
AMD Ryzen 9 PRO 7940HS
695 Points +7%
HP Envy 16 h0112nr
Intel Core i7-12700H
683 Points +5%
Framework Laptop 16
AMD Ryzen 9 7940HS
680 Points +5%
Lenovo Legion Slim 7 16APH8
AMD Ryzen 7 7840HS
672 Points +4%
Dell XPS 16 9640
Intel Core Ultra 7 155H
672 Points +4%
Average AMD Ryzen 7 8840HS
  (649 - 681, n=5)
670 Points +3%
Acer Swift Edge SFE16 Ryzen 7 7840U
AMD Ryzen 7 7840U
668 Points +3%
Lenovo ThinkPad E16 G1 Core i5-1335U
Intel Core i5-1335U
663 Points +2%
HP Spectre x360 16 RTX 4050
Intel Core Ultra 7 155H
663 Points +2%
LG Gram 2in1 16 16T90R - G.AA78G
Intel Core i7-1360P
658 Points +1%
Samsung Galaxy Book4 Pro 360
Intel Core Ultra 5 125H
655 Points +1%
HP Envy x360 2-in-1 16-ad0097nr
AMD Ryzen 7 8840HS
649 Points
Lenovo Yoga Book 9 13IMU9
Intel Core Ultra 7 155U
646 Points 0%
Lenovo Thinkpad X1 Fold 16
Intel Core i7-1250U
621 Points -4%
Lenovo Yoga 7 2-in-1 16IML9
Intel Core Ultra 5 125U
605 Points -7%
Cinebench R15 / CPU Multi 64Bit
Lenovo Yoga Pro 9 16IMH9
Intel Core Ultra 9 185H
3005 (2869.44min - 3004.58max) Points +47%
Dell XPS 16 9640
Intel Core Ultra 7 155H
2818 (2643.06min - 2817.5max) Points +38%
Lenovo ThinkPad Z16 Gen 2
AMD Ryzen 9 PRO 7940HS
2718 (2534.21min - 2717.95max) Points +33%
Framework Laptop 16
AMD Ryzen 9 7940HS
2653 (2587.82min - 2652.52max) Points +30%
HP Envy 16 h0112nr
Intel Core i7-12700H
2590 (2293.84min - 2590.34max) Points +27%
Lenovo Legion Slim 7 16APH8
AMD Ryzen 7 7840HS
2564 (2422.77min - 2563.77max) Points +25%
Acer Swift Go SFG16-71
Intel Core i7-13700H
2350 (1816.37min - 2350.45max) Points +15%
HP Spectre x360 16 RTX 4050
Intel Core Ultra 7 155H
2303 (1414.83min - 2302.95max) Points +13%
LG Gram 2in1 16 16T90R - G.AA78G
Intel Core i7-1360P
2214 (1472min - 2214.1max) Points +8%
Average AMD Ryzen 7 8840HS
  (1934 - 2489, n=5)
2178 Points +7%
HP Envy x360 2-in-1 16-ad0097nr
AMD Ryzen 7 8840HS
2045 (1885.73min - 2044.68max) Points
Acer Swift Edge SFE16 Ryzen 7 7840U
AMD Ryzen 7 7840U
1986 (1515.15min - 1985.51max) Points -3%
Samsung Galaxy Book4 Pro 360
Intel Core Ultra 5 125H
1700 (1080.79min - 1700.25max) Points -17%
Lenovo Yoga 7 2-in-1 16IML9
Intel Core Ultra 5 125U
1657 (1250.47min - 1657.34max) Points -19%
Lenovo ThinkPad E16 G1 Core i5-1335U
Intel Core i5-1335U
1527 (602.98min - 1527max) Points -25%
Lenovo Yoga Book 9 13IMU9
Intel Core Ultra 7 155U
1505 (1278.32min - 1504.72max) Points -26%
Lenovo Thinkpad X1 Fold 16
Intel Core i7-1250U
1085 (795.91min - 1085.04max) Points -47%
Cinebench R15 / CPU Single 64Bit
Lenovo ThinkPad Z16 Gen 2
AMD Ryzen 9 PRO 7940HS
280 Points +7%
Lenovo Yoga Pro 9 16IMH9
Intel Core Ultra 9 185H
280 Points +7%
Framework Laptop 16
AMD Ryzen 9 7940HS
277 Points +6%
Lenovo Legion Slim 7 16APH8
AMD Ryzen 7 7840HS
273 Points +5%
Acer Swift Edge SFE16 Ryzen 7 7840U
AMD Ryzen 7 7840U
268 Points +3%
Average AMD Ryzen 7 8840HS
  (261 - 272, n=5)
268 Points +3%
HP Envy x360 2-in-1 16-ad0097nr
AMD Ryzen 7 8840HS
261 Points
Acer Swift Go SFG16-71
Intel Core i7-13700H
260 Points 0%
Dell XPS 16 9640
Intel Core Ultra 7 155H
260 Points 0%
HP Envy 16 h0112nr
Intel Core i7-12700H
256 Points -2%
HP Spectre x360 16 RTX 4050
Intel Core Ultra 7 155H
255 Points -2%
Samsung Galaxy Book4 Pro 360
Intel Core Ultra 5 125H
246 Points -6%
LG Gram 2in1 16 16T90R - G.AA78G
Intel Core i7-1360P
244 Points -7%
Lenovo ThinkPad E16 G1 Core i5-1335U
Intel Core i5-1335U
236 Points -10%
Lenovo Yoga Book 9 13IMU9
Intel Core Ultra 7 155U
230 Points -12%
Lenovo Yoga 7 2-in-1 16IML9
Intel Core Ultra 5 125U
226 Points -13%
Lenovo Thinkpad X1 Fold 16
Intel Core i7-1250U
218 Points -16%
Blender / v2.79 BMW27 CPU
Lenovo Thinkpad X1 Fold 16
Intel Core i7-1250U
556 Seconds * -126%
Lenovo ThinkPad E16 G1 Core i5-1335U
Intel Core i5-1335U
455 Seconds * -85%
Samsung Galaxy Book4 Pro 360
Intel Core Ultra 5 125H
364 Seconds * -48%
Lenovo Yoga 7 2-in-1 16IML9
Intel Core Ultra 5 125U
358 Seconds * -46%
Lenovo Yoga Book 9 13IMU9
Intel Core Ultra 7 155U
353 Seconds * -43%
LG Gram 2in1 16 16T90R - G.AA78G
Intel Core i7-1360P
324 Seconds * -32%
Acer Swift Edge SFE16 Ryzen 7 7840U
AMD Ryzen 7 7840U
266 Seconds * -8%
Acer Swift Go SFG16-71
Intel Core i7-13700H
255 Seconds * -4%
HP Envy 16 h0112nr
Intel Core i7-12700H
249 Seconds * -1%
HP Envy x360 2-in-1 16-ad0097nr
AMD Ryzen 7 8840HS
246 Seconds *
Average AMD Ryzen 7 8840HS
  (222 - 246, n=5)
231 Seconds * +6%
Lenovo Legion Slim 7 16APH8
AMD Ryzen 7 7840HS
195 Seconds * +21%
Framework Laptop 16
AMD Ryzen 9 7940HS
195 Seconds * +21%
Lenovo ThinkPad Z16 Gen 2
AMD Ryzen 9 PRO 7940HS
191 Seconds * +22%
Dell XPS 16 9640
Intel Core Ultra 7 155H
179 Seconds * +27%
Lenovo Yoga Pro 9 16IMH9
Intel Core Ultra 9 185H
163 Seconds * +34%
7-Zip 18.03 / 7z b 4
Lenovo Yoga Pro 9 16IMH9
Intel Core Ultra 9 185H
76331 MIPS +39%
Framework Laptop 16
AMD Ryzen 9 7940HS
71464 MIPS +30%
Lenovo Legion Slim 7 16APH8
AMD Ryzen 7 7840HS
70243 MIPS +28%
Dell XPS 16 9640
Intel Core Ultra 7 155H
70074 MIPS +28%
Lenovo ThinkPad Z16 Gen 2
AMD Ryzen 9 PRO 7940HS
67813 MIPS +24%
HP Spectre x360 16 RTX 4050
Intel Core Ultra 7 155H
60099 MIPS +10%
Average AMD Ryzen 7 8840HS
  (54768 - 63624, n=5)
59958 MIPS +9%
Acer Swift Go SFG16-71
Intel Core i7-13700H
54857 MIPS 0%
HP Envy x360 2-in-1 16-ad0097nr
AMD Ryzen 7 8840HS
54768 MIPS
HP Envy 16 h0112nr
Intel Core i7-12700H
54715 MIPS 0%
Acer Swift Edge SFE16 Ryzen 7 7840U
AMD Ryzen 7 7840U
54022 MIPS -1%
LG Gram 2in1 16 16T90R - G.AA78G
Intel Core i7-1360P
42886 MIPS -22%
Lenovo Yoga 7 2-in-1 16IML9
Intel Core Ultra 5 125U
39065 MIPS -29%
Lenovo Yoga Book 9 13IMU9
Intel Core Ultra 7 155U
38645 MIPS -29%
Lenovo ThinkPad E16 G1 Core i5-1335U
Intel Core i5-1335U
32972 MIPS -40%
Lenovo Thinkpad X1 Fold 16
Intel Core i7-1250U
27072 MIPS -51%
7-Zip 18.03 / 7z b 4 -mmt1
Lenovo Legion Slim 7 16APH8
AMD Ryzen 7 7840HS
6604 MIPS +12%
Framework Laptop 16
AMD Ryzen 9 7940HS
6599 MIPS +12%
Lenovo ThinkPad Z16 Gen 2
AMD Ryzen 9 PRO 7940HS
6215 MIPS +5%
Acer Swift Go SFG16-71
Intel Core i7-13700H
6148 MIPS +4%
Average AMD Ryzen 7 8840HS
  (5702 - 6493, n=5)
6126 MIPS +4%
Acer Swift Edge SFE16 Ryzen 7 7840U
AMD Ryzen 7 7840U
6041 MIPS +2%
HP Envy x360 2-in-1 16-ad0097nr
AMD Ryzen 7 8840HS
5912 MIPS
Lenovo Yoga Pro 9 16IMH9
Intel Core Ultra 9 185H
5781 MIPS -2%
HP Envy 16 h0112nr
Intel Core i7-12700H
5706 MIPS -3%
Dell XPS 16 9640
Intel Core Ultra 7 155H
5474 MIPS -7%
Lenovo ThinkPad E16 G1 Core i5-1335U
Intel Core i5-1335U
5171 MIPS -13%
HP Spectre x360 16 RTX 4050
Intel Core Ultra 7 155H
5125 MIPS -13%
Samsung Galaxy Book4 Pro 360
Intel Core Ultra 5 125H
5106 MIPS -14%
Lenovo Thinkpad X1 Fold 16
Intel Core i7-1250U
5041 MIPS -15%
Lenovo Yoga Book 9 13IMU9
Intel Core Ultra 7 155U
4855 MIPS -18%
LG Gram 2in1 16 16T90R - G.AA78G
Intel Core i7-1360P
4651 MIPS -21%
Lenovo Yoga 7 2-in-1 16IML9
Intel Core Ultra 5 125U
4492 MIPS -24%
Geekbench 6.3 / Multi-Core
Lenovo Yoga Pro 9 16IMH9
Intel Core Ultra 9 185H
14031 Points +27%
Dell XPS 16 9640
Intel Core Ultra 7 155H
13656 Points +23%
Framework Laptop 16
AMD Ryzen 9 7940HS
13217 Points +19%
Lenovo ThinkPad Z16 Gen 2
AMD Ryzen 9 PRO 7940HS
13028 Points +18%
Lenovo Legion Slim 7 16APH8
AMD Ryzen 7 7840HS
12919 Points +17%
HP Spectre x360 16 RTX 4050
Intel Core Ultra 7 155H
11962 Points +8%
Average AMD Ryzen 7 8840HS
  (11081 - 12843, n=5)
11646 Points +5%
Samsung Galaxy Book4 Pro 360
Intel Core Ultra 5 125H
11571 Points +4%
LG Gram 2in1 16 16T90R - G.AA78G
Intel Core i7-1360P
11511 Points +4%
HP Envy x360 2-in-1 16-ad0097nr
AMD Ryzen 7 8840HS
11081 Points
Acer Swift Edge SFE16 Ryzen 7 7840U
AMD Ryzen 7 7840U
10763 Points -3%
Lenovo Yoga 7 2-in-1 16IML9
Intel Core Ultra 5 125U
9601 Points -13%
Lenovo Yoga Book 9 13IMU9
Intel Core Ultra 7 155U
9448 Points -15%
Lenovo Thinkpad X1 Fold 16
Intel Core i7-1250U
7943 Points -28%
Lenovo ThinkPad E16 G1 Core i5-1335U
Intel Core i5-1335U
7691 Points -31%
Geekbench 6.3 / Single-Core
Framework Laptop 16
AMD Ryzen 9 7940HS
2630 Points +4%
Lenovo Legion Slim 7 16APH8
AMD Ryzen 7 7840HS
2625 Points +4%
Lenovo ThinkPad Z16 Gen 2
AMD Ryzen 9 PRO 7940HS
2605 Points +3%
Lenovo Yoga Pro 9 16IMH9
Intel Core Ultra 9 185H
2570 Points +2%
Acer Swift Edge SFE16 Ryzen 7 7840U
AMD Ryzen 7 7840U
2562 Points +1%
Average AMD Ryzen 7 8840HS
  (2477 - 2594, n=5)
2548 Points +1%
HP Envy x360 2-in-1 16-ad0097nr
AMD Ryzen 7 8840HS
2525 Points
Dell XPS 16 9640
Intel Core Ultra 7 155H
2418 Points -4%
Lenovo Yoga Book 9 13IMU9
Intel Core Ultra 7 155U
2324 Points -8%
Samsung Galaxy Book4 Pro 360
Intel Core Ultra 5 125H
2310 Points -9%
LG Gram 2in1 16 16T90R - G.AA78G
Intel Core i7-1360P
2301 Points -9%
Lenovo Thinkpad X1 Fold 16
Intel Core i7-1250U
2298 Points -9%
HP Spectre x360 16 RTX 4050
Intel Core Ultra 7 155H
2288 Points -9%
Lenovo Yoga 7 2-in-1 16IML9
Intel Core Ultra 5 125U
2148 Points -15%
Geekbench 5.5 / Multi-Core
Lenovo Yoga Pro 9 16IMH9
Intel Core Ultra 9 185H
13936 Points +40%
Dell XPS 16 9640
Intel Core Ultra 7 155H
13556 Points +36%
HP Envy 16 h0112nr
Intel Core i7-12700H
12640 Points +27%
Framework Laptop 16
AMD Ryzen 9 7940HS
12379 Points +24%
HP Spectre x360 16 RTX 4050
Intel Core Ultra 7 155H
12053 Points +21%
Lenovo ThinkPad Z16 Gen 2
AMD Ryzen 9 PRO 7940HS
12038 Points +21%
Lenovo Legion Slim 7 16APH8
AMD Ryzen 7 7840HS
11872 Points +19%
Acer Swift Go SFG16-71
Intel Core i7-13700H
11831 Points +19%
LG Gram 2in1 16 16T90R - G.AA78G
Intel Core i7-1360P
10450 Points +5%
Average AMD Ryzen 7 8840HS
  (9779 - 11542, n=5)
10410 Points +5%
HP Envy x360 2-in-1 16-ad0097nr
AMD Ryzen 7 8840HS
9949 Points
Samsung Galaxy Book4 Pro 360
Intel Core Ultra 5 125H
9696 Points -3%
Acer Swift Edge SFE16 Ryzen 7 7840U
AMD Ryzen 7 7840U
9516 Points -4%
Lenovo Yoga Book 9 13IMU9
Intel Core Ultra 7 155U
8409 Points -15%
Lenovo Yoga 7 2-in-1 16IML9
Intel Core Ultra 5 125U
8355 Points -16%
Lenovo ThinkPad E16 G1 Core i5-1335U
Intel Core i5-1335U
7194 Points -28%
Lenovo Thinkpad X1 Fold 16
Intel Core i7-1250U
6753 Points -32%
Geekbench 5.5 / Single-Core
Framework Laptop 16
AMD Ryzen 9 7940HS
1963 Points +4%
Lenovo ThinkPad Z16 Gen 2
AMD Ryzen 9 PRO 7940HS
1956 Points +3%
Lenovo Legion Slim 7 16APH8
AMD Ryzen 7 7840HS
1943 Points +3%
Acer Swift Edge SFE16 Ryzen 7 7840U
AMD Ryzen 7 7840U
1933 Points +2%
Average AMD Ryzen 7 8840HS
  (1822 - 1946, n=5)
1906 Points +1%
Lenovo Yoga Pro 9 16IMH9
Intel Core Ultra 9 185H
1902 Points 0%
HP Envy x360 2-in-1 16-ad0097nr
AMD Ryzen 7 8840HS
1894 Points
Acer Swift Go SFG16-71
Intel Core i7-13700H
1861 Points -2%
Dell XPS 16 9640
Intel Core Ultra 7 155H
1775 Points -6%
HP Envy 16 h0112nr
Intel Core i7-12700H
1773 Points -6%
HP Spectre x360 16 RTX 4050
Intel Core Ultra 7 155H
1731 Points -9%
Samsung Galaxy Book4 Pro 360
Intel Core Ultra 5 125H
1699 Points -10%
Lenovo Yoga Book 9 13IMU9
Intel Core Ultra 7 155U
1691 Points -11%
Lenovo ThinkPad E16 G1 Core i5-1335U
Intel Core i5-1335U
1674 Points -12%
Lenovo Thinkpad X1 Fold 16
Intel Core i7-1250U
1650 Points -13%
LG Gram 2in1 16 16T90R - G.AA78G
Intel Core i7-1360P
1648 Points -13%
Lenovo Yoga 7 2-in-1 16IML9
Intel Core Ultra 5 125U
1560 Points -18%
HWBOT x265 Benchmark v2.2 / 4k Preset
Lenovo Yoga Pro 9 16IMH9
Intel Core Ultra 9 185H
22.7 fps +45%
Framework Laptop 16
AMD Ryzen 9 7940HS
21 fps +34%
Dell XPS 16 9640
Intel Core Ultra 7 155H
20.8 fps +32%
Lenovo ThinkPad Z16 Gen 2
AMD Ryzen 9 PRO 7940HS
20.4 fps +30%
Lenovo Legion Slim 7 16APH8
AMD Ryzen 7 7840HS
20.1 fps +28%
Average AMD Ryzen 7 8840HS
  (14.6 - 17.8, n=5)
16.5 fps +5%
HP Spectre x360 16 RTX 4050
Intel Core Ultra 7 155H
16.4 fps +4%
Acer Swift Go SFG16-71
Intel Core i7-13700H
15.7 fps 0%
HP Envy x360 2-in-1 16-ad0097nr
AMD Ryzen 7 8840HS
15.7 fps
Acer Swift Edge SFE16 Ryzen 7 7840U
AMD Ryzen 7 7840U
15.4 fps -2%
HP Envy 16 h0112nr
Intel Core i7-12700H
14.9 fps -5%
LG Gram 2in1 16 16T90R - G.AA78G
Intel Core i7-1360P
11.2 fps -29%
Lenovo Yoga 7 2-in-1 16IML9
Intel Core Ultra 5 125U
11.1 fps -29%
Lenovo Yoga Book 9 13IMU9
Intel Core Ultra 7 155U
10.7 fps -32%
Samsung Galaxy Book4 Pro 360
Intel Core Ultra 5 125H
10.6 fps -32%
Lenovo ThinkPad E16 G1 Core i5-1335U
Intel Core i5-1335U
9.79 fps -38%
Lenovo Thinkpad X1 Fold 16
Intel Core i7-1250U
7.84 fps -50%
LibreOffice / 20 Documents To PDF
Lenovo Legion Slim 7 16APH8
AMD Ryzen 7 7840HS
68.3 s * -32%
LG Gram 2in1 16 16T90R - G.AA78G
Intel Core i7-1360P
57.2 s * -11%
Lenovo Thinkpad X1 Fold 16
Intel Core i7-1250U
53.8 s * -4%
HP Envy x360 2-in-1 16-ad0097nr
AMD Ryzen 7 8840HS
51.7 s *
Lenovo ThinkPad E16 G1 Core i5-1335U
Intel Core i5-1335U
50.5 s * +2%
Average AMD Ryzen 7 8840HS
  (46.7 - 51.7, n=5)
49.2 s * +5%
Lenovo Yoga 7 2-in-1 16IML9
Intel Core Ultra 5 125U
47 s * +9%
Lenovo ThinkPad Z16 Gen 2
AMD Ryzen 9 PRO 7940HS
46.1 s * +11%
HP Envy 16 h0112nr
Intel Core i7-12700H
45.3 s * +12%
HP Spectre x360 16 RTX 4050
Intel Core Ultra 7 155H
45.3 s * +12%
Dell XPS 16 9640
Intel Core Ultra 7 155H
44.8 s * +13%
Lenovo Yoga Book 9 13IMU9
Intel Core Ultra 7 155U
44.3 s * +14%
Framework Laptop 16
AMD Ryzen 9 7940HS
43.6 s * +16%
Acer Swift Edge SFE16 Ryzen 7 7840U
AMD Ryzen 7 7840U
43.4 s * +16%
Samsung Galaxy Book4 Pro 360
Intel Core Ultra 5 125H
42.7 s * +17%
Acer Swift Go SFG16-71
Intel Core i7-13700H
40.7 s * +21%
Lenovo Yoga Pro 9 16IMH9
Intel Core Ultra 9 185H
39.7 s * +23%
R Benchmark 2.5 / Overall mean
LG Gram 2in1 16 16T90R - G.AA78G
Intel Core i7-1360P
0.583 sec * -26%
Lenovo Yoga 7 2-in-1 16IML9
Intel Core Ultra 5 125U
0.533 sec * -15%
Lenovo Thinkpad X1 Fold 16
Intel Core i7-1250U
0.508 sec * -10%
Lenovo Yoga Book 9 13IMU9
Intel Core Ultra 7 155U
0.508 sec * -10%
Samsung Galaxy Book4 Pro 360
Intel Core Ultra 5 125H
0.503 sec * -8%
HP Spectre x360 16 RTX 4050
Intel Core Ultra 7 155H
0.4907 sec * -6%
Dell XPS 16 9640
Intel Core Ultra 7 155H
0.4828 sec * -4%
HP Envy x360 2-in-1 16-ad0097nr
AMD Ryzen 7 8840HS
0.4638 sec *
Average AMD Ryzen 7 8840HS
  (0.439 - 0.4774, n=5)
0.4614 sec * +1%
Acer Swift Edge SFE16 Ryzen 7 7840U
AMD Ryzen 7 7840U
0.4593 sec * +1%
HP Envy 16 h0112nr
Intel Core i7-12700H
0.4586 sec * +1%
Lenovo ThinkPad Z16 Gen 2
AMD Ryzen 9 PRO 7940HS
0.4514 sec * +3%
Framework Laptop 16
AMD Ryzen 9 7940HS
0.4467 sec * +4%
Lenovo Yoga Pro 9 16IMH9
Intel Core Ultra 9 185H
0.4457 sec * +4%
Lenovo Legion Slim 7 16APH8
AMD Ryzen 7 7840HS
0.4431 sec * +4%
Acer Swift Go SFG16-71
Intel Core i7-13700H
0.4426 sec * +5%
CPU Performance Rating: Percent
Cinebench R23: Multi Core | Single Core
Cinebench R20: CPU (Multi Core) | CPU (Single Core)
Cinebench R15: CPU Multi 64Bit | CPU Single 64Bit
Blender: v2.79 BMW27 CPU
7-Zip 18.03: 7z b 4 | 7z b 4 -mmt1
Geekbench 6.3: Multi-Core | Single-Core
Geekbench 5.5: Multi-Core | Single-Core
HWBOT x265 Benchmark v2.2: 4k Preset
LibreOffice : 20 Documents To PDF
R Benchmark 2.5: Overall mean

* ... im mniej tym lepiej

Cinebench R15 CPU Multi 64Bit
2045 Points
Cinebench R15 OpenGL 64Bit
163.9 fps
Cinebench R15 Ref. Match 64Bit
97.9 %
Cinebench R15 CPU Single 64Bit
261 Points
Cinebench R20 CPU (Multi Core)
4994 Points
Cinebench R20 CPU (Single Core)
649 Points
Cinebench R23 Single Core
1745 Points
Cinebench R23 Multi Core
13082 Points
Pomoc
Performance Rating
Average AMD Ryzen 7 8840HS
 
91.9 pt
HP Envy x360 2-in-1 16-ad0097nr
AMD Ryzen 7 8840HS, Radeon 780M
88 pt
HP Spectre x360 16 RTX 4050
Intel Core Ultra 7 155H, NVIDIA GeForce RTX 4050 Laptop GPU
77.7 pt
HP Envy 16 h0112nr
Intel Core i7-12700H, GeForce RTX 3060 Laptop GPU
72.4 pt
LG Gram 2in1 16 16T90R - G.AA78G
Intel Core i7-1360P, Iris Xe G7 96EUs
63.3 pt
Samsung Galaxy Book4 Pro 360
Intel Core Ultra 5 125H, Arc 7-Core
54 pt
Lenovo Yoga 7 2-in-1 16IML9
Intel Core Ultra 5 125U, Graphics 4-Core
53 pt
AIDA64 / FP32 Ray-Trace
Average AMD Ryzen 7 8840HS
  (20007 - 22596, n=5)
21768 KRay/s +9%
HP Envy x360 2-in-1 16-ad0097nr
AMD Ryzen 7 8840HS, Radeon 780M
20007 KRay/s
HP Spectre x360 16 RTX 4050
Intel Core Ultra 7 155H, NVIDIA GeForce RTX 4050 Laptop GPU
13917 KRay/s -30%
HP Envy 16 h0112nr
Intel Core i7-12700H, GeForce RTX 3060 Laptop GPU
11996 KRay/s -40%
LG Gram 2in1 16 16T90R - G.AA78G
Intel Core i7-1360P, Iris Xe G7 96EUs
9693 KRay/s -52%
LG Gram 2in1 16 16T90R - G.AA78G
Intel Core i7-1360P, Iris Xe G7 96EUs
8619 KRay/s -57%
Lenovo Yoga 7 2-in-1 16IML9
Intel Core Ultra 5 125U, Graphics 4-Core
8556 KRay/s -57%
Samsung Galaxy Book4 Pro 360
Intel Core Ultra 5 125H, Arc 7-Core
8546 KRay/s -57%
AIDA64 / FPU Julia
Average AMD Ryzen 7 8840HS
  (84591 - 93550, n=5)
89687 Points +6%
HP Envy x360 2-in-1 16-ad0097nr
AMD Ryzen 7 8840HS, Radeon 780M
84591 Points
HP Spectre x360 16 RTX 4050
Intel Core Ultra 7 155H, NVIDIA GeForce RTX 4050 Laptop GPU
72948 Points -14%
HP Envy 16 h0112nr
Intel Core i7-12700H, GeForce RTX 3060 Laptop GPU
60379 Points -29%
LG Gram 2in1 16 16T90R - G.AA78G
Intel Core i7-1360P, Iris Xe G7 96EUs
50702 Points -40%
Lenovo Yoga 7 2-in-1 16IML9
Intel Core Ultra 5 125U, Graphics 4-Core
44602 Points -47%
Samsung Galaxy Book4 Pro 360
Intel Core Ultra 5 125H, Arc 7-Core
43652 Points -48%
AIDA64 / CPU SHA3
Average AMD Ryzen 7 8840HS
  (3847 - 4201, n=5)
4054 MB/s +5%
HP Envy x360 2-in-1 16-ad0097nr
AMD Ryzen 7 8840HS, Radeon 780M
3847 MB/s
HP Spectre x360 16 RTX 4050
Intel Core Ultra 7 155H, NVIDIA GeForce RTX 4050 Laptop GPU
3360 MB/s -13%
HP Envy 16 h0112nr
Intel Core i7-12700H, GeForce RTX 3060 Laptop GPU
2847 MB/s -26%
LG Gram 2in1 16 16T90R - G.AA78G
Intel Core i7-1360P, Iris Xe G7 96EUs
2522 MB/s -34%
Lenovo Yoga 7 2-in-1 16IML9
Intel Core Ultra 5 125U, Graphics 4-Core
2312 MB/s -40%
Samsung Galaxy Book4 Pro 360
Intel Core Ultra 5 125H, Arc 7-Core
2070 MB/s -46%
AIDA64 / CPU Queen
HP Envy x360 2-in-1 16-ad0097nr
AMD Ryzen 7 8840HS, Radeon 780M
107640 Points
Average AMD Ryzen 7 8840HS
  (99874 - 111733, n=5)
106909 Points -1%
HP Envy 16 h0112nr
Intel Core i7-12700H, GeForce RTX 3060 Laptop GPU
101825 Points -5%
LG Gram 2in1 16 16T90R - G.AA78G
Intel Core i7-1360P, Iris Xe G7 96EUs
82121 Points -24%
HP Spectre x360 16 RTX 4050
Intel Core Ultra 7 155H, NVIDIA GeForce RTX 4050 Laptop GPU
81755 Points -24%
Samsung Galaxy Book4 Pro 360
Intel Core Ultra 5 125H, Arc 7-Core
77892 Points -28%
Lenovo Yoga 7 2-in-1 16IML9
Intel Core Ultra 5 125U, Graphics 4-Core
47712 Points -56%
AIDA64 / FPU SinJulia
Average AMD Ryzen 7 8840HS
  (12929 - 13845, n=5)
13521 Points +5%
HP Envy x360 2-in-1 16-ad0097nr
AMD Ryzen 7 8840HS, Radeon 780M
12929 Points
HP Spectre x360 16 RTX 4050
Intel Core Ultra 7 155H, NVIDIA GeForce RTX 4050 Laptop GPU
9622 Points -26%
HP Envy 16 h0112nr
Intel Core i7-12700H, GeForce RTX 3060 Laptop GPU
8137 Points -37%
Samsung Galaxy Book4 Pro 360
Intel Core Ultra 5 125H, Arc 7-Core
6855 Points -47%
LG Gram 2in1 16 16T90R - G.AA78G
Intel Core i7-1360P, Iris Xe G7 96EUs
6679 Points -48%
Lenovo Yoga 7 2-in-1 16IML9
Intel Core Ultra 5 125U, Graphics 4-Core
5507 Points -57%
AIDA64 / FPU Mandel
Average AMD Ryzen 7 8840HS
  (44969 - 49687, n=5)
47909 Points +7%
HP Envy x360 2-in-1 16-ad0097nr
AMD Ryzen 7 8840HS, Radeon 780M
44969 Points
HP Spectre x360 16 RTX 4050
Intel Core Ultra 7 155H, NVIDIA GeForce RTX 4050 Laptop GPU
35607 Points -21%
HP Envy 16 h0112nr
Intel Core i7-12700H, GeForce RTX 3060 Laptop GPU
29979 Points -33%
LG Gram 2in1 16 16T90R - G.AA78G
Intel Core i7-1360P, Iris Xe G7 96EUs
24392 Points -46%
Lenovo Yoga 7 2-in-1 16IML9
Intel Core Ultra 5 125U, Graphics 4-Core
23731 Points -47%
Samsung Galaxy Book4 Pro 360
Intel Core Ultra 5 125H, Arc 7-Core
21250 Points -53%
AIDA64 / CPU AES
HP Envy 16 h0112nr
Intel Core i7-12700H, GeForce RTX 3060 Laptop GPU
106504 MB/s +50%
LG Gram 2in1 16 16T90R - G.AA78G
Intel Core i7-1360P, Iris Xe G7 96EUs
92044 MB/s +30%
HP Envy x360 2-in-1 16-ad0097nr
AMD Ryzen 7 8840HS, Radeon 780M
70892 MB/s
Average AMD Ryzen 7 8840HS
  (60328 - 76959, n=5)
68967 MB/s -3%
HP Spectre x360 16 RTX 4050
Intel Core Ultra 7 155H, NVIDIA GeForce RTX 4050 Laptop GPU
68741 MB/s -3%
Lenovo Yoga 7 2-in-1 16IML9
Intel Core Ultra 5 125U, Graphics 4-Core
46209 MB/s -35%
Samsung Galaxy Book4 Pro 360
Intel Core Ultra 5 125H, Arc 7-Core
45524 MB/s -36%
AIDA64 / CPU ZLib
HP Spectre x360 16 RTX 4050
Intel Core Ultra 7 155H, NVIDIA GeForce RTX 4050 Laptop GPU
996 MB/s +16%
HP Envy x360 2-in-1 16-ad0097nr
AMD Ryzen 7 8840HS, Radeon 780M
857 MB/s
Average AMD Ryzen 7 8840HS
  (468 - 930, n=5)
815 MB/s -5%
HP Envy 16 h0112nr
Intel Core i7-12700H, GeForce RTX 3060 Laptop GPU
807 MB/s -6%
LG Gram 2in1 16 16T90R - G.AA78G
Intel Core i7-1360P, Iris Xe G7 96EUs
752 MB/s -12%
Lenovo Yoga 7 2-in-1 16IML9
Intel Core Ultra 5 125U, Graphics 4-Core
709 MB/s -17%
Samsung Galaxy Book4 Pro 360
Intel Core Ultra 5 125H, Arc 7-Core
594 MB/s -31%
AIDA64 / FP64 Ray-Trace
Average AMD Ryzen 7 8840HS
  (10571 - 11985, n=5)
11455 KRay/s +8%
HP Envy x360 2-in-1 16-ad0097nr
AMD Ryzen 7 8840HS, Radeon 780M
10571 KRay/s
HP Spectre x360 16 RTX 4050
Intel Core Ultra 7 155H, NVIDIA GeForce RTX 4050 Laptop GPU
7241 KRay/s -32%
HP Envy 16 h0112nr
Intel Core i7-12700H, GeForce RTX 3060 Laptop GPU
6418 KRay/s -39%
LG Gram 2in1 16 16T90R - G.AA78G
Intel Core i7-1360P, Iris Xe G7 96EUs
5266 KRay/s -50%
Samsung Galaxy Book4 Pro 360
Intel Core Ultra 5 125H, Arc 7-Core
4345 KRay/s -59%
Lenovo Yoga 7 2-in-1 16IML9
Intel Core Ultra 5 125U, Graphics 4-Core
4297 KRay/s -59%
AIDA64 / CPU PhotoWorxx
HP Spectre x360 16 RTX 4050
Intel Core Ultra 7 155H, NVIDIA GeForce RTX 4050 Laptop GPU
48831 MPixel/s +55%
Lenovo Yoga 7 2-in-1 16IML9
Intel Core Ultra 5 125U, Graphics 4-Core
47564 MPixel/s +51%
Samsung Galaxy Book4 Pro 360
Intel Core Ultra 5 125H, Arc 7-Core
45724 MPixel/s +45%
LG Gram 2in1 16 16T90R - G.AA78G
Intel Core i7-1360P, Iris Xe G7 96EUs
42905 MPixel/s +36%
HP Envy 16 h0112nr
Intel Core i7-12700H, GeForce RTX 3060 Laptop GPU
37404 MPixel/s +19%
Average AMD Ryzen 7 8840HS
  (31491 - 43868, n=5)
35656 MPixel/s +13%
HP Envy x360 2-in-1 16-ad0097nr
AMD Ryzen 7 8840HS, Radeon 780M
31491 MPixel/s

Test warunków skrajnych

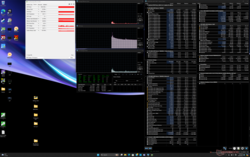
System bezczynny
System bezczynny

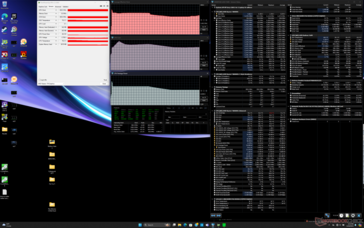
Uruchomienie Prime95 powoduje, że CPU osiąga 4,1 GHz i 40 W tylko przez kilka pierwszych sekund, po czym spada do 3,4 GHz i 32 W. Po kilku minutach spada dalej do 3,1 GHz i 26 W, co sugeruje ograniczoną stabilność Turbo Core. Procesor Intel Core Ultra 7 w Spectre x360 16 ustabilizowałby się w tej samej temperaturze, co nasz Envy x360 16 zasilany przez AMD, w 76 ° C, być może przez przypadek.

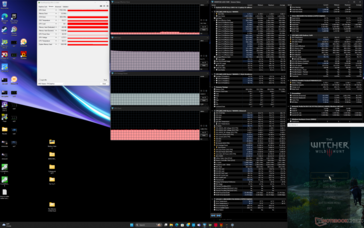
Uruchomienie Witcher 3 w trybie Performance skutkowałoby stabilną temperaturą CPU i częstotliwością taktowania GPU na poziomie odpowiednio 68 C i 2180 MHz, w porównaniu do zaledwie 61 C i 1785 MHz w trybie Balanced. Różnice te pokrywają się z naszymi wynikami Fire Strike i obserwacjami szumu wentylatora pomiędzy dwoma profilami zasilania. Moc pakietu CPU również uległa zmianie z 26 W w trybie Performance do 20 W w trybie Balanced.

Stres Prime95
Stres Prime95
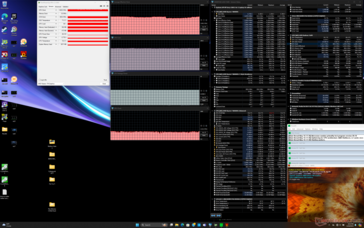
Prime95+FurMark stres
Witcher 3 naprężenie (tryb zrównoważony)
Witcher 3 stres (tryb wydajności)
Średnie taktowanie CPU (GHz) Taktowanie GPU (MHz) Średnia temperatura CPU (°C)
System bezczynności -- -- 42
Prime95Stress 3.1 -- 77
Prime95+ FurMark Stress 2.9 1469 73
Witcher 3 Obciążenie (trybzrównoważony) ~0.3 1785 61
Witcher 3 Obciążenie (trybwydajnościowy) ~0,5 2180 68

Wydajność systemu

Wyniki PCMark są znacznie lepsze niż w zeszłym roku Envy x360 15 szczególnie w podtestach Productivity i Digital Content Creation, gdzie surowa moc CPU i GPU naprawdę ma znaczenie. Envy x360 16 osiąga średnio wyniki pomiędzy Envy x360 15 i Spectre x360 16.

PCMark 10 Standard
PCMark 10 Standard
PCMark 10 / Score
HP Envy 16 h0112nr
GeForce RTX 3060 Laptop GPU, i7-12700H, Micron 3400 1TB MTFDKBA1T0TFH
7595 Points +9%
Average AMD Ryzen 7 8840HS, AMD Radeon 780M
  (6563 - 7213, n=5)
6983 Points 0%
HP Envy x360 2-in-1 16-ad0097nr
Radeon 780M, R7 8840HS, KIOXIA BG5 KBG50ZNV1T02
6958 Points
HP Spectre x360 16 RTX 4050
NVIDIA GeForce RTX 4050 Laptop GPU, Ultra 7 155H, SK hynix PC801 HFS001TEJ9X101N
6720 Points -3%
Samsung Galaxy Book4 Pro 360
Arc 7-Core, Ultra 5 125H, Samsung PM9B1 512GB MZVL4512HBLU
6330 Points -9%
Lenovo Yoga 7 2-in-1 16IML9
Graphics 4-Core, Ultra 5 125U, SK hynix HFS512GEJ4X112N
5895 Points -15%
LG Gram 2in1 16 16T90R - G.AA78G
Iris Xe G7 96EUs, i7-1360P, Samsung PM9A1 MZVL21T0HCLR
5781 Points -17%
PCMark 10 / Essentials
HP Envy 16 h0112nr
GeForce RTX 3060 Laptop GPU, i7-12700H, Micron 3400 1TB MTFDKBA1T0TFH
12144 Points +16%
LG Gram 2in1 16 16T90R - G.AA78G
Iris Xe G7 96EUs, i7-1360P, Samsung PM9A1 MZVL21T0HCLR
11359 Points +8%
Lenovo Yoga 7 2-in-1 16IML9
Graphics 4-Core, Ultra 5 125U, SK hynix HFS512GEJ4X112N
10827 Points +3%
Average AMD Ryzen 7 8840HS, AMD Radeon 780M
  (10265 - 11449, n=5)
10728 Points +2%
Samsung Galaxy Book4 Pro 360
Arc 7-Core, Ultra 5 125H, Samsung PM9B1 512GB MZVL4512HBLU
10584 Points +1%
HP Envy x360 2-in-1 16-ad0097nr
Radeon 780M, R7 8840HS, KIOXIA BG5 KBG50ZNV1T02
10503 Points
HP Spectre x360 16 RTX 4050
NVIDIA GeForce RTX 4050 Laptop GPU, Ultra 7 155H, SK hynix PC801 HFS001TEJ9X101N
10326 Points -2%
PCMark 10 / Productivity
HP Envy x360 2-in-1 16-ad0097nr
Radeon 780M, R7 8840HS, KIOXIA BG5 KBG50ZNV1T02
9933 Points
Average AMD Ryzen 7 8840HS, AMD Radeon 780M
  (9217 - 10449, n=5)
9852 Points -1%
HP Spectre x360 16 RTX 4050
NVIDIA GeForce RTX 4050 Laptop GPU, Ultra 7 155H, SK hynix PC801 HFS001TEJ9X101N
9272 Points -7%
HP Envy 16 h0112nr
GeForce RTX 3060 Laptop GPU, i7-12700H, Micron 3400 1TB MTFDKBA1T0TFH
9224 Points -7%
Samsung Galaxy Book4 Pro 360
Arc 7-Core, Ultra 5 125H, Samsung PM9B1 512GB MZVL4512HBLU
7933 Points -20%
Lenovo Yoga 7 2-in-1 16IML9
Graphics 4-Core, Ultra 5 125U, SK hynix HFS512GEJ4X112N
7712 Points -22%
LG Gram 2in1 16 16T90R - G.AA78G
Iris Xe G7 96EUs, i7-1360P, Samsung PM9A1 MZVL21T0HCLR
6572 Points -34%
PCMark 10 / Digital Content Creation
HP Envy 16 h0112nr
GeForce RTX 3060 Laptop GPU, i7-12700H, Micron 3400 1TB MTFDKBA1T0TFH
10617 Points +21%
HP Envy x360 2-in-1 16-ad0097nr
Radeon 780M, R7 8840HS, KIOXIA BG5 KBG50ZNV1T02
8763 Points
Average AMD Ryzen 7 8840HS, AMD Radeon 780M
  (8108 - 9163, n=5)
8748 Points 0%
HP Spectre x360 16 RTX 4050
NVIDIA GeForce RTX 4050 Laptop GPU, Ultra 7 155H, SK hynix PC801 HFS001TEJ9X101N
8602 Points -2%
Samsung Galaxy Book4 Pro 360
Arc 7-Core, Ultra 5 125H, Samsung PM9B1 512GB MZVL4512HBLU
8198 Points -6%
LG Gram 2in1 16 16T90R - G.AA78G
Iris Xe G7 96EUs, i7-1360P, Samsung PM9A1 MZVL21T0HCLR
7027 Points -20%
Lenovo Yoga 7 2-in-1 16IML9
Graphics 4-Core, Ultra 5 125U, SK hynix HFS512GEJ4X112N
6658 Points -24%
CrossMark / Overall
HP Envy 16 h0112nr
GeForce RTX 3060 Laptop GPU, i7-12700H, Micron 3400 1TB MTFDKBA1T0TFH
1826 Points +11%
Average AMD Ryzen 7 8840HS, AMD Radeon 780M
  (1643 - 1698, n=5)
1666 Points +1%
Lenovo Yoga 7 2-in-1 16IML9
Graphics 4-Core, Ultra 5 125U, SK hynix HFS512GEJ4X112N
1648 Points 0%
HP Envy x360 2-in-1 16-ad0097nr
Radeon 780M, R7 8840HS, KIOXIA BG5 KBG50ZNV1T02
1643 Points
Samsung Galaxy Book4 Pro 360
Arc 7-Core, Ultra 5 125H, Samsung PM9B1 512GB MZVL4512HBLU
1633 Points -1%
HP Spectre x360 16 RTX 4050
NVIDIA GeForce RTX 4050 Laptop GPU, Ultra 7 155H, SK hynix PC801 HFS001TEJ9X101N
1574 Points -4%
LG Gram 2in1 16 16T90R - G.AA78G
Iris Xe G7 96EUs, i7-1360P, Samsung PM9A1 MZVL21T0HCLR
1527 Points -7%
CrossMark / Productivity
HP Envy 16 h0112nr
GeForce RTX 3060 Laptop GPU, i7-12700H, Micron 3400 1TB MTFDKBA1T0TFH
1728 Points +7%
Average AMD Ryzen 7 8840HS, AMD Radeon 780M
  (1560 - 1658, n=5)
1614 Points 0%
HP Envy x360 2-in-1 16-ad0097nr
Radeon 780M, R7 8840HS, KIOXIA BG5 KBG50ZNV1T02
1611 Points
Samsung Galaxy Book4 Pro 360
Arc 7-Core, Ultra 5 125H, Samsung PM9B1 512GB MZVL4512HBLU
1577 Points -2%
LG Gram 2in1 16 16T90R - G.AA78G
Iris Xe G7 96EUs, i7-1360P, Samsung PM9A1 MZVL21T0HCLR
1503 Points -7%
HP Spectre x360 16 RTX 4050
NVIDIA GeForce RTX 4050 Laptop GPU, Ultra 7 155H, SK hynix PC801 HFS001TEJ9X101N
1496 Points -7%
Lenovo Yoga 7 2-in-1 16IML9
Graphics 4-Core, Ultra 5 125U, SK hynix HFS512GEJ4X112N
1310 Points -19%
CrossMark / Creativity
HP Envy 16 h0112nr
GeForce RTX 3060 Laptop GPU, i7-12700H, Micron 3400 1TB MTFDKBA1T0TFH
2016 Points +13%
Average AMD Ryzen 7 8840HS, AMD Radeon 780M
  (1790 - 1876, n=5)
1838 Points +3%
HP Spectre x360 16 RTX 4050
NVIDIA GeForce RTX 4050 Laptop GPU, Ultra 7 155H, SK hynix PC801 HFS001TEJ9X101N
1831 Points +2%
HP Envy x360 2-in-1 16-ad0097nr
Radeon 780M, R7 8840HS, KIOXIA BG5 KBG50ZNV1T02
1790 Points
Samsung Galaxy Book4 Pro 360
Arc 7-Core, Ultra 5 125H, Samsung PM9B1 512GB MZVL4512HBLU
1758 Points -2%
LG Gram 2in1 16 16T90R - G.AA78G
Iris Xe G7 96EUs, i7-1360P, Samsung PM9A1 MZVL21T0HCLR
1558 Points -13%
Lenovo Yoga 7 2-in-1 16IML9
Graphics 4-Core, Ultra 5 125U, SK hynix HFS512GEJ4X112N
1499 Points -16%
CrossMark / Responsiveness
HP Envy 16 h0112nr
GeForce RTX 3060 Laptop GPU, i7-12700H, Micron 3400 1TB MTFDKBA1T0TFH
1599 Points +19%
LG Gram 2in1 16 16T90R - G.AA78G
Iris Xe G7 96EUs, i7-1360P, Samsung PM9A1 MZVL21T0HCLR
1508 Points +12%
Samsung Galaxy Book4 Pro 360
Arc 7-Core, Ultra 5 125H, Samsung PM9B1 512GB MZVL4512HBLU
1456 Points +8%
Average AMD Ryzen 7 8840HS, AMD Radeon 780M
  (1314 - 1428, n=5)
1362 Points +1%
HP Envy x360 2-in-1 16-ad0097nr
Radeon 780M, R7 8840HS, KIOXIA BG5 KBG50ZNV1T02
1347 Points
HP Spectre x360 16 RTX 4050
NVIDIA GeForce RTX 4050 Laptop GPU, Ultra 7 155H, SK hynix PC801 HFS001TEJ9X101N
1167 Points -13%
Lenovo Yoga 7 2-in-1 16IML9
Graphics 4-Core, Ultra 5 125U, SK hynix HFS512GEJ4X112N
1066 Points -21%
WebXPRT 3 / Overall
Average AMD Ryzen 7 8840HS, AMD Radeon 780M
  (297 - 440, n=5)
328 Points +10%
HP Envy 16 h0112nr
GeForce RTX 3060 Laptop GPU, i7-12700H, Micron 3400 1TB MTFDKBA1T0TFH
300 Points +1%
HP Envy x360 2-in-1 16-ad0097nr
Radeon 780M, R7 8840HS, KIOXIA BG5 KBG50ZNV1T02
297 Points
HP Spectre x360 16 RTX 4050
NVIDIA GeForce RTX 4050 Laptop GPU, Ultra 7 155H, SK hynix PC801 HFS001TEJ9X101N
278 Points -6%
Samsung Galaxy Book4 Pro 360
Arc 7-Core, Ultra 5 125H, Samsung PM9B1 512GB MZVL4512HBLU
263 Points -11%
LG Gram 2in1 16 16T90R - G.AA78G
Iris Xe G7 96EUs, i7-1360P, Samsung PM9A1 MZVL21T0HCLR
251 Points -15%
Lenovo Yoga 7 2-in-1 16IML9
Graphics 4-Core, Ultra 5 125U, SK hynix HFS512GEJ4X112N
237 Points -20%
WebXPRT 4 / Overall
HP Envy 16 h0112nr
GeForce RTX 3060 Laptop GPU, i7-12700H, Micron 3400 1TB MTFDKBA1T0TFH
264 Points +7%
HP Spectre x360 16 RTX 4050
NVIDIA GeForce RTX 4050 Laptop GPU, Ultra 7 155H, SK hynix PC801 HFS001TEJ9X101N
255 Points +4%
Average AMD Ryzen 7 8840HS, AMD Radeon 780M
  (246 - 257, n=5)
250 Points +2%
HP Envy x360 2-in-1 16-ad0097nr
Radeon 780M, R7 8840HS, KIOXIA BG5 KBG50ZNV1T02
246 Points
Samsung Galaxy Book4 Pro 360
Arc 7-Core, Ultra 5 125H, Samsung PM9B1 512GB MZVL4512HBLU
237 Points -4%
Lenovo Yoga 7 2-in-1 16IML9
Graphics 4-Core, Ultra 5 125U, SK hynix HFS512GEJ4X112N
227 Points -8%
Mozilla Kraken 1.1 / Total
LG Gram 2in1 16 16T90R - G.AA78G
Iris Xe G7 96EUs, i7-1360P, Samsung PM9A1 MZVL21T0HCLR
633 ms * -18%
Lenovo Yoga 7 2-in-1 16IML9
Graphics 4-Core, Ultra 5 125U, SK hynix HFS512GEJ4X112N
587 ms * -9%
Samsung Galaxy Book4 Pro 360
Arc 7-Core, Ultra 5 125H, Samsung PM9B1 512GB MZVL4512HBLU
575 ms * -7%
HP Envy x360 2-in-1 16-ad0097nr
Radeon 780M, R7 8840HS, KIOXIA BG5 KBG50ZNV1T02
538 ms *
HP Spectre x360 16 RTX 4050
NVIDIA GeForce RTX 4050 Laptop GPU, Ultra 7 155H, SK hynix PC801 HFS001TEJ9X101N
537 ms * -0%
Average AMD Ryzen 7 8840HS, AMD Radeon 780M
  (518 - 563, n=5)
537 ms * -0%
HP Envy 16 h0112nr
GeForce RTX 3060 Laptop GPU, i7-12700H, Micron 3400 1TB MTFDKBA1T0TFH
535 ms * +1%

* ... im mniej tym lepiej

PCMark 10 Score
6958 pkt.
Pomoc
AIDA64 / Memory Copy
Samsung Galaxy Book4 Pro 360
Intel Core Ultra 5 125H, Arc 7-Core
86739 MB/s +26%
HP Spectre x360 16 RTX 4050
Intel Core Ultra 7 155H, NVIDIA GeForce RTX 4050 Laptop GPU
84352 MB/s +23%
Lenovo Yoga 7 2-in-1 16IML9
Intel Core Ultra 5 125U, Graphics 4-Core
82786 MB/s +20%
Average AMD Ryzen 7 8840HS
  (63403 - 76766, n=5)
69492 MB/s +1%
HP Envy x360 2-in-1 16-ad0097nr
AMD Ryzen 7 8840HS, Radeon 780M
68720 MB/s
LG Gram 2in1 16 16T90R - G.AA78G
Intel Core i7-1360P, Iris Xe G7 96EUs
62716 MB/s -9%
HP Envy 16 h0112nr
Intel Core i7-12700H, GeForce RTX 3060 Laptop GPU
56883 MB/s -17%
AIDA64 / Memory Read
HP Spectre x360 16 RTX 4050
Intel Core Ultra 7 155H, NVIDIA GeForce RTX 4050 Laptop GPU
86873 MB/s +73%
Samsung Galaxy Book4 Pro 360
Intel Core Ultra 5 125H, Arc 7-Core
75519 MB/s +50%
HP Envy 16 h0112nr
Intel Core i7-12700H, GeForce RTX 3060 Laptop GPU
66192 MB/s +32%
Lenovo Yoga 7 2-in-1 16IML9
Intel Core Ultra 5 125U, Graphics 4-Core
63131 MB/s +26%
Average AMD Ryzen 7 8840HS
  (50273 - 61739, n=5)
56450 MB/s +12%
LG Gram 2in1 16 16T90R - G.AA78G
Intel Core i7-1360P, Iris Xe G7 96EUs
55798 MB/s +11%
HP Envy x360 2-in-1 16-ad0097nr
AMD Ryzen 7 8840HS, Radeon 780M
50273 MB/s
AIDA64 / Memory Write
HP Spectre x360 16 RTX 4050
Intel Core Ultra 7 155H, NVIDIA GeForce RTX 4050 Laptop GPU
93451 MB/s +3%
HP Envy x360 2-in-1 16-ad0097nr
AMD Ryzen 7 8840HS, Radeon 780M
91050 MB/s
Average AMD Ryzen 7 8840HS
  (78347 - 107658, n=5)
90509 MB/s -1%
LG Gram 2in1 16 16T90R - G.AA78G
Intel Core i7-1360P, Iris Xe G7 96EUs
76173 MB/s -16%
Samsung Galaxy Book4 Pro 360
Intel Core Ultra 5 125H, Arc 7-Core
72329 MB/s -21%
Lenovo Yoga 7 2-in-1 16IML9
Intel Core Ultra 5 125U, Graphics 4-Core
62028 MB/s -32%
HP Envy 16 h0112nr
Intel Core i7-12700H, GeForce RTX 3060 Laptop GPU
58969 MB/s -35%
AIDA64 / Memory Latency
Lenovo Yoga 7 2-in-1 16IML9
Intel Core Ultra 5 125U, Graphics 4-Core
149.8 ns * -23%
HP Spectre x360 16 RTX 4050
Intel Core Ultra 7 155H, NVIDIA GeForce RTX 4050 Laptop GPU
138.4 ns * -14%
Samsung Galaxy Book4 Pro 360
Intel Core Ultra 5 125H, Arc 7-Core
129 ns * -6%
HP Envy x360 2-in-1 16-ad0097nr
AMD Ryzen 7 8840HS, Radeon 780M
121.8 ns *
Average AMD Ryzen 7 8840HS
  (92.2 - 122.4, n=5)
110.4 ns * +9%
LG Gram 2in1 16 16T90R - G.AA78G
Intel Core i7-1360P, Iris Xe G7 96EUs
109.8 ns * +10%
HP Envy 16 h0112nr
Intel Core i7-12700H, GeForce RTX 3060 Laptop GPU
91.7 ns * +25%

* ... im mniej tym lepiej

Opóźnienie DPC

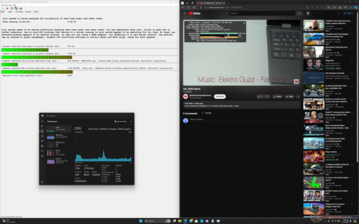
LatencyMon ujawnia drobne problemy z DPC podczas otwierania wielu kart na naszej stronie głównej. odtwarzanie wideo 4K60 jest również niedoskonałe, z 4 utraconymi klatkami zarejestrowanymi w ciągu 60 sekund. Choć przeskoki klatek nie są na tyle częste, by były zauważalne, w idealnej sytuacji nie powinno ich być wcale.

LatencyMon
LatencyMon
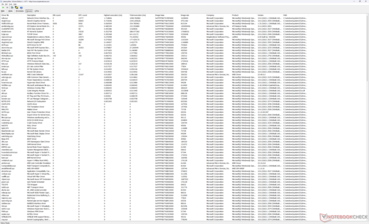
Lista kierowców
Lista kierowców
DPC Latencies / LatencyMon - interrupt to process latency (max), Web, Youtube, Prime95
LG Gram 2in1 16 16T90R - G.AA78G
Iris Xe G7 96EUs, i7-1360P, Samsung PM9A1 MZVL21T0HCLR
16478 μs * -905%
Samsung Galaxy Book4 Pro 360
Arc 7-Core, Ultra 5 125H, Samsung PM9B1 512GB MZVL4512HBLU
7075.7 μs * -331%
HP Spectre x360 16 RTX 4050
NVIDIA GeForce RTX 4050 Laptop GPU, Ultra 7 155H, SK hynix PC801 HFS001TEJ9X101N
6156.4 μs * -275%
HP Envy x360 2-in-1 16-ad0097nr
Radeon 780M, R7 8840HS, KIOXIA BG5 KBG50ZNV1T02
1639.8 μs *
HP Envy 16 h0112nr
GeForce RTX 3060 Laptop GPU, i7-12700H, Micron 3400 1TB MTFDKBA1T0TFH
889.1 μs * +46%
Lenovo Yoga 7 2-in-1 16IML9
Graphics 4-Core, Ultra 5 125U, SK hynix HFS512GEJ4X112N
775.1 μs * +53%

* ... im mniej tym lepiej

Urządzenia pamięci masowej

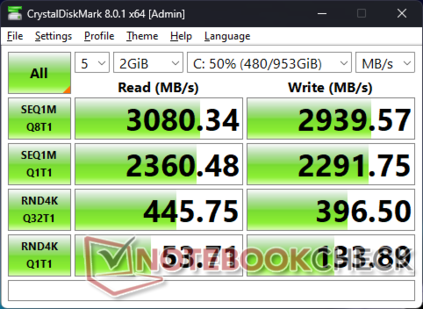
Nasze urządzenie jest dostarczane z Kioxia KBG50ZNV1T02 który jest budżetowym dyskiem SSD 2280 PCIe4 x4 NVMe o szybkości sekwencyjnego odczytu i zapisu odpowiednio do 3500 MB/s i 2900 MB/s, w porównaniu do 7000 MB/s na dyskach wyższej klasy, takich jak seria Samsung PM9A1. Szybkość transferu nieznacznie spada pod obciążeniem, ale poza tym wydajność jest dobra jak na system średniej klasy.

CDM 8
CDM 8
AS SSD
AS SSD
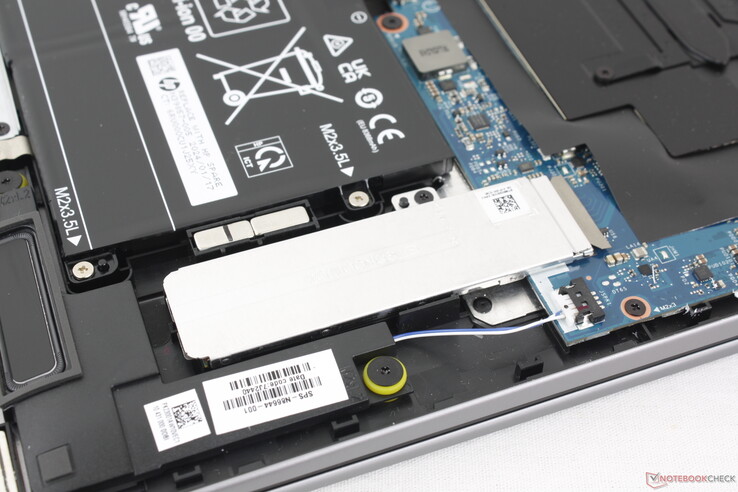
Obsługuje tylko jeden dysk SSD M.2 2280 bez dodatkowych opcji
KIOXIA BG5 KBG50ZNV1T02
CDM 5/6 Read Seq Q32T1: 2993 MB/s
CDM 5/6 Write Seq Q32T1: 2948 MB/s
CDM 5/6 Read 4K Q32T1: 434.4 MB/s
CDM 5/6 Write 4K Q32T1: 374.2 MB/s
CDM 5 Read Seq: 2383 MB/s
CDM 5 Write Seq: 2277 MB/s
CDM 5/6 Read 4K: 50.23 MB/s
CDM 5/6 Write 4K: 133.6 MB/s
Drive Performance Rating - Percent
LG Gram 2in1 16 16T90R - G.AA78G
Samsung PM9A1 MZVL21T0HCLR
90.8 pt
HP Envy 16 h0112nr
Micron 3400 1TB MTFDKBA1T0TFH
74 pt
Samsung Galaxy Book4 Pro 360
Samsung PM9B1 512GB MZVL4512HBLU
70.1 pt
HP Spectre x360 16 RTX 4050
SK hynix PC801 HFS001TEJ9X101N
67.8 pt
HP Envy x360 2-in-1 16-ad0097nr
KIOXIA BG5 KBG50ZNV1T02
45.6 pt
Lenovo Yoga 7 2-in-1 16IML9
SK hynix HFS512GEJ4X112N
39 pt
DiskSpd
seq read
HP Spectre x360 16 RTX 4050
SK hynix PC801 HFS001TEJ9X101N
4195 (3890.22min - 4194.51max) MB/s +76%
HP Envy 16 h0112nr
Micron 3400 1TB MTFDKBA1T0TFH
3337 (3241.38min - 3336.82max) MB/s +40%
LG Gram 2in1 16 16T90R - G.AA78G
Samsung PM9A1 MZVL21T0HCLR
2882 (2725.88min - 2882.22max) MB/s +21%
Samsung Galaxy Book4 Pro 360
Samsung PM9B1 512GB MZVL4512HBLU
2710 (2686.45min - 2710.15max) MB/s +14%
Lenovo Yoga 7 2-in-1 16IML9
SK hynix HFS512GEJ4X112N
2699 (2655.97min - 2699.09max) MB/s +13%
HP Envy x360 2-in-1 16-ad0097nr
KIOXIA BG5 KBG50ZNV1T02
2381 (2369.66min - 2380.54max) MB/s
seq write
LG Gram 2in1 16 16T90R - G.AA78G
Samsung PM9A1 MZVL21T0HCLR
3431 (3289.51min - 3431.36max) MB/s +48%
HP Envy 16 h0112nr
Micron 3400 1TB MTFDKBA1T0TFH
3337 (3241.38min - 3337.44max) MB/s +44%
HP Spectre x360 16 RTX 4050
SK hynix PC801 HFS001TEJ9X101N
2569 (1593.04min - 2568.7max) MB/s +11%
Samsung Galaxy Book4 Pro 360
Samsung PM9B1 512GB MZVL4512HBLU
2472 (2455.35min - 2471.91max) MB/s +7%
HP Envy x360 2-in-1 16-ad0097nr
KIOXIA BG5 KBG50ZNV1T02
2320 (2187.12min - 2319.66max) MB/s
Lenovo Yoga 7 2-in-1 16IML9
SK hynix HFS512GEJ4X112N
2007 (1120.16min - 2006.74max) MB/s -13%
seq q8 t1 read
HP Spectre x360 16 RTX 4050
SK hynix PC801 HFS001TEJ9X101N
7152 (6200.23min - 7151.67max) MB/s +163%
HP Envy 16 h0112nr
Micron 3400 1TB MTFDKBA1T0TFH
6593 (5975.42min - 6593.24max) MB/s +142%
LG Gram 2in1 16 16T90R - G.AA78G
Samsung PM9A1 MZVL21T0HCLR
6562 (5825.59min - 6561.57max) MB/s +141%
Lenovo Yoga 7 2-in-1 16IML9
SK hynix HFS512GEJ4X112N
4319 (3684.49min - 4319.04max) MB/s +59%
Samsung Galaxy Book4 Pro 360
Samsung PM9B1 512GB MZVL4512HBLU
3623 (3166.28min - 3622.92max) MB/s +33%
HP Envy x360 2-in-1 16-ad0097nr
KIOXIA BG5 KBG50ZNV1T02
2723 (2395.19min - 2722.52max) MB/s
seq q8 t1 write
HP Envy 16 h0112nr
Micron 3400 1TB MTFDKBA1T0TFH
4991 (4646.87min - 4990.59max) MB/s +70%
LG Gram 2in1 16 16T90R - G.AA78G
Samsung PM9A1 MZVL21T0HCLR
4947 (4921.79min - 4946.59max) MB/s +68%
HP Spectre x360 16 RTX 4050
SK hynix PC801 HFS001TEJ9X101N
4542 (1615.35min - 4542.01max) MB/s +55%
HP Envy x360 2-in-1 16-ad0097nr
KIOXIA BG5 KBG50ZNV1T02
2939 (2905.25min - 2938.94max) MB/s
Lenovo Yoga 7 2-in-1 16IML9
SK hynix HFS512GEJ4X112N
2692 (2518.05min - 2692.39max) MB/s -8%
Samsung Galaxy Book4 Pro 360
Samsung PM9B1 512GB MZVL4512HBLU
2510 (2494.14min - 2510.29max) MB/s -15%
4k q1 t1 read
LG Gram 2in1 16 16T90R - G.AA78G
Samsung PM9A1 MZVL21T0HCLR
81.6 (74.82min - 81.55max) MB/s +55%
Samsung Galaxy Book4 Pro 360
Samsung PM9B1 512GB MZVL4512HBLU
79.7 (78.91min - 79.65max) MB/s +52%
HP Spectre x360 16 RTX 4050
SK hynix PC801 HFS001TEJ9X101N
59.7 (57.49min - 59.7max) MB/s +14%
HP Envy x360 2-in-1 16-ad0097nr
KIOXIA BG5 KBG50ZNV1T02
52.5 (51.53min - 52.46max) MB/s
HP Envy 16 h0112nr
Micron 3400 1TB MTFDKBA1T0TFH
49 (47.57min - 48.98max) MB/s -7%
Lenovo Yoga 7 2-in-1 16IML9
SK hynix HFS512GEJ4X112N
42.4 (41.92min - 42.35max) MB/s -19%
4k q1 t1 write
LG Gram 2in1 16 16T90R - G.AA78G
Samsung PM9A1 MZVL21T0HCLR
226 (219.95min - 225.84max) MB/s +66%
Samsung Galaxy Book4 Pro 360
Samsung PM9B1 512GB MZVL4512HBLU
183 (179.84min - 182.98max) MB/s +34%
HP Envy 16 h0112nr
Micron 3400 1TB MTFDKBA1T0TFH
143.6 (143.02min - 143.57max) MB/s +5%
HP Envy x360 2-in-1 16-ad0097nr
KIOXIA BG5 KBG50ZNV1T02
136.5 (133.54min - 136.47max) MB/s
HP Spectre x360 16 RTX 4050
SK hynix PC801 HFS001TEJ9X101N
77.7 (70.39min - 77.73max) MB/s -43%
Lenovo Yoga 7 2-in-1 16IML9
SK hynix HFS512GEJ4X112N
65.6 (57.11min - 65.62max) MB/s -52%
4k q32 t16 read
LG Gram 2in1 16 16T90R - G.AA78G
Samsung PM9A1 MZVL21T0HCLR
3881 (3853min - 3881.23max) MB/s +352%
Samsung Galaxy Book4 Pro 360
Samsung PM9B1 512GB MZVL4512HBLU
1830 (1819.65min - 1829.74max) MB/s +113%
HP Envy 16 h0112nr
Micron 3400 1TB MTFDKBA1T0TFH
1310 (1228.8min - 1310.37max) MB/s +53%
HP Envy x360 2-in-1 16-ad0097nr
KIOXIA BG5 KBG50ZNV1T02
859 (846.09min - 858.76max) MB/s
Lenovo Yoga 7 2-in-1 16IML9
SK hynix HFS512GEJ4X112N
607 (582.45min - 607.33max) MB/s -29%
HP Spectre x360 16 RTX 4050
SK hynix PC801 HFS001TEJ9X101N
353 (326.84min - 352.62max) MB/s -59%
4k q32 t16 write
LG Gram 2in1 16 16T90R - G.AA78G
Samsung PM9A1 MZVL21T0HCLR
3537 (3009.8min - 3536.52max) MB/s +821%
Samsung Galaxy Book4 Pro 360
Samsung PM9B1 512GB MZVL4512HBLU
1868 (1861.35min - 1868.28max) MB/s +386%
HP Envy 16 h0112nr
Micron 3400 1TB MTFDKBA1T0TFH
546 (534.95min - 545.61max) MB/s +42%
HP Envy x360 2-in-1 16-ad0097nr
KIOXIA BG5 KBG50ZNV1T02
384 (367.4min - 383.87max) MB/s
Lenovo Yoga 7 2-in-1 16IML9
SK hynix HFS512GEJ4X112N
316 (305.01min - 315.67max) MB/s -18%
HP Spectre x360 16 RTX 4050
SK hynix PC801 HFS001TEJ9X101N
148.5 (140.69min - 148.5max) MB/s -61%
AS SSD
Score Total
LG Gram 2in1 16 16T90R - G.AA78G
Samsung PM9A1 MZVL21T0HCLR
6136 Points +151%
HP Envy 16 h0112nr
Micron 3400 1TB MTFDKBA1T0TFH
5456 Points +123%
Samsung Galaxy Book4 Pro 360
Samsung PM9B1 512GB MZVL4512HBLU
5210 Points +113%
HP Spectre x360 16 RTX 4050
SK hynix PC801 HFS001TEJ9X101N
4395 Points +79%
Lenovo Yoga 7 2-in-1 16IML9
SK hynix HFS512GEJ4X112N
2591 Points +6%
HP Envy x360 2-in-1 16-ad0097nr
KIOXIA BG5 KBG50ZNV1T02
2449 Points
Score Read
LG Gram 2in1 16 16T90R - G.AA78G
Samsung PM9A1 MZVL21T0HCLR
2943 Points +156%
Samsung Galaxy Book4 Pro 360
Samsung PM9B1 512GB MZVL4512HBLU
2027 Points +76%
HP Envy 16 h0112nr
Micron 3400 1TB MTFDKBA1T0TFH
1653 Points +44%
HP Envy x360 2-in-1 16-ad0097nr
KIOXIA BG5 KBG50ZNV1T02
1151 Points
Lenovo Yoga 7 2-in-1 16IML9
SK hynix HFS512GEJ4X112N
1054 Points -8%
HP Spectre x360 16 RTX 4050
SK hynix PC801 HFS001TEJ9X101N
953 Points -17%
Score Write
HP Spectre x360 16 RTX 4050
SK hynix PC801 HFS001TEJ9X101N
3036 Points +311%
HP Envy 16 h0112nr
Micron 3400 1TB MTFDKBA1T0TFH
3011 Points +308%
Samsung Galaxy Book4 Pro 360
Samsung PM9B1 512GB MZVL4512HBLU
2182 Points +196%
LG Gram 2in1 16 16T90R - G.AA78G
Samsung PM9A1 MZVL21T0HCLR
1731 Points +135%
Lenovo Yoga 7 2-in-1 16IML9
SK hynix HFS512GEJ4X112N
1131 Points +53%
HP Envy x360 2-in-1 16-ad0097nr
KIOXIA BG5 KBG50ZNV1T02
738 Points
Seq Read
HP Spectre x360 16 RTX 4050
SK hynix PC801 HFS001TEJ9X101N
5353.82 MB/s +106%
LG Gram 2in1 16 16T90R - G.AA78G
Samsung PM9A1 MZVL21T0HCLR
4943.25 MB/s +90%
Lenovo Yoga 7 2-in-1 16IML9
SK hynix HFS512GEJ4X112N
3724.94 MB/s +43%
HP Envy 16 h0112nr
Micron 3400 1TB MTFDKBA1T0TFH
3716.29 MB/s +43%
Samsung Galaxy Book4 Pro 360
Samsung PM9B1 512GB MZVL4512HBLU
3176 MB/s +22%
HP Envy x360 2-in-1 16-ad0097nr
KIOXIA BG5 KBG50ZNV1T02
2597 MB/s
Seq Write
LG Gram 2in1 16 16T90R - G.AA78G
Samsung PM9A1 MZVL21T0HCLR
3967.06 MB/s +128%
HP Spectre x360 16 RTX 4050
SK hynix PC801 HFS001TEJ9X101N
3349.41 MB/s +93%
HP Envy 16 h0112nr
Micron 3400 1TB MTFDKBA1T0TFH
2419.13 MB/s +39%
Samsung Galaxy Book4 Pro 360
Samsung PM9B1 512GB MZVL4512HBLU
2211 MB/s +27%
HP Envy x360 2-in-1 16-ad0097nr
KIOXIA BG5 KBG50ZNV1T02
1738.71 MB/s
Lenovo Yoga 7 2-in-1 16IML9
SK hynix HFS512GEJ4X112N
881.04 MB/s -49%
4K Read
LG Gram 2in1 16 16T90R - G.AA78G
Samsung PM9A1 MZVL21T0HCLR
78.02 MB/s +48%
Samsung Galaxy Book4 Pro 360
Samsung PM9B1 512GB MZVL4512HBLU
68.5 MB/s +30%
HP Envy 16 h0112nr
Micron 3400 1TB MTFDKBA1T0TFH
61.23 MB/s +16%
HP Spectre x360 16 RTX 4050
SK hynix PC801 HFS001TEJ9X101N
58.84 MB/s +11%
HP Envy x360 2-in-1 16-ad0097nr
KIOXIA BG5 KBG50ZNV1T02
52.79 MB/s
Lenovo Yoga 7 2-in-1 16IML9
SK hynix HFS512GEJ4X112N
42.06 MB/s -20%
4K Write
LG Gram 2in1 16 16T90R - G.AA78G
Samsung PM9A1 MZVL21T0HCLR
196.81 MB/s +26%
HP Envy 16 h0112nr
Micron 3400 1TB MTFDKBA1T0TFH
194.68 MB/s +24%
Samsung Galaxy Book4 Pro 360
Samsung PM9B1 512GB MZVL4512HBLU
164.1 MB/s +5%
HP Spectre x360 16 RTX 4050
SK hynix PC801 HFS001TEJ9X101N
160.09 MB/s +2%
HP Envy x360 2-in-1 16-ad0097nr
KIOXIA BG5 KBG50ZNV1T02
156.53 MB/s
Lenovo Yoga 7 2-in-1 16IML9
SK hynix HFS512GEJ4X112N
148.14 MB/s -5%
4K-64 Read
LG Gram 2in1 16 16T90R - G.AA78G
Samsung PM9A1 MZVL21T0HCLR
2370.92 MB/s +183%
Samsung Galaxy Book4 Pro 360
Samsung PM9B1 512GB MZVL4512HBLU
1641 MB/s +96%
HP Envy 16 h0112nr
Micron 3400 1TB MTFDKBA1T0TFH
1220.1 MB/s +45%
HP Envy x360 2-in-1 16-ad0097nr
KIOXIA BG5 KBG50ZNV1T02
838.9 MB/s
Lenovo Yoga 7 2-in-1 16IML9
SK hynix HFS512GEJ4X112N
639.81 MB/s -24%
HP Spectre x360 16 RTX 4050
SK hynix PC801 HFS001TEJ9X101N
358.94 MB/s -57%
4K-64 Write
HP Envy 16 h0112nr
Micron 3400 1TB MTFDKBA1T0TFH
2574.57 MB/s +532%
HP Spectre x360 16 RTX 4050
SK hynix PC801 HFS001TEJ9X101N
2541 MB/s +523%
Samsung Galaxy Book4 Pro 360
Samsung PM9B1 512GB MZVL4512HBLU
1797 MB/s +341%
LG Gram 2in1 16 16T90R - G.AA78G
Samsung PM9A1 MZVL21T0HCLR
1137.26 MB/s +179%
Lenovo Yoga 7 2-in-1 16IML9
SK hynix HFS512GEJ4X112N
894.74 MB/s +119%
HP Envy x360 2-in-1 16-ad0097nr
KIOXIA BG5 KBG50ZNV1T02
407.67 MB/s
Access Time Read
Lenovo Yoga 7 2-in-1 16IML9
SK hynix HFS512GEJ4X112N
0.126 ms * -16%
HP Envy x360 2-in-1 16-ad0097nr
KIOXIA BG5 KBG50ZNV1T02
0.109 ms *
HP Spectre x360 16 RTX 4050
SK hynix PC801 HFS001TEJ9X101N
0.05 ms * +54%
Samsung Galaxy Book4 Pro 360
Samsung PM9B1 512GB MZVL4512HBLU
0.034 ms * +69%
HP Envy 16 h0112nr
Micron 3400 1TB MTFDKBA1T0TFH
0.03 ms * +72%
LG Gram 2in1 16 16T90R - G.AA78G
Samsung PM9A1 MZVL21T0HCLR
0.028 ms * +74%
Access Time Write
Lenovo Yoga 7 2-in-1 16IML9
SK hynix HFS512GEJ4X112N
0.393 ms * -404%
HP Envy x360 2-in-1 16-ad0097nr
KIOXIA BG5 KBG50ZNV1T02
0.078 ms *
HP Spectre x360 16 RTX 4050
SK hynix PC801 HFS001TEJ9X101N
0.069 ms * +12%
HP Envy 16 h0112nr
Micron 3400 1TB MTFDKBA1T0TFH
0.061 ms * +22%
Samsung Galaxy Book4 Pro 360
Samsung PM9B1 512GB MZVL4512HBLU
0.032 ms * +59%
LG Gram 2in1 16 16T90R - G.AA78G
Samsung PM9A1 MZVL21T0HCLR
0.023 ms * +71%

* ... im mniej tym lepiej

Disk Throttling: DiskSpd Read Loop, Queue Depth 8

033567010051340167520102345268030153350368540204355469050255360569560306365Tooltip
HP Envy x360 2-in-1 16-ad0097nr KIOXIA BG5 KBG50ZNV1T02; diskspd 2.0.17 f: Ø2951 (2827.17-3293.07)
HP Envy 16 h0112nr Micron 3400 1TB MTFDKBA1T0TFH: Ø6437 (4756.27-6626.16)

Wydajność GPU

Radeon 780M Radeon 780M nadal jest bestią wśród zintegrowanych procesorów graficznych, nawet po tym, jak Intel odpowiedział konkurencyjnym modelem Arc 8. wyniki 3DMark pokazują, że jest on najbardziej podobny do Arc 7 ale znacznie wyprzedza starsze Iris Xe 96 EUs.

Zdecydowanie się na wersję Envy x360 16 z procesorem Intela będzie wiązało się ze znacznym spadkiem wydajności graficznej. Wynika to z faktu, że wersje Intel są dostarczane z procesorami Core Ultra z serii U zamiast Core Ultra z serii H. Grafiki Arc 7 i Arc 8 są dostępne tylko w procesorach Core Ultra H, podczas gdy zintegrowany GPU w serii Core Ultra U działa bardziej jak Iris Xe 96 EU.

Profil zasilaniaWynik grafikiWynik fizykiWynik łączny
Tryb wydajności7357224882636
Tryb zrównoważony6957 (-5%)20442 (-9%)2509 (-5%)
Zasilanie bateryjne4651 (-37%)18788 (-17%)1902 (-28%)

Praca w trybie zrównoważonym wpływa na wydajność nawet o 10 procent, zgodnie z powyższą tabelą Fire Strike. Obroty wentylatora stają się zauważalnie bardziej ospałe, gdy są ustawione na tryb zrównoważony, aby towarzyszyć wolniejszej wydajności.

3DMark 11
3DMark 11
Fire Strike Wydajność
Time Spy
Time Spy
Speed Way
Speed Way
3DMark Performance Rating - Percent
Framework Laptop 16 -1!
AMD Radeon RX 7700S, AMD Ryzen 9 7940HS
100 pt
Dell XPS 16 9640 -1!
NVIDIA GeForce RTX 4070 Laptop GPU, Intel Core Ultra 7 155H
94.3 pt
HP Envy 16 h0112nr
NVIDIA GeForce RTX 3060 Laptop GPU, Intel Core i7-12700H
80.7 pt
HP Spectre x360 16 RTX 4050 -1!
NVIDIA GeForce RTX 4050 Laptop GPU, Intel Core Ultra 7 155H
68 pt
Xiaomi RedmiBook Pro 16 2024 -1!
Intel Arc 8-Core iGPU, Intel Core Ultra 7 155H
37.5 pt
Average AMD Radeon 780M
 
35.6 pt
HP Envy x360 2-in-1 16-ad0097nr
AMD Radeon 780M, AMD Ryzen 7 8840HS
34.3 pt
Samsung Galaxy Book4 Pro 360 -1!
Intel Arc 7-Core iGPU, Intel Core Ultra 5 125H
31.5 pt
Acer Swift Edge SFE16 Ryzen 7 7840U -1!
AMD Radeon 780M, AMD Ryzen 7 7840U
27.2 pt
LG Gram 2in1 16 16T90R - G.AA78G
Intel Iris Xe Graphics G7 96EUs, Intel Core i7-1360P
23.2 pt
Acer Swift Go SFG16-71
Intel Iris Xe Graphics G7 96EUs, Intel Core i7-13700H
22.2 pt
Lenovo Yoga 7 2-in-1 16IML9
Intel Graphics 4-Core iGPU (Arc), Intel Core Ultra 5 125U
21.3 pt
Lenovo ThinkPad E16 G1 Core i5-1335U
Intel Iris Xe Graphics G7 80EUs, Intel Core i5-1335U
16.2 pt
Lenovo Thinkpad X1 Fold 16
Intel Iris Xe Graphics G7 96EUs, Intel Core i7-1250U
16 pt
3DMark 11 - 1280x720 Performance GPU
Framework Laptop 16
AMD Radeon RX 7700S, AMD Ryzen 9 7940HS
37918 Points +205%
Dell XPS 16 9640
NVIDIA GeForce RTX 4070 Laptop GPU, Intel Core Ultra 7 155H
33251 Points +168%
HP Envy 16 h0112nr
NVIDIA GeForce RTX 3060 Laptop GPU, Intel Core i7-12700H
26862 Points +116%
HP Spectre x360 16 RTX 4050
NVIDIA GeForce RTX 4050 Laptop GPU, Intel Core Ultra 7 155H
24603 Points +98%
Xiaomi RedmiBook Pro 16 2024
Intel Arc 8-Core iGPU, Intel Core Ultra 7 155H
13381 Points +8%
Average AMD Radeon 780M
  (7868 - 14249, n=57)
12463 Points 0%
HP Envy x360 2-in-1 16-ad0097nr
AMD Radeon 780M, AMD Ryzen 7 8840HS
12413 Points
Acer Swift Edge SFE16 Ryzen 7 7840U
AMD Radeon 780M, AMD Ryzen 7 7840U
11636 Points -6%
Samsung Galaxy Book4 Pro 360
Intel Arc 7-Core iGPU, Intel Core Ultra 5 125H
11528 Points -7%
Acer Swift Go SFG16-71
Intel Iris Xe Graphics G7 96EUs, Intel Core i7-13700H
7243 Points -42%
LG Gram 2in1 16 16T90R - G.AA78G
Intel Iris Xe Graphics G7 96EUs, Intel Core i7-1360P
7098 Points -43%
Lenovo Yoga 7 2-in-1 16IML9
Intel Graphics 4-Core iGPU (Arc), Intel Core Ultra 5 125U
6711 Points -46%
Lenovo ThinkPad E16 G1 Core i5-1335U
Intel Iris Xe Graphics G7 80EUs, Intel Core i5-1335U
5160 Points -58%
Lenovo Thinkpad X1 Fold 16
Intel Iris Xe Graphics G7 96EUs, Intel Core i7-1250U
4817 Points -61%
3DMark
1280x720 Cloud Gate Standard Graphics
HP Envy 16 h0112nr
NVIDIA GeForce RTX 3060 Laptop GPU, Intel Core i7-12700H
81209 Points +82%
Average AMD Radeon 780M
  (27771 - 53972, n=29)
46628 Points +4%
HP Envy x360 2-in-1 16-ad0097nr
AMD Radeon 780M, AMD Ryzen 7 8840HS
44702 Points
LG Gram 2in1 16 16T90R - G.AA78G
Intel Iris Xe Graphics G7 96EUs, Intel Core i7-1360P
31618 Points -29%
Lenovo Yoga 7 2-in-1 16IML9
Intel Graphics 4-Core iGPU (Arc), Intel Core Ultra 5 125U
27316 Points -39%
Acer Swift Go SFG16-71
Intel Iris Xe Graphics G7 96EUs, Intel Core i7-13700H
25452 Points -43%
Lenovo ThinkPad E16 G1 Core i5-1335U
Intel Iris Xe Graphics G7 80EUs, Intel Core i5-1335U
23328 Points -48%
Lenovo Thinkpad X1 Fold 16
Intel Iris Xe Graphics G7 96EUs, Intel Core i7-1250U
20456 Points -54%
1920x1080 Fire Strike Graphics
Framework Laptop 16
AMD Radeon RX 7700S, AMD Ryzen 9 7940HS
24246 Points +230%
Dell XPS 16 9640
NVIDIA GeForce RTX 4070 Laptop GPU, Intel Core Ultra 7 155H
24235 Points +229%
HP Envy 16 h0112nr
NVIDIA GeForce RTX 3060 Laptop GPU, Intel Core i7-12700H
18797 Points +155%
HP Spectre x360 16 RTX 4050
NVIDIA GeForce RTX 4050 Laptop GPU, Intel Core Ultra 7 155H
17908 Points +143%
Xiaomi RedmiBook Pro 16 2024
Intel Arc 8-Core iGPU, Intel Core Ultra 7 155H
9650 Points +31%
Samsung Galaxy Book4 Pro 360
Intel Arc 7-Core iGPU, Intel Core Ultra 5 125H
8366 Points +14%
Average AMD Radeon 780M
  (4550 - 8816, n=59)
7740 Points +5%
HP Envy x360 2-in-1 16-ad0097nr
AMD Radeon 780M, AMD Ryzen 7 8840HS
7357 Points
Acer Swift Edge SFE16 Ryzen 7 7840U
AMD Radeon 780M, AMD Ryzen 7 7840U
7156 Points -3%
LG Gram 2in1 16 16T90R - G.AA78G
Intel Iris Xe Graphics G7 96EUs, Intel Core i7-1360P
5779 Points -21%
Acer Swift Go SFG16-71
Intel Iris Xe Graphics G7 96EUs, Intel Core i7-13700H
5610 Points -24%
Lenovo Yoga 7 2-in-1 16IML9
Intel Graphics 4-Core iGPU (Arc), Intel Core Ultra 5 125U
4786 Points -35%
Lenovo Thinkpad X1 Fold 16
Intel Iris Xe Graphics G7 96EUs, Intel Core i7-1250U
4186 Points -43%
Lenovo ThinkPad E16 G1 Core i5-1335U
Intel Iris Xe Graphics G7 80EUs, Intel Core i5-1335U
3596 Points -51%
2560x1440 Time Spy Graphics
Framework Laptop 16
AMD Radeon RX 7700S, AMD Ryzen 9 7940HS
10206 Points +294%
Dell XPS 16 9640
NVIDIA GeForce RTX 4070 Laptop GPU, Intel Core Ultra 7 155H
9638 Points +272%
HP Envy 16 h0112nr
NVIDIA GeForce RTX 3060 Laptop GPU, Intel Core i7-12700H
7708 Points +197%
HP Spectre x360 16 RTX 4050
NVIDIA GeForce RTX 4050 Laptop GPU, Intel Core Ultra 7 155H
6941 Points +168%
Xiaomi RedmiBook Pro 16 2024
Intel Arc 8-Core iGPU, Intel Core Ultra 7 155H
3656 Points +41%
Samsung Galaxy Book4 Pro 360
Intel Arc 7-Core iGPU, Intel Core Ultra 5 125H
3000 Points +16%
Average AMD Radeon 780M
  (1496 - 3196, n=59)
2711 Points +5%
HP Envy x360 2-in-1 16-ad0097nr
AMD Radeon 780M, AMD Ryzen 7 8840HS
2591 Points
Acer Swift Edge SFE16 Ryzen 7 7840U
AMD Radeon 780M, AMD Ryzen 7 7840U
2363 Points -9%
Acer Swift Go SFG16-71
Intel Iris Xe Graphics G7 96EUs, Intel Core i7-13700H
1787 Points -31%
Lenovo Yoga 7 2-in-1 16IML9
Intel Graphics 4-Core iGPU (Arc), Intel Core Ultra 5 125U
1704 Points -34%
LG Gram 2in1 16 16T90R - G.AA78G
Intel Iris Xe Graphics G7 96EUs, Intel Core i7-1360P
1662 Points -36%
Lenovo Thinkpad X1 Fold 16
Intel Iris Xe Graphics G7 96EUs, Intel Core i7-1250U
1209 Points -53%
Lenovo ThinkPad E16 G1 Core i5-1335U
Intel Iris Xe Graphics G7 80EUs, Intel Core i5-1335U
1150 Points -56%
2560x1440 Time Spy Score
Framework Laptop 16
AMD Radeon RX 7700S, AMD Ryzen 9 7940HS
10294 Points +256%
Dell XPS 16 9640
NVIDIA GeForce RTX 4070 Laptop GPU, Intel Core Ultra 7 155H
9774 Points +238%
HP Envy 16 h0112nr
NVIDIA GeForce RTX 3060 Laptop GPU, Intel Core i7-12700H
8190 Points +183%
HP Spectre x360 16 RTX 4050
NVIDIA GeForce RTX 4050 Laptop GPU, Intel Core Ultra 7 155H
6734 Points +133%
Xiaomi RedmiBook Pro 16 2024
Intel Arc 8-Core iGPU, Intel Core Ultra 7 155H
4042 Points +40%
Samsung Galaxy Book4 Pro 360
Intel Arc 7-Core iGPU, Intel Core Ultra 5 125H
3259 Points +13%
Average AMD Radeon 780M
  (1707 - 3517, n=59)
3022 Points +5%
HP Envy x360 2-in-1 16-ad0097nr
AMD Radeon 780M, AMD Ryzen 7 8840HS
2889 Points
Acer Swift Edge SFE16 Ryzen 7 7840U
AMD Radeon 780M, AMD Ryzen 7 7840U
2613 Points -10%
Acer Swift Go SFG16-71
Intel Iris Xe Graphics G7 96EUs, Intel Core i7-13700H
2038 Points -29%
Lenovo Yoga 7 2-in-1 16IML9
Intel Graphics 4-Core iGPU (Arc), Intel Core Ultra 5 125U
1919 Points -34%
LG Gram 2in1 16 16T90R - G.AA78G
Intel Iris Xe Graphics G7 96EUs, Intel Core i7-1360P
1866 Points -35%
Lenovo Thinkpad X1 Fold 16
Intel Iris Xe Graphics G7 96EUs, Intel Core i7-1250U
1361 Points -53%
Lenovo ThinkPad E16 G1 Core i5-1335U
Intel Iris Xe Graphics G7 80EUs, Intel Core i5-1335U
1310 Points -55%
3DMark 11 Performance
11932 pkt.
3DMark Cloud Gate Standard Score
32533 pkt.
3DMark Fire Strike Score
6823 pkt.
3DMark Time Spy Score
2889 pkt.
Pomoc
Blender
v3.3 Classroom OPTIX/RTX
HP Envy 16 h0112nr
NVIDIA GeForce RTX 3060 Laptop GPU, Intel Core i7-12700H
56 Seconds *
HP Spectre x360 16 RTX 4050
NVIDIA GeForce RTX 4050 Laptop GPU, Intel Core Ultra 7 155H
31 Seconds *
Dell XPS 16 9640
NVIDIA GeForce RTX 4070 Laptop GPU, Intel Core Ultra 7 155H
21 Seconds *
v3.3 Classroom CUDA
HP Envy 16 h0112nr
NVIDIA GeForce RTX 3060 Laptop GPU, Intel Core i7-12700H
89 Seconds *
HP Spectre x360 16 RTX 4050
NVIDIA GeForce RTX 4050 Laptop GPU, Intel Core Ultra 7 155H
54 Seconds *
Dell XPS 16 9640
NVIDIA GeForce RTX 4070 Laptop GPU, Intel Core Ultra 7 155H
36 Seconds *
v3.3 Classroom CPU
Lenovo Thinkpad X1 Fold 16
Intel Iris Xe Graphics G7 96EUs, Intel Core i7-1250U
1001 Seconds * -147%
Samsung Galaxy Book4 Pro 360
Intel Arc 7-Core iGPU, Intel Core Ultra 5 125H
671 Seconds * -66%
Lenovo ThinkPad E16 G1 Core i5-1335U
Intel Iris Xe Graphics G7 80EUs, Intel Core i5-1335U
658 Seconds * -62%
Lenovo Yoga 7 2-in-1 16IML9
Intel Graphics 4-Core iGPU (Arc), Intel Core Ultra 5 125U
648 Seconds * -60%
LG Gram 2in1 16 16T90R - G.AA78G
Intel Iris Xe Graphics G7 96EUs, Intel Core i7-1360P
607 Seconds * -50%
HP Envy 16 h0112nr
NVIDIA GeForce RTX 3060 Laptop GPU, Intel Core i7-12700H
462 Seconds * -14%
Acer Swift Edge SFE16 Ryzen 7 7840U
AMD Radeon 780M, AMD Ryzen 7 7840U
460 Seconds * -14%
Acer Swift Go SFG16-71
Intel Iris Xe Graphics G7 96EUs, Intel Core i7-13700H
452 Seconds * -12%
HP Envy x360 2-in-1 16-ad0097nr
AMD Radeon 780M, AMD Ryzen 7 8840HS
405 Seconds *
HP Spectre x360 16 RTX 4050
NVIDIA GeForce RTX 4050 Laptop GPU, Intel Core Ultra 7 155H
397 Seconds * +2%
Average AMD Radeon 780M
  (300 - 664, n=55)
375 Seconds * +7%
Xiaomi RedmiBook Pro 16 2024
Intel Arc 8-Core iGPU, Intel Core Ultra 7 155H
344 Seconds * +15%
Framework Laptop 16
AMD Radeon RX 7700S, AMD Ryzen 9 7940HS
311 Seconds * +23%
Dell XPS 16 9640
NVIDIA GeForce RTX 4070 Laptop GPU, Intel Core Ultra 7 155H
306 Seconds * +24%

* ... im mniej tym lepiej

Niestety, wydajność w grach jest konsekwentnie wolniejsza niż w przypadku przeciętnego laptopa w naszej bazie danych wyposażonego w ten sam procesor graficzny Radeon 780M, nawet po ustawieniu trybu wydajności. Prawdopodobnie wynika to z ogólnie wolniejszej wydajności procesora Ryzen 7 8840HS w porównaniu do zeszłorocznego Ryzen 7 7840HS, który tworzy więcej scenariuszy związanych z procesorem.

Performance Rating - Percent
HP Spectre x360 16 RTX 4050
Intel Core Ultra 7 155H, NVIDIA GeForce RTX 4050 Laptop GPU
100 pt
HP Envy x360 2-in-1 16-ad0097nr
AMD Ryzen 7 8840HS, AMD Radeon 780M
42.4 pt
Samsung Galaxy Book4 Pro 360 -1!
Intel Core Ultra 5 125H, Intel Arc 7-Core iGPU
39 pt
LG Gram 2in1 16 16T90R - G.AA78G
Intel Core i7-1360P, Intel Iris Xe Graphics G7 96EUs
35.9 pt
HP Envy x360 15-fe0072ng -1!
Intel Core i7-1355U, Intel Iris Xe Graphics G7 96EUs
32.8 pt
Lenovo Yoga 7 2-in-1 16IML9
Intel Core Ultra 5 125U, Intel Graphics 4-Core iGPU (Arc)
31.1 pt
The Witcher 3 - 1920x1080 Ultra Graphics & Postprocessing (HBAO+)
HP Spectre x360 16 RTX 4050
Intel Core Ultra 7 155H, NVIDIA GeForce RTX 4050 Laptop GPU
62.7 (57min) fps +118%
HP Envy x360 2-in-1 16-ad0097nr
AMD Ryzen 7 8840HS, AMD Radeon 780M
28.8 (24min) fps
Samsung Galaxy Book4 Pro 360
Intel Core Ultra 5 125H, Intel Arc 7-Core iGPU
18.3 (9min, 12P1) fps -36%
HP Envy x360 15-fe0072ng
Intel Core i7-1355U, Intel Iris Xe Graphics G7 96EUs
15 fps -48%
Lenovo Yoga 7 2-in-1 16IML9
Intel Core Ultra 5 125U, Intel Graphics 4-Core iGPU (Arc)
15 (11min) fps -48%
LG Gram 2in1 16 16T90R - G.AA78G
Intel Core i7-1360P, Intel Iris Xe Graphics G7 96EUs
13.9 (13min, 13P1) fps -52%
Final Fantasy XV Benchmark - 1920x1080 High Quality
HP Spectre x360 16 RTX 4050
Intel Core Ultra 7 155H, NVIDIA GeForce RTX 4050 Laptop GPU
68.6 fps +172%
HP Envy x360 2-in-1 16-ad0097nr
AMD Ryzen 7 8840HS, AMD Radeon 780M
25.2 fps
Samsung Galaxy Book4 Pro 360
Intel Core Ultra 5 125H, Intel Arc 7-Core iGPU
22.2 fps -12%
LG Gram 2in1 16 16T90R - G.AA78G
Intel Core i7-1360P, Intel Iris Xe Graphics G7 96EUs
17.2 fps -32%
HP Envy x360 15-fe0072ng
Intel Core i7-1355U, Intel Iris Xe Graphics G7 96EUs
17 fps -33%
Lenovo Yoga 7 2-in-1 16IML9
Intel Core Ultra 5 125U, Intel Graphics 4-Core iGPU (Arc)
16.3 fps -35%
Strange Brigade - 1920x1080 ultra AA:ultra AF:16
HP Spectre x360 16 RTX 4050
Intel Core Ultra 7 155H, NVIDIA GeForce RTX 4050 Laptop GPU
121.3 (49.1min, 95P1) fps +187%
HP Envy x360 2-in-1 16-ad0097nr
AMD Ryzen 7 8840HS, AMD Radeon 780M
42.2 (7.1min, 9.18P1) fps
Samsung Galaxy Book4 Pro 360
Intel Core Ultra 5 125H, Intel Arc 7-Core iGPU
40 fps -5%
Lenovo Yoga 7 2-in-1 16IML9
Intel Core Ultra 5 125U, Intel Graphics 4-Core iGPU (Arc)
30.2 (7.6min, 10.6P1) fps -28%
LG Gram 2in1 16 16T90R - G.AA78G
Intel Core i7-1360P, Intel Iris Xe Graphics G7 96EUs
28.5 (5.7min, 7.83P1) fps -32%
HP Envy x360 15-fe0072ng
Intel Core i7-1355U, Intel Iris Xe Graphics G7 96EUs
25.1 (5min, 6.02P1) fps -41%
Dota 2 Reborn - 1920x1080 ultra (3/3) best looking
HP Spectre x360 16 RTX 4050
Intel Core Ultra 7 155H, NVIDIA GeForce RTX 4050 Laptop GPU
106.4 (89.8min) fps +63%
HP Envy x360 2-in-1 16-ad0097nr
AMD Ryzen 7 8840HS, AMD Radeon 780M
65.4 (54.7min) fps
LG Gram 2in1 16 16T90R - G.AA78G
Intel Core i7-1360P, Intel Iris Xe Graphics G7 96EUs
62.9 (53.2min) fps -4%
Samsung Galaxy Book4 Pro 360
Intel Core Ultra 5 125H, Intel Arc 7-Core iGPU
58.7 (42.1min) fps -10%
Lenovo Yoga 7 2-in-1 16IML9
Intel Core Ultra 5 125U, Intel Graphics 4-Core iGPU (Arc)
57.6 (37.5min) fps -12%
HP Envy x360 15-fe0072ng
Intel Core i7-1355U, Intel Iris Xe Graphics G7 96EUs
54.7 (46.7min) fps -16%
X-Plane 11.11 - 1920x1080 high (fps_test=3)
HP Spectre x360 16 RTX 4050
Intel Core Ultra 7 155H, NVIDIA GeForce RTX 4050 Laptop GPU
69.7 fps +150%
LG Gram 2in1 16 16T90R - G.AA78G
Intel Core i7-1360P, Intel Iris Xe Graphics G7 96EUs
37.95 fps +36%
Samsung Galaxy Book4 Pro 360
Intel Core Ultra 5 125H, Intel Arc 7-Core iGPU
31.5 fps +13%
HP Envy x360 15-fe0072ng
Intel Core i7-1355U, Intel Iris Xe Graphics G7 96EUs
30 fps +8%
HP Envy x360 2-in-1 16-ad0097nr
AMD Ryzen 7 8840HS, AMD Radeon 780M
27.9 fps
Lenovo Yoga 7 2-in-1 16IML9
Intel Core Ultra 5 125U, Intel Graphics 4-Core iGPU (Arc)
23.4 fps -16%
Far Cry 5 - 1920x1080 Ultra Preset AA:T
HP Spectre x360 16 RTX 4050
Intel Core Ultra 7 155H, NVIDIA GeForce RTX 4050 Laptop GPU
87 (64min) fps +181%
HP Envy x360 2-in-1 16-ad0097nr
AMD Ryzen 7 8840HS, AMD Radeon 780M
31 (23min) fps
LG Gram 2in1 16 16T90R - G.AA78G
Intel Core i7-1360P, Intel Iris Xe Graphics G7 96EUs
27 (24min) fps -13%
Lenovo Yoga 7 2-in-1 16IML9
Intel Core Ultra 5 125U, Intel Graphics 4-Core iGPU (Arc)
23 (20min) fps -26%
Tiny Tina's Wonderlands
1280x720 Lowest Preset (DX12)
Average AMD Radeon 780M
  (62.6 - 151.2, n=23)
116.7 fps +20%
HP Envy x360 2-in-1 16-ad0097nr
AMD Ryzen 7 8840HS, AMD Radeon 780M
97.4 fps
Acer Swift Edge SFE16 Ryzen 7 7840U
AMD Ryzen 7 7840U, AMD Radeon 780M
62.6 fps -36%
Lenovo Yoga 7 2-in-1 16IML9
Intel Core Ultra 5 125U, Intel Graphics 4-Core iGPU (Arc)
54.8 fps -44%
Lenovo ThinkPad E16 G1 Core i5-1335U
Intel Core i5-1335U, Intel Iris Xe Graphics G7 80EUs
38.1 fps -61%
1920x1080 Low Preset (DX12)
HP Spectre x360 16 RTX 4050
Intel Core Ultra 7 155H, NVIDIA GeForce RTX 4050 Laptop GPU
135.1 fps +171%
Average AMD Radeon 780M
  (34.3 - 77.7, n=23)
61.7 fps +24%
HP Envy x360 2-in-1 16-ad0097nr
AMD Ryzen 7 8840HS, AMD Radeon 780M
49.8 fps
Acer Swift Edge SFE16 Ryzen 7 7840U
AMD Ryzen 7 7840U, AMD Radeon 780M
34.3 fps -31%
Lenovo Yoga 7 2-in-1 16IML9
Intel Core Ultra 5 125U, Intel Graphics 4-Core iGPU (Arc)
29.9 fps -40%
Lenovo ThinkPad E16 G1 Core i5-1335U
Intel Core i5-1335U, Intel Iris Xe Graphics G7 80EUs
20.6 fps -59%
1920x1080 Medium Preset (DX12)
HP Spectre x360 16 RTX 4050
Intel Core Ultra 7 155H, NVIDIA GeForce RTX 4050 Laptop GPU
113.4 fps +198%
Average AMD Radeon 780M
  (28.4 - 55.9, n=23)
45.1 fps +19%
HP Envy x360 2-in-1 16-ad0097nr
AMD Ryzen 7 8840HS, AMD Radeon 780M
38 fps
Acer Swift Edge SFE16 Ryzen 7 7840U
AMD Ryzen 7 7840U, AMD Radeon 780M
28.4 fps -25%
Lenovo Yoga 7 2-in-1 16IML9
Intel Core Ultra 5 125U, Intel Graphics 4-Core iGPU (Arc)
24 fps -37%
Lenovo ThinkPad E16 G1 Core i5-1335U
Intel Core i5-1335U, Intel Iris Xe Graphics G7 80EUs
15.3 fps -60%
1920x1080 High Preset (DX12)
HP Spectre x360 16 RTX 4050
Intel Core Ultra 7 155H, NVIDIA GeForce RTX 4050 Laptop GPU
75.4 fps +214%
Average AMD Radeon 780M
  (18.6 - 38.8, n=23)
31.3 fps +30%
HP Envy x360 2-in-1 16-ad0097nr
AMD Ryzen 7 8840HS, AMD Radeon 780M
24 fps
Acer Swift Edge SFE16 Ryzen 7 7840U
AMD Ryzen 7 7840U, AMD Radeon 780M
18.6 fps -22%
Lenovo Yoga 7 2-in-1 16IML9
Intel Core Ultra 5 125U, Intel Graphics 4-Core iGPU (Arc)
16.1 fps -33%
Lenovo ThinkPad E16 G1 Core i5-1335U
Intel Core i5-1335U, Intel Iris Xe Graphics G7 80EUs
10.4 fps -57%
1920x1080 Badass Preset (DX12)
HP Spectre x360 16 RTX 4050
Intel Core Ultra 7 155H, NVIDIA GeForce RTX 4050 Laptop GPU
59.1 fps +203%
Average AMD Radeon 780M
  (16.5 - 31.3, n=23)
25.7 fps +32%
HP Envy x360 2-in-1 16-ad0097nr
AMD Ryzen 7 8840HS, AMD Radeon 780M
19.5 fps
Acer Swift Edge SFE16 Ryzen 7 7840U
AMD Ryzen 7 7840U, AMD Radeon 780M
16.5 fps -15%
Lenovo Yoga 7 2-in-1 16IML9
Intel Core Ultra 5 125U, Intel Graphics 4-Core iGPU (Arc)
12.7 fps -35%
Lenovo ThinkPad E16 G1 Core i5-1335U
Intel Core i5-1335U, Intel Iris Xe Graphics G7 80EUs
8.1 fps -58%
Far Cry 5
1280x720 Low Preset AA:T
Dell XPS 16 9640
Intel Core Ultra 7 155H, NVIDIA GeForce RTX 4070 Laptop GPU
140 fps +122%
HP Spectre x360 16 RTX 4050
Intel Core Ultra 7 155H, NVIDIA GeForce RTX 4050 Laptop GPU
97 (3min) fps +54%
Xiaomi RedmiBook Pro 16 2024
Intel Core Ultra 7 155H, Intel Arc 8-Core iGPU
84 fps +33%
Average AMD Radeon 780M
  (42 - 89, n=44)
72 fps +14%
HP Envy x360 2-in-1 16-ad0097nr
AMD Ryzen 7 8840HS, AMD Radeon 780M
63 (46min) fps
Acer Swift Edge SFE16 Ryzen 7 7840U
AMD Ryzen 7 7840U, AMD Radeon 780M
53 (45min) fps -16%
Lenovo Yoga 7 2-in-1 16IML9
Intel Core Ultra 5 125U, Intel Graphics 4-Core iGPU (Arc)
46 (39min) fps -27%
Lenovo ThinkPad E16 G1 Core i5-1335U
Intel Core i5-1335U, Intel Iris Xe Graphics G7 80EUs
40 (35min) fps -37%
Samsung Galaxy Book4 Pro 360
Intel Core Ultra 5 125H, Intel Arc 7-Core iGPU
37 fps -41%
Lenovo Thinkpad X1 Fold 16
Intel Core i7-1250U, Intel Iris Xe Graphics G7 96EUs
27 (22min) fps -57%
1920x1080 Medium Preset AA:T
Dell XPS 16 9640
Intel Core Ultra 7 155H, NVIDIA GeForce RTX 4070 Laptop GPU
126 fps +250%
HP Spectre x360 16 RTX 4050
Intel Core Ultra 7 155H, NVIDIA GeForce RTX 4050 Laptop GPU
93 (13min) fps +158%
Xiaomi RedmiBook Pro 16 2024
Intel Core Ultra 7 155H, Intel Arc 8-Core iGPU
52 fps +44%
Average AMD Radeon 780M
  (22 - 54, n=46)
42.2 fps +17%
HP Envy x360 2-in-1 16-ad0097nr
AMD Ryzen 7 8840HS, AMD Radeon 780M
36 (6min) fps
Samsung Galaxy Book4 Pro 360
Intel Core Ultra 5 125H, Intel Arc 7-Core iGPU
34 fps -6%
Acer Swift Edge SFE16 Ryzen 7 7840U
AMD Ryzen 7 7840U, AMD Radeon 780M
28 (6min) fps -22%
Lenovo Yoga 7 2-in-1 16IML9
Intel Core Ultra 5 125U, Intel Graphics 4-Core iGPU (Arc)
25 (17min) fps -31%
Lenovo ThinkPad E16 G1 Core i5-1335U
Intel Core i5-1335U, Intel Iris Xe Graphics G7 80EUs
19 (18min) fps -47%
Lenovo Thinkpad X1 Fold 16
Intel Core i7-1250U, Intel Iris Xe Graphics G7 96EUs
18 (15min) fps -50%
1920x1080 High Preset AA:T
Dell XPS 16 9640
Intel Core Ultra 7 155H, NVIDIA GeForce RTX 4070 Laptop GPU
122 fps +270%
HP Spectre x360 16 RTX 4050
Intel Core Ultra 7 155H, NVIDIA GeForce RTX 4050 Laptop GPU
95 (75min) fps +188%
Xiaomi RedmiBook Pro 16 2024
Intel Core Ultra 7 155H, Intel Arc 8-Core iGPU
48 fps +45%
Average AMD Radeon 780M
  (21 - 49, n=46)
38.9 fps +18%
HP Envy x360 2-in-1 16-ad0097nr
AMD Ryzen 7 8840HS, AMD Radeon 780M
33 (20min) fps
Samsung Galaxy Book4 Pro 360
Intel Core Ultra 5 125H, Intel Arc 7-Core iGPU
31 fps -6%
LG Gram 2in1 16 16T90R - G.AA78G
Intel Core i7-1360P, Intel Iris Xe Graphics G7 96EUs
29 (26min) fps -12%
Acer Swift Edge SFE16 Ryzen 7 7840U
AMD Ryzen 7 7840U, AMD Radeon 780M
26 (16min) fps -21%
Lenovo Yoga 7 2-in-1 16IML9
Intel Core Ultra 5 125U, Intel Graphics 4-Core iGPU (Arc)
25 (22min) fps -24%
Lenovo ThinkPad E16 G1 Core i5-1335U
Intel Core i5-1335U, Intel Iris Xe Graphics G7 80EUs
18 (16min) fps -45%
Lenovo Thinkpad X1 Fold 16
Intel Core i7-1250U, Intel Iris Xe Graphics G7 96EUs
16 (14min) fps -52%
1920x1080 Ultra Preset AA:T
Dell XPS 16 9640
Intel Core Ultra 7 155H, NVIDIA GeForce RTX 4070 Laptop GPU
115 fps +271%
HP Spectre x360 16 RTX 4050
Intel Core Ultra 7 155H, NVIDIA GeForce RTX 4050 Laptop GPU
87 (64min) fps +181%
Xiaomi RedmiBook Pro 16 2024
Intel Core Ultra 7 155H, Intel Arc 8-Core iGPU
45 fps +45%
Average AMD Radeon 780M
  (21 - 47, n=46)
37 fps +19%
HP Envy x360 2-in-1 16-ad0097nr
AMD Ryzen 7 8840HS, AMD Radeon 780M
31 (23min) fps
LG Gram 2in1 16 16T90R - G.AA78G
Intel Core i7-1360P, Intel Iris Xe Graphics G7 96EUs
27 (24min) fps -13%
Acer Swift Edge SFE16 Ryzen 7 7840U
AMD Ryzen 7 7840U, AMD Radeon 780M
24 (22min) fps -23%
Lenovo Yoga 7 2-in-1 16IML9
Intel Core Ultra 5 125U, Intel Graphics 4-Core iGPU (Arc)
23 (20min) fps -26%
Lenovo ThinkPad E16 G1 Core i5-1335U
Intel Core i5-1335U, Intel Iris Xe Graphics G7 80EUs
17 (15min) fps -45%
Lenovo Thinkpad X1 Fold 16
Intel Core i7-1250U, Intel Iris Xe Graphics G7 96EUs
15 (13min) fps -52%
The Witcher 3
1024x768 Low Graphics & Postprocessing
HP Envy 16 h0112nr
Intel Core i7-12700H, NVIDIA GeForce RTX 3060 Laptop GPU
402.3 (361min) fps +211%
Dell XPS 16 9640
Intel Core Ultra 7 155H, NVIDIA GeForce RTX 4070 Laptop GPU
399 fps +209%
HP Spectre x360 16 RTX 4050
Intel Core Ultra 7 155H, NVIDIA GeForce RTX 4050 Laptop GPU
299 (264min) fps +131%
Xiaomi RedmiBook Pro 16 2024
Intel Core Ultra 7 155H, Intel Arc 8-Core iGPU
157 fps +22%
Average AMD Radeon 780M
  (74 - 163.3, n=37)
136.9 fps +6%
Samsung Galaxy Book4 Pro 360
Intel Core Ultra 5 125H, Intel Arc 7-Core iGPU
136 fps +5%
HP Envy x360 2-in-1 16-ad0097nr
AMD Ryzen 7 8840HS, AMD Radeon 780M
129.2 (115min) fps
Acer Swift Edge SFE16 Ryzen 7 7840U
AMD Ryzen 7 7840U, AMD Radeon 780M
109.8 (92min) fps -15%
Lenovo Yoga 7 2-in-1 16IML9
Intel Core Ultra 5 125U, Intel Graphics 4-Core iGPU (Arc)
86.8 (78min) fps -33%
Lenovo Thinkpad X1 Fold 16
Intel Core i7-1250U, Intel Iris Xe Graphics G7 96EUs
75.3 (59min) fps -42%
Lenovo ThinkPad E16 G1 Core i5-1335U
Intel Core i5-1335U, Intel Iris Xe Graphics G7 80EUs
73.6 (57min) fps -43%
1366x768 Medium Graphics & Postprocessing
Dell XPS 16 9640
Intel Core Ultra 7 155H, NVIDIA GeForce RTX 4070 Laptop GPU
327 fps
HP Envy 16 h0112nr
Intel Core i7-12700H, NVIDIA GeForce RTX 3060 Laptop GPU
264 (250min) fps
HP Spectre x360 16 RTX 4050
Intel Core Ultra 7 155H, NVIDIA GeForce RTX 4050 Laptop GPU
209.6 (183min) fps
Xiaomi RedmiBook Pro 16 2024
Intel Core Ultra 7 155H, Intel Arc 8-Core iGPU
97 fps
Average AMD Radeon 780M
  (47.7 - 103.8, n=21)
89.6 fps
Samsung Galaxy Book4 Pro 360
Intel Core Ultra 5 125H, Intel Arc 7-Core iGPU
85 fps
Acer Swift Go SFG16-71
Intel Core i7-13700H, Intel Iris Xe Graphics G7 96EUs
67.2 fps
Lenovo Yoga 7 2-in-1 16IML9
Intel Core Ultra 5 125U, Intel Graphics 4-Core iGPU (Arc)
49.6 (40min) fps
Lenovo Thinkpad X1 Fold 16
Intel Core i7-1250U, Intel Iris Xe Graphics G7 96EUs
47.7 (44min) fps
Lenovo ThinkPad E16 G1 Core i5-1335U
Intel Core i5-1335U, Intel Iris Xe Graphics G7 80EUs
45.1 (40min) fps
LG Gram 2in1 16 16T90R - G.AA78G
Intel Core i7-1360P, Intel Iris Xe Graphics G7 96EUs
37.2 (10min) fps
1920x1080 High Graphics & Postprocessing (Nvidia HairWorks Off)
Dell XPS 16 9640
Intel Core Ultra 7 155H, NVIDIA GeForce RTX 4070 Laptop GPU
195 fps +310%
HP Envy 16 h0112nr
Intel Core i7-12700H, NVIDIA GeForce RTX 3060 Laptop GPU
161.2 (152min) fps +239%
HP Spectre x360 16 RTX 4050
Intel Core Ultra 7 155H, NVIDIA GeForce RTX 4050 Laptop GPU
120.1 (108min) fps +152%
Xiaomi RedmiBook Pro 16 2024
Intel Core Ultra 7 155H, Intel Arc 8-Core iGPU
57 fps +20%
Samsung Galaxy Book4 Pro 360
Intel Core Ultra 5 125H, Intel Arc 7-Core iGPU
51 fps +7%
HP Envy x360 2-in-1 16-ad0097nr
AMD Ryzen 7 8840HS, AMD Radeon 780M
47.6 (33min) fps
Average AMD Radeon 780M
  (21.3 - 52.2, n=45)
44.2 fps -7%
Acer Swift Edge SFE16 Ryzen 7 7840U
AMD Ryzen 7 7840U, AMD Radeon 780M
36.1 (27min) fps -24%
Lenovo Yoga 7 2-in-1 16IML9
Intel Core Ultra 5 125U, Intel Graphics 4-Core iGPU (Arc)
28.4 (25min) fps -40%
Lenovo Thinkpad X1 Fold 16
Intel Core i7-1250U, Intel Iris Xe Graphics G7 96EUs
25.8 (23min) fps -46%
Acer Swift Go SFG16-71
Intel Core i7-13700H, Intel Iris Xe Graphics G7 96EUs
23.1 fps -51%
Lenovo ThinkPad E16 G1 Core i5-1335U
Intel Core i5-1335U, Intel Iris Xe Graphics G7 80EUs
22.1 (19min) fps -54%
1920x1080 Ultra Graphics & Postprocessing (HBAO+)
Dell XPS 16 9640
Intel Core Ultra 7 155H, NVIDIA GeForce RTX 4070 Laptop GPU
87.8 (77min, 83P1) fps +205%
HP Envy 16 h0112nr
Intel Core i7-12700H, NVIDIA GeForce RTX 3060 Laptop GPU
82.8 (78min) fps +188%
HP Spectre x360 16 RTX 4050
Intel Core Ultra 7 155H, NVIDIA GeForce RTX 4050 Laptop GPU
62.7 (57min) fps +118%
HP Envy x360 2-in-1 16-ad0097nr
AMD Ryzen 7 8840HS, AMD Radeon 780M
28.8 (24min) fps
Average AMD Radeon 780M
  (14.3 - 36, n=47)
28 fps -3%
Xiaomi RedmiBook Pro 16 2024
Intel Core Ultra 7 155H, Intel Arc 8-Core iGPU
25.1 (23min, 24P1) fps -13%
Acer Swift Edge SFE16 Ryzen 7 7840U
AMD Ryzen 7 7840U, AMD Radeon 780M
20.4 (18min) fps -29%
Samsung Galaxy Book4 Pro 360
Intel Core Ultra 5 125H, Intel Arc 7-Core iGPU
18.3 (9min, 12P1) fps -36%
Acer Swift Go SFG16-71
Intel Core i7-13700H, Intel Iris Xe Graphics G7 96EUs
17.3 fps -40%
Lenovo Yoga 7 2-in-1 16IML9
Intel Core Ultra 5 125U, Intel Graphics 4-Core iGPU (Arc)
15 (11min) fps -48%
LG Gram 2in1 16 16T90R - G.AA78G
Intel Core i7-1360P, Intel Iris Xe Graphics G7 96EUs
13.9 (13min, 13P1) fps -52%
Lenovo Thinkpad X1 Fold 16
Intel Core i7-1250U, Intel Iris Xe Graphics G7 96EUs
11.6 (10min) fps -60%
Lenovo ThinkPad E16 G1 Core i5-1335U
Intel Core i5-1335U, Intel Iris Xe Graphics G7 80EUs
11.1 (10min) fps -61%
Final Fantasy XV Benchmark
1280x720 Lite Quality
HP Envy 16 h0112nr
Intel Core i7-12700H, NVIDIA GeForce RTX 3060 Laptop GPU
177.2 fps +175%
Dell XPS 16 9640
Intel Core Ultra 7 155H, NVIDIA GeForce RTX 4070 Laptop GPU
150.2 fps +133%
HP Spectre x360 16 RTX 4050
Intel Core Ultra 7 155H, NVIDIA GeForce RTX 4050 Laptop GPU
132.7 fps +106%
Xiaomi RedmiBook Pro 16 2024
Intel Core Ultra 7 155H, Intel Arc 8-Core iGPU
84.1 fps +30%
Average AMD Radeon 780M
  (41.1 - 84.5, n=56)
70.7 fps +10%
HP Envy x360 2-in-1 16-ad0097nr
AMD Ryzen 7 8840HS, AMD Radeon 780M
64.5 fps
Samsung Galaxy Book4 Pro 360
Intel Core Ultra 5 125H, Intel Arc 7-Core iGPU
52.1 fps -19%
Acer Swift Edge SFE16 Ryzen 7 7840U
AMD Ryzen 7 7840U, AMD Radeon 780M
50.5 fps -22%
LG Gram 2in1 16 16T90R - G.AA78G
Intel Core i7-1360P, Intel Iris Xe Graphics G7 96EUs
46.8 fps -27%
Lenovo Yoga 7 2-in-1 16IML9
Intel Core Ultra 5 125U, Intel Graphics 4-Core iGPU (Arc)
37.6 fps -42%
Lenovo Thinkpad X1 Fold 16
Intel Core i7-1250U, Intel Iris Xe Graphics G7 96EUs
33.2 fps -49%
Lenovo ThinkPad E16 G1 Core i5-1335U
Intel Core i5-1335U, Intel Iris Xe Graphics G7 80EUs
31 fps -52%
1920x1080 Standard Quality
Dell XPS 16 9640
Intel Core Ultra 7 155H, NVIDIA GeForce RTX 4070 Laptop GPU
123.2 fps +261%
HP Envy 16 h0112nr
Intel Core i7-12700H, NVIDIA GeForce RTX 3060 Laptop GPU
111.7 fps +228%
HP Spectre x360 16 RTX 4050
Intel Core Ultra 7 155H, NVIDIA GeForce RTX 4050 Laptop GPU
94.5 fps +177%
Xiaomi RedmiBook Pro 16 2024
Intel Core Ultra 7 155H, Intel Arc 8-Core iGPU
45 fps +32%
Average AMD Radeon 780M
  (21 - 40.9, n=57)
35.3 fps +4%
HP Envy x360 2-in-1 16-ad0097nr
AMD Ryzen 7 8840HS, AMD Radeon 780M
34.1 fps
Samsung Galaxy Book4 Pro 360
Intel Core Ultra 5 125H, Intel Arc 7-Core iGPU
32.4 fps -5%
Acer Swift Edge SFE16 Ryzen 7 7840U
AMD Ryzen 7 7840U, AMD Radeon 780M
27.4 fps -20%
Acer Swift Go SFG16-71
Intel Core i7-13700H, Intel Iris Xe Graphics G7 96EUs
25.2 fps -26%
LG Gram 2in1 16 16T90R - G.AA78G
Intel Core i7-1360P, Intel Iris Xe Graphics G7 96EUs
23.8 fps -30%
Lenovo Yoga 7 2-in-1 16IML9
Intel Core Ultra 5 125U, Intel Graphics 4-Core iGPU (Arc)
23 fps -33%
Lenovo Thinkpad X1 Fold 16
Intel Core i7-1250U, Intel Iris Xe Graphics G7 96EUs
18.5 fps -46%
Lenovo ThinkPad E16 G1 Core i5-1335U
Intel Core i5-1335U, Intel Iris Xe Graphics G7 80EUs
16.9 fps -50%
1920x1080 High Quality
Dell XPS 16 9640
Intel Core Ultra 7 155H, NVIDIA GeForce RTX 4070 Laptop GPU
93.1 fps +269%
HP Envy 16 h0112nr
Intel Core i7-12700H, NVIDIA GeForce RTX 3060 Laptop GPU
83.9 fps +233%
HP Spectre x360 16 RTX 4050
Intel Core Ultra 7 155H, NVIDIA GeForce RTX 4050 Laptop GPU
68.6 fps +172%
Xiaomi RedmiBook Pro 16 2024
Intel Core Ultra 7 155H, Intel Arc 8-Core iGPU
30.6 fps +21%
Average AMD Radeon 780M
  (15.9 - 30.8, n=58)
26.4 fps +5%
HP Envy x360 2-in-1 16-ad0097nr
AMD Ryzen 7 8840HS, AMD Radeon 780M
25.2 fps
Samsung Galaxy Book4 Pro 360
Intel Core Ultra 5 125H, Intel Arc 7-Core iGPU
22.2 fps -12%
Acer Swift Edge SFE16 Ryzen 7 7840U
AMD Ryzen 7 7840U, AMD Radeon 780M
21.2 fps -16%
Acer Swift Go SFG16-71
Intel Core i7-13700H, Intel Iris Xe Graphics G7 96EUs
17.7 fps -30%
LG Gram 2in1 16 16T90R - G.AA78G
Intel Core i7-1360P, Intel Iris Xe Graphics G7 96EUs
17.2 fps -32%
Lenovo Yoga 7 2-in-1 16IML9
Intel Core Ultra 5 125U, Intel Graphics 4-Core iGPU (Arc)
16.3 fps -35%
Lenovo Thinkpad X1 Fold 16
Intel Core i7-1250U, Intel Iris Xe Graphics G7 96EUs
15.7 fps -38%
Lenovo ThinkPad E16 G1 Core i5-1335U
Intel Core i5-1335U, Intel Iris Xe Graphics G7 80EUs
12.1 fps -52%
Strange Brigade
1280x720 lowest AF:1
Dell XPS 16 9640
Intel Core Ultra 7 155H, NVIDIA GeForce RTX 4070 Laptop GPU
423 fps +206%
HP Envy 16 h0112nr
Intel Core i7-12700H, NVIDIA GeForce RTX 3060 Laptop GPU
418 (205min, 325P1) fps +202%
HP Spectre x360 16 RTX 4050
Intel Core Ultra 7 155H, NVIDIA GeForce RTX 4050 Laptop GPU
299 (47.1min, 215P1) fps +116%
Xiaomi RedmiBook Pro 16 2024
Intel Core Ultra 7 155H, Intel Arc 8-Core iGPU
205 fps +48%
Average AMD Radeon 780M
  (74.1 - 175.9, n=49)
149.1 fps +8%
Acer Swift Edge SFE16 Ryzen 7 7840U
AMD Ryzen 7 7840U, AMD Radeon 780M
139.8 (22.4min, 111.2P1) fps +1%
HP Envy x360 2-in-1 16-ad0097nr
AMD Ryzen 7 8840HS, AMD Radeon 780M
138.2 (14.6min, 108.4P1) fps
Samsung Galaxy Book4 Pro 360
Intel Core Ultra 5 125H, Intel Arc 7-Core iGPU
133 fps -4%
Lenovo Yoga 7 2-in-1 16IML9
Intel Core Ultra 5 125U, Intel Graphics 4-Core iGPU (Arc)
120.4 (39.2min, 96.2P1) fps -13%
Acer Swift Go SFG16-71
Intel Core i7-13700H, Intel Iris Xe Graphics G7 96EUs
102.3 (23min, 39.4P1) fps -26%
LG Gram 2in1 16 16T90R - G.AA78G
Intel Core i7-1360P, Intel Iris Xe Graphics G7 96EUs
97.6 (11.3min, 36.4P1) fps -29%
Lenovo ThinkPad E16 G1 Core i5-1335U
Intel Core i5-1335U, Intel Iris Xe Graphics G7 80EUs
70.3 (16.2min, 22.7P1) fps -49%
Lenovo Thinkpad X1 Fold 16
Intel Core i7-1250U, Intel Iris Xe Graphics G7 96EUs
70.2 (15.4min, 22.4P1) fps -49%
1920x1080 medium AA:medium AF:4
Dell XPS 16 9640
Intel Core Ultra 7 155H, NVIDIA GeForce RTX 4070 Laptop GPU
258 fps +328%
HP Envy 16 h0112nr
Intel Core i7-12700H, NVIDIA GeForce RTX 3060 Laptop GPU
202 (59min, 164.6P1) fps +235%
HP Spectre x360 16 RTX 4050
Intel Core Ultra 7 155H, NVIDIA GeForce RTX 4050 Laptop GPU
171.1 (14.5min, 135.8P1) fps +184%
Xiaomi RedmiBook Pro 16 2024
Intel Core Ultra 7 155H, Intel Arc 8-Core iGPU
84 fps +39%
Samsung Galaxy Book4 Pro 360
Intel Core Ultra 5 125H, Intel Arc 7-Core iGPU
63 fps +4%
Average AMD Radeon 780M
  (31.7 - 70.9, n=50)
62.3 fps +3%
Acer Swift Edge SFE16 Ryzen 7 7840U
AMD Ryzen 7 7840U, AMD Radeon 780M
60.6 (11.7min, 51.7P1) fps 0%
HP Envy x360 2-in-1 16-ad0097nr
AMD Ryzen 7 8840HS, AMD Radeon 780M
60.3 (10.3min, 50.5P1) fps
Lenovo Yoga 7 2-in-1 16IML9
Intel Core Ultra 5 125U, Intel Graphics 4-Core iGPU (Arc)
50 (24.3min, 41.3P1) fps -17%
Acer Swift Go SFG16-71
Intel Core i7-13700H, Intel Iris Xe Graphics G7 96EUs
45.4 (21.8min, 26P1) fps -25%
LG Gram 2in1 16 16T90R - G.AA78G
Intel Core i7-1360P, Intel Iris Xe Graphics G7 96EUs
43.8 (9min, 24P1) fps -27%
Lenovo Thinkpad X1 Fold 16
Intel Core i7-1250U, Intel Iris Xe Graphics G7 96EUs
31.5 (8.5min, 15.9P1) fps -48%
Lenovo ThinkPad E16 G1 Core i5-1335U
Intel Core i5-1335U, Intel Iris Xe Graphics G7 80EUs
27.3 (7.9min, 12.3P1) fps -55%
1920x1080 high AA:high AF:8
Dell XPS 16 9640
Intel Core Ultra 7 155H, NVIDIA GeForce RTX 4070 Laptop GPU
202 fps +302%
HP Envy 16 h0112nr
Intel Core i7-12700H, NVIDIA GeForce RTX 3060 Laptop GPU
162 (110.3min, 118.7P1) fps +223%
HP Spectre x360 16 RTX 4050
Intel Core Ultra 7 155H, NVIDIA GeForce RTX 4050 Laptop GPU
137.4 (50.7min, 105.7P1) fps +174%
Xiaomi RedmiBook Pro 16 2024
Intel Core Ultra 7 155H, Intel Arc 8-Core iGPU
64 fps +27%
Average AMD Radeon 780M
  (27.3 - 60.6, n=50)
52.6 fps +5%
HP Envy x360 2-in-1 16-ad0097nr
AMD Ryzen 7 8840HS, AMD Radeon 780M
50.2 (8.3min, 15.8P1) fps
Samsung Galaxy Book4 Pro 360
Intel Core Ultra 5 125H, Intel Arc 7-Core iGPU
50 fps 0%
Acer Swift Edge SFE16 Ryzen 7 7840U
AMD Ryzen 7 7840U, AMD Radeon 780M
49.5 (8min, 13.9P1) fps -1%
Lenovo Yoga 7 2-in-1 16IML9
Intel Core Ultra 5 125U, Intel Graphics 4-Core iGPU (Arc)
39.2 (10min, 24P1) fps -22%
Acer Swift Go SFG16-71
Intel Core i7-13700H, Intel Iris Xe Graphics G7 96EUs
35.5 (9.9min, 16.8P1) fps -29%
LG Gram 2in1 16 16T90R - G.AA78G
Intel Core i7-1360P, Intel Iris Xe Graphics G7 96EUs
35.3 (9min, 14.1P1) fps -30%
Lenovo Thinkpad X1 Fold 16
Intel Core i7-1250U, Intel Iris Xe Graphics G7 96EUs
24.1 (6.2min, 8.71P1) fps -52%
Lenovo ThinkPad E16 G1 Core i5-1335U
Intel Core i5-1335U, Intel Iris Xe Graphics G7 80EUs
22.4 (5.7min, 7.62P1) fps -55%
1920x1080 ultra AA:ultra AF:16
Dell XPS 16 9640
Intel Core Ultra 7 155H, NVIDIA GeForce RTX 4070 Laptop GPU
175 fps +315%
HP Envy 16 h0112nr
Intel Core i7-12700H, NVIDIA GeForce RTX 3060 Laptop GPU
140.4 (96.1min, 105.2P1) fps +233%
HP Spectre x360 16 RTX 4050
Intel Core Ultra 7 155H, NVIDIA GeForce RTX 4050 Laptop GPU
121.3 (49.1min, 95P1) fps +187%
Xiaomi RedmiBook Pro 16 2024
Intel Core Ultra 7 155H, Intel Arc 8-Core iGPU
53 fps +26%
Average AMD Radeon 780M
  (23.5 - 52.1, n=51)
44.9 fps +6%
HP Envy x360 2-in-1 16-ad0097nr
AMD Ryzen 7 8840HS, AMD Radeon 780M
42.2 (7.1min, 9.18P1) fps
Acer Swift Edge SFE16 Ryzen 7 7840U
AMD Ryzen 7 7840U, AMD Radeon 780M
41.3 (7.5min, 9.37P1) fps -2%
Samsung Galaxy Book4 Pro 360
Intel Core Ultra 5 125H, Intel Arc 7-Core iGPU
40 fps -5%
Lenovo Yoga 7 2-in-1 16IML9
Intel Core Ultra 5 125U, Intel Graphics 4-Core iGPU (Arc)
30.2 (7.6min, 10.6P1) fps -28%
Acer Swift Go SFG16-71
Intel Core i7-13700H, Intel Iris Xe Graphics G7 96EUs
28.7 (5.6min, 9.49P1) fps -32%
LG Gram 2in1 16 16T90R - G.AA78G
Intel Core i7-1360P, Intel Iris Xe Graphics G7 96EUs
28.5 (5.7min, 7.83P1) fps -32%
Lenovo Thinkpad X1 Fold 16
Intel Core i7-1250U, Intel Iris Xe Graphics G7 96EUs
19 (5min, 5P1) fps -55%
Lenovo ThinkPad E16 G1 Core i5-1335U
Intel Core i5-1335U, Intel Iris Xe Graphics G7 80EUs
18.3 (5min, 5P1) fps -57%
F1 22
1280x720 Ultra Low Preset AA:T AF:16x
HP Spectre x360 16 RTX 4050
Intel Core Ultra 7 155H, NVIDIA GeForce RTX 4050 Laptop GPU
175.1 (117min, 95P1) fps +38%
Average AMD Radeon 780M
  (85.4 - 186.7, n=27)
143.5 fps +13%
HP Envy x360 2-in-1 16-ad0097nr
AMD Ryzen 7 8840HS, AMD Radeon 780M
126.9 (104min, 83P1) fps
Acer Swift Edge SFE16 Ryzen 7 7840U
AMD Ryzen 7 7840U, AMD Radeon 780M
106.1 (89min, 65P1) fps -16%
Acer Swift Go SFG16-71
Intel Core i7-13700H, Intel Iris Xe Graphics G7 96EUs
86.8 (69min, 54P1) fps -32%
Lenovo Yoga 7 2-in-1 16IML9
Intel Core Ultra 5 125U, Intel Graphics 4-Core iGPU (Arc)
63.9 (54min, 53P1) fps -50%
Lenovo Thinkpad X1 Fold 16
Intel Core i7-1250U, Intel Iris Xe Graphics G7 96EUs
59.4 (49min, 47P1) fps -53%
Lenovo ThinkPad E16 G1 Core i5-1335U
Intel Core i5-1335U, Intel Iris Xe Graphics G7 80EUs
56.6 (45min, 44P1) fps -55%
1920x1080 Low Preset AA:T AF:16x
HP Spectre x360 16 RTX 4050
Intel Core Ultra 7 155H, NVIDIA GeForce RTX 4050 Laptop GPU
159.4 (117min, 92P1) fps +127%
Average AMD Radeon 780M
  (47 - 109.9, n=33)
84.8 fps +21%
HP Envy x360 2-in-1 16-ad0097nr
AMD Ryzen 7 8840HS, AMD Radeon 780M
70.2 (59min, 50P1) fps
Acer Swift Edge SFE16 Ryzen 7 7840U
AMD Ryzen 7 7840U, AMD Radeon 780M
65.4 (52min, 37P1) fps -7%
Acer Swift Go SFG16-71
Intel Core i7-13700H, Intel Iris Xe Graphics G7 96EUs
53.1 (45min, 43P1) fps -24%
Lenovo Yoga 7 2-in-1 16IML9
Intel Core Ultra 5 125U, Intel Graphics 4-Core iGPU (Arc)
41.7 (34min, 33P1) fps -41%
Lenovo Thinkpad X1 Fold 16
Intel Core i7-1250U, Intel Iris Xe Graphics G7 96EUs
34.8 (27min, 27P1) fps -50%
Lenovo ThinkPad E16 G1 Core i5-1335U
Intel Core i5-1335U, Intel Iris Xe Graphics G7 80EUs
32.8 (27min, 27P1) fps -53%
1920x1080 Medium Preset AA:T AF:16x
HP Spectre x360 16 RTX 4050
Intel Core Ultra 7 155H, NVIDIA GeForce RTX 4050 Laptop GPU
146.6 (46min, 79P1) fps +144%
Average AMD Radeon 780M
  (41.5 - 95, n=33)
75 fps +25%
Acer Swift Edge SFE16 Ryzen 7 7840U
AMD Ryzen 7 7840U, AMD Radeon 780M
62.1 (47min, 37P1) fps +4%
HP Envy x360 2-in-1 16-ad0097nr
AMD Ryzen 7 8840HS, AMD Radeon 780M
60 (49min, 41P1) fps
Acer Swift Go SFG16-71
Intel Core i7-13700H, Intel Iris Xe Graphics G7 96EUs
46.7 (40min, 39P1) fps -22%
Lenovo Yoga 7 2-in-1 16IML9
Intel Core Ultra 5 125U, Intel Graphics 4-Core iGPU (Arc)
39.7 (33min, 32P1) fps -34%
Lenovo ThinkPad E16 G1 Core i5-1335U
Intel Core i5-1335U, Intel Iris Xe Graphics G7 80EUs
29.1 (24min, 24P1) fps -51%
Lenovo Thinkpad X1 Fold 16
Intel Core i7-1250U, Intel Iris Xe Graphics G7 96EUs
28 (19min, 20P1) fps -53%
1920x1080 High Preset AA:T AF:16x
HP Spectre x360 16 RTX 4050
Intel Core Ultra 7 155H, NVIDIA GeForce RTX 4050 Laptop GPU
124.6 (100min, 75P1) fps +171%
Average AMD Radeon 780M
  (31.7 - 70.6, n=33)
55.9 fps +22%
HP Envy x360 2-in-1 16-ad0097nr
AMD Ryzen 7 8840HS, AMD Radeon 780M
46 (39min, 32P1) fps
Acer Swift Edge SFE16 Ryzen 7 7840U
AMD Ryzen 7 7840U, AMD Radeon 780M
42.6 (31min, 27P1) fps -7%
Acer Swift Go SFG16-71
Intel Core i7-13700H, Intel Iris Xe Graphics G7 96EUs
34 (27min, 28P1) fps -26%
Lenovo Thinkpad X1 Fold 16
Intel Core i7-1250U, Intel Iris Xe Graphics G7 96EUs
22 (17min, 17P1) fps -52%
Lenovo ThinkPad E16 G1 Core i5-1335U
Intel Core i5-1335U, Intel Iris Xe Graphics G7 80EUs
21.3 (18min, 17P1) fps -54%
1920x1080 Ultra High Preset AA:T AF:16x
HP Spectre x360 16 RTX 4050
Intel Core Ultra 7 155H, NVIDIA GeForce RTX 4050 Laptop GPU
42 (36min, 34P1) fps +250%
Acer Swift Go SFG16-71
Intel Core i7-13700H, Intel Iris Xe Graphics G7 96EUs
25.7 (21min, 21P1) fps +114%
Lenovo ThinkPad E16 G1 Core i5-1335U
Intel Core i5-1335U, Intel Iris Xe Graphics G7 80EUs
16.5 (13min, 13P1) fps +38%
Lenovo Thinkpad X1 Fold 16
Intel Core i7-1250U, Intel Iris Xe Graphics G7 96EUs
16.1 (12min, 11P1) fps +34%
Average AMD Radeon 780M
  (9.92 - 19.2, n=25)
15.4 fps +28%
HP Envy x360 2-in-1 16-ad0097nr
AMD Ryzen 7 8840HS, AMD Radeon 780M
12 (8min, 7P1) fps
Acer Swift Edge SFE16 Ryzen 7 7840U
AMD Ryzen 7 7840U, AMD Radeon 780M
9.92 (7min, 7P1) fps -17%
Cyberpunk 2077 2.1 Phantom Liberty
1280x720 Low Preset (FSR off)
HP Spectre x360 16 RTX 4050
Intel Core Ultra 7 155H, NVIDIA GeForce RTX 4050 Laptop GPU
83.1 (32.7min) fps +42%
Average AMD Radeon 780M
  (53.6 - 80.6, n=21)
66.5 fps +14%
HP Envy x360 2-in-1 16-ad0097nr
AMD Ryzen 7 8840HS, AMD Radeon 780M
58.5 (20.6min) fps
Lenovo Yoga 7 2-in-1 16IML9
Intel Core Ultra 5 125U, Intel Graphics 4-Core iGPU (Arc)
32.8 (7.65min) fps -44%
LG Gram 2in1 16 16T90R - G.AA78G
Intel Core i7-1360P, Intel Iris Xe Graphics G7 96EUs
29.2 (6.93min) fps -50%
Lenovo Thinkpad X1 Fold 16
Intel Core i7-1250U, Intel Iris Xe Graphics G7 96EUs
21.4 (3.17min) fps -63%
1920x1080 Low Preset (FSR off)
Dell XPS 16 9640
Intel Core Ultra 7 155H, NVIDIA GeForce RTX 4070 Laptop GPU
112 (89.9min) fps +215%
HP Spectre x360 16 RTX 4050
Intel Core Ultra 7 155H, NVIDIA GeForce RTX 4050 Laptop GPU
79.3 (21.3min) fps +123%
Average AMD Radeon 780M
  (29.3 - 52.1, n=41)
40.1 fps +13%
HP Envy x360 2-in-1 16-ad0097nr
AMD Ryzen 7 8840HS, AMD Radeon 780M
35.5 (19.3min) fps
Xiaomi RedmiBook Pro 16 2024
Intel Core Ultra 7 155H, Intel Arc 8-Core iGPU
34.7 (25.8min) fps -2%
Samsung Galaxy Book4 Pro 360
Intel Core Ultra 5 125H, Intel Arc 7-Core iGPU
29.2 (22.1min) fps -18%
Lenovo Yoga 7 2-in-1 16IML9
Intel Core Ultra 5 125U, Intel Graphics 4-Core iGPU (Arc)
20.9 (8.34min) fps -41%
LG Gram 2in1 16 16T90R - G.AA78G
Intel Core i7-1360P, Intel Iris Xe Graphics G7 96EUs
17.7 (12min) fps -50%
Lenovo Thinkpad X1 Fold 16
Intel Core i7-1250U, Intel Iris Xe Graphics G7 96EUs
13.1 (9.86min) fps -63%
1920x1080 Medium Preset (FSR off)
Dell XPS 16 9640
Intel Core Ultra 7 155H, NVIDIA GeForce RTX 4070 Laptop GPU
87.6 (71.6min) fps +215%
HP Spectre x360 16 RTX 4050
Intel Core Ultra 7 155H, NVIDIA GeForce RTX 4050 Laptop GPU
63.3 (24.8min) fps +128%
Average AMD Radeon 780M
  (16.3 - 37.5, n=37)
30.7 fps +10%
Xiaomi RedmiBook Pro 16 2024
Intel Core Ultra 7 155H, Intel Arc 8-Core iGPU
29.5 (22.4min) fps +6%
HP Envy x360 2-in-1 16-ad0097nr
AMD Ryzen 7 8840HS, AMD Radeon 780M
27.8 (15.3min) fps
Samsung Galaxy Book4 Pro 360
Intel Core Ultra 5 125H, Intel Arc 7-Core iGPU
21.7 (17.4min) fps -22%
Lenovo Yoga 7 2-in-1 16IML9
Intel Core Ultra 5 125U, Intel Graphics 4-Core iGPU (Arc)
16.9 (7.96min) fps -39%
LG Gram 2in1 16 16T90R - G.AA78G
Intel Core i7-1360P, Intel Iris Xe Graphics G7 96EUs
14.2 (3.7min) fps -49%
1920x1080 High Preset (FSR off)
Dell XPS 16 9640
Intel Core Ultra 7 155H, NVIDIA GeForce RTX 4070 Laptop GPU
74.7 (62.9min) fps +238%
HP Spectre x360 16 RTX 4050
Intel Core Ultra 7 155H, NVIDIA GeForce RTX 4050 Laptop GPU
53.5 (36.3min) fps +142%
Xiaomi RedmiBook Pro 16 2024
Intel Core Ultra 7 155H, Intel Arc 8-Core iGPU
25 (16.7min) fps +13%
Average AMD Radeon 780M
  (13.8 - 29.6, n=38)
24.5 fps +11%
HP Envy x360 2-in-1 16-ad0097nr
AMD Ryzen 7 8840HS, AMD Radeon 780M
22.1 (11min) fps
Samsung Galaxy Book4 Pro 360
Intel Core Ultra 5 125H, Intel Arc 7-Core iGPU
19.1 (14.4min) fps -14%
Lenovo Yoga 7 2-in-1 16IML9
Intel Core Ultra 5 125U, Intel Graphics 4-Core iGPU (Arc)
14.3 (3.34min) fps -35%
LG Gram 2in1 16 16T90R - G.AA78G
Intel Core i7-1360P, Intel Iris Xe Graphics G7 96EUs
11.9 (2.78min) fps -46%
1920x1080 Ultra Preset (FSR off)
Dell XPS 16 9640
Intel Core Ultra 7 155H, NVIDIA GeForce RTX 4070 Laptop GPU
64.3 (53.3min) fps +237%
HP Spectre x360 16 RTX 4050
Intel Core Ultra 7 155H, NVIDIA GeForce RTX 4050 Laptop GPU
46 (29.2min) fps +141%
Xiaomi RedmiBook Pro 16 2024
Intel Core Ultra 7 155H, Intel Arc 8-Core iGPU
21.2 (12.2min) fps +11%
Average AMD Radeon 780M
  (11.5 - 26.3, n=33)
21.2 fps +11%
HP Envy x360 2-in-1 16-ad0097nr
AMD Ryzen 7 8840HS, AMD Radeon 780M
19.1 (9.74min) fps
Samsung Galaxy Book4 Pro 360
Intel Core Ultra 5 125H, Intel Arc 7-Core iGPU
16.4 (11.1min) fps -14%
Lenovo Yoga 7 2-in-1 16IML9
Intel Core Ultra 5 125U, Intel Graphics 4-Core iGPU (Arc)
12.5 (2.72min) fps -35%
LG Gram 2in1 16 16T90R - G.AA78G
Intel Core i7-1360P, Intel Iris Xe Graphics G7 96EUs
11.3 (8.8min) fps -41%
Baldur's Gate 3
1280x720 Low Preset
Average AMD Radeon 780M
  (30.7 - 67.4, n=16)
57.4 fps +12%
HP Envy x360 2-in-1 16-ad0097nr
AMD Ryzen 7 8840HS, AMD Radeon 780M
51.3 fps
Lenovo Yoga 7 2-in-1 16IML9
Intel Core Ultra 5 125U, Intel Graphics 4-Core iGPU (Arc)
24.9 fps -51%
1920x1080 Low Preset
Dell XPS 16 9640
Intel Core Ultra 7 155H, NVIDIA GeForce RTX 4070 Laptop GPU
135.7 fps +288%
HP Spectre x360 16 RTX 4050
Intel Core Ultra 7 155H, NVIDIA GeForce RTX 4050 Laptop GPU
84.9 fps +143%
Average AMD Radeon 780M
  (20.2 - 43.9, n=25)
36 fps +3%
HP Envy x360 2-in-1 16-ad0097nr
AMD Ryzen 7 8840HS, AMD Radeon 780M
35 fps
Lenovo Yoga 7 2-in-1 16IML9
Intel Core Ultra 5 125U, Intel Graphics 4-Core iGPU (Arc)
15.4 fps -56%
1920x1080 Medium Preset
Dell XPS 16 9640
Intel Core Ultra 7 155H, NVIDIA GeForce RTX 4070 Laptop GPU
107.1 fps +276%
HP Spectre x360 16 RTX 4050
Intel Core Ultra 7 155H, NVIDIA GeForce RTX 4050 Laptop GPU
71.4 fps +151%
Average AMD Radeon 780M
  (15.7 - 36.8, n=27)
28.8 fps +1%
HP Envy x360 2-in-1 16-ad0097nr
AMD Ryzen 7 8840HS, AMD Radeon 780M
28.5 fps
1920x1080 High Preset
Dell XPS 16 9640
Intel Core Ultra 7 155H, NVIDIA GeForce RTX 4070 Laptop GPU
93.5 fps +314%
HP Spectre x360 16 RTX 4050
Intel Core Ultra 7 155H, NVIDIA GeForce RTX 4050 Laptop GPU
64 fps +183%
Average AMD Radeon 780M
  (13.3 - 29.9, n=27)
23.9 fps +6%
HP Envy x360 2-in-1 16-ad0097nr
AMD Ryzen 7 8840HS, AMD Radeon 780M
22.6 fps
1920x1080 Ultra Preset
Dell XPS 16 9640
Intel Core Ultra 7 155H, NVIDIA GeForce RTX 4070 Laptop GPU
91.8 fps +314%
HP Spectre x360 16 RTX 4050
Intel Core Ultra 7 155H, NVIDIA GeForce RTX 4050 Laptop GPU
63.1 fps +184%
Average AMD Radeon 780M
  (12.8 - 29.2, n=26)
23.3 fps +5%
HP Envy x360 2-in-1 16-ad0097nr
AMD Ryzen 7 8840HS, AMD Radeon 780M
22.2 fps
X-Plane 11.11
1280x720 low (fps_test=1)
HP Envy 16 h0112nr
Intel Core i7-12700H, NVIDIA GeForce RTX 3060 Laptop GPU
140.3 fps +194%
Dell XPS 16 9640
Intel Core Ultra 7 155H, NVIDIA GeForce RTX 4070 Laptop GPU
125.1 fps +162%
Dell XPS 16 9640
Intel Core Ultra 7 155H, NVIDIA GeForce RTX 4070 Laptop GPU
123.6 fps +159%
HP Spectre x360 16 RTX 4050
Intel Core Ultra 7 155H, NVIDIA GeForce RTX 4050 Laptop GPU
100.6 fps +110%
Acer Swift Go SFG16-71
Intel Core i7-13700H, Intel Iris Xe Graphics G7 96EUs
63.1 fps +32%
LG Gram 2in1 16 16T90R - G.AA78G
Intel Core i7-1360P, Intel Iris Xe Graphics G7 96EUs
58.46 fps +22%
Xiaomi RedmiBook Pro 16 2024
Intel Core Ultra 7 155H, Intel Arc 8-Core iGPU
56.1 fps +17%
Average AMD Radeon 780M
  (39 - 69.6, n=61)
53.2 fps +11%
Acer Swift Edge SFE16 Ryzen 7 7840U
AMD Ryzen 7 7840U, AMD Radeon 780M
49.1 fps +3%
HP Envy x360 2-in-1 16-ad0097nr
AMD Ryzen 7 8840HS, AMD Radeon 780M
47.8 fps
Samsung Galaxy Book4 Pro 360
Intel Core Ultra 5 125H, Intel Arc 7-Core iGPU
47.5 fps -1%
Lenovo Thinkpad X1 Fold 16
Intel Core i7-1250U, Intel Iris Xe Graphics G7 96EUs
40.7 fps -15%
Lenovo Yoga 7 2-in-1 16IML9
Intel Core Ultra 5 125U, Intel Graphics 4-Core iGPU (Arc)
36.5 fps -24%
Lenovo ThinkPad E16 G1 Core i5-1335U
Intel Core i5-1335U, Intel Iris Xe Graphics G7 80EUs
28.6 fps -40%
1920x1080 med (fps_test=2)
HP Envy 16 h0112nr
Intel Core i7-12700H, NVIDIA GeForce RTX 3060 Laptop GPU
127 fps +275%
Dell XPS 16 9640
Intel Core Ultra 7 155H, NVIDIA GeForce RTX 4070 Laptop GPU
108.8 fps +221%
Dell XPS 16 9640
Intel Core Ultra 7 155H, NVIDIA GeForce RTX 4070 Laptop GPU
108.5 fps +220%
HP Spectre x360 16 RTX 4050
Intel Core Ultra 7 155H, NVIDIA GeForce RTX 4050 Laptop GPU
86.7 fps +156%
Acer Swift Go SFG16-71
Intel Core i7-13700H, Intel Iris Xe Graphics G7 96EUs
46.3 fps +37%
LG Gram 2in1 16 16T90R - G.AA78G
Intel Core i7-1360P, Intel Iris Xe Graphics G7 96EUs
43.46 fps +28%
Xiaomi RedmiBook Pro 16 2024
Intel Core Ultra 7 155H, Intel Arc 8-Core iGPU
40.1 fps +18%
Average AMD Radeon 780M
  (26.2 - 48.9, n=61)
38.9 fps +15%
Acer Swift Edge SFE16 Ryzen 7 7840U
AMD Ryzen 7 7840U, AMD Radeon 780M
37 fps +9%
Samsung Galaxy Book4 Pro 360
Intel Core Ultra 5 125H, Intel Arc 7-Core iGPU
35.9 fps +6%
HP Envy x360 2-in-1 16-ad0097nr
AMD Ryzen 7 8840HS, AMD Radeon 780M
33.9 fps
Lenovo Thinkpad X1 Fold 16
Intel Core i7-1250U, Intel Iris Xe Graphics G7 96EUs
32 fps -6%
Lenovo Yoga 7 2-in-1 16IML9
Intel Core Ultra 5 125U, Intel Graphics 4-Core iGPU (Arc)
28 fps -17%
Lenovo ThinkPad E16 G1 Core i5-1335U
Intel Core i5-1335U, Intel Iris Xe Graphics G7 80EUs
22.5 fps -34%
1920x1080 high (fps_test=3)
HP Envy 16 h0112nr
Intel Core i7-12700H, NVIDIA GeForce RTX 3060 Laptop GPU
103 fps +269%
Dell XPS 16 9640
Intel Core Ultra 7 155H, NVIDIA GeForce RTX 4070 Laptop GPU
84.7 fps +204%
Dell XPS 16 9640
Intel Core Ultra 7 155H, NVIDIA GeForce RTX 4070 Laptop GPU
84.4 fps +203%
HP Spectre x360 16 RTX 4050
Intel Core Ultra 7 155H, NVIDIA GeForce RTX 4050 Laptop GPU
69.7 fps +150%
Acer Swift Go SFG16-71
Intel Core i7-13700H, Intel Iris Xe Graphics G7 96EUs
40.1 fps +44%
LG Gram 2in1 16 16T90R - G.AA78G
Intel Core i7-1360P, Intel Iris Xe Graphics G7 96EUs
37.95 fps +36%
Average AMD Radeon 780M
  (24.5 - 41.5, n=60)
32.7 fps +17%
Xiaomi RedmiBook Pro 16 2024
Intel Core Ultra 7 155H, Intel Arc 8-Core iGPU
32.4 fps +16%
Samsung Galaxy Book4 Pro 360
Intel Core Ultra 5 125H, Intel Arc 7-Core iGPU
31.5 fps +13%
Acer Swift Edge SFE16 Ryzen 7 7840U
AMD Ryzen 7 7840U, AMD Radeon 780M
30.3 fps +9%
Lenovo Thinkpad X1 Fold 16
Intel Core i7-1250U, Intel Iris Xe Graphics G7 96EUs
28.8 fps +3%
HP Envy x360 2-in-1 16-ad0097nr
AMD Ryzen 7 8840HS, AMD Radeon 780M
27.9 fps
Lenovo Yoga 7 2-in-1 16IML9
Intel Core Ultra 5 125U, Intel Graphics 4-Core iGPU (Arc)
23.4 fps -16%
Lenovo ThinkPad E16 G1 Core i5-1335U
Intel Core i5-1335U, Intel Iris Xe Graphics G7 80EUs
21 fps -25%
Dota 2 Reborn
1280x720 min (0/3) fastest
HP Envy 16 h0112nr
Intel Core i7-12700H, NVIDIA GeForce RTX 3060 Laptop GPU
180.6 (158.7min) fps +46%
HP Spectre x360 16 RTX 4050
Intel Core Ultra 7 155H, NVIDIA GeForce RTX 4050 Laptop GPU
142 (123.9min) fps +15%
Average AMD Radeon 780M
  (34.7 - 164.8, n=59)
133 fps +8%
Acer Swift Edge SFE16 Ryzen 7 7840U
AMD Ryzen 7 7840U, AMD Radeon 780M
128.1 (105.1min) fps +4%
LG Gram 2in1 16 16T90R - G.AA78G
Intel Core i7-1360P, Intel Iris Xe Graphics G7 96EUs
124 (95.9min) fps 0%
HP Envy x360 2-in-1 16-ad0097nr
AMD Ryzen 7 8840HS, AMD Radeon 780M
123.7 (106.8min) fps
Acer Swift Go SFG16-71
Intel Core i7-13700H, Intel Iris Xe Graphics G7 96EUs
117.9 (94.9min) fps -5%
Xiaomi RedmiBook Pro 16 2024
Intel Core Ultra 7 155H, Intel Arc 8-Core iGPU
102.4 (58.1min) fps -17%
Lenovo Yoga 7 2-in-1 16IML9
Intel Core Ultra 5 125U, Intel Graphics 4-Core iGPU (Arc)
101.9 (62min) fps -18%
Lenovo ThinkPad E16 G1 Core i5-1335U
Intel Core i5-1335U, Intel Iris Xe Graphics G7 80EUs
100.7 (80.4min) fps -19%
Samsung Galaxy Book4 Pro 360
Intel Core Ultra 5 125H, Intel Arc 7-Core iGPU
94.3 (63.9min) fps -24%
Lenovo Thinkpad X1 Fold 16
Intel Core i7-1250U, Intel Iris Xe Graphics G7 96EUs
89.8 (69.2min) fps -27%
Dell XPS 16 9640
Intel Core Ultra 7 155H, NVIDIA GeForce RTX 4070 Laptop GPU
89.8 (87min) fps -27%
1366x768 med (1/3)
HP Envy 16 h0112nr
Intel Core i7-12700H, NVIDIA GeForce RTX 3060 Laptop GPU
164.8 (144min) fps +59%
HP Spectre x360 16 RTX 4050
Intel Core Ultra 7 155H, NVIDIA GeForce RTX 4050 Laptop GPU
124.2 (106.7min) fps +20%
Average AMD Radeon 780M
  (33.6 - 130.2, n=59)
106.9 fps +3%
HP Envy x360 2-in-1 16-ad0097nr
AMD Ryzen 7 8840HS, AMD Radeon 780M
103.7 (87.1min) fps
Acer Swift Edge SFE16 Ryzen 7 7840U
AMD Ryzen 7 7840U, AMD Radeon 780M
101.5 (86.7min) fps -2%
Xiaomi RedmiBook Pro 16 2024
Intel Core Ultra 7 155H, Intel Arc 8-Core iGPU
96.9 (60min) fps -7%
Dell XPS 16 9640
Intel Core Ultra 7 155H, NVIDIA GeForce RTX 4070 Laptop GPU
89.6 (85.4min) fps -14%
Samsung Galaxy Book4 Pro 360
Intel Core Ultra 5 125H, Intel Arc 7-Core iGPU
89.2 (52.5min) fps -14%
LG Gram 2in1 16 16T90R - G.AA78G
Intel Core i7-1360P, Intel Iris Xe Graphics G7 96EUs
89.1 (65.8min) fps -14%
Acer Swift Go SFG16-71
Intel Core i7-13700H, Intel Iris Xe Graphics G7 96EUs
87 (69.9min) fps -16%
Lenovo ThinkPad E16 G1 Core i5-1335U
Intel Core i5-1335U, Intel Iris Xe Graphics G7 80EUs
75.2 (61.2min) fps -27%
Lenovo Thinkpad X1 Fold 16
Intel Core i7-1250U, Intel Iris Xe Graphics G7 96EUs
69 (52.3min) fps -33%
Lenovo Yoga 7 2-in-1 16IML9
Intel Core Ultra 5 125U, Intel Graphics 4-Core iGPU (Arc)
60.7 (38.1min) fps -41%
1920x1080 high (2/3)
HP Envy 16 h0112nr
Intel Core i7-12700H, NVIDIA GeForce RTX 3060 Laptop GPU
149.1 (127.7min) fps +104%
HP Spectre x360 16 RTX 4050
Intel Core Ultra 7 155H, NVIDIA GeForce RTX 4050 Laptop GPU
119.6 (101.8min) fps +64%
Dell XPS 16 9640
Intel Core Ultra 7 155H, NVIDIA GeForce RTX 4070 Laptop GPU
89.5 (84.4min) fps +23%
Xiaomi RedmiBook Pro 16 2024
Intel Core Ultra 7 155H, Intel Arc 8-Core iGPU
83 (50.6min) fps +14%
Average AMD Radeon 780M
  (31.6 - 98.8, n=59)
79.3 fps +9%
HP Envy x360 2-in-1 16-ad0097nr
AMD Ryzen 7 8840HS, AMD Radeon 780M
73 (61.3min) fps
LG Gram 2in1 16 16T90R - G.AA78G
Intel Core i7-1360P, Intel Iris Xe Graphics G7 96EUs
71.2 (58.9min) fps -2%
Acer Swift Go SFG16-71
Intel Core i7-13700H, Intel Iris Xe Graphics G7 96EUs
68.7 (56.9min) fps -6%
Acer Swift Edge SFE16 Ryzen 7 7840U
AMD Ryzen 7 7840U, AMD Radeon 780M
66.8 (55.4min) fps -8%
Samsung Galaxy Book4 Pro 360
Intel Core Ultra 5 125H, Intel Arc 7-Core iGPU
66.3 (48min) fps -9%
Lenovo Yoga 7 2-in-1 16IML9
Intel Core Ultra 5 125U, Intel Graphics 4-Core iGPU (Arc)
61.1 (37.9min) fps -16%
Lenovo Thinkpad X1 Fold 16
Intel Core i7-1250U, Intel Iris Xe Graphics G7 96EUs
55.3 (45.5min) fps -24%
Lenovo ThinkPad E16 G1 Core i5-1335U
Intel Core i5-1335U, Intel Iris Xe Graphics G7 80EUs
49.2 (45.6min) fps -33%
1920x1080 ultra (3/3) best looking
HP Envy 16 h0112nr
Intel Core i7-12700H, NVIDIA GeForce RTX 3060 Laptop GPU
139 (117.8min) fps +113%
HP Spectre x360 16 RTX 4050
Intel Core Ultra 7 155H, NVIDIA GeForce RTX 4050 Laptop GPU
106.4 (89.8min) fps +63%
Dell XPS 16 9640
Intel Core Ultra 7 155H, NVIDIA GeForce RTX 4070 Laptop GPU
89.7 (83.8min) fps +37%
Xiaomi RedmiBook Pro 16 2024
Intel Core Ultra 7 155H, Intel Arc 8-Core iGPU
79.8 (51.5min) fps +22%
Average AMD Radeon 780M
  (30.8 - 91.2, n=59)
71.6 fps +9%
HP Envy x360 2-in-1 16-ad0097nr
AMD Ryzen 7 8840HS, AMD Radeon 780M
65.4 (54.7min) fps
LG Gram 2in1 16 16T90R - G.AA78G
Intel Core i7-1360P, Intel Iris Xe Graphics G7 96EUs
62.9 (53.2min) fps -4%
Acer Swift Go SFG16-71
Intel Core i7-13700H, Intel Iris Xe Graphics G7 96EUs
61.7 (53.9min) fps -6%
Acer Swift Edge SFE16 Ryzen 7 7840U
AMD Ryzen 7 7840U, AMD Radeon 780M
61.4 (52min) fps -6%
Samsung Galaxy Book4 Pro 360
Intel Core Ultra 5 125H, Intel Arc 7-Core iGPU
58.7 (42.1min) fps -10%
Lenovo Yoga 7 2-in-1 16IML9
Intel Core Ultra 5 125U, Intel Graphics 4-Core iGPU (Arc)
57.6 (37.5min) fps -12%
Lenovo ThinkPad E16 G1 Core i5-1335U
Intel Core i5-1335U, Intel Iris Xe Graphics G7 80EUs
45 (41.1min) fps -31%
Lenovo Thinkpad X1 Fold 16
Intel Core i7-1250U, Intel Iris Xe Graphics G7 96EUs
41.3 (32.3min) fps -37%

Witcher 3 FPS Chart

051015202530354045Tooltip
lowmed.highultra
The Witcher 3 (2015) 129.2 47.6 28.8
Dota 2 Reborn (2015) 123.7 103.7 73 65.4
Final Fantasy XV Benchmark (2018) 64.5 34.1 25.2
X-Plane 11.11 (2018) 47.8 33.9 27.9
Far Cry 5 (2018) 63 36 33 31
Strange Brigade (2018) 138.2 60.3 50.2 42.2
Tiny Tina's Wonderlands (2022) 49.8 38 24 19.5
F1 22 (2022) 70.2 60 46 12
Baldur's Gate 3 (2023) 35 28.5 22.6 22.2
Cyberpunk 2077 2.1 Phantom Liberty (2023) 35.5 27.8 22.1 19.1

Emisje - niskie i wysokie poziomy

Hałas systemowy

Obroty i zachowanie wentylatora są ściśle powiązane z wybranym profilem zasilania. W trybie zrównoważonym, wentylator pracuje zauważalnie ciszej i przez dłuższy czas przed koniecznością zwiększenia obrotów. Hałas wentylatora podczas uruchamiania 3DMark 06, na przykład, pozostałby na poziomie 23,8 dB(A) przez całą pierwszą scenę testu porównawczego, podczas gdy skoczyłby do 28 dB(A), gdyby był ustawiony na tryb wydajności. Zaleca się ustawienie MyHP w trybie zrównoważonym, aby ograniczyć pulsowanie wentylatora podczas wykonywania niewymagających zadań, takich jak przeglądanie stron internetowych lub strumieniowanie wideo.

Jesteśmy w stanie zarejestrować maksymalny poziom hałasu wynoszący prawie 44 dB(A) podczas pracy w trybie Witcher 3 w trybie wydajności. Sprawia to, że Envy x360 16 jest jednym z najgłośniejszych 16-calowych laptopów konwertowalnych o kilka decybeli podczas pracy z wymagającymi obciążeniami.

Brak zauważalnego wycie cewki lub szumu elektronicznego z naszej jednostki testowej
Rozwiązanie chłodzące składa się z pojedynczego wentylatora ~50 mm i rurki cieplnej
Profil hałasu wentylatora (Biały: Tło, Czerwony: System bezczynny, Niebieski: 3DMark 06, Pomarańczowy: Witcher 3, Zielony: Prime95+FurMark stress)

Hałas

luz
23 / 23 / 23 dB
obciążenie
23.8 / 43.8 dB
  red to green bar
 
 
30 dB
cichy
40 dB(A)
słyszalny
50 dB(A)
irytujący
 
min: dark, med: mid, max: light   Earthworks M23R, Arta (odległość 15 cm)   environment noise: 22.9 dB(A)
dB(A) 0102030405060708090Deep BassMiddle BassHigh BassLower RangeMidsHigher MidsLower HighsMid HighsUpper HighsSuper Highs2033.634.534.835.734.92526.224.52425.2263124.92420.321.1254024.720.520.918.121.2502218.122.117.6286328.322.219.821.2298023.418.71818.223.51002318.714.716.723.31252214.612.514.223.61602714.912.913.526.220026.212.812.61325.725026.512.611.81126.231526.413.811.61226.640027.512.210.911.727.750028.310.710.310.428.263028.610.710.510.229.680029.511.11111.229.61000319.59.89.230.9125031.59.69.89.631.4160032.69.79.99.732.6200034.210.310.210.334250034.410.910.510.434.4315031.311.810.910.631.3400031.112.411.111.131.1500031.612.611.511.431.5630032.112.911.611.532.1800031.313.111.811.631.4100003013.311.811.6301250025.513.811.811.425.31600019.51411.510.719SPL43.823.82322.943.8N4.50.50.40.44.6median 29.5median 12.6median 11.5median 11.2median 29.6Delta3.31.30.80.73.3hearing rangehide median Fan NoiseHP Envy x360 2-in-1 16-ad0097nr
HP Envy x360 2-in-1 16-ad0097nr
Radeon 780M, R7 8840HS, KIOXIA BG5 KBG50ZNV1T02
HP Envy 16 h0112nr
GeForce RTX 3060 Laptop GPU, i7-12700H, Micron 3400 1TB MTFDKBA1T0TFH
HP Spectre x360 16 RTX 4050
NVIDIA GeForce RTX 4050 Laptop GPU, Ultra 7 155H, SK hynix PC801 HFS001TEJ9X101N
Lenovo Yoga 7 2-in-1 16IML9
Graphics 4-Core, Ultra 5 125U, SK hynix HFS512GEJ4X112N
Samsung Galaxy Book4 Pro 360
Arc 7-Core, Ultra 5 125H, Samsung PM9B1 512GB MZVL4512HBLU
LG Gram 2in1 16 16T90R - G.AA78G
Iris Xe G7 96EUs, i7-1360P, Samsung PM9A1 MZVL21T0HCLR
Noise
-20%
3%
1%
-8%
-7%
off / environment *
22.9
22.8
-0%
23.3
-2%
22.8
-0%
24.1
-5%
25.1
-10%
Idle Minimum *
23
22.9
-0%
23.6
-3%
22.8
1%
24.1
-5%
25.1
-9%
Idle Average *
23
22.9
-0%
23.6
-3%
22.8
1%
24.1
-5%
25.1
-9%
Idle Maximum *
23
30.5
-33%
23.6
-3%
22.8
1%
26.4
-15%
26.1
-13%
Load Average *
23.8
41.4
-74%
29.2
-23%
30.8
-29%
35.2
-48%
31.4
-32%
Witcher 3 ultra *
43.8
51.1
-17%
32.1
27%
31
29%
38.5
12%
41.1
6%
Load Maximum *
43.8
51.4
-17%
32.1
27%
40.8
7%
39.2
11%
36.6
16%

* ... im mniej tym lepiej

Temperatura

Gorące punkty w pobliżu klawiszy WASD mogą być tak ciepłe, jak 41 C w porównaniu do 38 C lub tylko 36 C na wolniejszym Core U napędzanym Yoga 7 2-w-1 16IML9 lub Envy x360 15. W szczególności lewa podpórka pod nadgarstki może być zauważalnie cieplejsza niż prawa pod obciążeniem, ale ciepło na szczęście nigdy nie staje się zbyt niewygodne.

Tylny układ wydechowy
Zasilacz AC osiąga ponad 37 C podczas pracy z wymagającymi obciążeniami
w stresie
 42.6 °C41.8 °C35.8 °C 
 40.6 °C39.8 °C31.2 °C 
 32.4 °C28 °C27.2 °C 
maks. w ogóle: 42.6 °C
średnia: 35.5 °C
32.6 °C42 °C47.8 °C
30.2 °C38.2 °C38.4 °C
28.2 °C31 °C33.6 °C
maks. w ogóle: 47.8 °C
średnia: 35.8 °C
zasilacz  45 °C | temperatura otoczenia 22 °C | Fluke 62 Mini IR Thermometer
(±) The average temperature for the upper side under maximal load is 35.5 °C / 96 F, compared to the average of 30.2 °C / 86 F for the devices in the class Convertible.
(±) The maximum temperature on the upper side is 42.6 °C / 109 F, compared to the average of 35.3 °C / 96 F, ranging from 19.6 to 60 °C for the class Convertible.
(-) The bottom heats up to a maximum of 47.8 °C / 118 F, compared to the average of 36.8 °C / 98 F
(+) In idle usage, the average temperature for the upper side is 26.5 °C / 80 F, compared to the device average of 30.2 °C / 86 F.
(+) The palmrests and touchpad are reaching skin temperature as a maximum (32.4 °C / 90.3 F) and are therefore not hot.
(-) The average temperature of the palmrest area of similar devices was 28 °C / 82.4 F (-4.4 °C / -7.9 F).
System bezczynny (góra)
System w stanie bezczynności (na dole)
Prime95+FurMark stres (góra)
Prime95+FurMark stress (na dole)
HP Envy x360 2-in-1 16-ad0097nr
AMD Ryzen 7 8840HS, AMD Radeon 780M
HP Envy 16 h0112nr
Intel Core i7-12700H, NVIDIA GeForce RTX 3060 Laptop GPU
HP Spectre x360 16 RTX 4050
Intel Core Ultra 7 155H, NVIDIA GeForce RTX 4050 Laptop GPU
Lenovo Yoga 7 2-in-1 16IML9
Intel Core Ultra 5 125U, Intel Graphics 4-Core iGPU (Arc)
Samsung Galaxy Book4 Pro 360
Intel Core Ultra 5 125H, Intel Arc 7-Core iGPU
LG Gram 2in1 16 16T90R - G.AA78G
Intel Core i7-1360P, Intel Iris Xe Graphics G7 96EUs
Heat
-10%
1%
10%
11%
-20%
Maximum Upper Side *
42.6
45.2
-6%
39.6
7%
37.8
11%
38.6
9%
55
-29%
Maximum Bottom *
47.8
44
8%
39.2
18%
38.8
19%
39.2
18%
55.4
-16%
Idle Upper Side *
27.4
33.6
-23%
29
-6%
25.4
7%
25.2
8%
34.9
-27%
Idle Bottom *
27.8
32.6
-17%
31.6
-14%
26.8
4%
25.7
8%
30
-8%

* ... im mniej tym lepiej

Głośniki

Głośniki stereo skierowane w dół w przednich narożnikach
Szum różowy wykazuje zarówno wyższą głośność, jak i bardziej stabilną reprodukcję dźwięku niż większość innych laptopów konwertowalnych
dB(A) 0102030405060708090Deep BassMiddle BassHigh BassLower RangeMidsHigher MidsLower HighsMid HighsUpper HighsSuper Highs2036.634.836.62524.52424.53126.220.326.24024.320.924.35024.122.124.16329.119.829.18039.51839.510051.614.751.612559.412.559.416068.912.968.920069.312.669.325071.311.871.331572.211.672.240072.710.972.750073.410.373.463073.110.573.180075.11175.1100072.69.872.6125072.99.872.91600749.974200076.210.276.2250075.310.575.3315076.410.976.4400076.711.176.7500077.311.577.3630077.111.677.1800075.811.875.8100007511.8751250073.811.873.81600066.311.566.3SPL87.42387.4N79.30.479.3median 73.8median 11.5median 73.8Delta2.80.82.826.325.821.422.12624.925.127.622.532.523.448.72655.818.860.922.167.2267019.372.317.674.217.774.319.575.31571.711.871.311.27410.574.21072.710.17210.67210.97511.374.811.671.71269.71269.612.371.112.669.61270.111.269.824.784.70.666.6median 12median 71.73.42.2hearing rangehide median Pink NoiseHP Envy x360 2-in-1 16-ad0097nrApple MacBook Pro 16 2021 M1 Pro
Frequency diagram (checkboxes can be checked and unchecked to compare devices)
HP Envy x360 2-in-1 16-ad0097nr audio analysis

(+) | speakers can play relatively loud (87.4 dB)
Bass 100 - 315 Hz
(±) | reduced bass - on average 8.3% lower than median
(±) | linearity of bass is average (8.7% delta to prev. frequency)
Mids 400 - 2000 Hz
(+) | balanced mids - only 1% away from median
(+) | mids are linear (1.9% delta to prev. frequency)
Highs 2 - 16 kHz
(+) | balanced highs - only 2.5% away from median
(+) | highs are linear (1.2% delta to prev. frequency)
Overall 100 - 16.000 Hz
(+) | overall sound is linear (6.5% difference to median)
Compared to same class
» 1% of all tested devices in this class were better, 1% similar, 99% worse
» The best had a delta of 6%, average was 21%, worst was 57%
Compared to all devices tested
» 1% of all tested devices were better, 0% similar, 99% worse
» The best had a delta of 4%, average was 25%, worst was 134%

Apple MacBook Pro 16 2021 M1 Pro audio analysis

(+) | speakers can play relatively loud (84.7 dB)
Bass 100 - 315 Hz
(+) | good bass - only 3.8% away from median
(+) | bass is linear (5.2% delta to prev. frequency)
Mids 400 - 2000 Hz
(+) | balanced mids - only 1.3% away from median
(+) | mids are linear (2.1% delta to prev. frequency)
Highs 2 - 16 kHz
(+) | balanced highs - only 1.9% away from median
(+) | highs are linear (2.7% delta to prev. frequency)
Overall 100 - 16.000 Hz
(+) | overall sound is linear (4.6% difference to median)
Compared to same class
» 0% of all tested devices in this class were better, 0% similar, 100% worse
» The best had a delta of 5%, average was 18%, worst was 45%
Compared to all devices tested
» 0% of all tested devices were better, 0% similar, 100% worse
» The best had a delta of 4%, average was 25%, worst was 134%

Zarządzanie energią

Zużycie energii

Praca na biegu jałowym na komputerze stacjonarnym wymaga od 5 W do 15 W, czyli prawie o połowę mniej niż w przypadku Spectre x360 16 ze względu na brak dedykowanego GPU w modelu Envy. Niemniej jednak warto ograniczyć czas wyświetlania ekranu z białym tłem, ponieważ biel wymaga więcej energii na OLED niż IPS; jesteśmy w stanie zmierzyć różnicę 9 W na naszym Envy podczas wyświetlania całkowicie czarnego ekranu w porównaniu z całkowicie białym ekranem, gdy oba są ustawione na maksymalną jasność.

Uruchamianie Witcher 3 zużywa 55 W w porównaniu do 47 W na Samsung Galaxy Book4 Pro 16 lub 54 W na IdeaPad Pro 6 16 każdy wyposażony w konkurencyjny Arc 8. Wydajność w przeliczeniu na wat jest nadal bardzo dobra i generalnie dorównuje najnowszym alternatywom Intela, mimo że rozwiązanie AMD ma prawie dwa lata.

Jesteśmy w stanie zmierzyć tymczasowy maksymalny pobór 66 W z małego (~ 9,6 x 5,5 x 2,2 cm) zasilacza sieciowego USB-C o mocy 65 W podczas pracy z ekstremalnymi obciążeniami, jak pokazano na poniższych zrzutach ekranu.

zużycie 3DMark 06
zużycie 3DMark 06
Witcher 3 zużycie 1080p Ultra
Zużycie energii wzrosło do 65 W podczas inicjowania stresu Prime95, a następnie szybko spadło i ustabilizowało się na poziomie 47 W
Prime95+FurMark stres zainicjowany w 10s mark
Pobór mocy
wyłączony / stan wstrzymaniadarklight 0.4 / 0.68 W
luzdarkmidlight 5 / 6.2 / 14.7 W
obciążenie midlight 49.9 / 65 W
 color bar
Legenda: min: dark, med: mid, max: light        Metrahit Energy
HP Envy x360 2-in-1 16-ad0097nr
R7 8840HS, Radeon 780M, KIOXIA BG5 KBG50ZNV1T02, OLED, 2880x1800, 16"
HP Envy 16 h0112nr
i7-12700H, GeForce RTX 3060 Laptop GPU, Micron 3400 1TB MTFDKBA1T0TFH, OLED, 3840x2400, 16"
HP Spectre x360 16 RTX 4050
Ultra 7 155H, NVIDIA GeForce RTX 4050 Laptop GPU, SK hynix PC801 HFS001TEJ9X101N, OLED, 2880x1800, 16"
Lenovo Yoga 7 2-in-1 16IML9
Ultra 5 125U, Graphics 4-Core, SK hynix HFS512GEJ4X112N, IPS, 1920x1200, 16"
Samsung Galaxy Book4 Pro 360
Ultra 5 125H, Arc 7-Core, Samsung PM9B1 512GB MZVL4512HBLU, OLED, 2880x1800, 16"
LG Gram 2in1 16 16T90R - G.AA78G
i7-1360P, Iris Xe G7 96EUs, Samsung PM9A1 MZVL21T0HCLR, IPS, 2560x1600, 16"
Power Consumption
-128%
-77%
18%
18%
-1%
Idle Minimum *
5
10
-100%
5.8
-16%
3
40%
3
40%
5.5
-10%
Idle Average *
6.2
10.9
-76%
12.3
-98%
8.5
-37%
6.3
-2%
7.2
-16%
Idle Maximum *
14.7
27.8
-89%
33.9
-131%
8.9
39%
6.5
56%
12.9
12%
Load Average *
49.9
116.4
-133%
83.3
-67%
41.1
18%
49.3
1%
55
-10%
Witcher 3 ultra *
54.5
133.7
-145%
89.1
-63%
30.7
44%
45.9
16%
47
14%
Load Maximum *
65
209.8
-223%
120.8
-86%
64.6
1%
65.5
-1%
63.6
2%

* ... im mniej tym lepiej

Power Consumption Witcher 3 / Stresstest

05101520253035404550556065Tooltip
HP Envy x360 2-in-1 16-ad0097nr R7 8840HS, Radeon 780M; Witcher 3 ultra: Ø54.5 (51.9-58.1)
Samsung Galaxy Book4 Pro 16 Ultra 7 155H, Arc 8-Core; Witcher 3 ultra: Ø46.6 (45.8-48.3)
HP Envy x360 2-in-1 16-ad0097nr R7 8840HS, Radeon 780M; 1280x720 Prime95 28.10 and Furmark 1.25: Ø48.5 (47.1-65)
Samsung Galaxy Book4 Pro 16 Ultra 7 155H, Arc 8-Core; 1280x720 Prime95 28.10 and Furmark 1.25: Ø58.9 (45.1-64.7)
HP Envy x360 2-in-1 16-ad0097nr R7 8840HS, Radeon 780M; Idle 150cd/m2: Ø5.75 (5.05-9.04)
Samsung Galaxy Book4 Pro 16 Ultra 7 155H, Arc 8-Core; Idle 150cd/m2: Ø5.43 (4.11-8.87)

Power Consumption external Monitor

05101520253035404550556065Tooltip
HP Envy x360 2-in-1 16-ad0097nr R7 8840HS, Radeon 780M; Prime95 V2810 Stress (external Monitor): Ø46.6 (44.7-65.4)
Samsung Galaxy Book4 Pro 360 Ultra 5 125H, Arc 7-Core; Prime95 V2810 Stress (external Monitor): Ø46.9 (43.3-65.4)
HP Envy x360 2-in-1 16-ad0097nr R7 8840HS, Radeon 780M; Cinebench R15 Multi (external Monitor): Ø41.1 (40-49)
Samsung Galaxy Book4 Pro 360 Ultra 5 125H, Arc 7-Core; Cinebench R15 Multi (external Monitor): Ø56.7 (39.7-65.3)
HP Envy x360 2-in-1 16-ad0097nr R7 8840HS, Radeon 780M; 1280x720 FurMark 1.19 GPU Stress Test (external Monitor): Ø45.6 (44.1-47.1)
Samsung Galaxy Book4 Pro 360 Ultra 5 125H, Arc 7-Core; 1280x720 FurMark 1.19 GPU Stress Test (external Monitor): Ø45.2 (37.2-60.3)
HP Envy x360 2-in-1 16-ad0097nr R7 8840HS, Radeon 780M; 1920x1080 The Witcher 3 ultra (external Monitor): Ø50.3 (45.9-56.1)
Samsung Galaxy Book4 Pro 360 Ultra 5 125H, Arc 7-Core; 1920x1080 The Witcher 3 ultra (external Monitor): Ø41.9 (31.6-47.9)
HP Envy x360 2-in-1 16-ad0097nr R7 8840HS, Radeon 780M; Idle 1min (external Monitor): Ø5.32 (4.84-8.45)
Samsung Galaxy Book4 Pro 360 Ultra 5 125H, Arc 7-Core; Idle 1min (external Monitor): Ø5.29 (4.18-6.64)

Żywotność baterii

Uniwersalny zasilacz sieciowy USB-C

Pojemność baterii jest mniejsza niż w większości innych 16-calowych laptopów, co w połączeniu z wymagającym ekranem dotykowym OLED prowadzi do krótszych czasów pracy. Jesteśmy w stanie wycisnąć z Envy 7,5 godziny rzeczywistego przeglądania przed automatycznym wyłączeniem w porównaniu do ponad godziny lub dwóch godzin dłużej na Samsungu Galaxy Book4 Pro 360 lub Spectre x360 16. Żywotność baterii jest mimo wszystko całkiem dobra, o ile właściciele nie oczekują czasu pracy na poziomie MacBooka.

Ładowanie od stanu pustego do pełnej pojemności za pomocą dołączonego zasilacza sieciowego zajmuje około 90 minut.

Wydajność akumulatora
luz
15h 35min
WiFi Websurfing
7h 39min
obciążenie
1h 56min
HP Envy x360 2-in-1 16-ad0097nr
R7 8840HS, Radeon 780M, 68 Wh
HP Envy 16 h0112nr
i7-12700H, GeForce RTX 3060 Laptop GPU, 83 Wh
HP Spectre x360 16 RTX 4050
Ultra 7 155H, NVIDIA GeForce RTX 4050 Laptop GPU, 83 Wh
Lenovo Yoga 7 2-in-1 16IML9
Ultra 5 125U, Graphics 4-Core, 71 Wh
Samsung Galaxy Book4 Pro 360
Ultra 5 125H, Arc 7-Core, 76 Wh
LG Gram 2in1 16 16T90R - G.AA78G
i7-1360P, Iris Xe G7 96EUs, 80 Wh
Czasy pracy
-1%
44%
61%
7%
30%
Reader / Idle
935
1068
14%
WiFi v1.3
459
472
3%
660
44%
738
61%
531
16%
716
56%
Load
116
94
-19%
114
-2%
121
4%
H.264
881

Za

+ OLED ze ściemnianiem DC w celu ograniczenia migotania PWM
+ wysokiej jakości panel OLED 120 Hz w tej cenie
+ kamera internetowa 5 MP o wysokiej rozdzielczości
+ brak oddzielnych opcji GPU
+ wygodna klawiatura

Przeciw

- brak możliwości rozbudowy pamięci RAM; obsługuje tylko jeden wewnętrzny dysk SSD
- wolniejsza niż przeciętna wydajność Radeona 780M
- brak obsługi Thunderbolt lub USB4 w jednostkach SKU AMD
- starszy Ryzen 7 7840HS działa nieco szybciej
- brak adaptacyjnej częstotliwości odświeżania wyświetlacza

Werdykt - Spectre Experience za mniej

W recenzji: HP Envy x360 2-w-1 16-ad0097nr

HP oferuje obecnie dwa 16-calowe konwertowalne komputery klasy konsumenckiej: średniej klasy Envy x360 16 i wysokiej klasy Spectre x360 16. Co zaskakujące, Envy jest lżejszy od Spectre, a jednocześnie posiada dokładnie taki sam ekran dotykowy OLED i prawie takie same wymiary. Doświadczenia użytkownika między tymi dwoma modelami są zatem znacznie bliższe niż oczekiwano, pomimo dużych różnic cenowych.

Istnieje jednak kilka powodów, dla których warto wybrać droższego Spectre x360 16, poza bardziej luksusowym designem. Envy x360 16 ma mniejszy akumulator, brak dedykowanego GPU i kamerę internetową o niższej rozdzielczości. Ma również tendencję do głośniejszej pracy pod obciążeniem ze względu na posiadanie tylko jednego wewnętrznego wentylatora zamiast dwóch. Asus VivoBook Pro 16 Asus VivoBook Pro 16 jest przyzwoitą alternatywą dla Envy x360 16, ponieważ zawiera OLED, dGPU dla szybszej wydajności i większą baterię w mniej więcej tej samej cenie, ale właściciele straciliby formę 2 w 1.

Gotowy na sztuczną inteligencję HP Envy x360 16 jest dostępny zarówno w wersji Intel, jak i AMD, i ma bardzo podobne funkcje jak droższy Spectre x360 16. Chociaż wersje AMD są znacznie szybsze niż Intel, brakuje im obsługi USB4 i Thunderbolt, co ogranicza możliwości dokowania.

Musimy również docenić ten model za oferowanie zarówno opcji procesora Intel Meteor Lake-U, jak i AMD Hawk Point-HS, co nie jest powszechne w innych laptopach. Wersje AMD są bezsprzecznie szybsze pod względem surowej wydajności procesora, a nawet wydajności zintegrowanej grafiki. Jednak użytkownicy, którzy cenią sobie Thunderbolt, nie będą mieli innego wyboru, jak tylko stanąć po stronie Intela i poradzić sobie z wolniejszym procesorem. Szkoda więc, że wersje AMD nie obsługują USB4, co sprawiłoby, że byłyby łatwiejsze do polecenia niż opcje Envy oparte na Intelu.

Cena i dostępność

HP dostarcza obecnie recenzowany model Envy x360 16 z procesorem Ryzen 7 8840HS, 16 GB pamięci RAM i dyskiem SSD o pojemności 1 TB w cenie 1300 USD.

HP Envy x360 2-in-1 16-ad0097nr - 22/05/2024 v7 (old)
Allen Ngo

Wykonanie
83 / 98 → 85%
Klawiatura
86%
Myszka
82%
Komunikacja
63 / 75 → 84%
Waga
66 / 20-75 → 83%
Akumulator
78%
Wyświetlacz
88%
Wydajność w grach
75 / 78 → 96%
Wydajność w programach użytkowych
95 / 85 → 100%
Temperatura
90%
Hałas
94%
Głośniki
91 / 91 → 100%
Kamerka
45 / 85 → 53%
Średnio
80%
87%
Convertible - Ważona średnia

Transparency

The selection of devices to be reviewed is made by our editorial team. The test sample was provided to the author as a loan by the manufacturer or retailer for the purpose of this review. The lender had no influence on this review, nor did the manufacturer receive a copy of this review before publication. There was no obligation to publish this review. We never accept compensation or payment in return for our reviews. As an independent media company, Notebookcheck is not subjected to the authority of manufacturers, retailers or publishers.

This is how Notebookcheck is testing

Every year, Notebookcheck independently reviews hundreds of laptops and smartphones using standardized procedures to ensure that all results are comparable. We have continuously developed our test methods for around 20 years and set industry standards in the process. In our test labs, high-quality measuring equipment is utilized by experienced technicians and editors. These tests involve a multi-stage validation process. Our complex rating system is based on hundreds of well-founded measurements and benchmarks, which maintains objectivity. Further information on our test methods can be found here.

Price comparison

Please share our article, every link counts!
Mail Logo
> laptopy testy i recenzje notebooki > Laptopy > Recenzja HP Envy x360 2-w-1 16: Ryzen 7 8840HS pokonuje Core Ultra 7 155U
Allen Ngo, 2024-05-23 (Update: 2024-05-23)