

Recenzja laptopa Asus V16 V3607V: GeForce Grafika RTX bez rozbijania banku
Debiut wydajności Core 7 240H.
Jeśli tylko wiedzą Państwo, gdzie są cięcia, Asus V16 może być solidnym rozwiązaniem, które sprawdzi się w większości scenariuszy domowych, biurowych lub klasowych.Allen Ngo, 👁 Allen Ngo (tłumaczenie DeepL / Ninh Duy) Opublikowany 🇺🇸 🇫🇷 ...
Werdykt - dobrze wyposażony i niedrogi
Wraz z rosnącą ceną serii Vivobook, model V16 został wprowadzony jako nowa opcja z niższej półki dla użytkowników o ograniczonym budżecie. V16 całkiem dobrze zaspokaja tę przestrzeń ~ 1000 USD, równoważąc nowy i przyzwoicie szybki procesor z dyskretnym GPU RTX w konstrukcji, która jest dość cienka i przenośna, aby być konkurencyjna w stosunku do HP Pavilion Plus 16 lub cięższym Dell Inspiron 16 Plus 7640.
Cięcia są jednak zauważalne. Na przykład wyświetlacz oferuje wąskie pokrycie kolorów, a plastikowa obudowa może wydawać się dość tania. Wspomniany wcześniej HP wydaje się mocniejszy i oferuje nawet >99 procent kolorów sRGB, choć w wyższej cenie niż nasz Asus.
Konfiguracja RTX 4050 w chwili pisania tego tekstu kosztuje 100 USD więcej niż konfiguracja RTX 3050. Potencjalni nabywcy mogą chcieć rozważyć opcję RTX 4050, ponieważ oferuje ona o ponad 50 procent wyższą wydajność graficzną niż RTX 3050.
Za
Przeciw
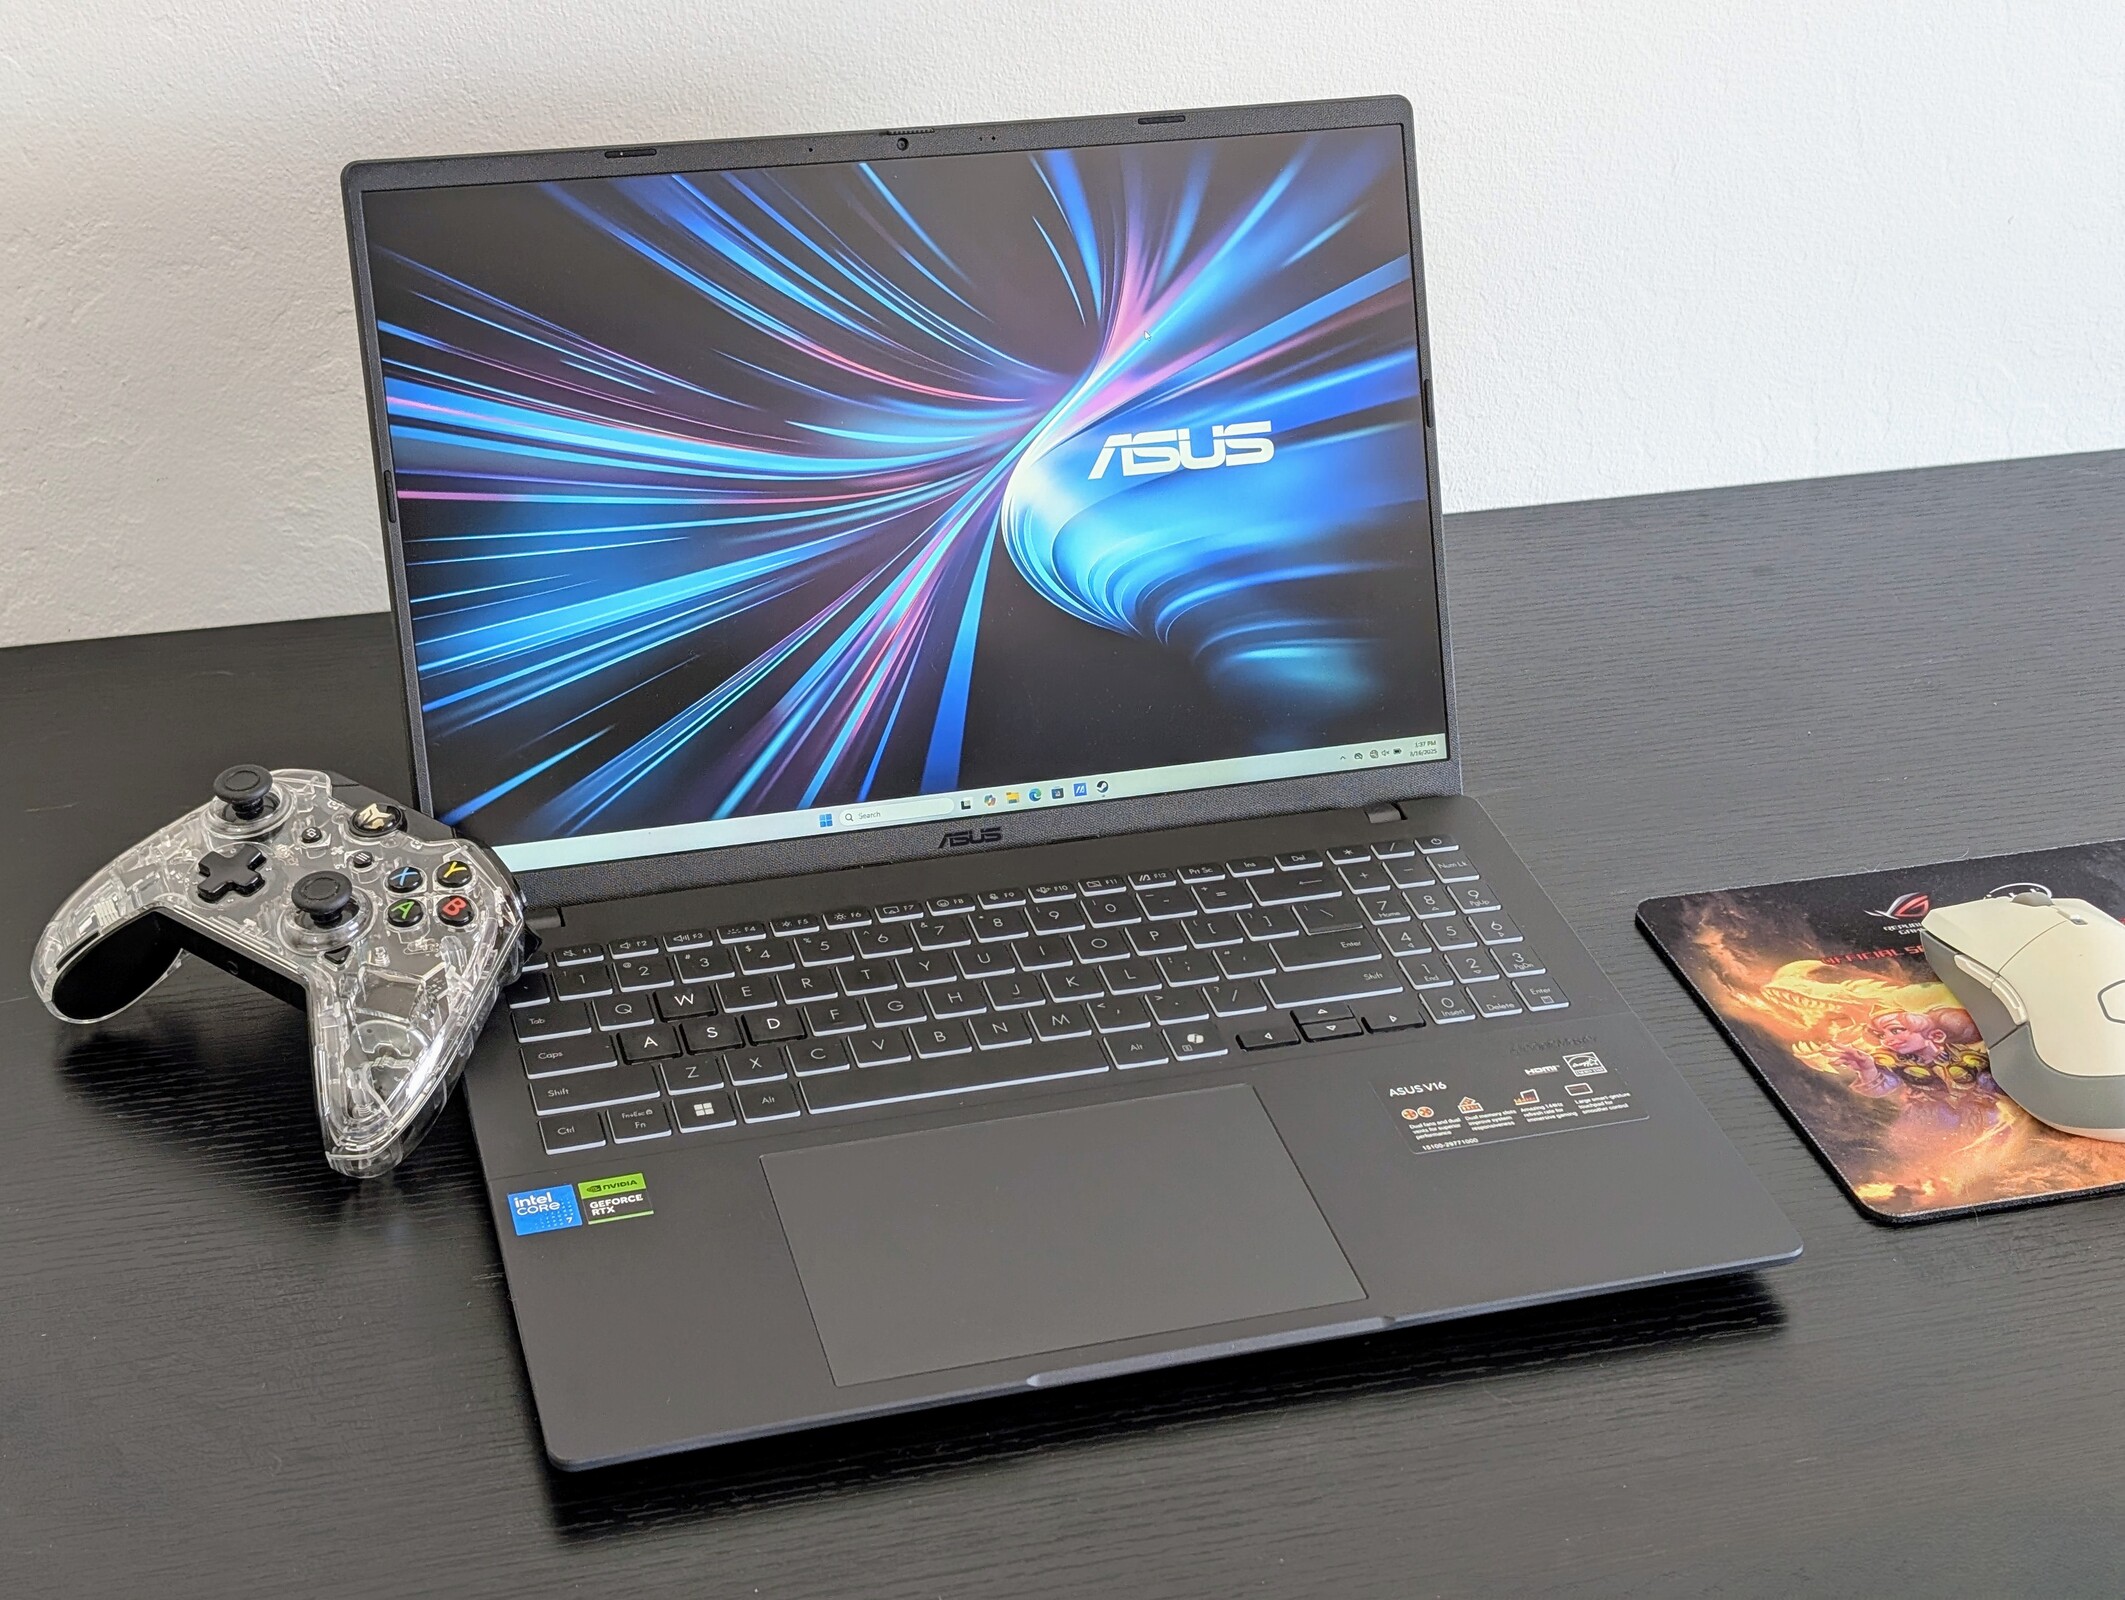
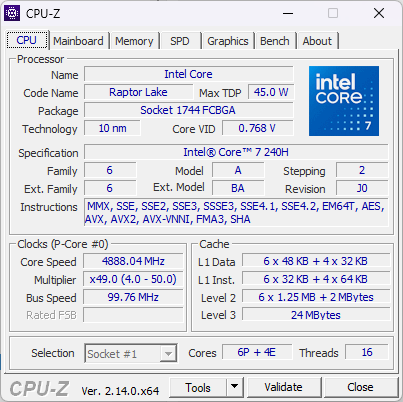
Nie mylić z VivoBook 16, V16 jest budżetowym modelem multimedialnym Asusa w cenach początkowych, które są nawet niższe niż w przypadku serii VivoBook. Brakuje mu pewnych luksusowych funkcji, które można znaleźć w VivoBook, takich jak OLED i atrakcyjne metalowe konstrukcje. Model 2025 V16 jest wyposażony w nowy procesor Core 7 240H z wyższej półki.
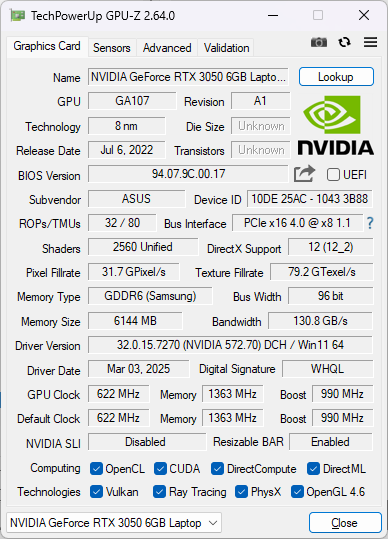
Nasza jednostka testowa jest wyposażona we wspomniany procesor, wyświetlacz IPS 1200p 144 Hz i starszą kartę graficzną GeForce RTX 3050 o pojemności 6 GB, aby utrzymać cenę poniżej 1000 USD. Inne jednostki SKU mogą być dostarczane z RTX 4050.
Alternatywy dla V16 obejmują inne budżetowe laptopy multimedialne z dyskretnymi GPU, takie jak HP Pavilion Plus 16, Dell Inspiron 16 Plus lub Lenovo IdeaPad Pro 5 16.
Więcej recenzji Asusa:
Specyfikacje
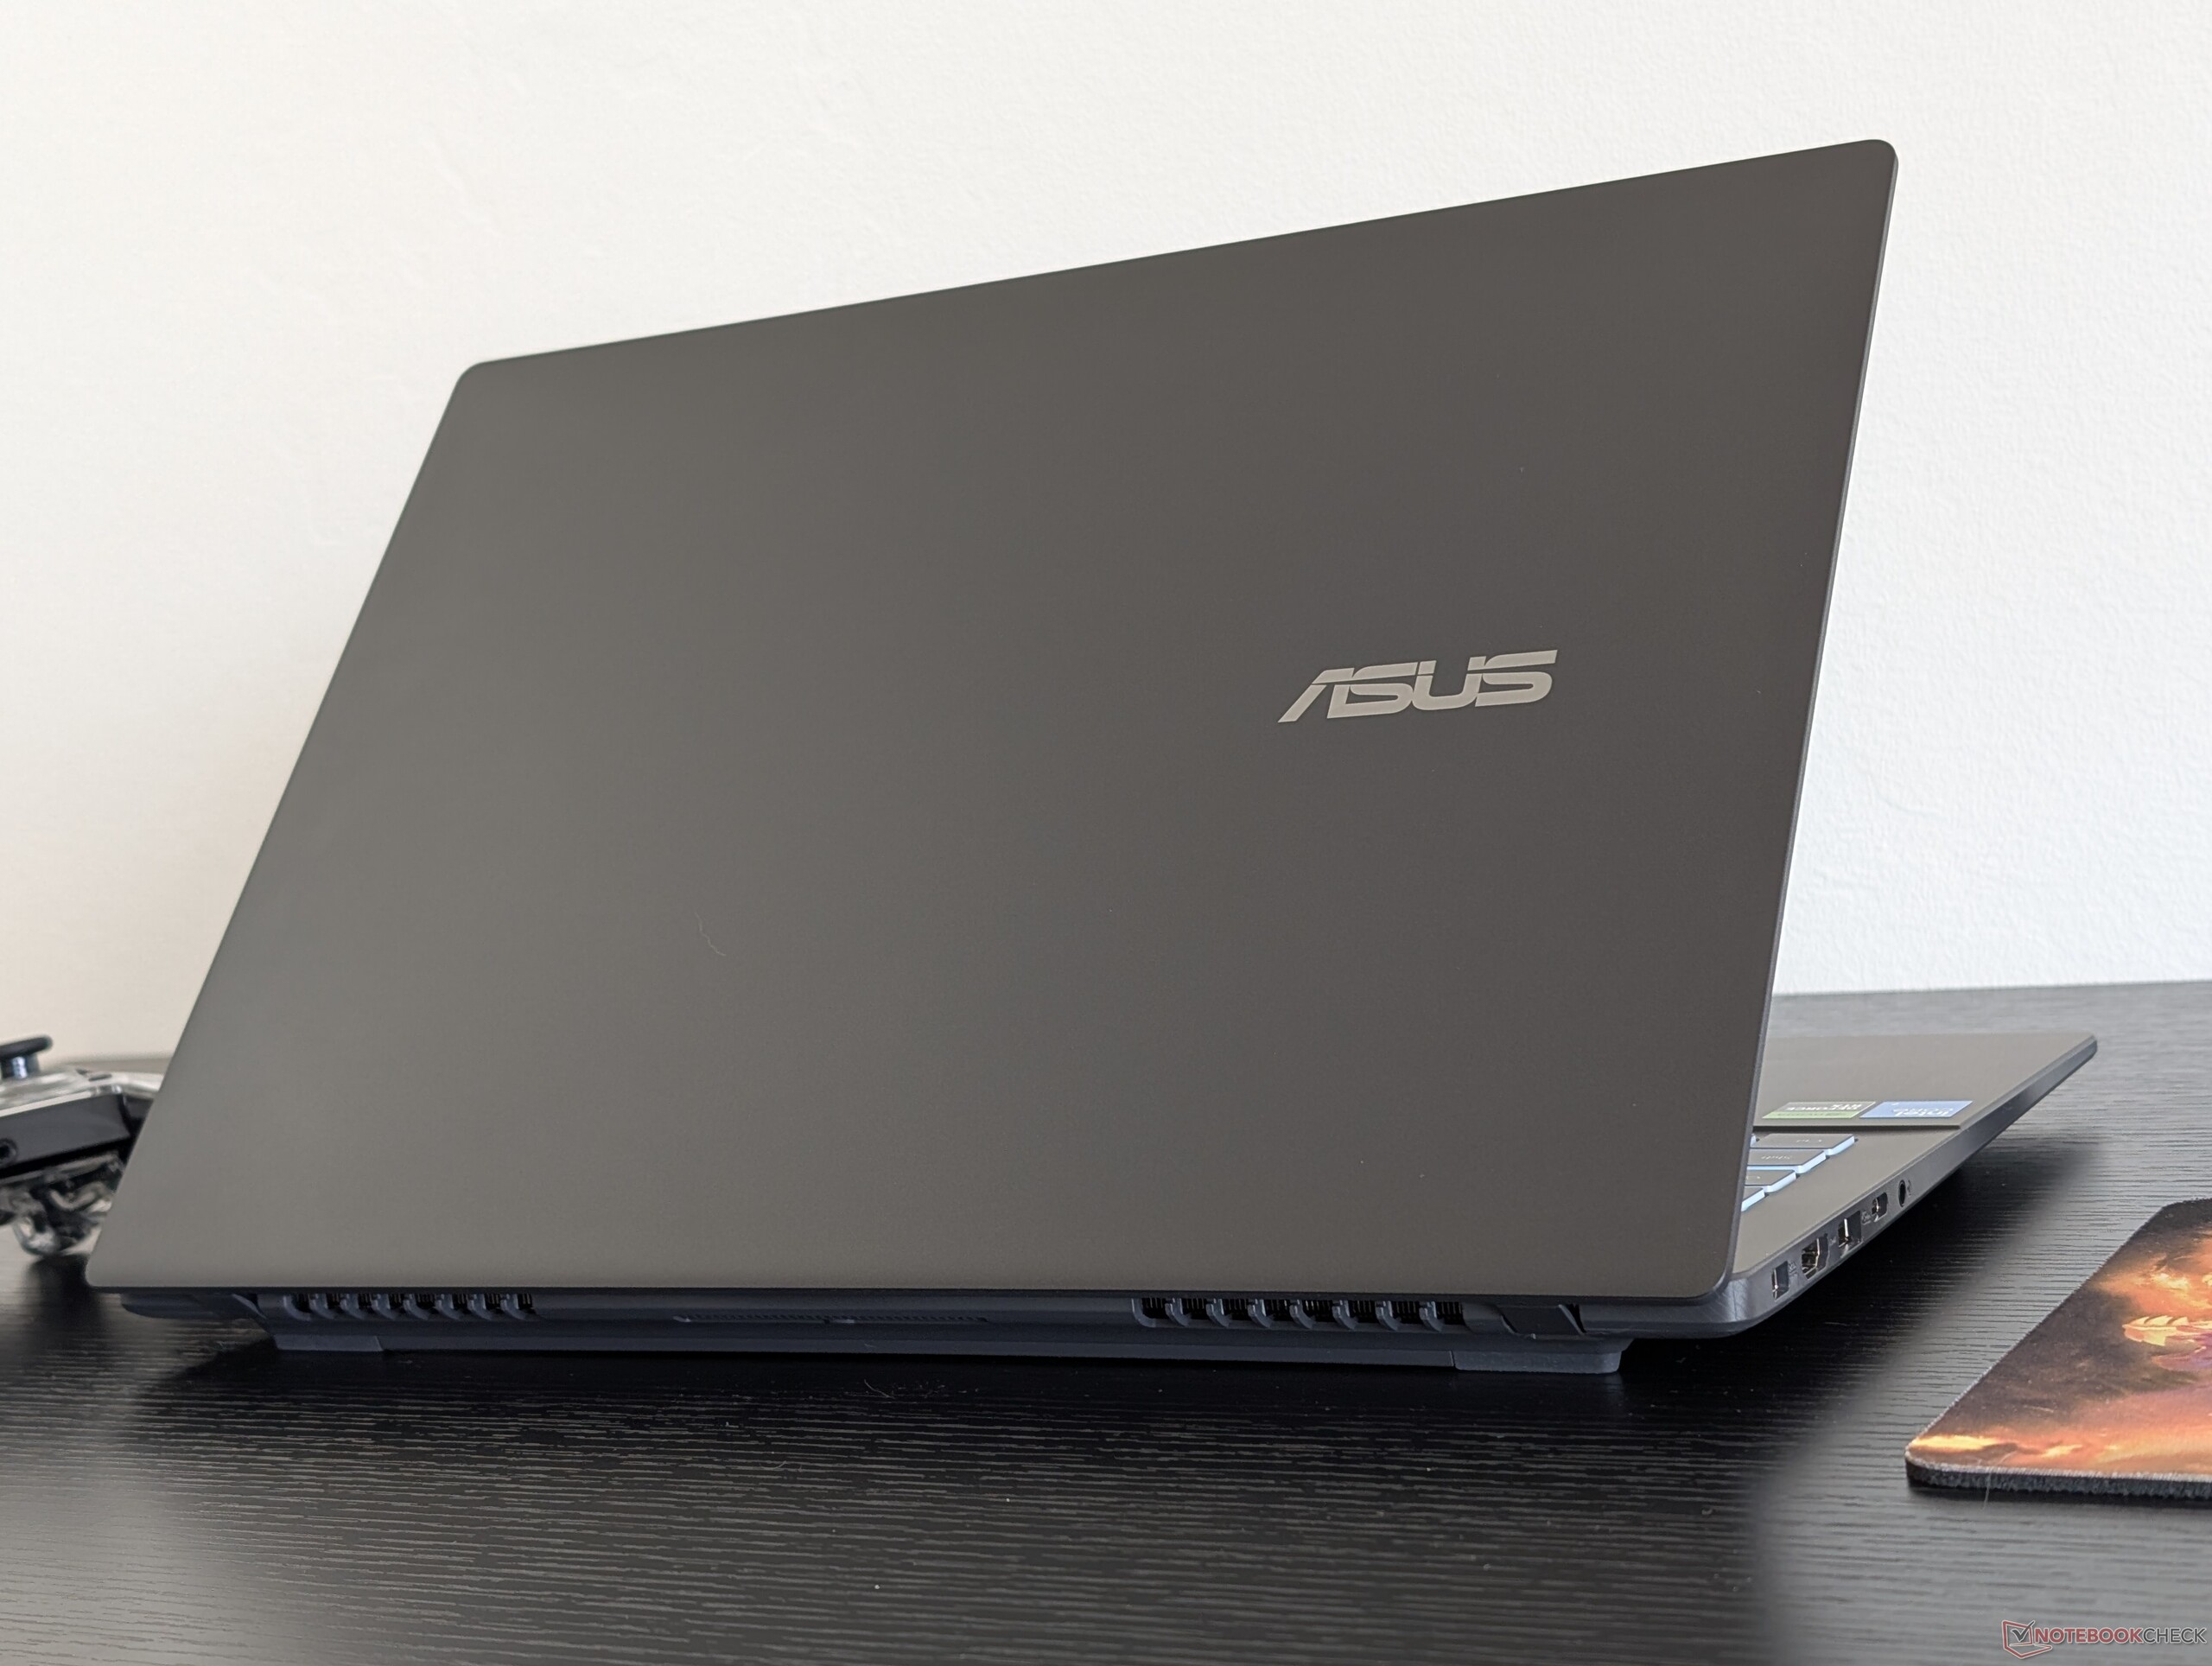
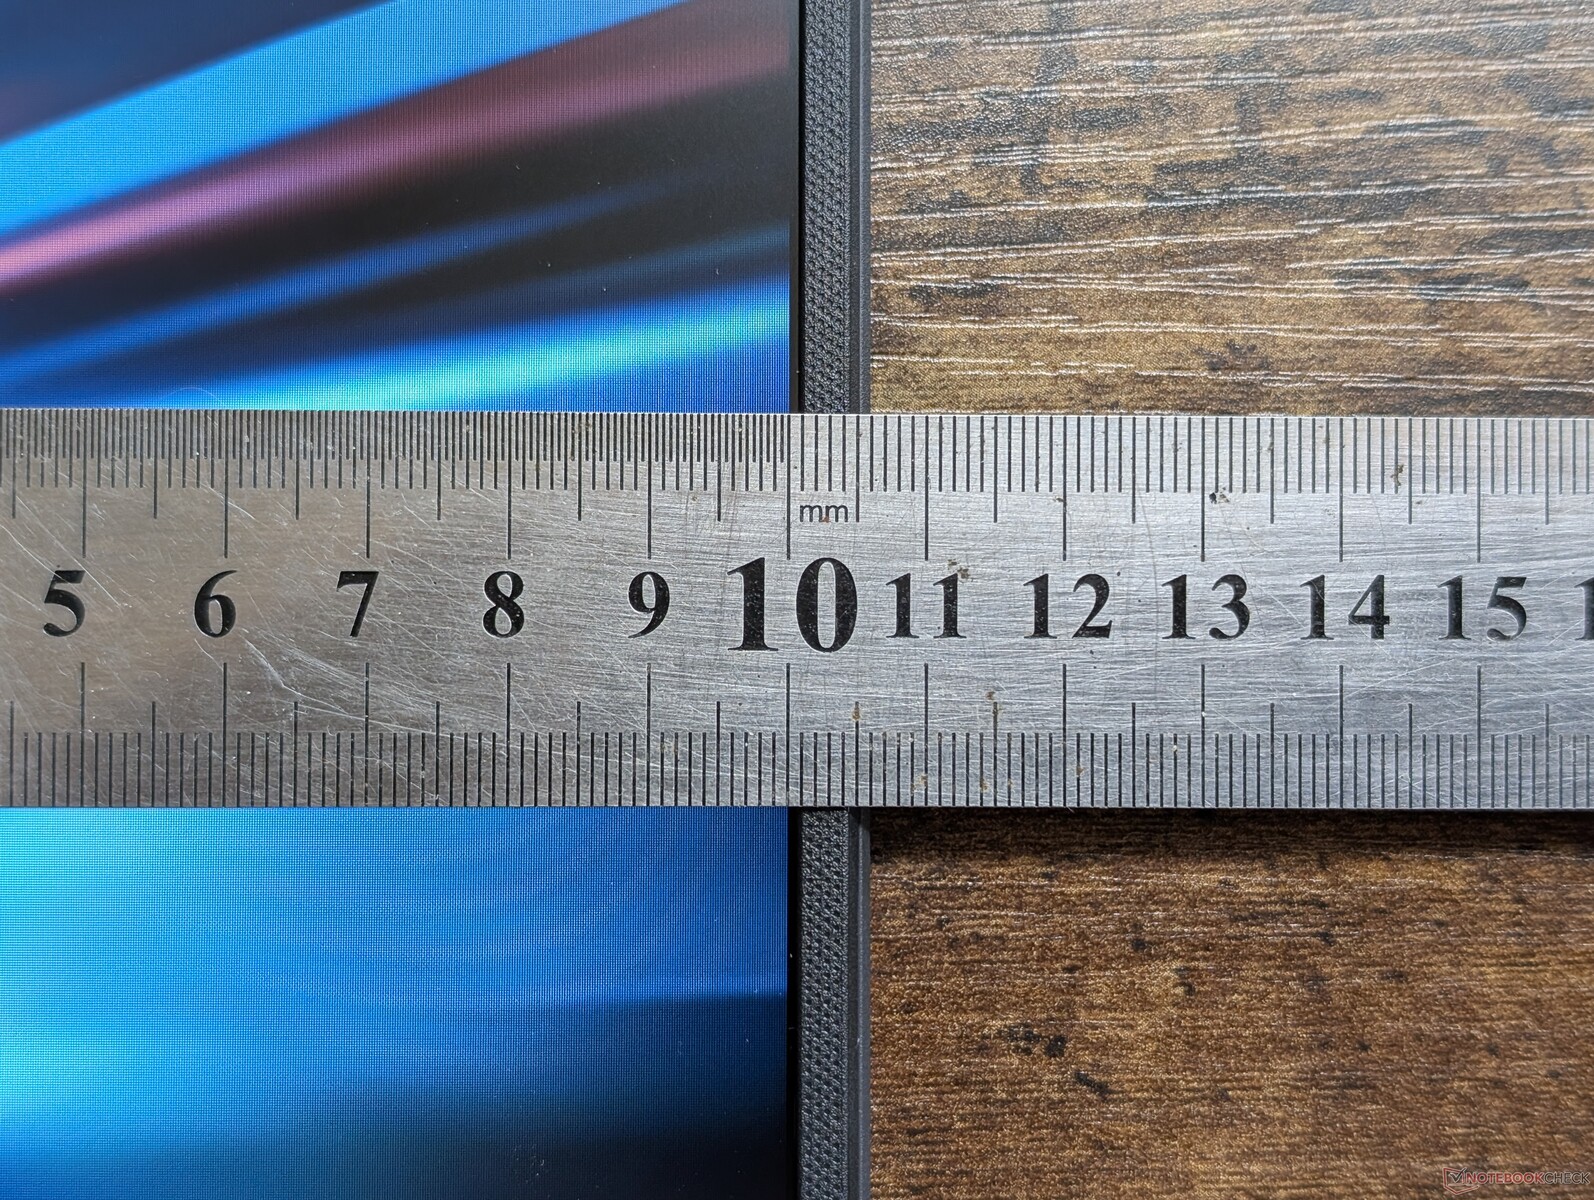
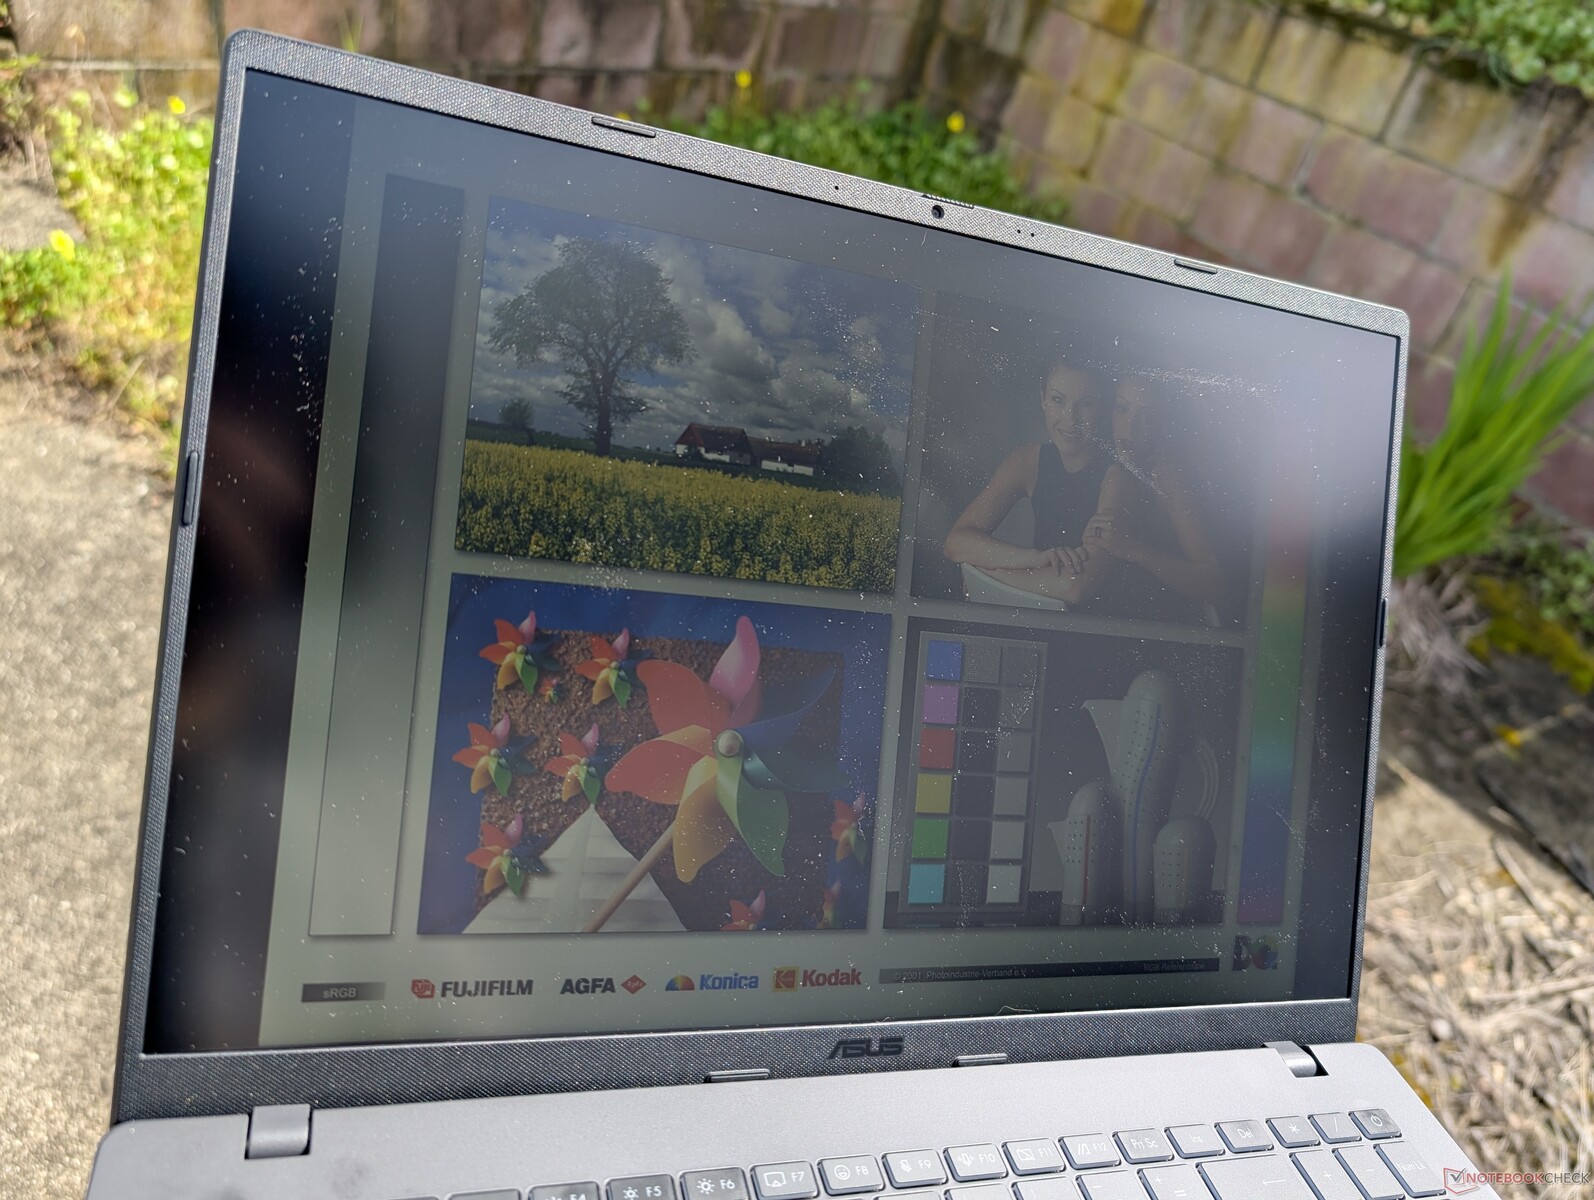
Obudowa - monotonny czarny plastik
Obudowa jest bezapelacyjnie plastikowa, wliczając w to nawet zewnętrzną pokrywę, gdzie producenci często używają metalu dla lepszego pierwszego wrażenia. Podstawa i pokrywa są podatne na skręcanie i niezwykle podatne na nieestetyczne odciski palców.
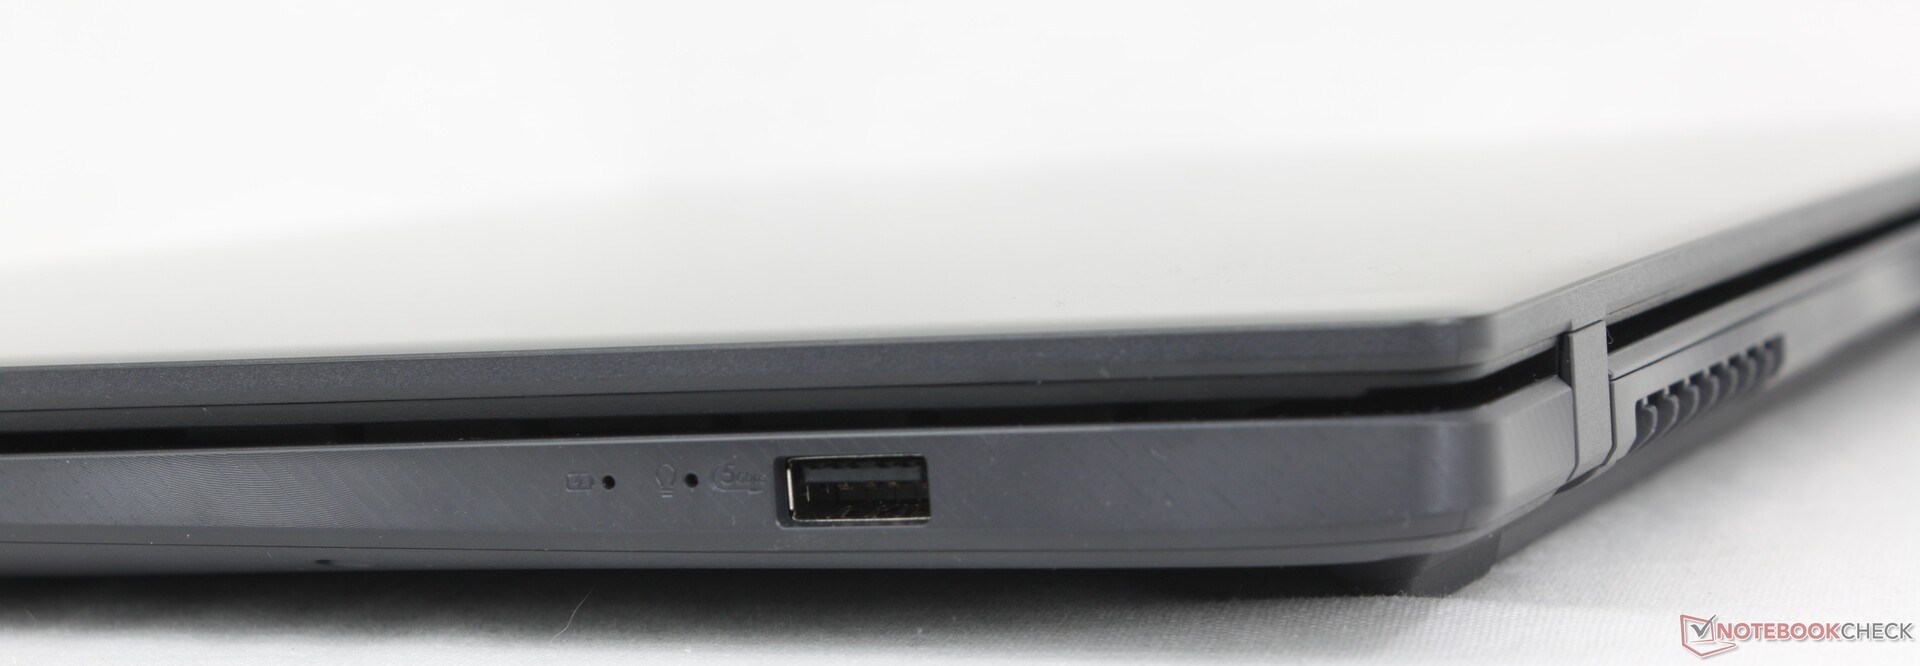
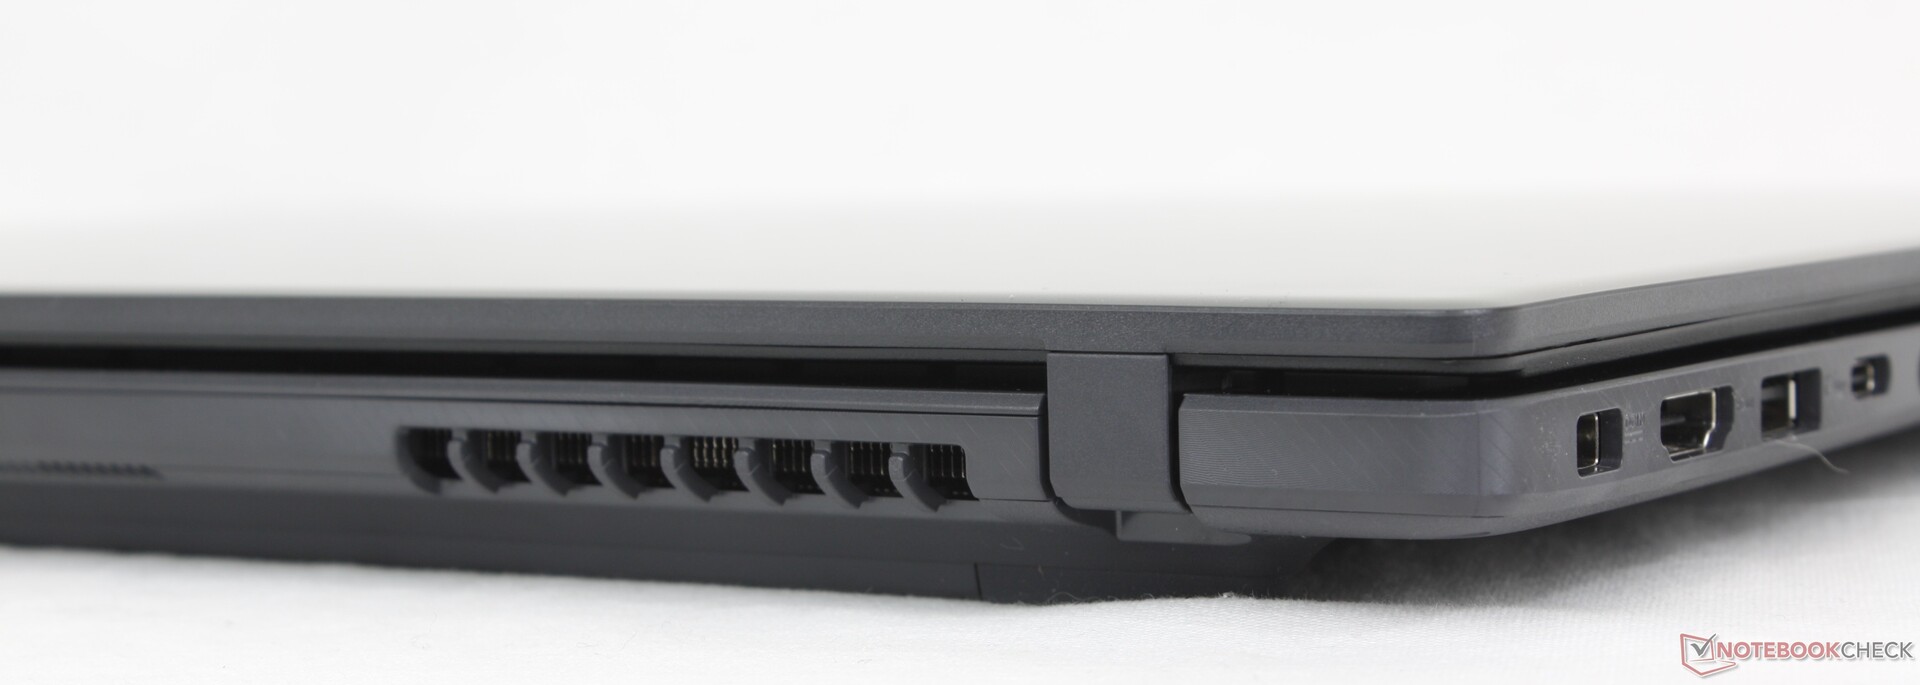
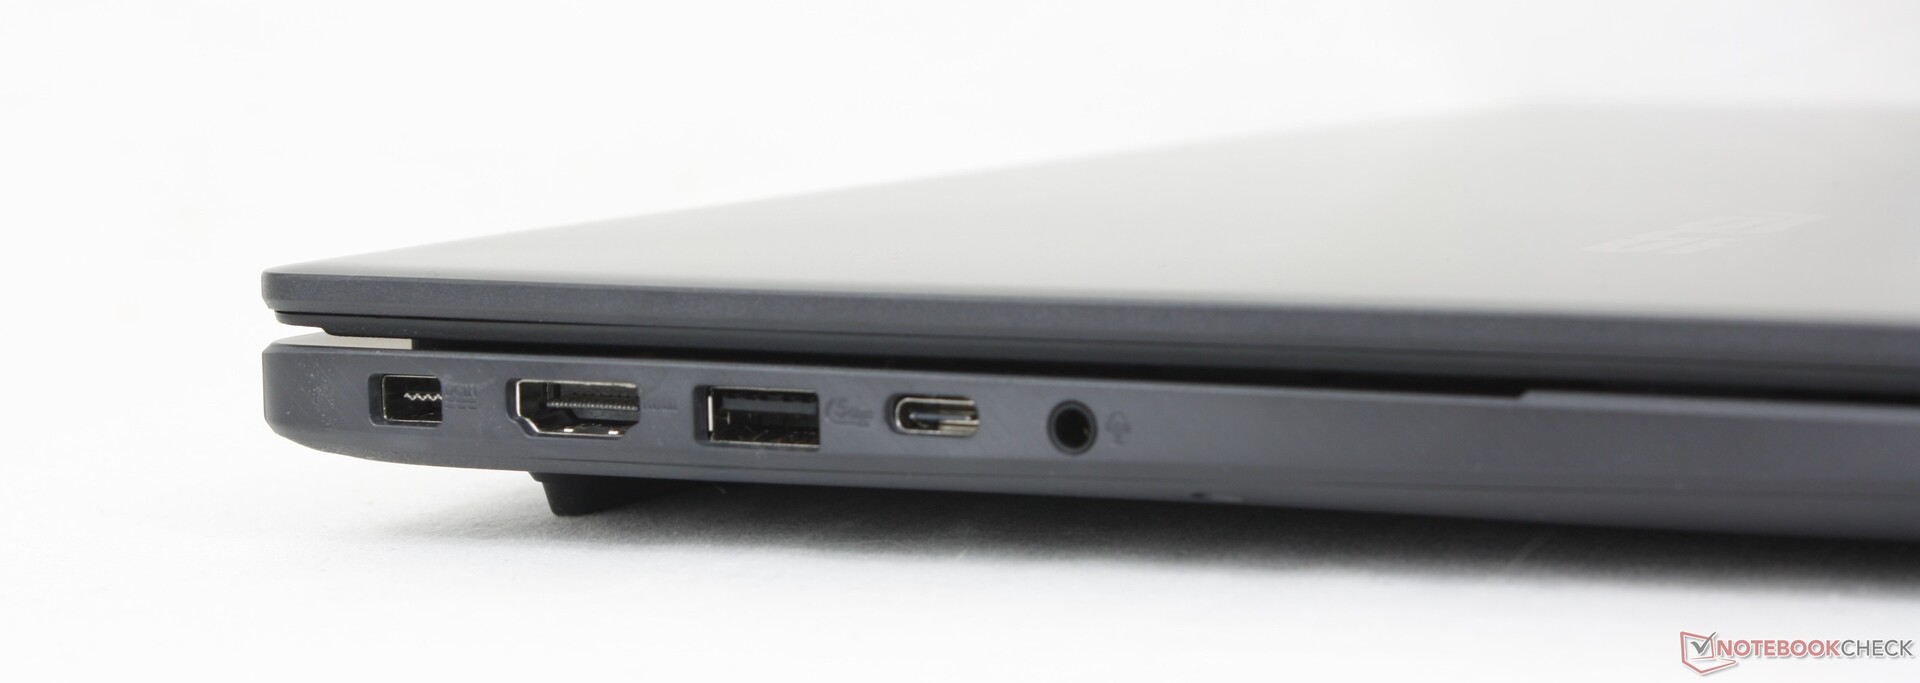
Łączność
Port USB-C nie obsługuje Thunderbolt, w przeciwieństwie do droższego modelu VivoBook Pro 16 który integruje szerszą gamę portów. Irytujące jest również to, że V16 wykorzystuje inny kabel zasilający niż seria VivoBook.
Komunikacja
Wymienny Realtek RTL8852BE jest standardowo wyposażony w łączność Wi-Fi 6 i Bluetooth 5.3. Nie ma wsparcia dla Wi-Fi 6E lub Wi-Fi 7.
Kamera internetowa
Kamera internetowa 2 MP z fizyczną migawką jest standardem. Nie ma kamery na podczerwień, aby zaoszczędzić na kosztach.


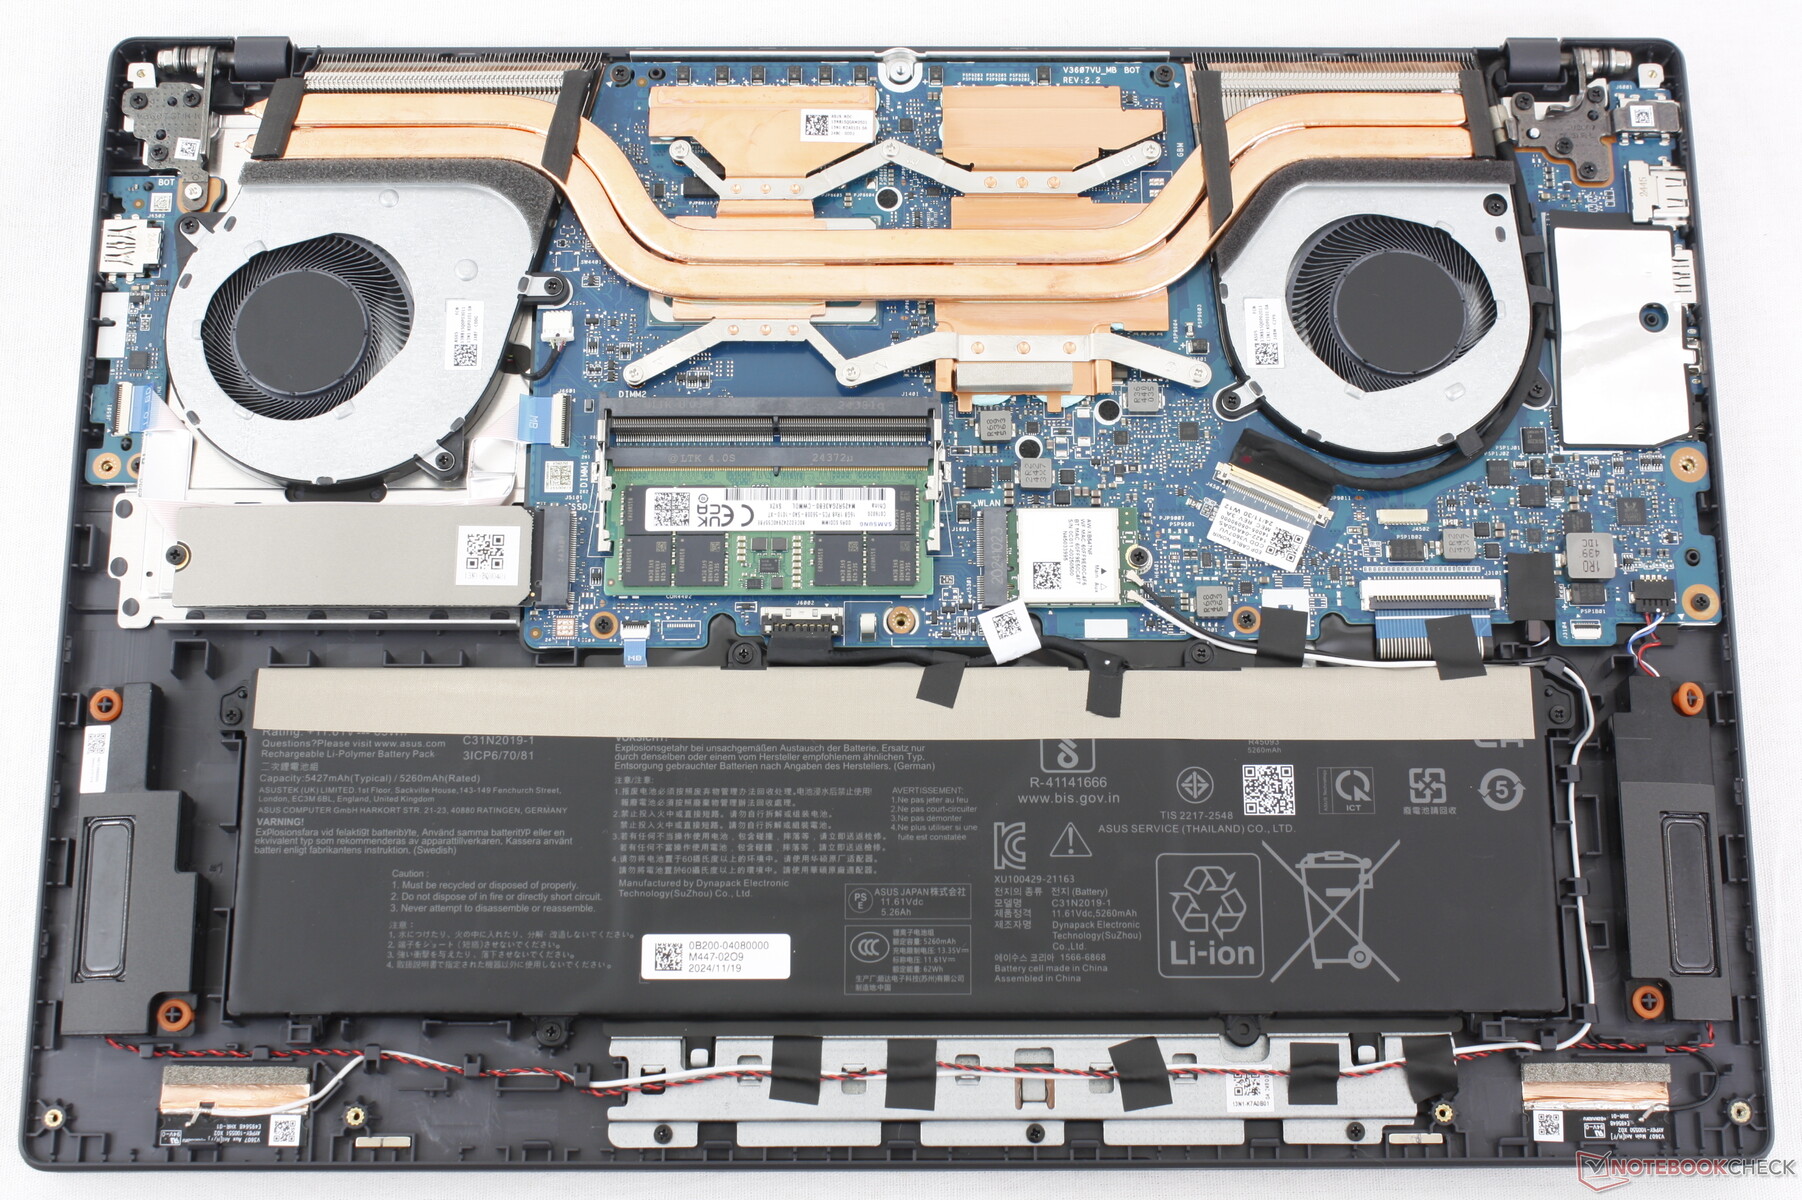
Konserwacja
Dolny panel można stosunkowo łatwo zdjąć za pomocą śrubokręta krzyżakowego, co ułatwia serwisowanie. Dodatkowy dysk SSD nie jest obsługiwany.
Zrównoważony rozwój
Asus stara się być neutralny pod względem emisji dwutlenku węgla, ale poza tym nie ma żadnych szczegółowych informacji na temat procesu produkcyjnego V16. Opakowanie detaliczne składa się głównie z papieru i tektury, z niewielką ilością plastiku.
Akcesoria i gwarancja
W pudełku nie ma żadnych dodatków poza zasilaczem sieciowym i dokumentacją. W przypadku zakupu w Stanach Zjednoczonych obowiązuje roczna gwarancja producenta.
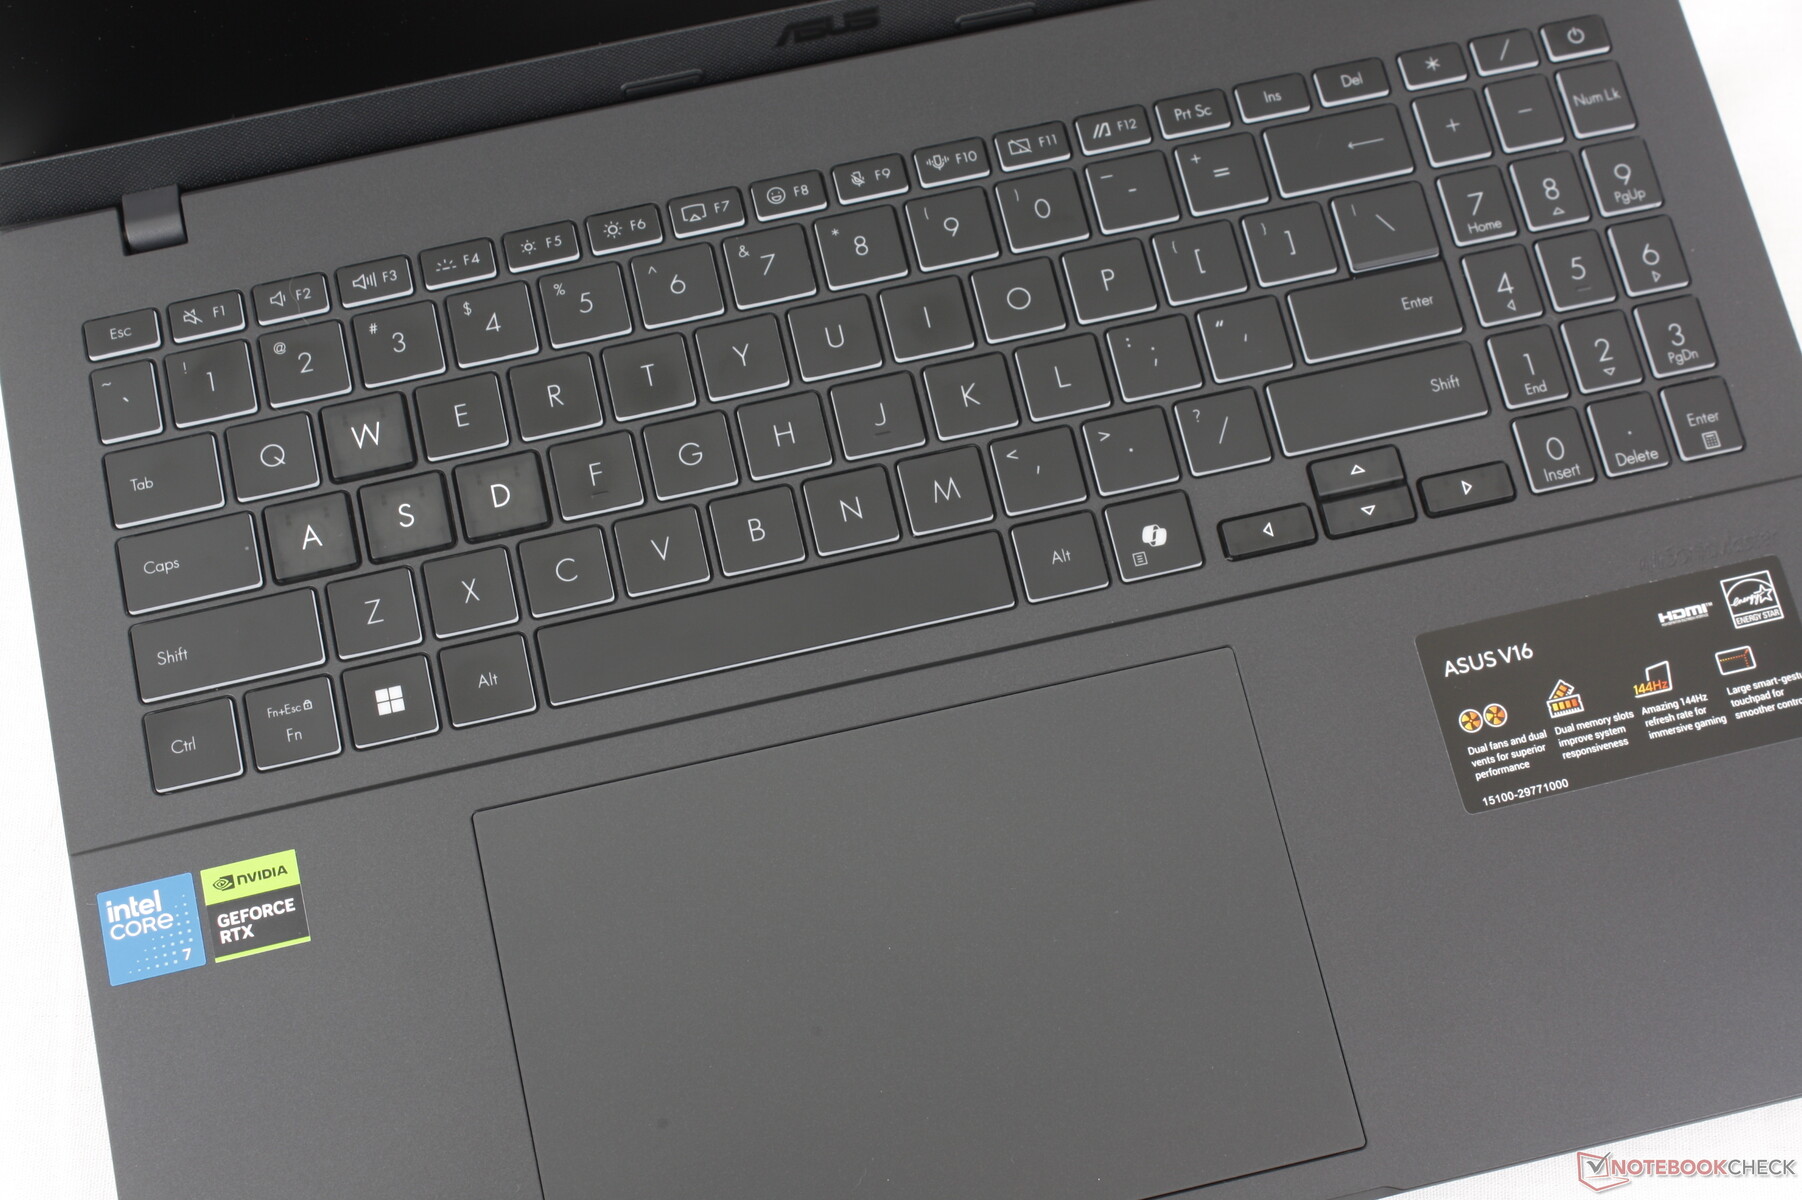
Urządzenia wejściowe - VivoBook Vibes
Klawiatura
V16 przyjmuje klawiaturę z serii VivoBook 16 na dobre i na złe. Skok i sprzężenie zwrotne mogłyby być odpowiednio głębsze i silniejsze, ale działa wystarczająco niezawodnie bez konieczności wydawania więcej na alternatywy z lepszymi klawiaturami, takimi jak ThinkPad serii T lub EliteBook.
Panel dotykowy
Klawiatura ma wymiary 15 x 10 cm w porównaniu do zaledwie 11,5 x 8 cm w Dell Inspiron 16 Plus 7640 Dell Inspiron 16 Plus 7640. Niestety, sprzężenie zwrotne jest bardzo miękkie i ciche. Naciskanie wymaga również większej siły niż w większości innych laptopów, co może stać się niewygodne po krótkiej chwili.
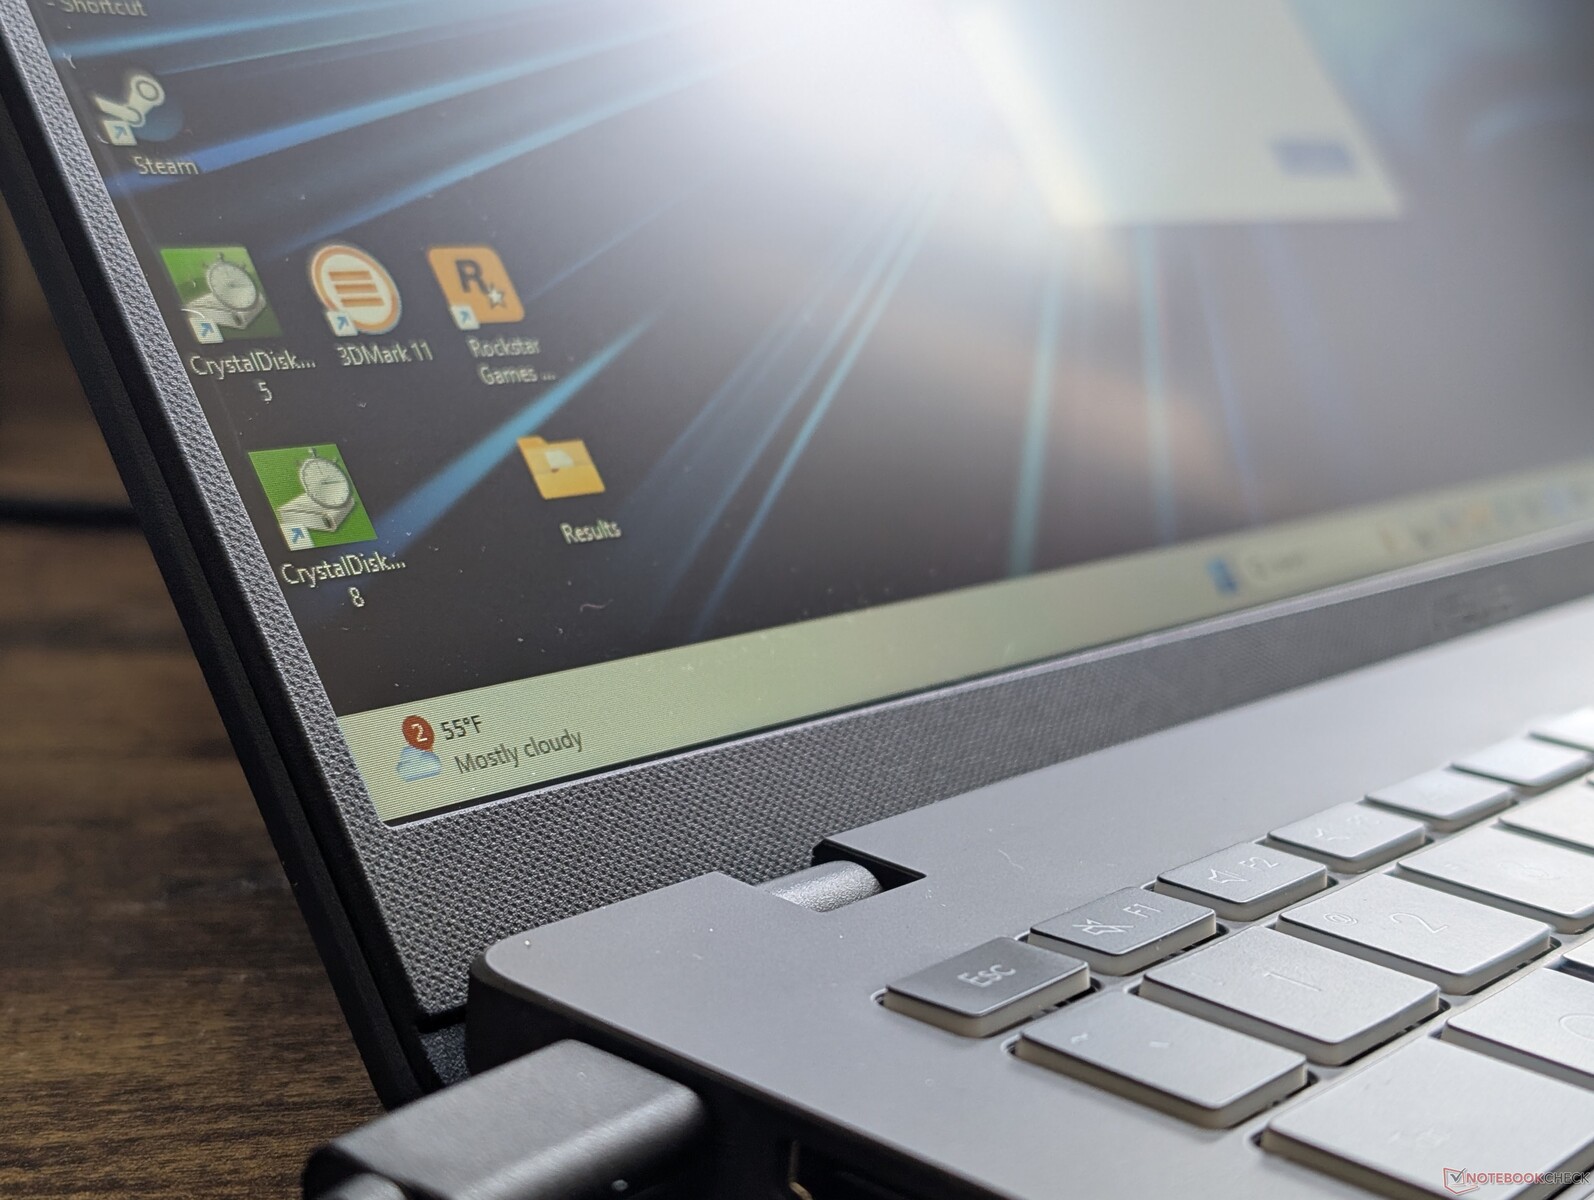
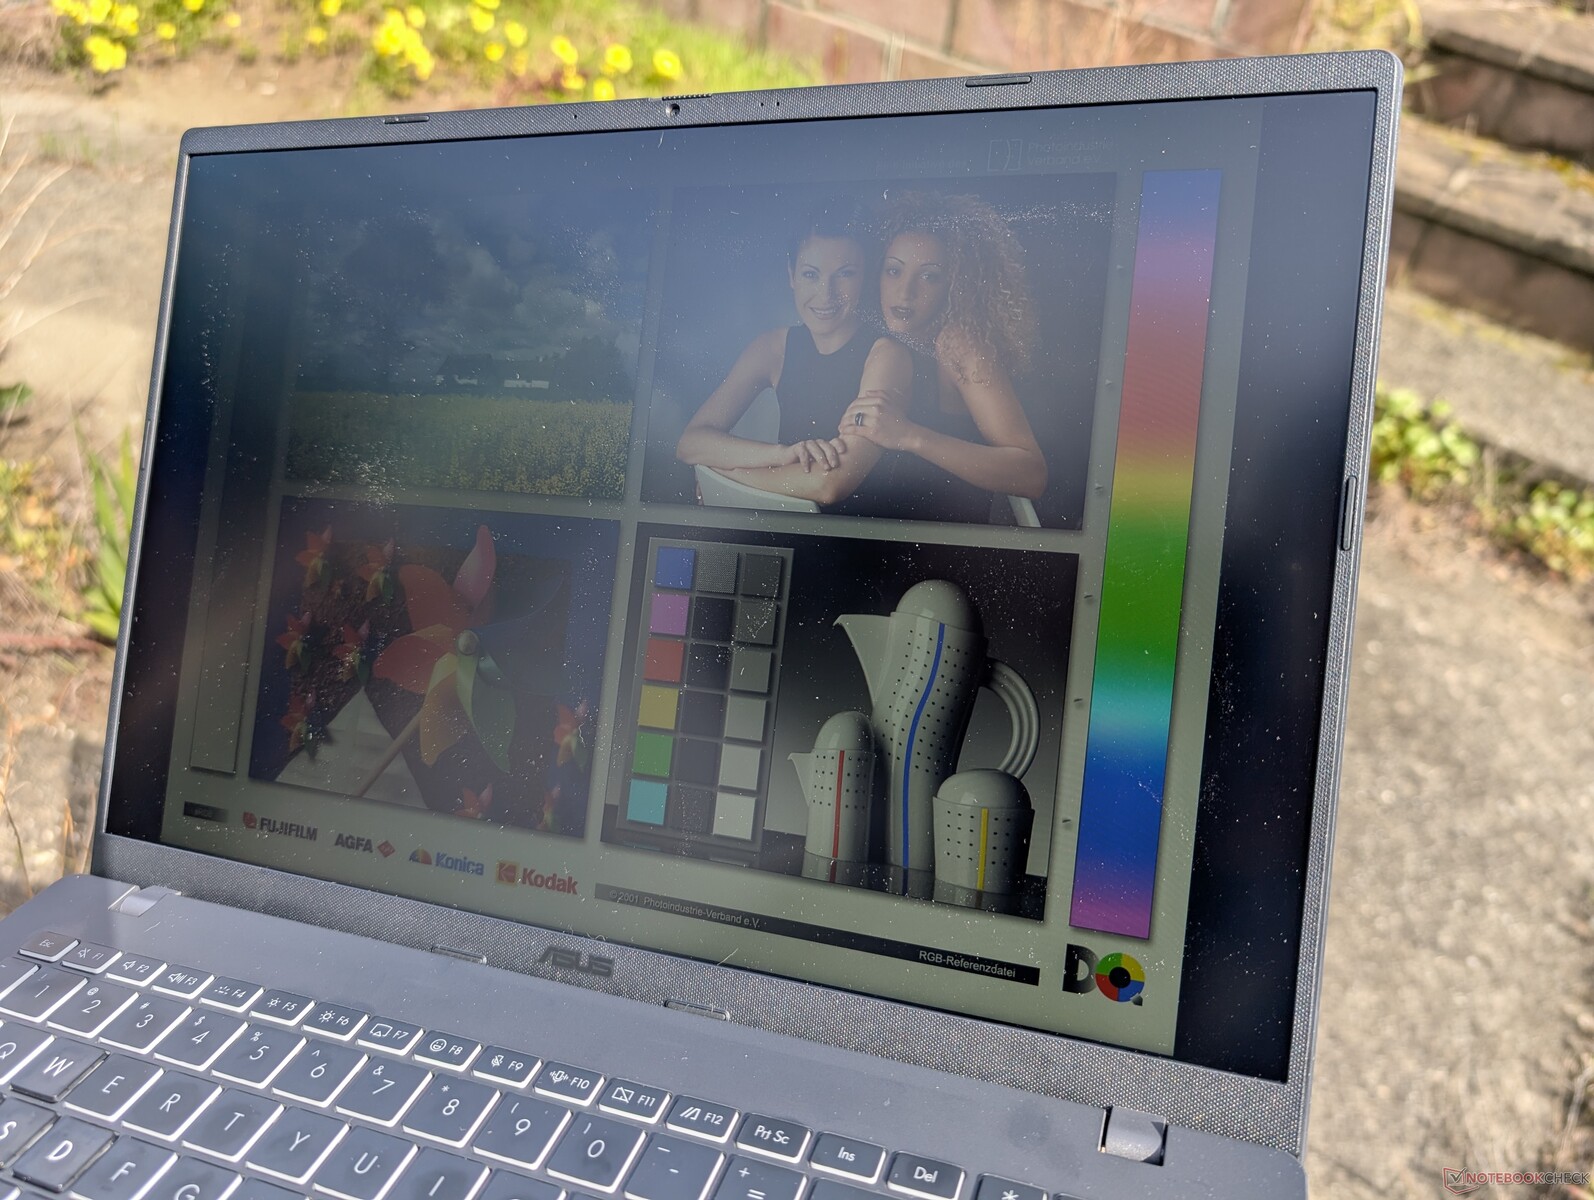
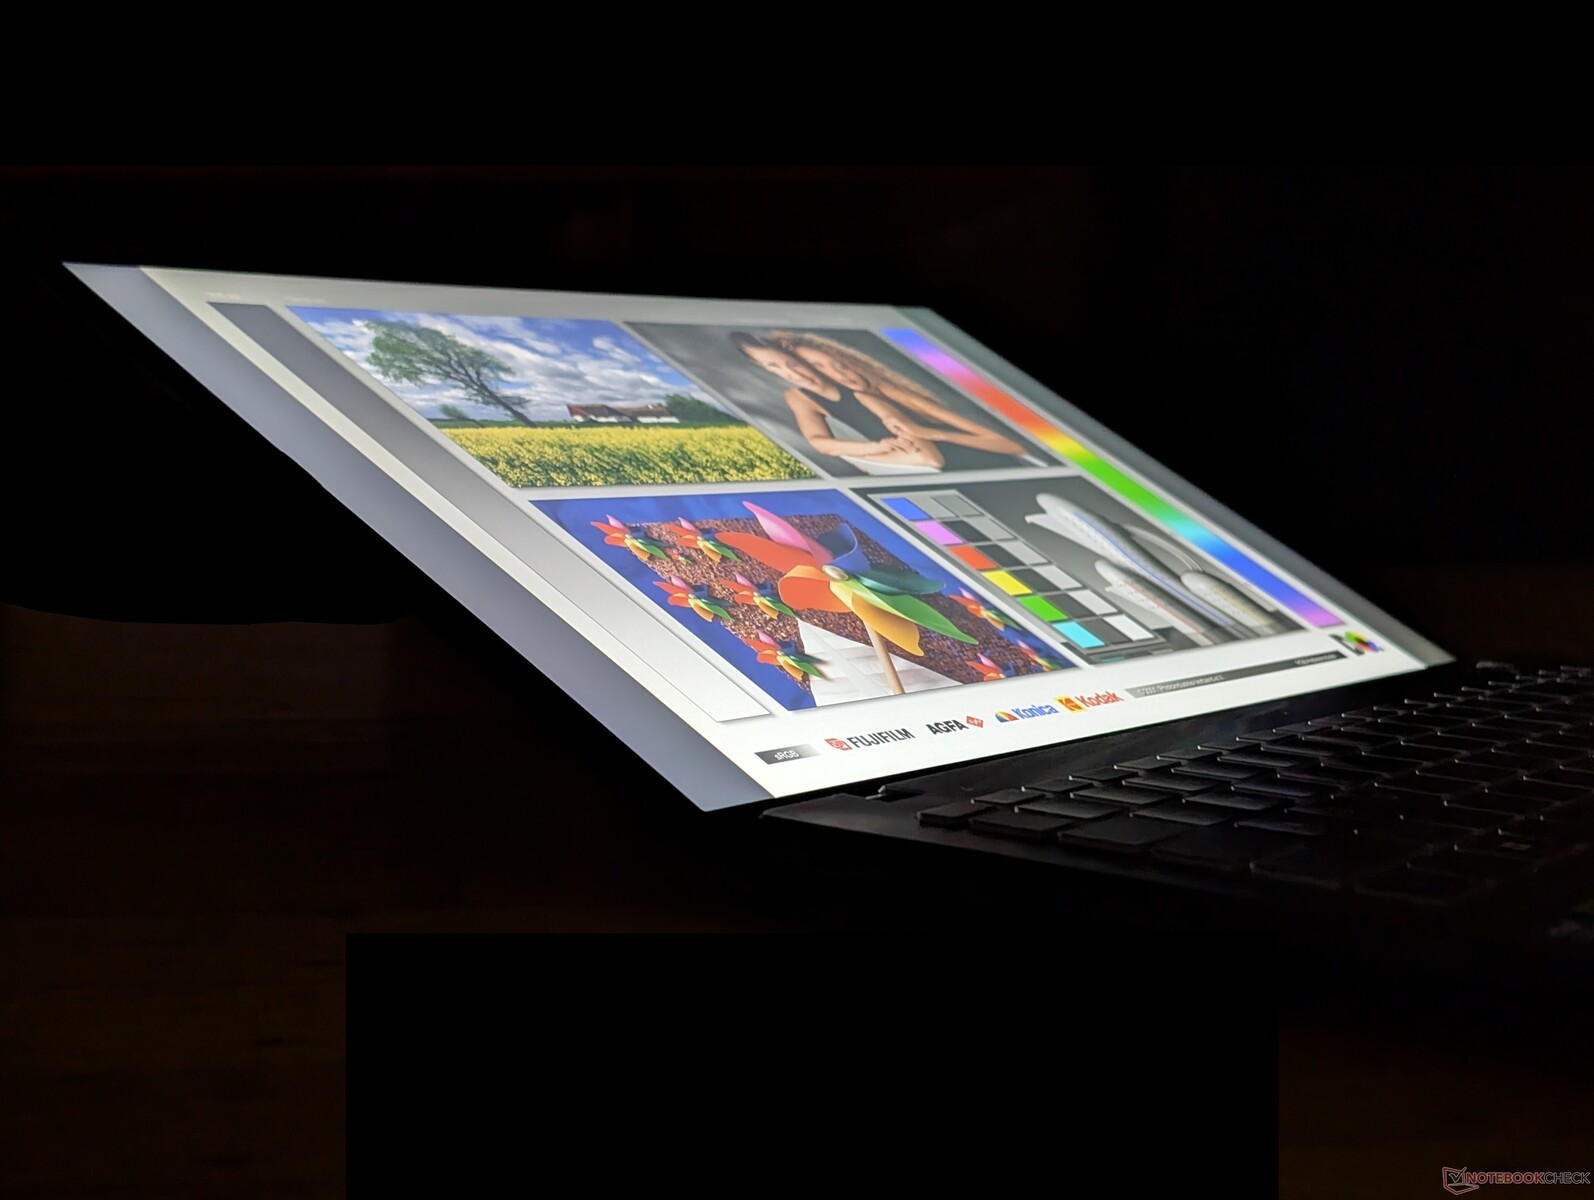
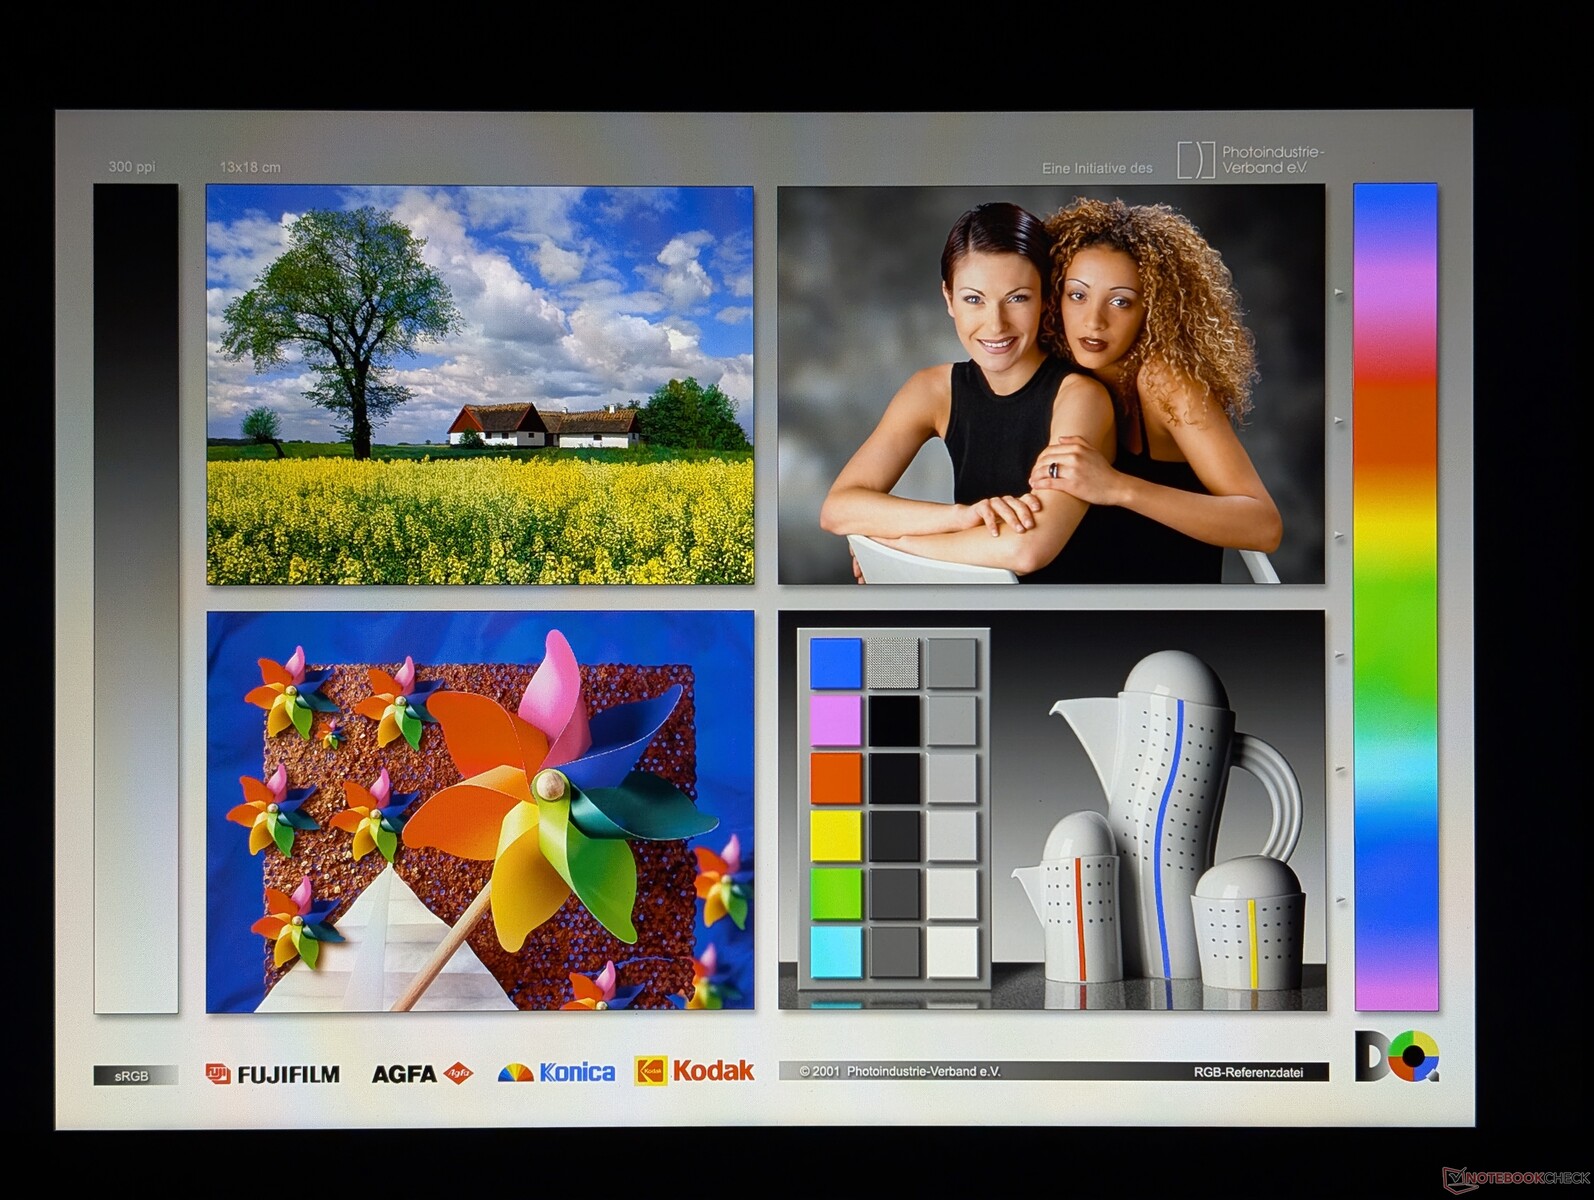
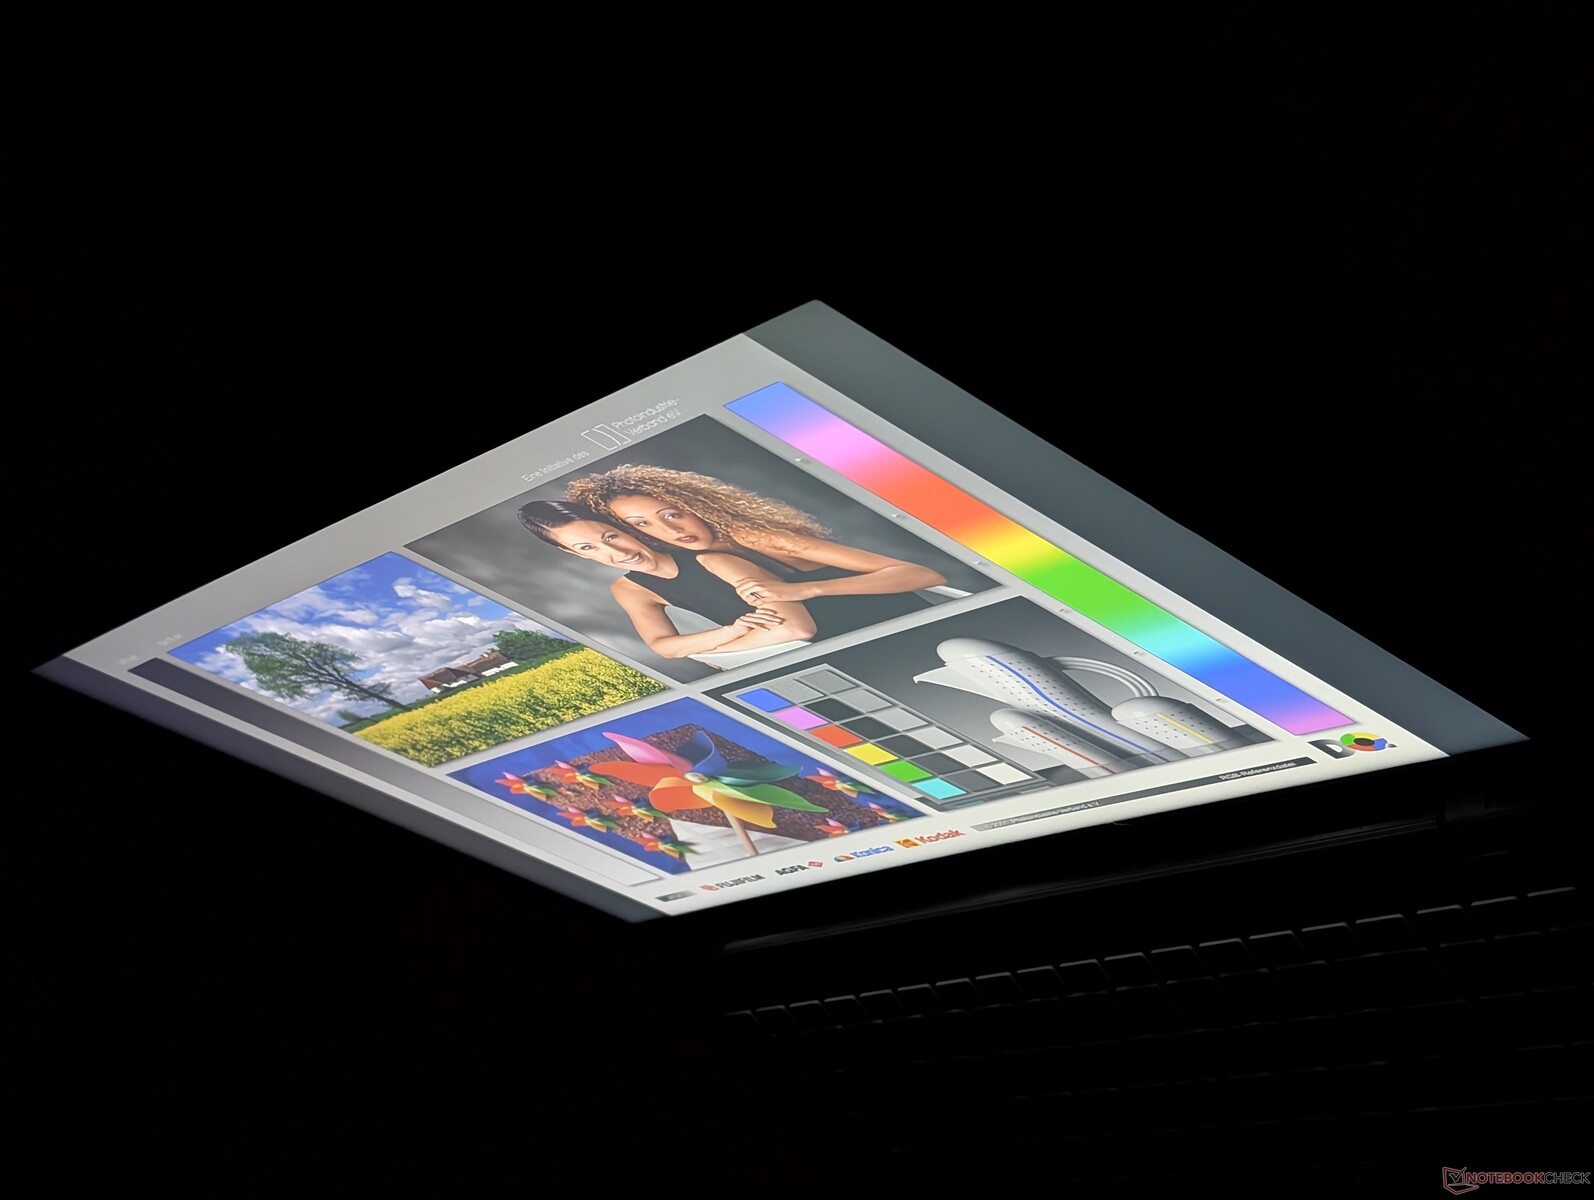
Wyświetlacz - 144 Hz w standardzie
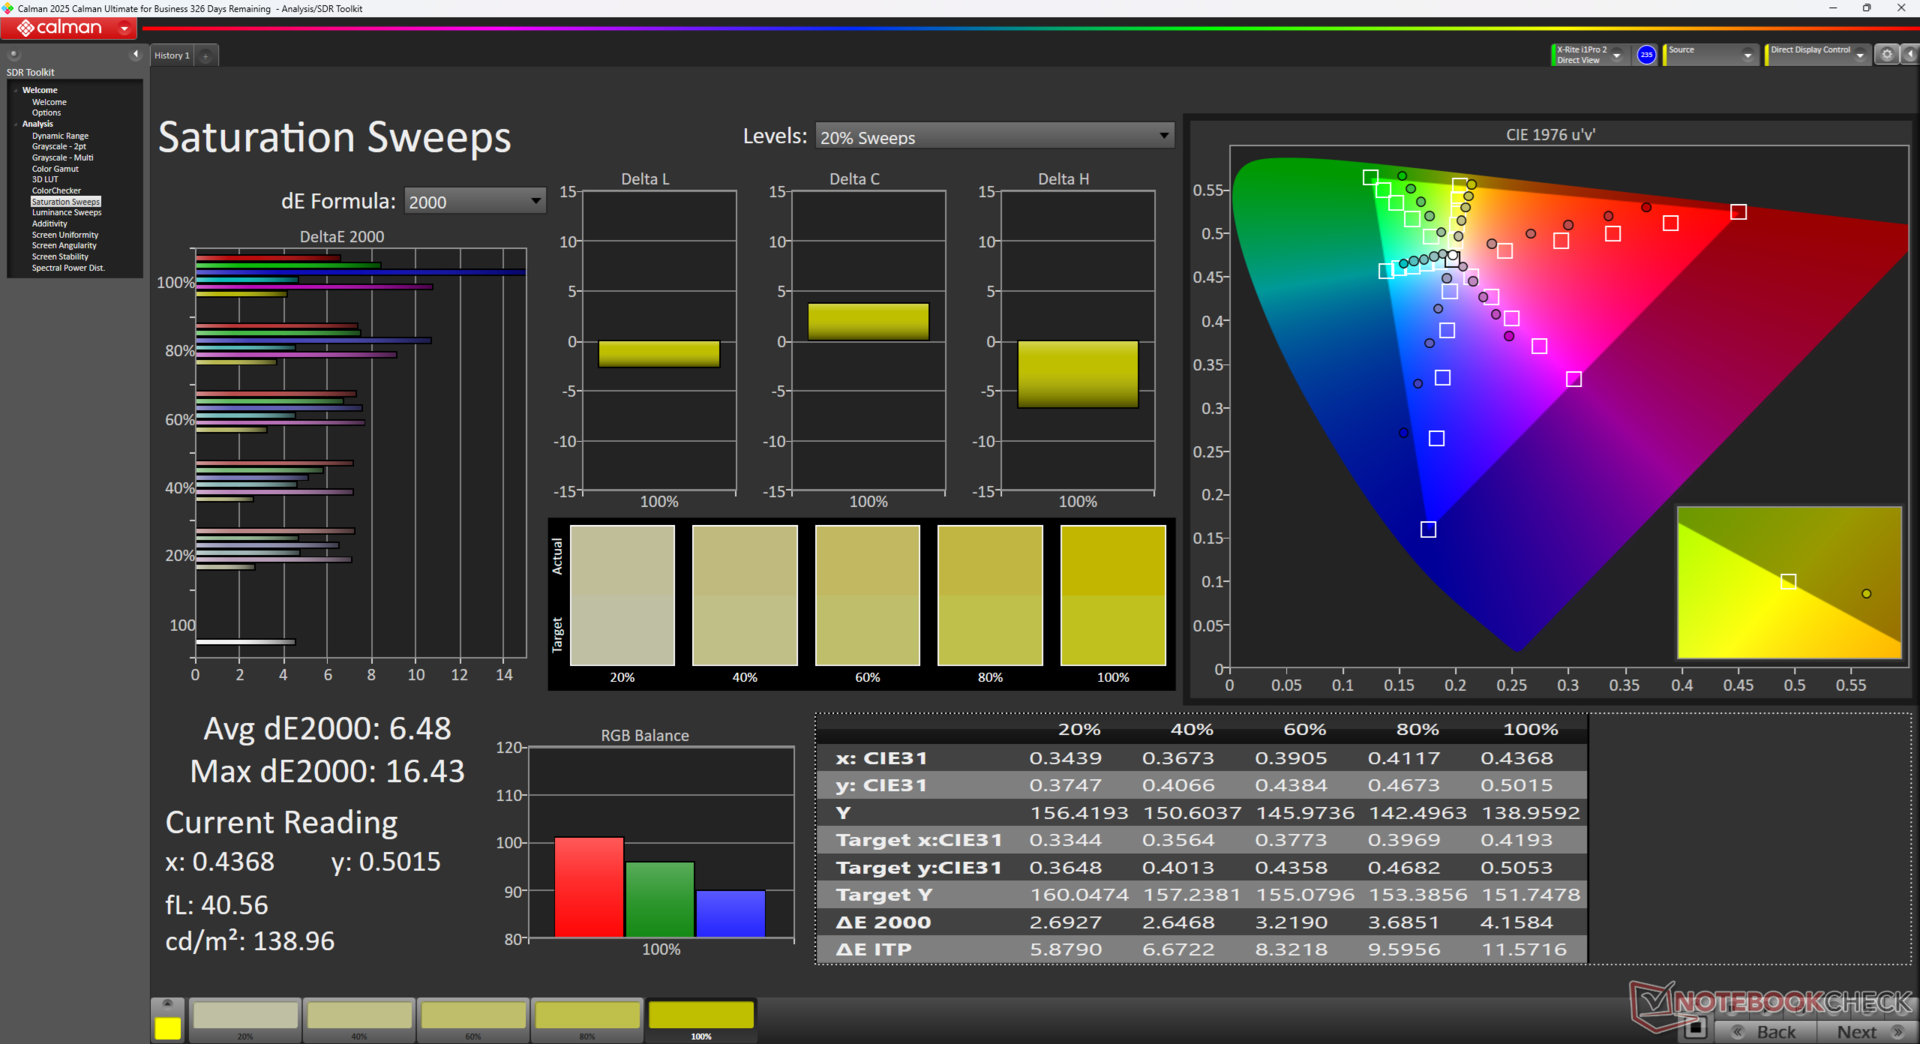
Najbardziej godną uwagi cechą wyświetlacza jest natywna częstotliwość odświeżania 144 Hz, zapewniająca płynne sterowanie kursorem i szybkość reakcji. Poza tym jest to budżetowy panel z wąskimi kolorami, niskim współczynnikiem kontrastu i średnią maksymalną jasnością.

| |||||||||||||||||||||||||
rozświetlenie: 88 %
na akumulatorze: 313.3 cd/m²
kontrast: 627:1 (czerń: 0.5 cd/m²)
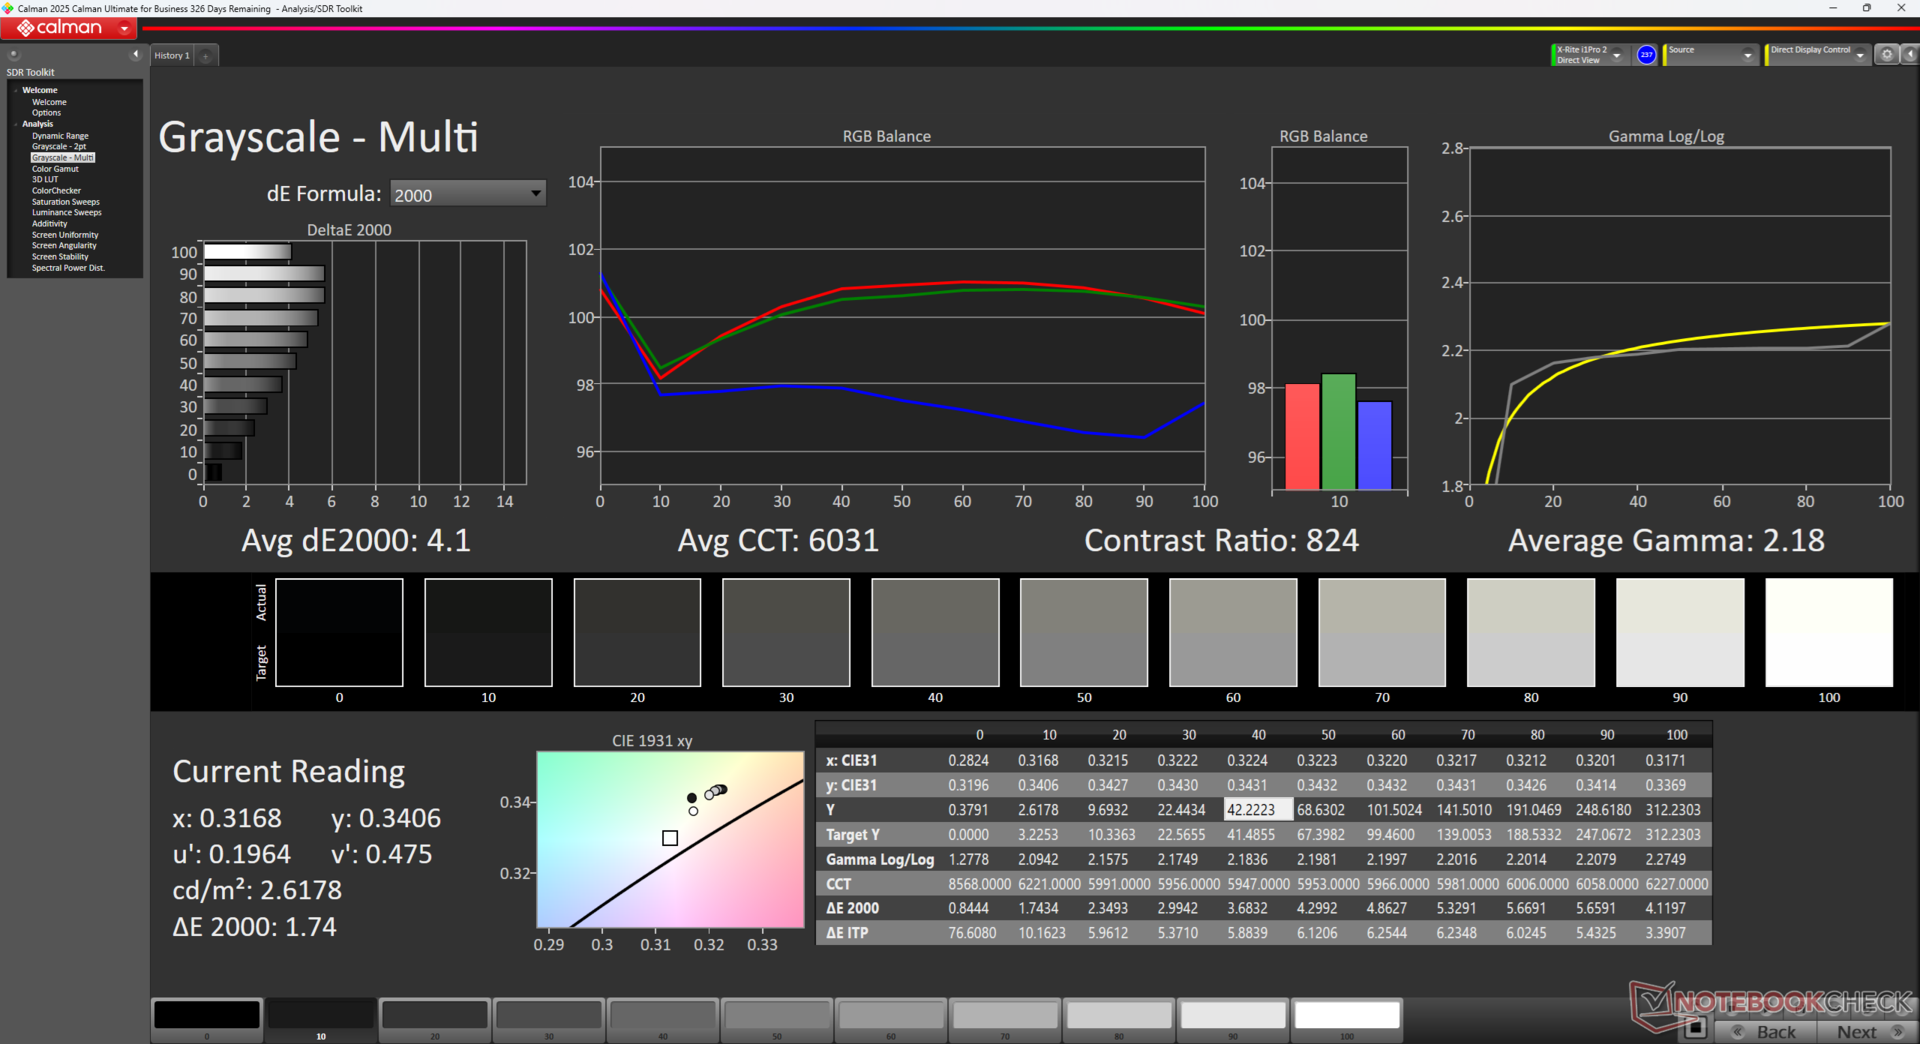
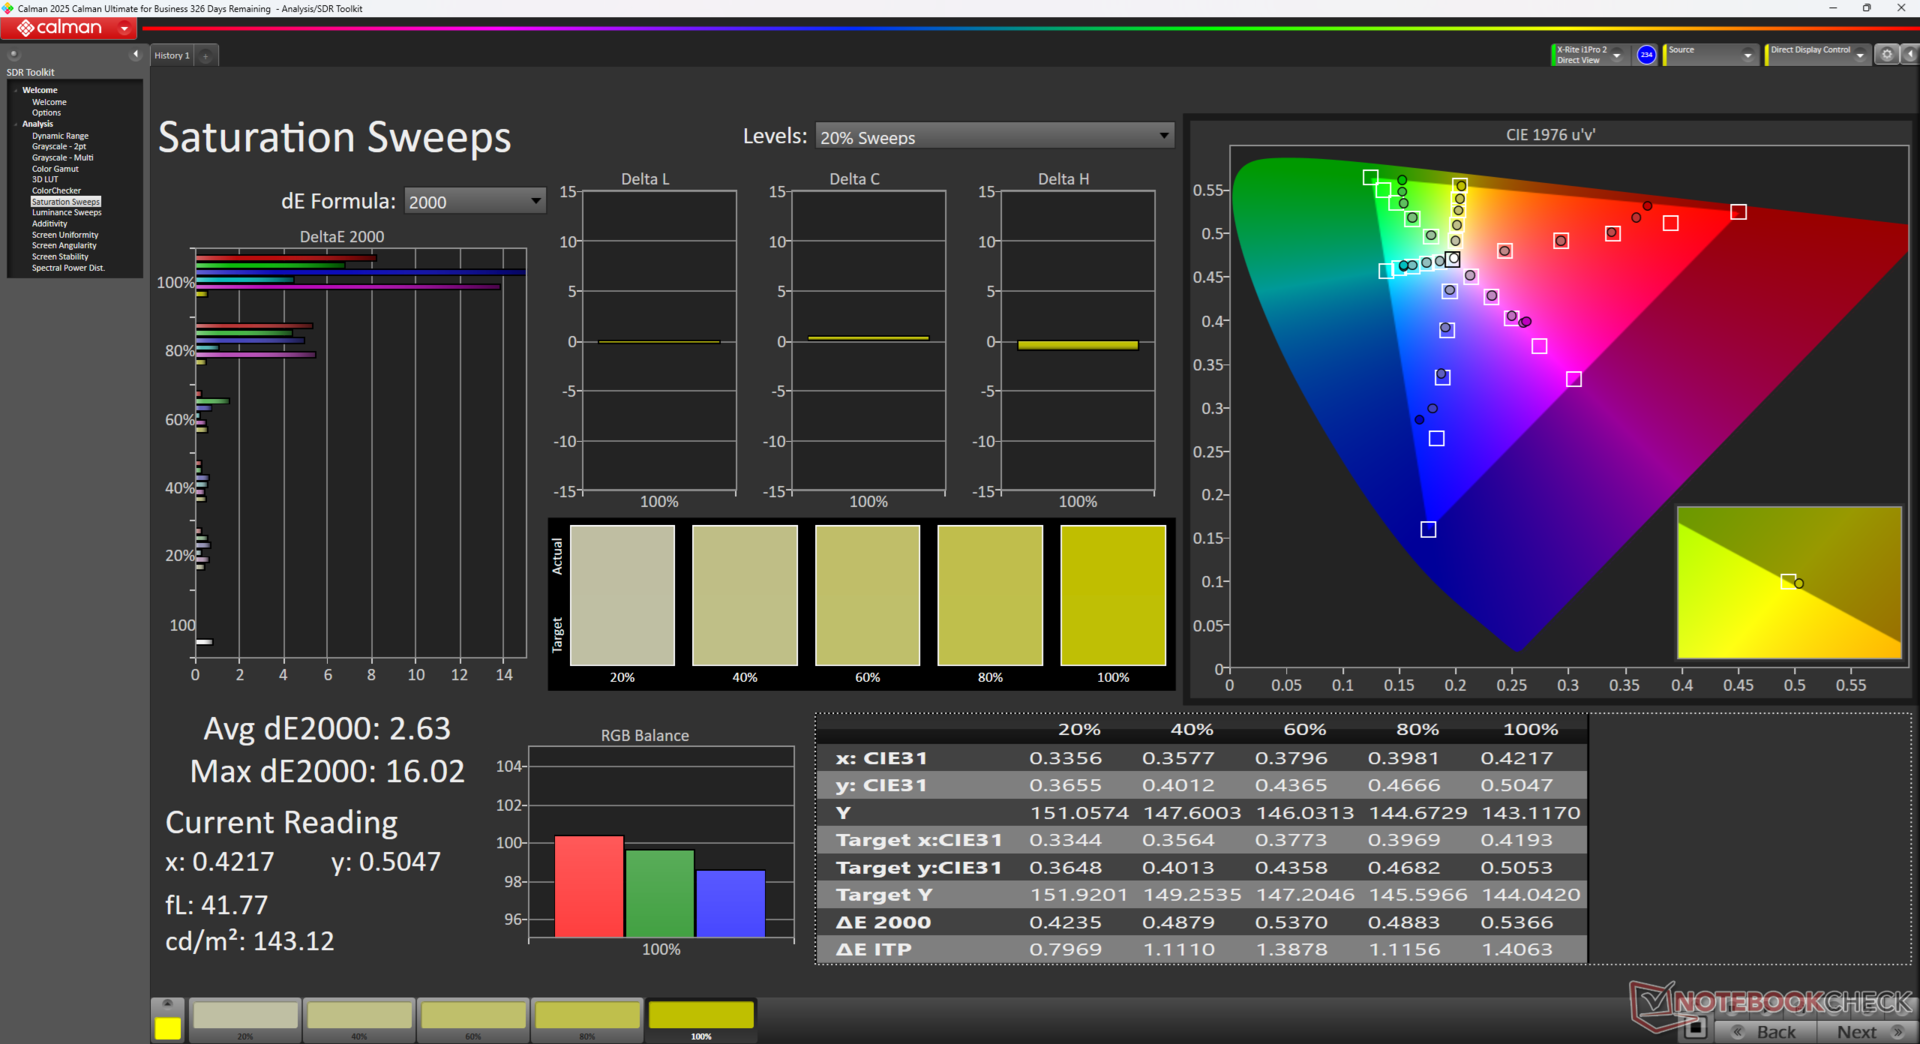
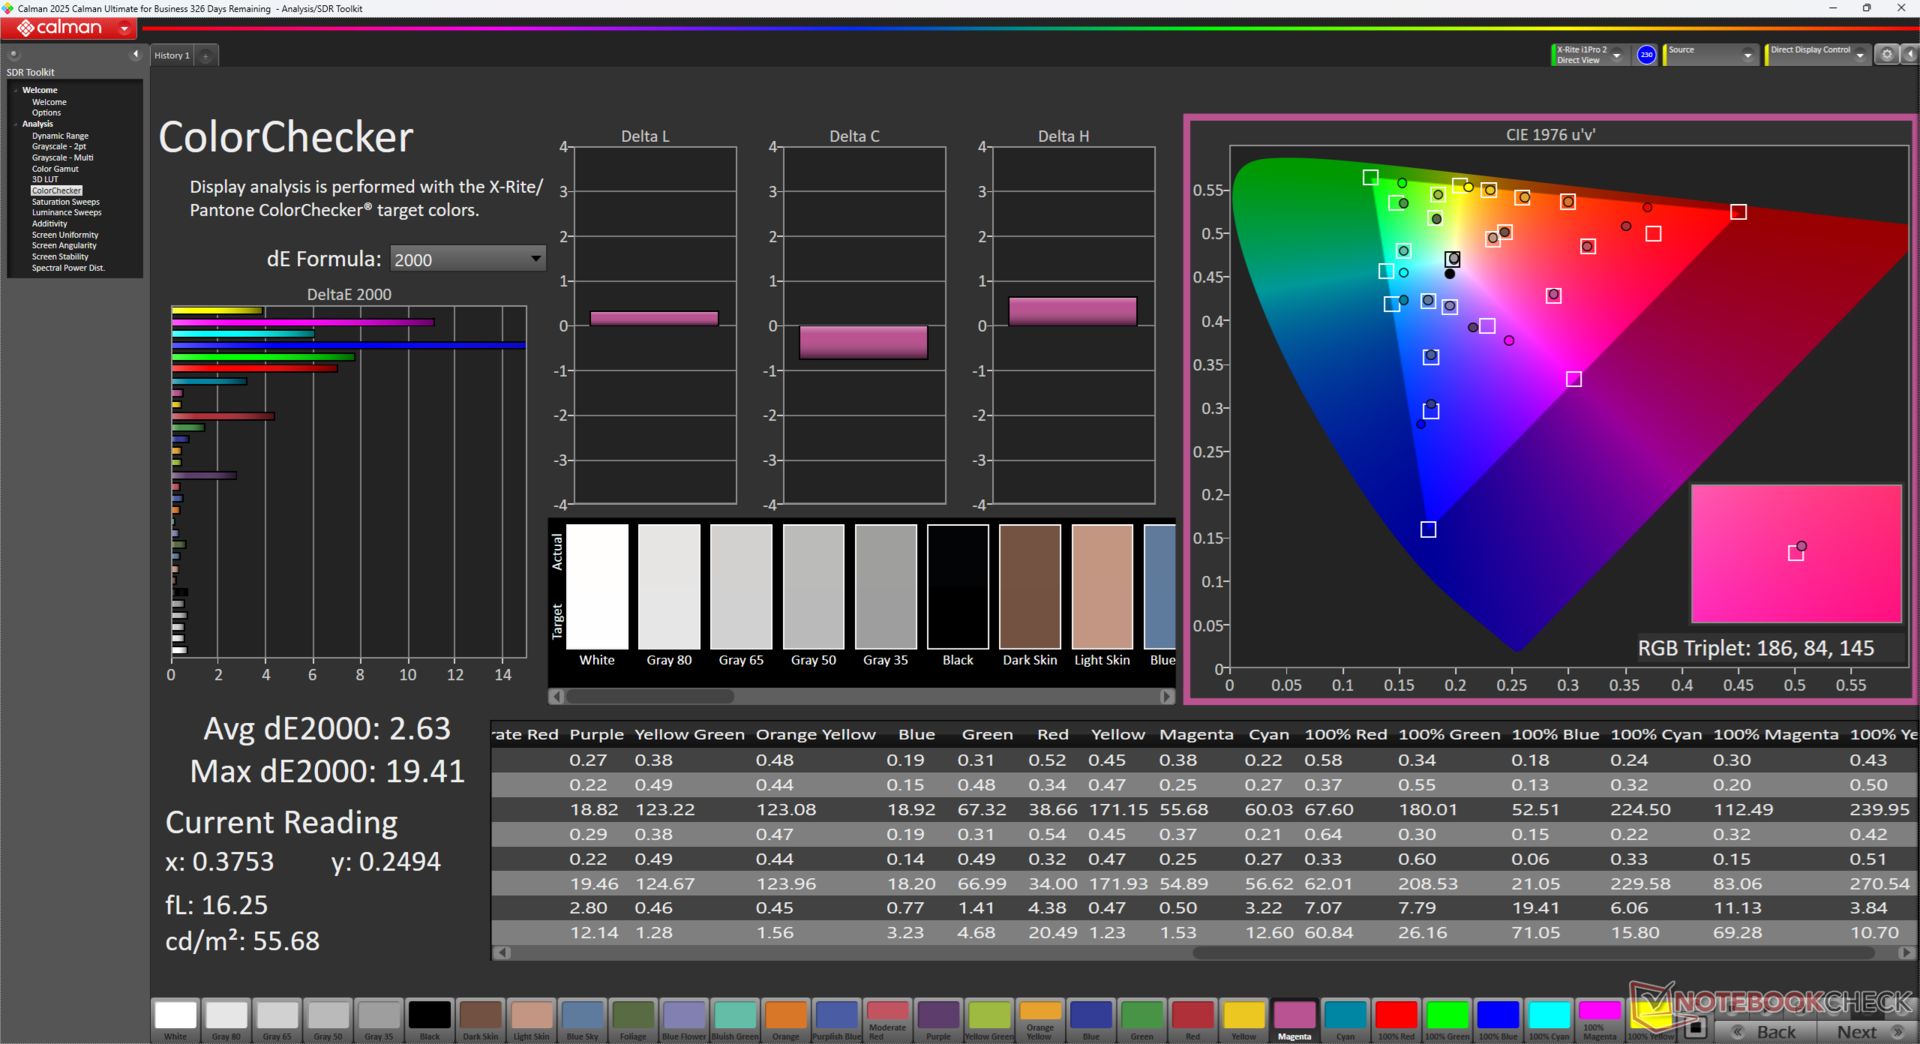
ΔE Color 6.09 | 0.5-29.43 Ø4.83, calibrated: 2.63
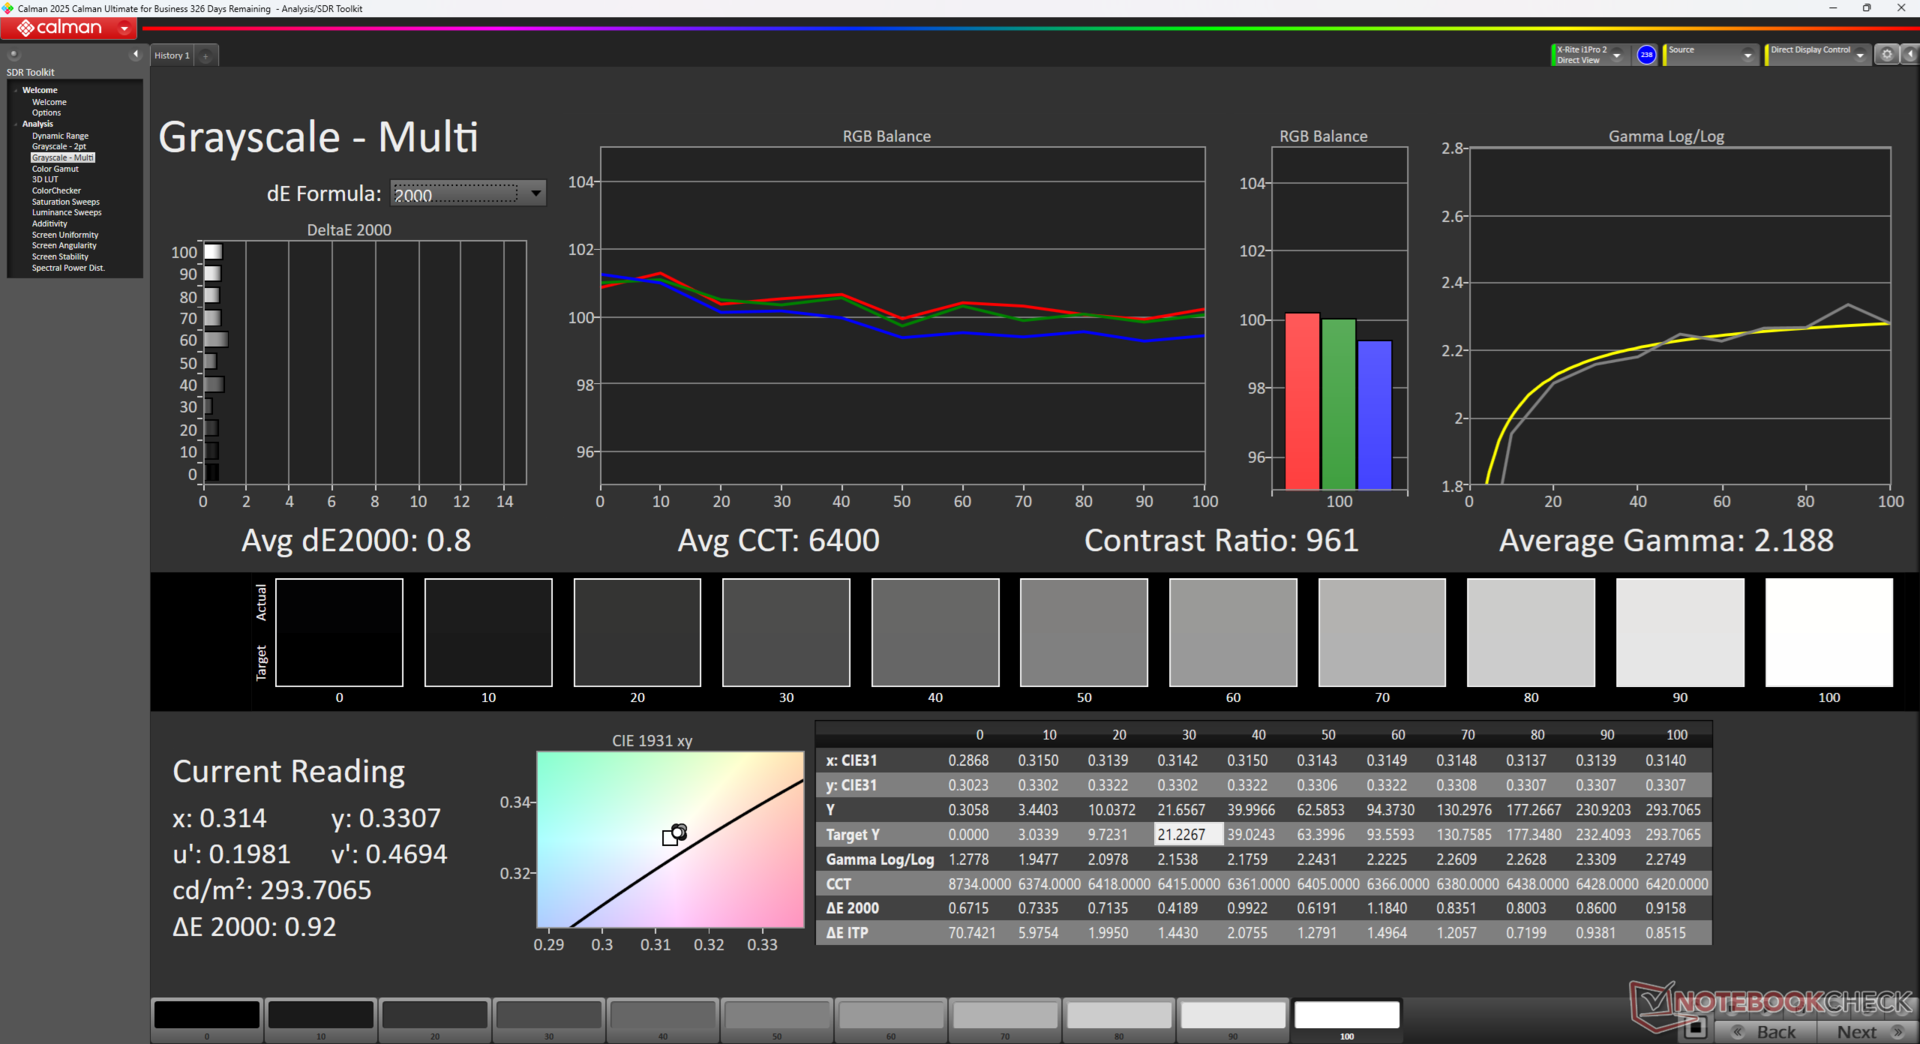
ΔE Greyscale 4.1 | 0.09-98 Ø5.1
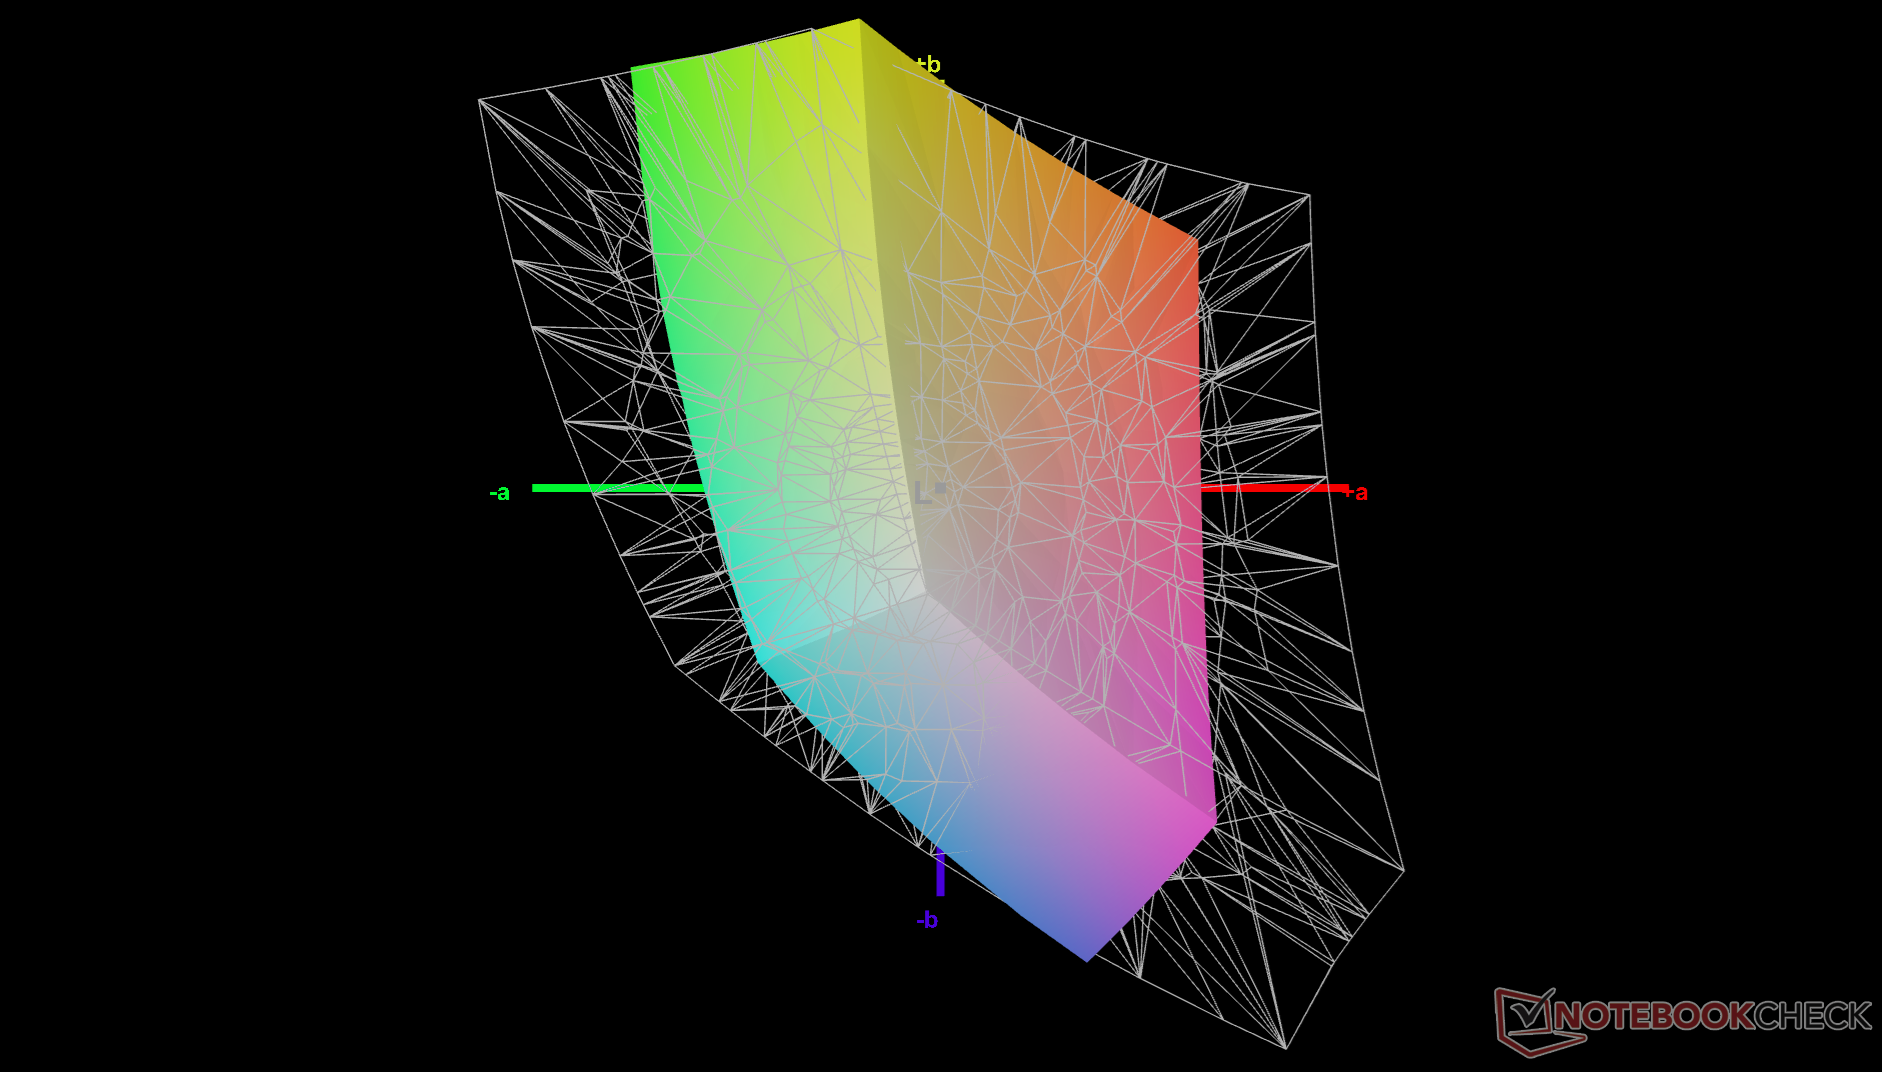
42.2% AdobeRGB 1998 (Argyll 2.2.0 3D)
59.7% sRGB (Argyll 2.2.0 3D)
40.9% Display P3 (Argyll 2.2.0 3D)
Gamma: 2.18
| Asus V16 V3607V MNG007QX2-2, IPS, 1920x1200, 16", 144 Hz | Asus VivoBook Pro 16 K6602VU Samsung ATNA60BX01-1, OLED, 3200x2000, 16", 120 Hz | Dell Inspiron 16 Plus 7640 AU Optronics B160QAN, IPS, 2560x1600, 16", 120 Hz | Lenovo ThinkBook 16 G7 IML LEN160WUXGA, IPS, 1920x1200, 16", 60 Hz | HP Pavilion Plus 16-ab0456tx AU Optronics AUOFDA4, IPS, 2560x1600, 16", 120 Hz | Acer Swift Edge 16 SFE16-44-R0XV Samsung ATNA60BX03-0, OLED, 3200x2000, 16", 120 Hz | |
|---|---|---|---|---|---|---|
| Display | 112% | 78% | 2% | 76% | 115% | |
| Display P3 Coverage | 40.9 | 98.7 141% | 76 86% | 41.6 2% | 74.6 82% | 99.9 144% |
| sRGB Coverage | 59.7 | 99.7 67% | 99.8 67% | 61.2 3% | 99 66% | 100 68% |
| AdobeRGB 1998 Coverage | 42.2 | 96.5 129% | 76.7 82% | 43 2% | 76.5 81% | 98 132% |
| Response Times | 58% | -11% | 9% | 59% | 97% | |
| Response Time Grey 50% / Grey 80% * | 22.9 ? | 0.68 ? 97% | 25.6 ? -12% | 18.4 ? 20% | 9.06 ? 60% | 0.4 ? 98% |
| Response Time Black / White * | 16.1 ? | 13.2 ? 18% | 17.6 ? -9% | 16.5 ? -2% | 6.7 ? 58% | 0.6 ? 96% |
| PWM Frequency | 240 ? | 120 ? | ||||
| Screen | 26% | 45% | -7% | 36% | 7243% | |
| Brightness middle | 313.3 | 353 13% | 314.7 0% | 321.2 3% | 403 29% | 407 30% |
| Brightness | 298 | 354 19% | 291 -2% | 319 7% | 394 32% | 405 36% |
| Brightness Distribution | 88 | 98 11% | 89 1% | 92 5% | 90 2% | 98 11% |
| Black Level * | 0.5 | 0.28 44% | 0.37 26% | 0.34 32% | 0.001 100% | |
| Contrast | 627 | 1124 79% | 868 38% | 1185 89% | 407000 64812% | |
| Colorchecker dE 2000 * | 6.09 | 4.23 31% | 1.62 73% | 8.7 -43% | 3.13 49% | 2.27 63% |
| Colorchecker dE 2000 max. * | 19.31 | 7.13 63% | 2.94 85% | 19.85 -3% | 6.14 68% | 4.46 77% |
| Colorchecker dE 2000 calibrated * | 2.63 | 2.42 8% | 1.08 59% | 1.82 31% | 1.65 37% | 2.17 17% |
| Greyscale dE 2000 * | 4.1 | 2.5 39% | 1.3 68% | 9.2 -124% | 4.5 -10% | 2.3 44% |
| Gamma | 2.18 101% | 2.4 92% | 2.26 97% | 2.83 78% | 2.18 101% | 2.231 99% |
| CCT | 6031 108% | 6642 98% | 6385 102% | 6200 105% | 6261 104% | 6443 101% |
| Całkowita średnia (program / ustawienia) | 65% /
53% | 37% /
44% | 1% /
-3% | 57% /
48% | 2485% /
4695% |
* ... im mniej tym lepiej

Średnie wartości deltaE dla skali szarości i kolorów są przyzwoite i wynoszą odpowiednio 4,1 i 6,09. Nasze własne wysiłki kalibracyjne z kolorymetrem X-Rite poprawiłyby te wartości do zaledwie 0,8 i 2,63.

Wyświetl czasy reakcji
| ↔ Czas reakcji od czerni do bieli | ||
|---|---|---|
| 16.1 ms ... wzrost ↗ i spadek ↘ łącznie | ↗ 8.2 ms wzrost | 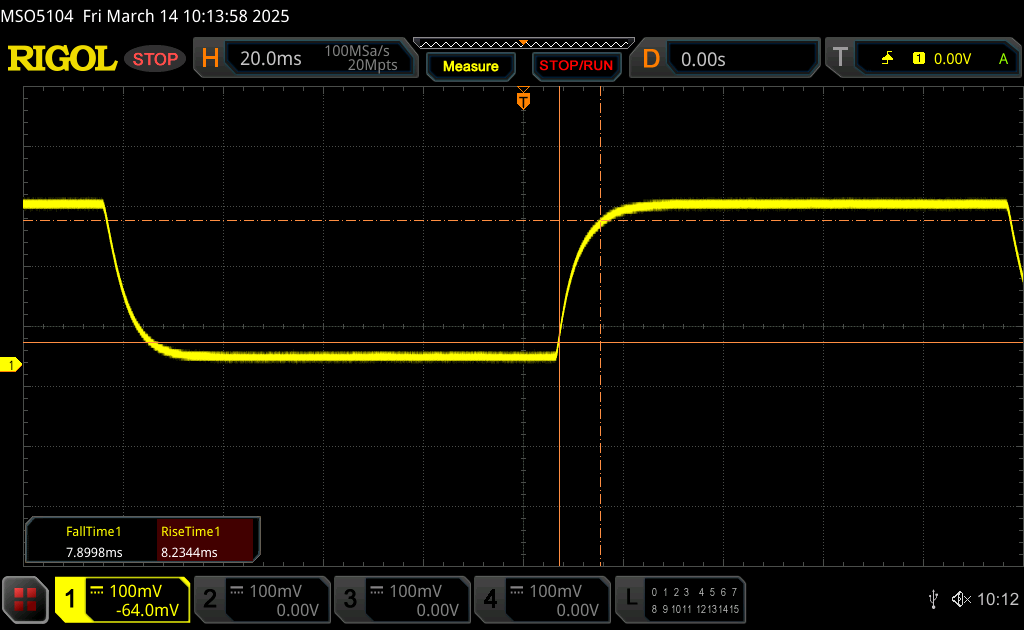 |
| ↘ 7.9 ms upadek | ||
| W naszych testach ekran wykazuje dobry współczynnik reakcji, ale może być zbyt wolny dla graczy rywalizujących ze sobą. Dla porównania, wszystkie testowane urządzenia wahają się od 0.1 (minimum) do 240 (maksimum) ms. » 36 % wszystkich urządzeń jest lepszych. Oznacza to, że zmierzony czas reakcji jest lepszy od średniej wszystkich testowanych urządzeń (20.5 ms). | ||
| ↔ Czas reakcji 50% szarości do 80% szarości | ||
| 22.9 ms ... wzrost ↗ i spadek ↘ łącznie | ↗ 11.2 ms wzrost | 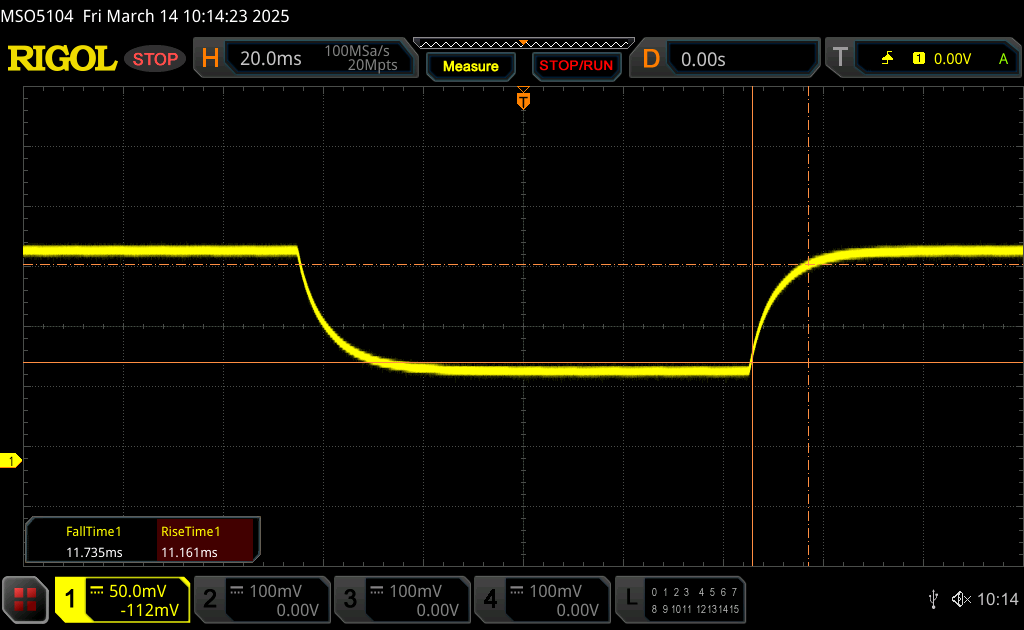 |
| ↘ 11.7 ms upadek | ||
| W naszych testach ekran wykazuje dobry współczynnik reakcji, ale może być zbyt wolny dla graczy rywalizujących ze sobą. Dla porównania, wszystkie testowane urządzenia wahają się od 0.165 (minimum) do 636 (maksimum) ms. » 32 % wszystkich urządzeń jest lepszych. Oznacza to, że zmierzony czas reakcji jest lepszy od średniej wszystkich testowanych urządzeń (32.1 ms). | ||
Migotanie ekranu / PWM (modulacja szerokości impulsu)
| Migotanie ekranu/nie wykryto PWM | 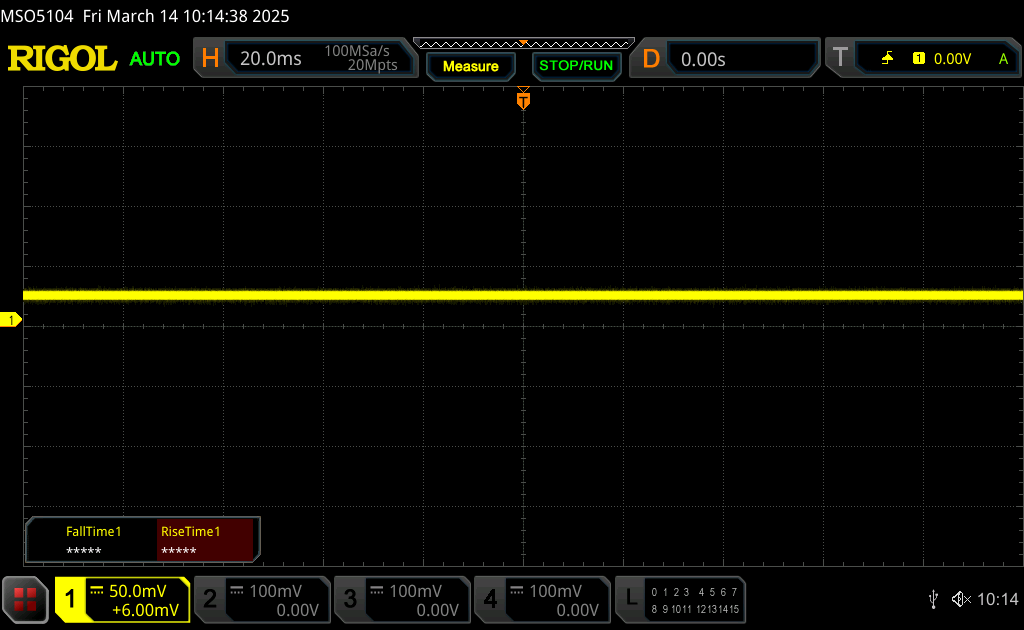 | ||
Dla porównania: 53 % wszystkich testowanych urządzeń nie używa PWM do przyciemniania wyświetlacza. Jeśli wykryto PWM, zmierzono średnio 8354 (minimum: 5 - maksimum: 343500) Hz. | |||

Wydajność - brak znaczących ulepszeń
Warunki testowania
Przed uruchomieniem poniższych testów porównawczych ustawiliśmy system Windows na tryb wydajności, a MyAsus na tryb wydajności i tryb zoptymalizowany. Dyskretny procesor graficzny można całkowicie wyłączyć bez konieczności ponownego uruchamiania systemu.
Procesor
Rdzeń Core 7 240H działa podobnie do Core Ultra 155H, aczkolwiek bez zintegrowanej jednostki NPU, aby zaoszczędzić na kosztach. Docelowi gracze lub redaktorzy raczej nie będą potrzebować lub korzystać z NPU.
Cinebench R15 Multi Loop
Cinebench R23: Multi Core | Single Core
Cinebench R20: CPU (Multi Core) | CPU (Single Core)
Cinebench R15: CPU Multi 64Bit | CPU Single 64Bit
Blender: v2.79 BMW27 CPU
7-Zip 18.03: 7z b 4 | 7z b 4 -mmt1
Geekbench 6.4: Multi-Core | Single-Core
Geekbench 5.5: Multi-Core | Single-Core
HWBOT x265 Benchmark v2.2: 4k Preset
LibreOffice : 20 Documents To PDF
R Benchmark 2.5: Overall mean
| CPU Performance Rating | |
| Lenovo ThinkBook 16p G5 IRX 21N50011GE | |
| Asus TUF Gaming A16 FA608WV | |
| MSI Prestige 16 AI Evo B2HMG | |
| Lenovo ThinkPad Z16 Gen 2 | |
| Przeciętny Intel Core 7 240H | |
| Asus V16 V3607V | |
| HP Spectre x360 16 RTX 4050 -1! | |
| Acer Aspire 16 A16-51GM-77G2 | |
| Cinebench R23 / Multi Core | |
| Lenovo ThinkBook 16p G5 IRX 21N50011GE | |
| Asus TUF Gaming A16 FA608WV | |
| MSI Prestige 16 AI Evo B2HMG | |
| Lenovo ThinkPad Z16 Gen 2 | |
| HP Spectre x360 16 RTX 4050 | |
| Asus V16 V3607V | |
| Przeciętny Intel Core 7 240H (n=1) | |
| Acer Aspire 16 A16-51GM-77G2 | |
| Cinebench R23 / Single Core | |
| Lenovo ThinkBook 16p G5 IRX 21N50011GE | |
| MSI Prestige 16 AI Evo B2HMG | |
| Asus TUF Gaming A16 FA608WV | |
| Acer Aspire 16 A16-51GM-77G2 | |
| Asus V16 V3607V | |
| Przeciętny Intel Core 7 240H (n=1) | |
| Lenovo ThinkPad Z16 Gen 2 | |
| HP Spectre x360 16 RTX 4050 | |
| Cinebench R20 / CPU (Multi Core) | |
| Lenovo ThinkBook 16p G5 IRX 21N50011GE | |
| Asus TUF Gaming A16 FA608WV | |
| MSI Prestige 16 AI Evo B2HMG | |
| Lenovo ThinkPad Z16 Gen 2 | |
| Asus V16 V3607V | |
| Przeciętny Intel Core 7 240H (n=1) | |
| HP Spectre x360 16 RTX 4050 | |
| Acer Aspire 16 A16-51GM-77G2 | |
| Cinebench R20 / CPU (Single Core) | |
| Lenovo ThinkBook 16p G5 IRX 21N50011GE | |
| MSI Prestige 16 AI Evo B2HMG | |
| Asus TUF Gaming A16 FA608WV | |
| Acer Aspire 16 A16-51GM-77G2 | |
| Asus V16 V3607V | |
| Przeciętny Intel Core 7 240H (n=1) | |
| Lenovo ThinkPad Z16 Gen 2 | |
| HP Spectre x360 16 RTX 4050 | |
| Cinebench R15 / CPU Multi 64Bit | |
| Lenovo ThinkBook 16p G5 IRX 21N50011GE | |
| Asus TUF Gaming A16 FA608WV | |
| MSI Prestige 16 AI Evo B2HMG | |
| Lenovo ThinkPad Z16 Gen 2 | |
| Asus V16 V3607V | |
| Przeciętny Intel Core 7 240H (n=1) | |
| HP Spectre x360 16 RTX 4050 | |
| Acer Aspire 16 A16-51GM-77G2 | |
| Cinebench R15 / CPU Single 64Bit | |
| Lenovo ThinkBook 16p G5 IRX 21N50011GE | |
| MSI Prestige 16 AI Evo B2HMG | |
| Asus TUF Gaming A16 FA608WV | |
| Acer Aspire 16 A16-51GM-77G2 | |
| Lenovo ThinkPad Z16 Gen 2 | |
| Asus V16 V3607V | |
| Przeciętny Intel Core 7 240H (n=1) | |
| HP Spectre x360 16 RTX 4050 | |
| Blender / v2.79 BMW27 CPU | |
| Acer Aspire 16 A16-51GM-77G2 | |
| Asus V16 V3607V | |
| Przeciętny Intel Core 7 240H (n=1) | |
| MSI Prestige 16 AI Evo B2HMG | |
| Lenovo ThinkPad Z16 Gen 2 | |
| Asus TUF Gaming A16 FA608WV | |
| Lenovo ThinkBook 16p G5 IRX 21N50011GE | |
| 7-Zip 18.03 / 7z b 4 | |
| Lenovo ThinkBook 16p G5 IRX 21N50011GE | |
| Asus TUF Gaming A16 FA608WV | |
| Lenovo ThinkPad Z16 Gen 2 | |
| MSI Prestige 16 AI Evo B2HMG | |
| HP Spectre x360 16 RTX 4050 | |
| Asus V16 V3607V | |
| Przeciętny Intel Core 7 240H (n=1) | |
| Acer Aspire 16 A16-51GM-77G2 | |
| 7-Zip 18.03 / 7z b 4 -mmt1 | |
| Lenovo ThinkBook 16p G5 IRX 21N50011GE | |
| Acer Aspire 16 A16-51GM-77G2 | |
| Lenovo ThinkPad Z16 Gen 2 | |
| Asus V16 V3607V | |
| Przeciętny Intel Core 7 240H (n=1) | |
| Asus TUF Gaming A16 FA608WV | |
| MSI Prestige 16 AI Evo B2HMG | |
| HP Spectre x360 16 RTX 4050 | |
| Geekbench 6.4 / Multi-Core | |
| Lenovo ThinkBook 16p G5 IRX 21N50011GE | |
| MSI Prestige 16 AI Evo B2HMG | |
| Asus TUF Gaming A16 FA608WV | |
| Lenovo ThinkPad Z16 Gen 2 | |
| Przeciętny Intel Core 7 240H (11285 - 12846, n=2) | |
| HP Spectre x360 16 RTX 4050 | |
| Asus V16 V3607V | |
| Acer Aspire 16 A16-51GM-77G2 | |
| Geekbench 6.4 / Single-Core | |
| Lenovo ThinkBook 16p G5 IRX 21N50011GE | |
| MSI Prestige 16 AI Evo B2HMG | |
| Asus TUF Gaming A16 FA608WV | |
| Acer Aspire 16 A16-51GM-77G2 | |
| Przeciętny Intel Core 7 240H (2646 - 2648, n=2) | |
| Asus V16 V3607V | |
| Lenovo ThinkPad Z16 Gen 2 | |
| HP Spectre x360 16 RTX 4050 | |
| Geekbench 5.5 / Multi-Core | |
| Lenovo ThinkBook 16p G5 IRX 21N50011GE | |
| MSI Prestige 16 AI Evo B2HMG | |
| Asus TUF Gaming A16 FA608WV | |
| HP Spectre x360 16 RTX 4050 | |
| Lenovo ThinkPad Z16 Gen 2 | |
| Asus V16 V3607V | |
| Przeciętny Intel Core 7 240H (n=1) | |
| Acer Aspire 16 A16-51GM-77G2 | |
| Geekbench 5.5 / Single-Core | |
| Lenovo ThinkBook 16p G5 IRX 21N50011GE | |
| Asus TUF Gaming A16 FA608WV | |
| MSI Prestige 16 AI Evo B2HMG | |
| Acer Aspire 16 A16-51GM-77G2 | |
| Lenovo ThinkPad Z16 Gen 2 | |
| Asus V16 V3607V | |
| Przeciętny Intel Core 7 240H (n=1) | |
| HP Spectre x360 16 RTX 4050 | |
| HWBOT x265 Benchmark v2.2 / 4k Preset | |
| Lenovo ThinkBook 16p G5 IRX 21N50011GE | |
| Asus TUF Gaming A16 FA608WV | |
| MSI Prestige 16 AI Evo B2HMG | |
| Lenovo ThinkPad Z16 Gen 2 | |
| Asus V16 V3607V | |
| Przeciętny Intel Core 7 240H (n=1) | |
| HP Spectre x360 16 RTX 4050 | |
| Acer Aspire 16 A16-51GM-77G2 | |
| LibreOffice / 20 Documents To PDF | |
| Asus V16 V3607V | |
| Przeciętny Intel Core 7 240H (n=1) | |
| Asus TUF Gaming A16 FA608WV | |
| Lenovo ThinkPad Z16 Gen 2 | |
| Lenovo ThinkBook 16p G5 IRX 21N50011GE | |
| HP Spectre x360 16 RTX 4050 | |
| MSI Prestige 16 AI Evo B2HMG | |
| Acer Aspire 16 A16-51GM-77G2 | |
| R Benchmark 2.5 / Overall mean | |
| HP Spectre x360 16 RTX 4050 | |
| Lenovo ThinkPad Z16 Gen 2 | |
| Acer Aspire 16 A16-51GM-77G2 | |
| MSI Prestige 16 AI Evo B2HMG | |
| Asus V16 V3607V | |
| Przeciętny Intel Core 7 240H (n=1) | |
| Asus TUF Gaming A16 FA608WV | |
| Lenovo ThinkBook 16p G5 IRX 21N50011GE | |
* ... im mniej tym lepiej
AIDA64: FP32 Ray-Trace | FPU Julia | CPU SHA3 | CPU Queen | FPU SinJulia | FPU Mandel | CPU AES | CPU ZLib | FP64 Ray-Trace | CPU PhotoWorxx
| Performance Rating | |
| Asus VivoBook Pro 16 K6602VU | |
| HP Pavilion Plus 16-ab0456tx | |
| Dell Inspiron 16 Plus 7640 | |
| Acer Swift Edge 16 SFE16-44-R0XV | |
| Asus V16 V3607V | |
| Przeciętny Intel Core 7 240H | |
| Lenovo ThinkBook 16 G7 IML | |
| AIDA64 / FP32 Ray-Trace | |
| Acer Swift Edge 16 SFE16-44-R0XV | |
| HP Pavilion Plus 16-ab0456tx | |
| Dell Inspiron 16 Plus 7640 | |
| Asus V16 V3607V | |
| Przeciętny Intel Core 7 240H (n=1) | |
| Asus VivoBook Pro 16 K6602VU | |
| Lenovo ThinkBook 16 G7 IML | |
| AIDA64 / FPU Julia | |
| HP Pavilion Plus 16-ab0456tx | |
| Asus VivoBook Pro 16 K6602VU | |
| Dell Inspiron 16 Plus 7640 | |
| Acer Swift Edge 16 SFE16-44-R0XV | |
| Asus V16 V3607V | |
| Przeciętny Intel Core 7 240H (n=1) | |
| Lenovo ThinkBook 16 G7 IML | |
| AIDA64 / CPU SHA3 | |
| HP Pavilion Plus 16-ab0456tx | |
| Dell Inspiron 16 Plus 7640 | |
| Asus VivoBook Pro 16 K6602VU | |
| Acer Swift Edge 16 SFE16-44-R0XV | |
| Asus V16 V3607V | |
| Przeciętny Intel Core 7 240H (n=1) | |
| Lenovo ThinkBook 16 G7 IML | |
| AIDA64 / CPU Queen | |
| HP Pavilion Plus 16-ab0456tx | |
| Asus VivoBook Pro 16 K6602VU | |
| Dell Inspiron 16 Plus 7640 | |
| Acer Swift Edge 16 SFE16-44-R0XV | |
| Asus V16 V3607V | |
| Przeciętny Intel Core 7 240H (n=1) | |
| Lenovo ThinkBook 16 G7 IML | |
| AIDA64 / FPU SinJulia | |
| Acer Swift Edge 16 SFE16-44-R0XV | |
| Dell Inspiron 16 Plus 7640 | |
| HP Pavilion Plus 16-ab0456tx | |
| Asus VivoBook Pro 16 K6602VU | |
| Asus V16 V3607V | |
| Przeciętny Intel Core 7 240H (n=1) | |
| Lenovo ThinkBook 16 G7 IML | |
| AIDA64 / FPU Mandel | |
| Acer Swift Edge 16 SFE16-44-R0XV | |
| HP Pavilion Plus 16-ab0456tx | |
| Dell Inspiron 16 Plus 7640 | |
| Asus VivoBook Pro 16 K6602VU | |
| Asus V16 V3607V | |
| Przeciętny Intel Core 7 240H (n=1) | |
| Lenovo ThinkBook 16 G7 IML | |
| AIDA64 / CPU AES | |
| Asus VivoBook Pro 16 K6602VU | |
| Dell Inspiron 16 Plus 7640 | |
| HP Pavilion Plus 16-ab0456tx | |
| Acer Swift Edge 16 SFE16-44-R0XV | |
| Asus V16 V3607V | |
| Przeciętny Intel Core 7 240H (n=1) | |
| Lenovo ThinkBook 16 G7 IML | |
| AIDA64 / CPU ZLib | |
| Dell Inspiron 16 Plus 7640 | |
| HP Pavilion Plus 16-ab0456tx | |
| Asus VivoBook Pro 16 K6602VU | |
| Asus V16 V3607V | |
| Przeciętny Intel Core 7 240H (n=1) | |
| Lenovo ThinkBook 16 G7 IML | |
| Acer Swift Edge 16 SFE16-44-R0XV | |
| AIDA64 / FP64 Ray-Trace | |
| Acer Swift Edge 16 SFE16-44-R0XV | |
| HP Pavilion Plus 16-ab0456tx | |
| Asus VivoBook Pro 16 K6602VU | |
| Dell Inspiron 16 Plus 7640 | |
| Asus V16 V3607V | |
| Przeciętny Intel Core 7 240H (n=1) | |
| Lenovo ThinkBook 16 G7 IML | |
| AIDA64 / CPU PhotoWorxx | |
| HP Pavilion Plus 16-ab0456tx | |
| Dell Inspiron 16 Plus 7640 | |
| Asus VivoBook Pro 16 K6602VU | |
| Acer Swift Edge 16 SFE16-44-R0XV | |
| Lenovo ThinkBook 16 G7 IML | |
| Asus V16 V3607V | |
| Przeciętny Intel Core 7 240H (n=1) | |
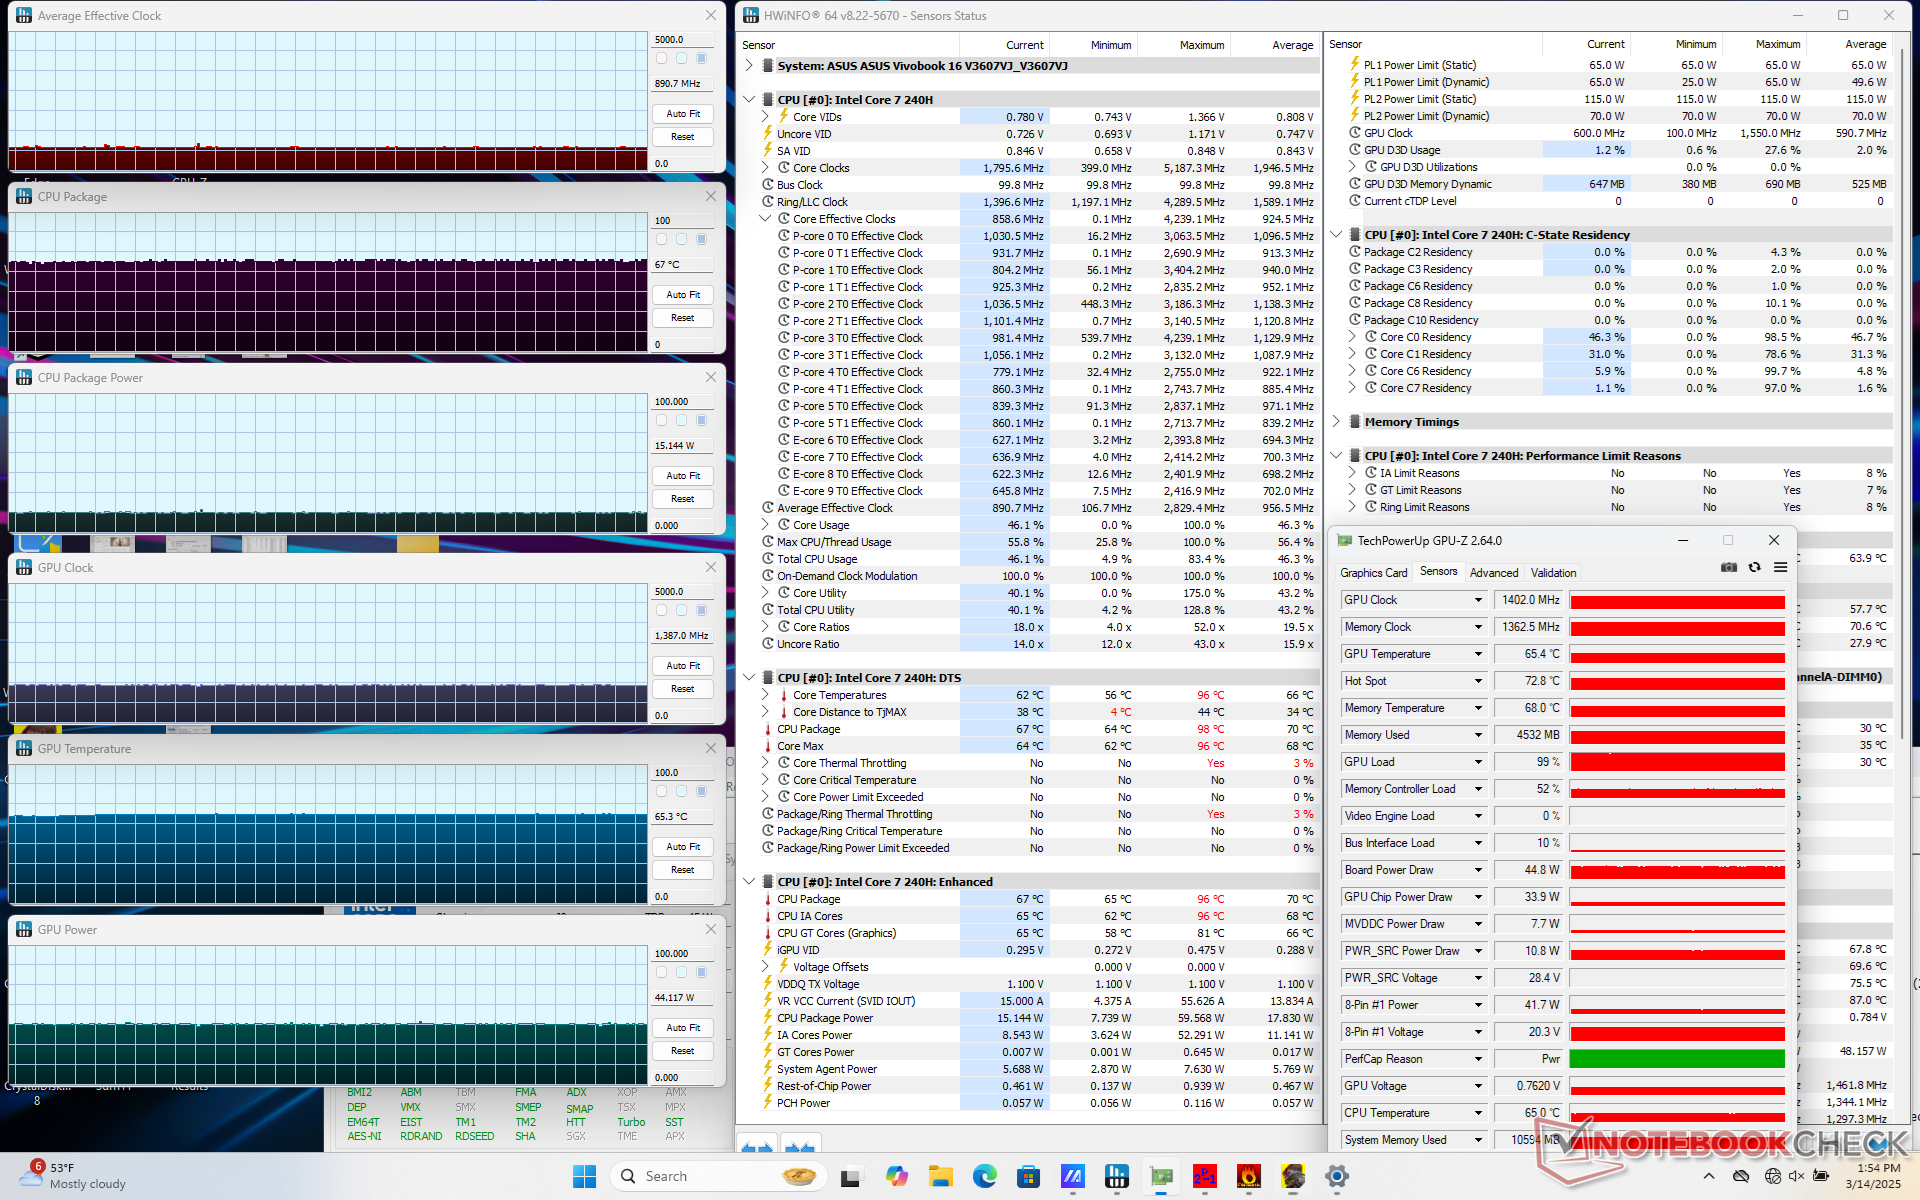
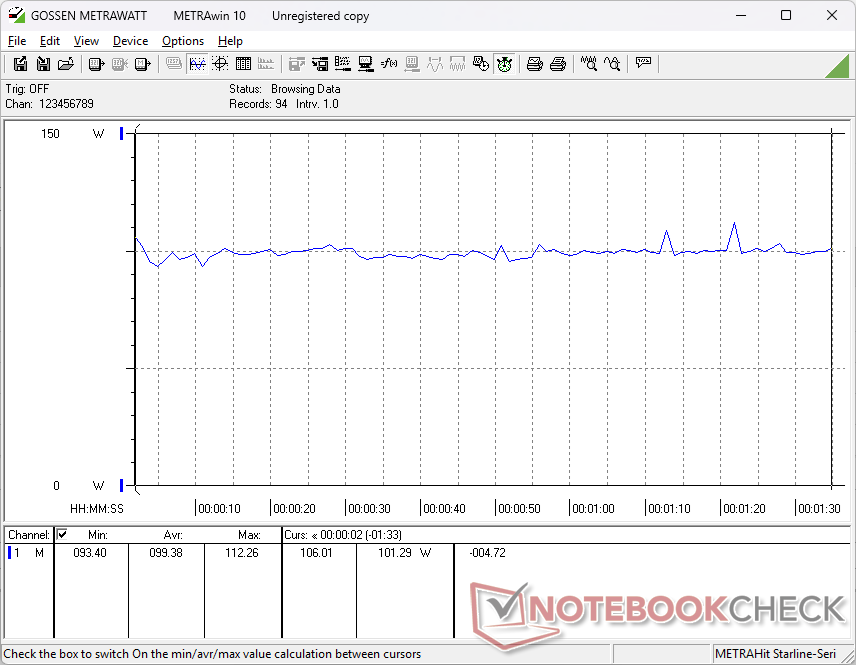
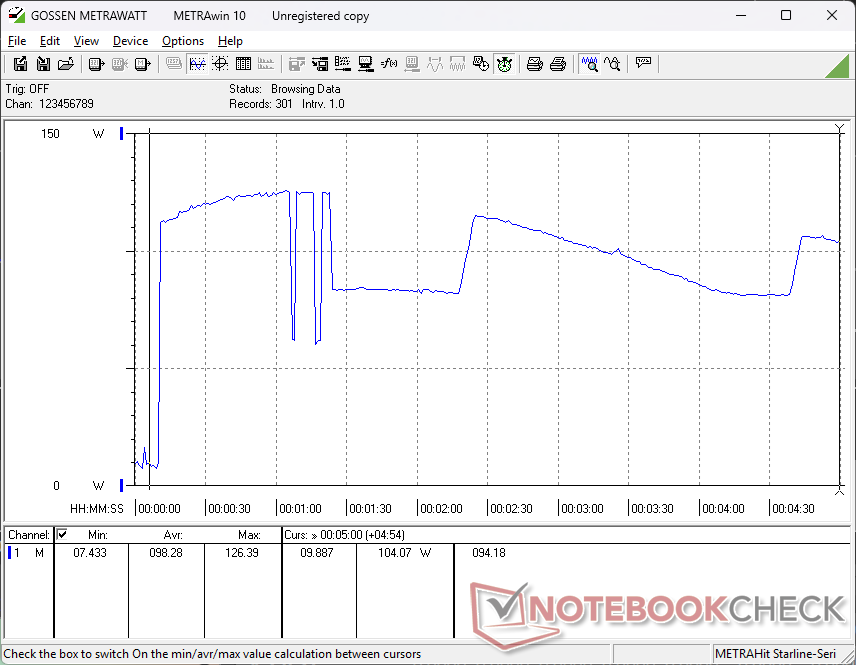
Test warunków skrajnych
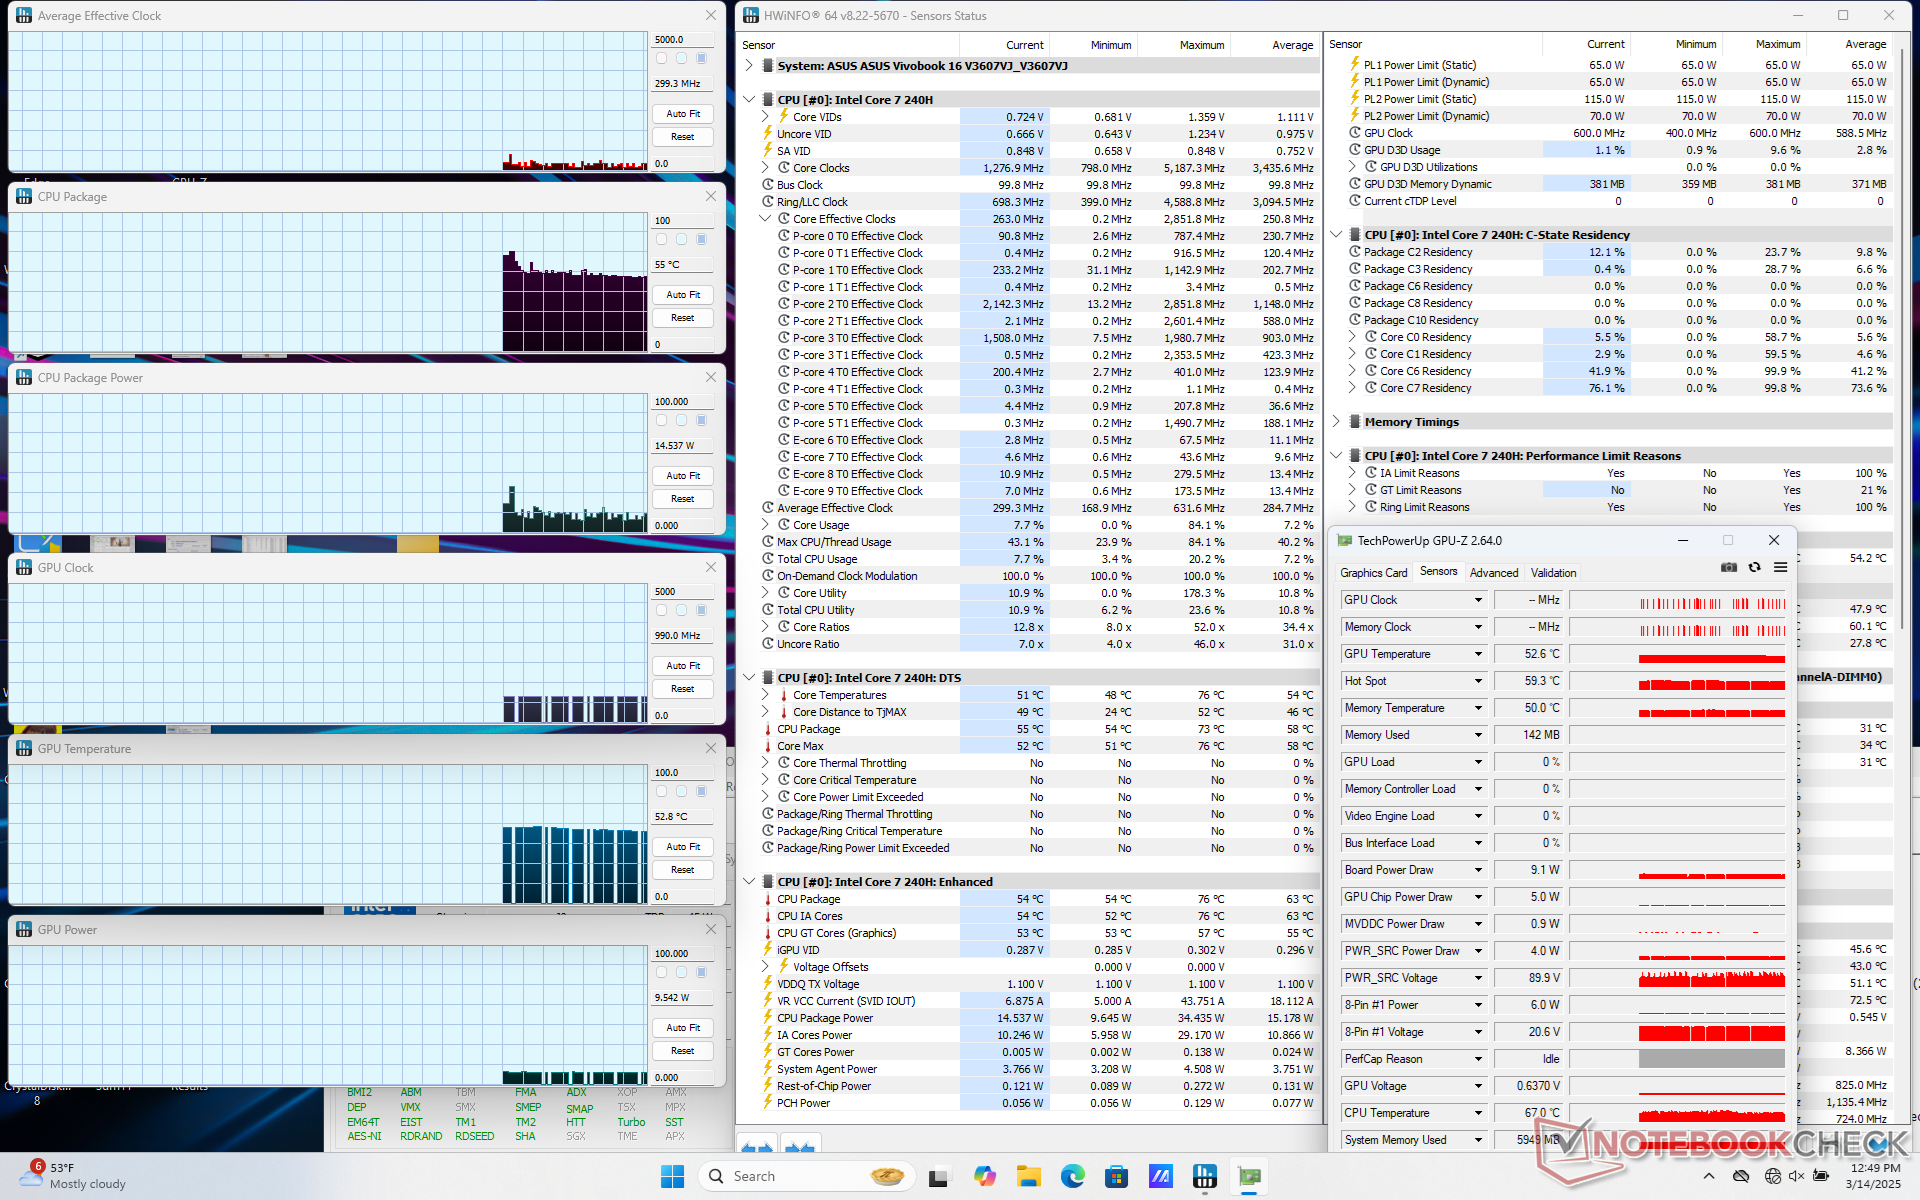
Procesor przyspieszał do 3,9 GHz i 71 W przez około minutę, aż osiągnął temperaturę rdzenia 94 C. Następnie spadał do 2,4 GHz i 33 W, po czym powracał do ~3,1 GHz i 50 W.
Wydajność w grach również nieznacznie spadnie, jeśli uruchomimy tryb zrównoważony/standardowy zamiast trybu wydajności. Tryb "Full-speed" jest również dostępny na MyAsus, ale w naszych testach nie oferuje on żadnych korzyści w stosunku do trybu Performance.
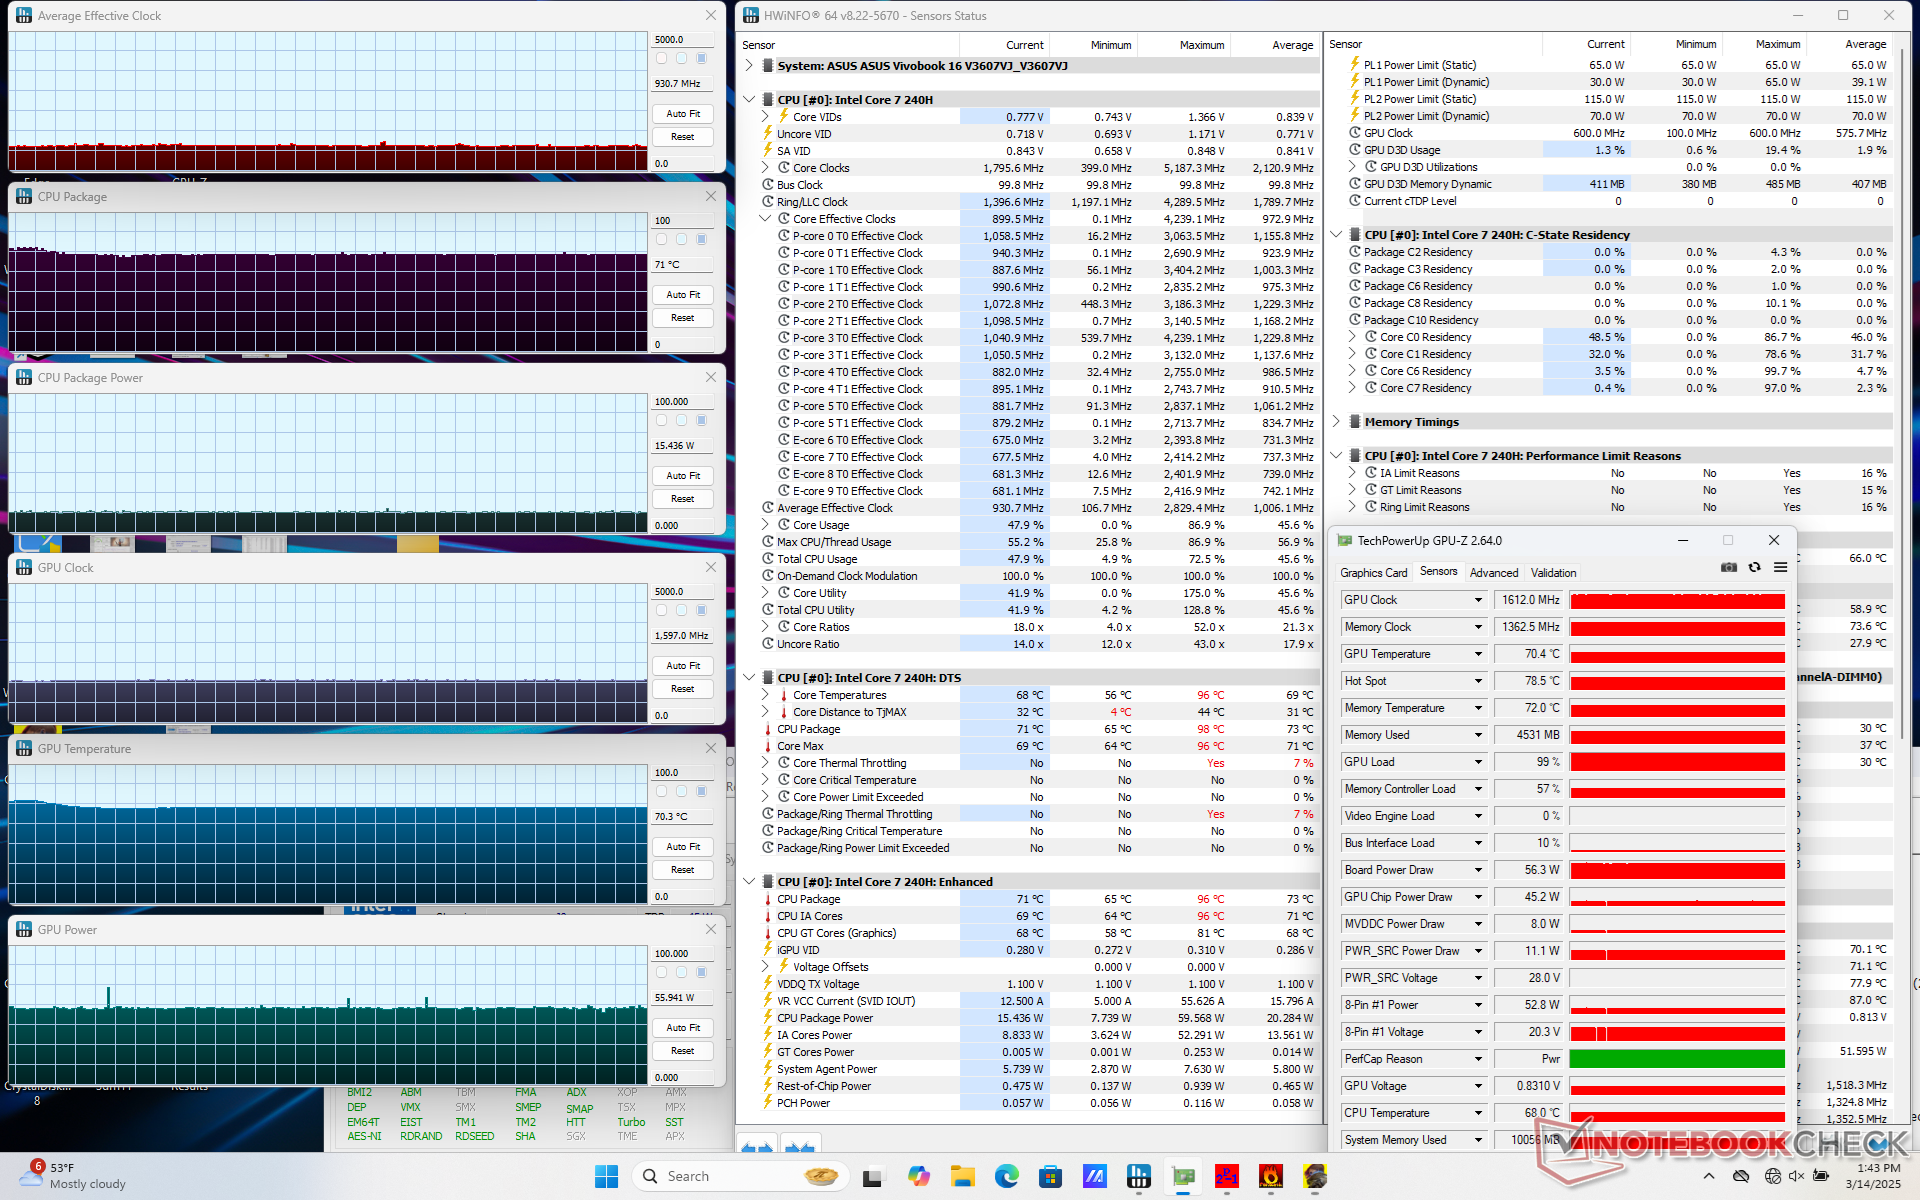
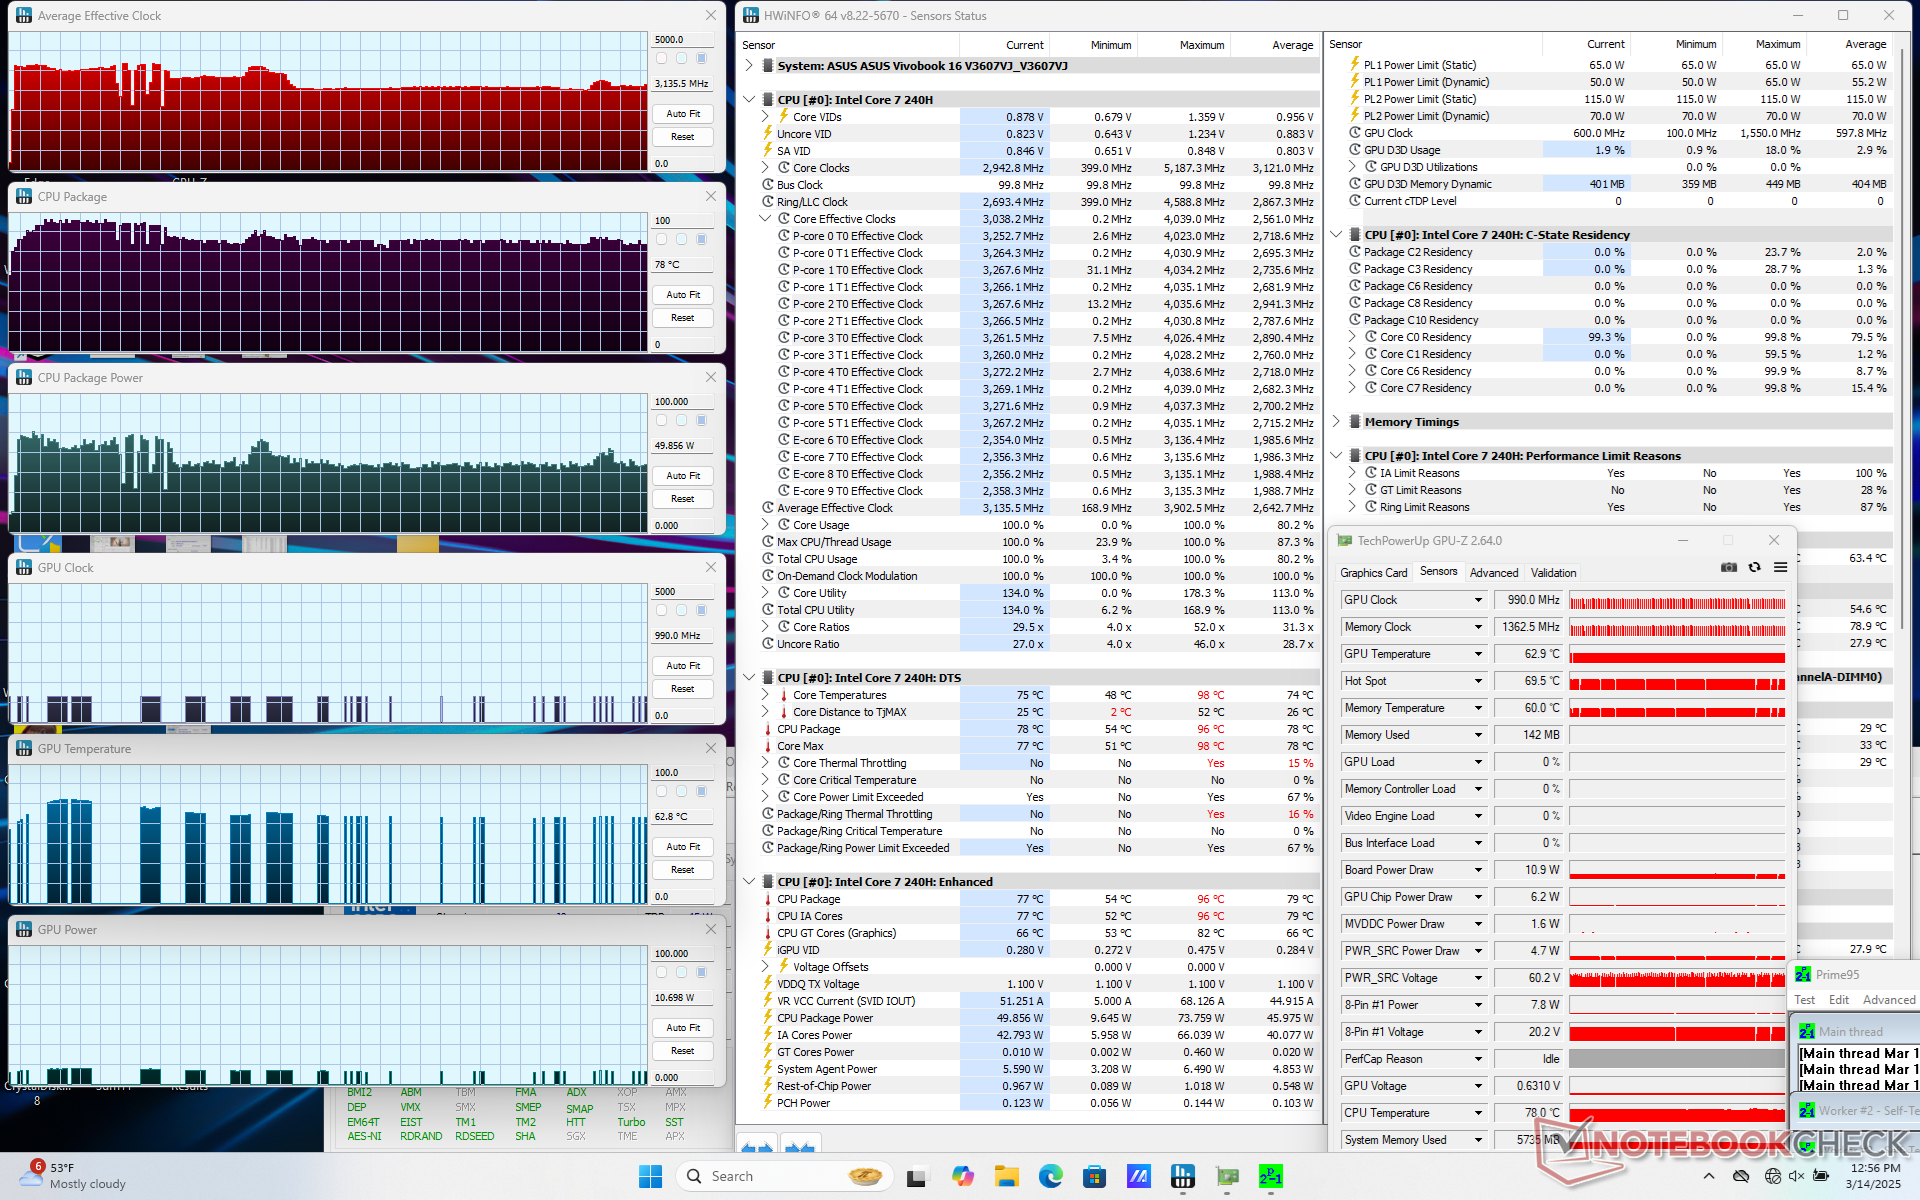
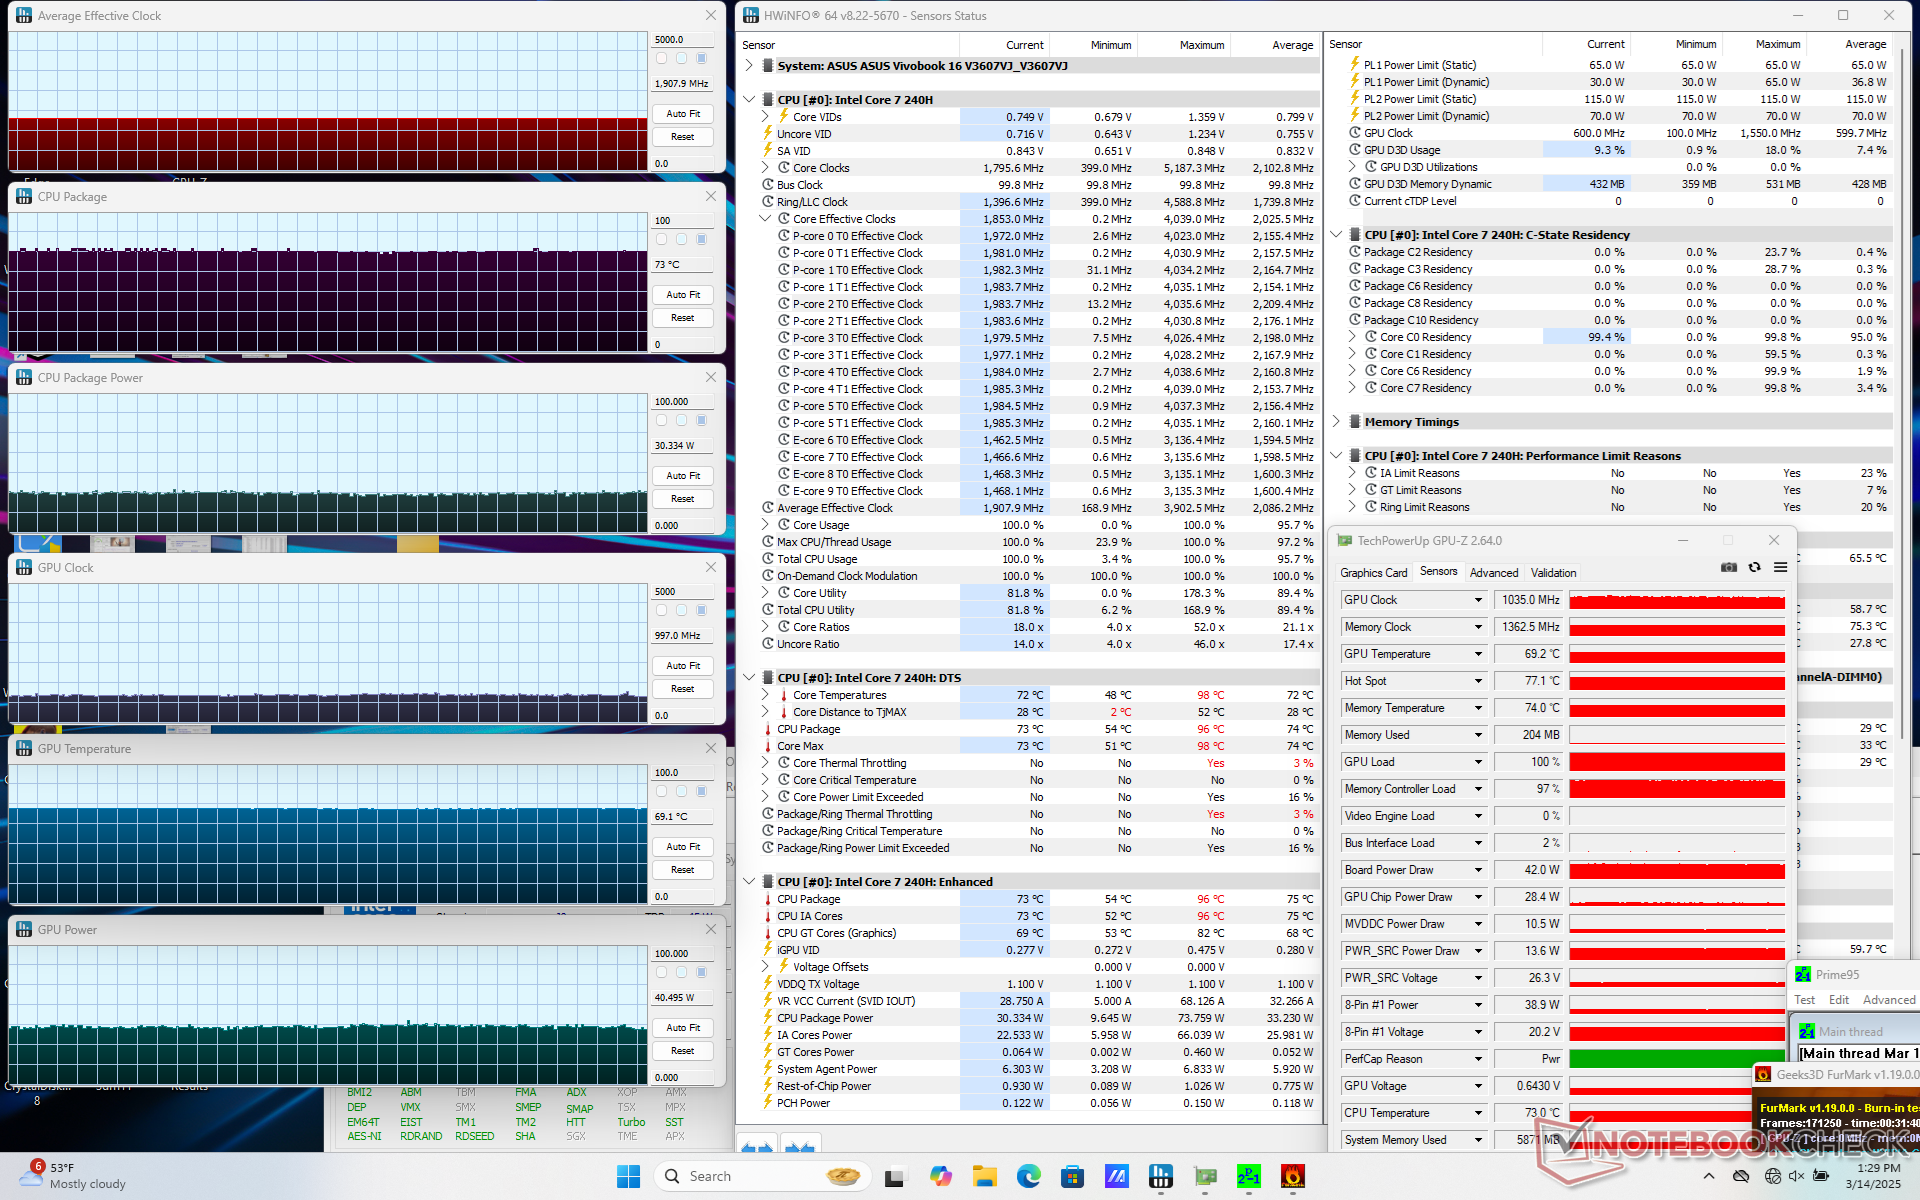
| Średnie taktowanieCPU (GHz) | Taktowanie GPU (MHz) | Średnia temperatura CPU (°C) | Średnia temperatura GPU (°C) | |
| System w stanie spoczynku | -- | -- | 55 | 53 |
| Prime95 Stress | 3.1 | -- | 78 | 63 |
| Prime95 + FurMark Stress | 1.9 | 1035 | 73 | 69 |
| Cyberpunk 2077 Stres (tryb wydajności) | 0.9 | 1612 | 71 | 70 |
| Cyberpunk 2077 Stress (tryb zrównoważony) | 0.9 | 1402 | 67 | 65 |
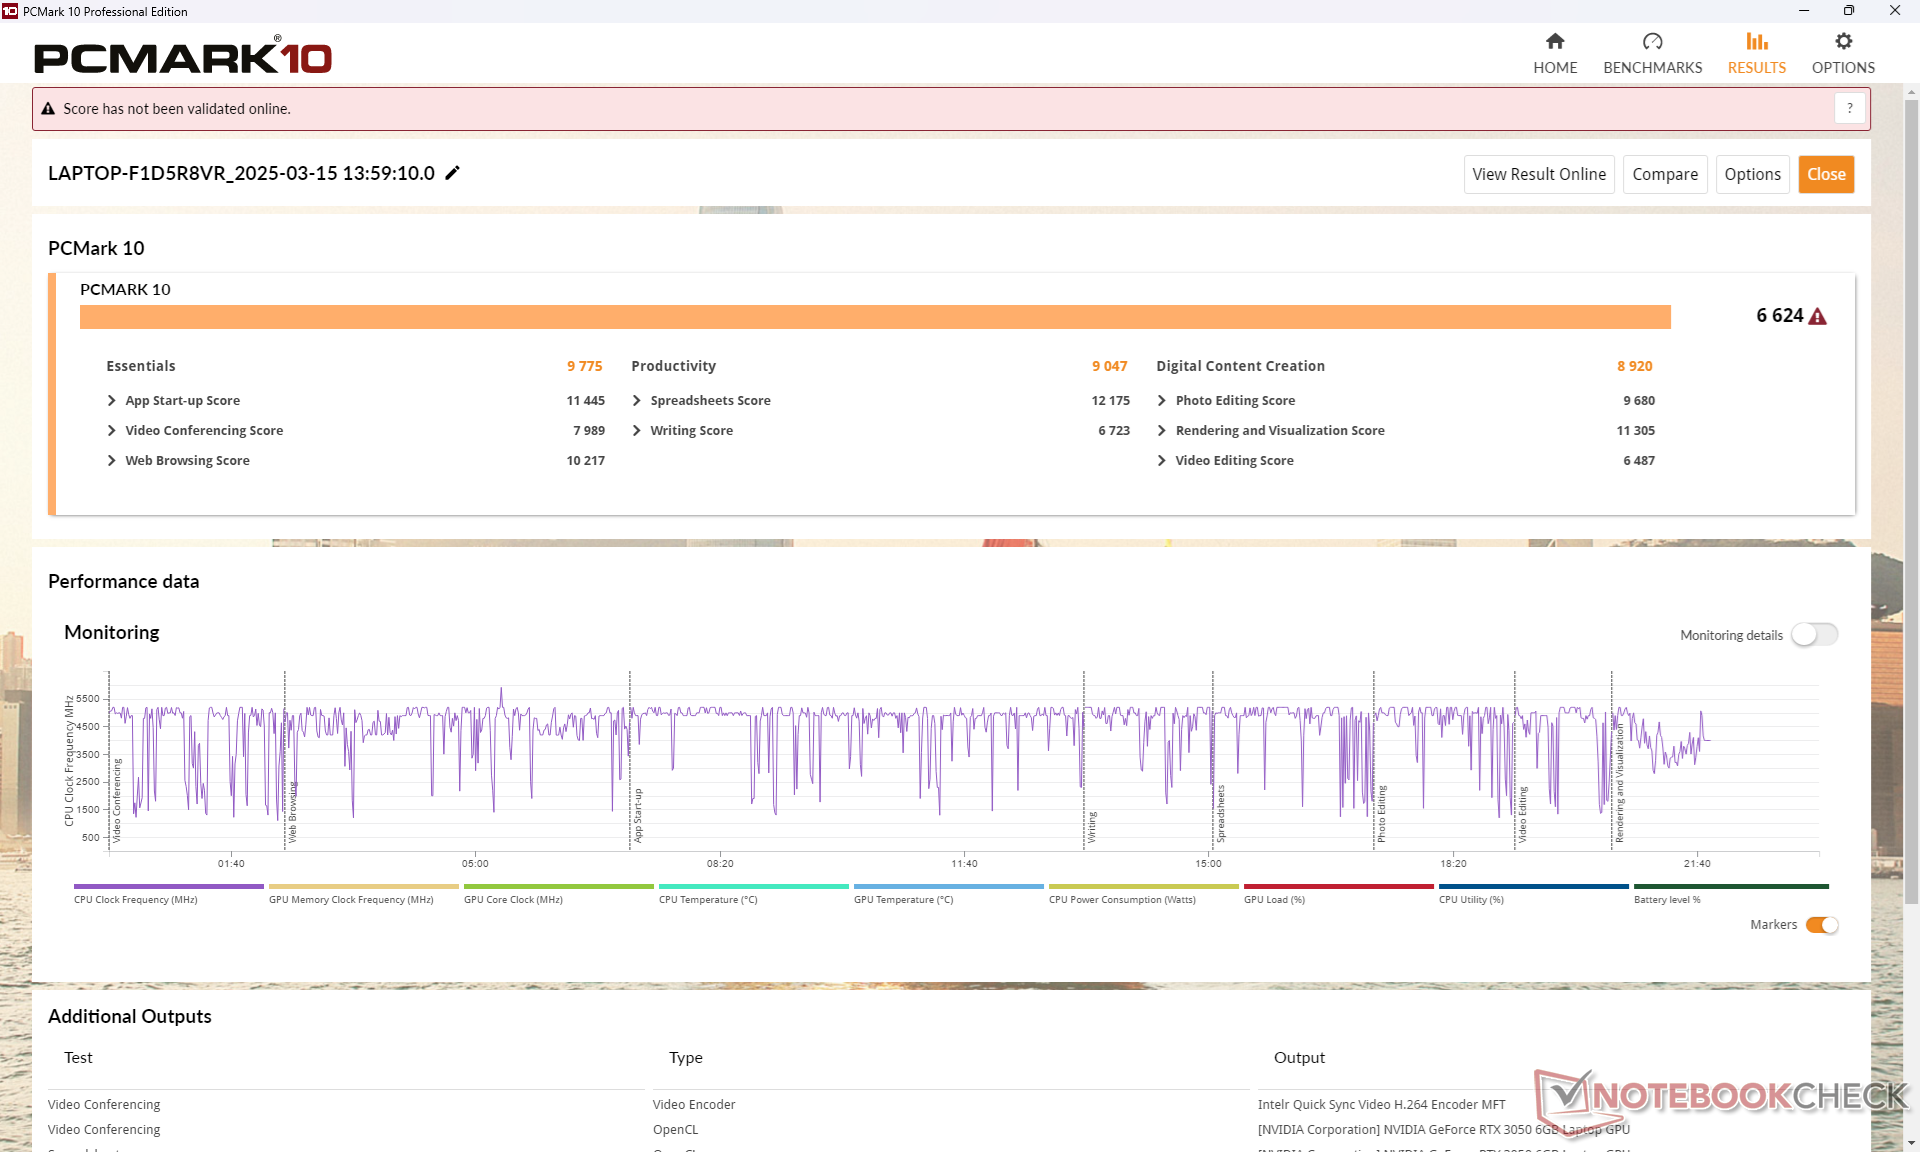
Wydajność systemu
CrossMark: Overall | Productivity | Creativity | Responsiveness
WebXPRT 3: Overall
WebXPRT 4: Overall
Mozilla Kraken 1.1: Total
| PCMark 10 / Score | |
| Asus VivoBook Pro 16 K6602VU | |
| Dell Inspiron 16 Plus 7640 | |
| Asus V16 V3607V | |
| Przeciętny Intel Core 7 240H, NVIDIA GeForce RTX 3050 6GB Laptop GPU (n=1) | |
| HP Pavilion Plus 16-ab0456tx | |
| Acer Swift Edge 16 SFE16-44-R0XV | |
| Lenovo ThinkBook 16 G7 IML | |
| PCMark 10 / Essentials | |
| Dell Inspiron 16 Plus 7640 | |
| Asus VivoBook Pro 16 K6602VU | |
| Acer Swift Edge 16 SFE16-44-R0XV | |
| HP Pavilion Plus 16-ab0456tx | |
| Lenovo ThinkBook 16 G7 IML | |
| Asus V16 V3607V | |
| Przeciętny Intel Core 7 240H, NVIDIA GeForce RTX 3050 6GB Laptop GPU (n=1) | |
| PCMark 10 / Productivity | |
| Acer Swift Edge 16 SFE16-44-R0XV | |
| Asus V16 V3607V | |
| Przeciętny Intel Core 7 240H, NVIDIA GeForce RTX 3050 6GB Laptop GPU (n=1) | |
| HP Pavilion Plus 16-ab0456tx | |
| Asus VivoBook Pro 16 K6602VU | |
| Dell Inspiron 16 Plus 7640 | |
| Lenovo ThinkBook 16 G7 IML | |
| PCMark 10 / Digital Content Creation | |
| Dell Inspiron 16 Plus 7640 | |
| Asus VivoBook Pro 16 K6602VU | |
| Asus V16 V3607V | |
| Przeciętny Intel Core 7 240H, NVIDIA GeForce RTX 3050 6GB Laptop GPU (n=1) | |
| HP Pavilion Plus 16-ab0456tx | |
| Acer Swift Edge 16 SFE16-44-R0XV | |
| Lenovo ThinkBook 16 G7 IML | |
| CrossMark / Overall | |
| Asus V16 V3607V | |
| Przeciętny Intel Core 7 240H, NVIDIA GeForce RTX 3050 6GB Laptop GPU (n=1) | |
| HP Pavilion Plus 16-ab0456tx | |
| Asus VivoBook Pro 16 K6602VU | |
| Dell Inspiron 16 Plus 7640 | |
| Lenovo ThinkBook 16 G7 IML | |
| CrossMark / Productivity | |
| Asus V16 V3607V | |
| Przeciętny Intel Core 7 240H, NVIDIA GeForce RTX 3050 6GB Laptop GPU (n=1) | |
| Asus VivoBook Pro 16 K6602VU | |
| HP Pavilion Plus 16-ab0456tx | |
| Dell Inspiron 16 Plus 7640 | |
| Lenovo ThinkBook 16 G7 IML | |
| CrossMark / Creativity | |
| HP Pavilion Plus 16-ab0456tx | |
| Asus V16 V3607V | |
| Przeciętny Intel Core 7 240H, NVIDIA GeForce RTX 3050 6GB Laptop GPU (n=1) | |
| Dell Inspiron 16 Plus 7640 | |
| Asus VivoBook Pro 16 K6602VU | |
| Lenovo ThinkBook 16 G7 IML | |
| CrossMark / Responsiveness | |
| Asus V16 V3607V | |
| Przeciętny Intel Core 7 240H, NVIDIA GeForce RTX 3050 6GB Laptop GPU (n=1) | |
| Asus VivoBook Pro 16 K6602VU | |
| HP Pavilion Plus 16-ab0456tx | |
| Dell Inspiron 16 Plus 7640 | |
| Lenovo ThinkBook 16 G7 IML | |
| WebXPRT 3 / Overall | |
| Dell Inspiron 16 Plus 7640 | |
| HP Pavilion Plus 16-ab0456tx | |
| Acer Swift Edge 16 SFE16-44-R0XV | |
| Acer Swift Edge 16 SFE16-44-R0XV | |
| Lenovo ThinkBook 16 G7 IML | |
| WebXPRT 4 / Overall | |
| Asus V16 V3607V | |
| Przeciętny Intel Core 7 240H, NVIDIA GeForce RTX 3050 6GB Laptop GPU (n=1) | |
| HP Pavilion Plus 16-ab0456tx | |
| Dell Inspiron 16 Plus 7640 | |
| Acer Swift Edge 16 SFE16-44-R0XV | |
| Asus VivoBook Pro 16 K6602VU | |
| Lenovo ThinkBook 16 G7 IML | |
| Mozilla Kraken 1.1 / Total | |
| Lenovo ThinkBook 16 G7 IML | |
| Acer Swift Edge 16 SFE16-44-R0XV | |
| Acer Swift Edge 16 SFE16-44-R0XV | |
| Asus VivoBook Pro 16 K6602VU | |
| Dell Inspiron 16 Plus 7640 | |
| Asus V16 V3607V | |
| Przeciętny Intel Core 7 240H, NVIDIA GeForce RTX 3050 6GB Laptop GPU (n=1) | |
| HP Pavilion Plus 16-ab0456tx | |
* ... im mniej tym lepiej
| PCMark 10 Score | 6624 pkt. | |
Pomoc | ||
| AIDA64 / Memory Copy | |
| Acer Swift Edge 16 SFE16-44-R0XV | |
| HP Pavilion Plus 16-ab0456tx | |
| Dell Inspiron 16 Plus 7640 | |
| Asus VivoBook Pro 16 K6602VU | |
| Lenovo ThinkBook 16 G7 IML | |
| Asus V16 V3607V | |
| Przeciętny Intel Core 7 240H (n=1) | |
| AIDA64 / Memory Read | |
| Dell Inspiron 16 Plus 7640 | |
| Asus VivoBook Pro 16 K6602VU | |
| HP Pavilion Plus 16-ab0456tx | |
| Acer Swift Edge 16 SFE16-44-R0XV | |
| Asus V16 V3607V | |
| Przeciętny Intel Core 7 240H (n=1) | |
| Lenovo ThinkBook 16 G7 IML | |
| AIDA64 / Memory Write | |
| Acer Swift Edge 16 SFE16-44-R0XV | |
| HP Pavilion Plus 16-ab0456tx | |
| Dell Inspiron 16 Plus 7640 | |
| Asus VivoBook Pro 16 K6602VU | |
| Lenovo ThinkBook 16 G7 IML | |
| Asus V16 V3607V | |
| Przeciętny Intel Core 7 240H (n=1) | |
| AIDA64 / Memory Latency | |
| Lenovo ThinkBook 16 G7 IML | |
| Dell Inspiron 16 Plus 7640 | |
| Acer Swift Edge 16 SFE16-44-R0XV | |
| Asus V16 V3607V | |
| Przeciętny Intel Core 7 240H (n=1) | |
| Asus VivoBook Pro 16 K6602VU | |
| HP Pavilion Plus 16-ab0456tx | |
* ... im mniej tym lepiej
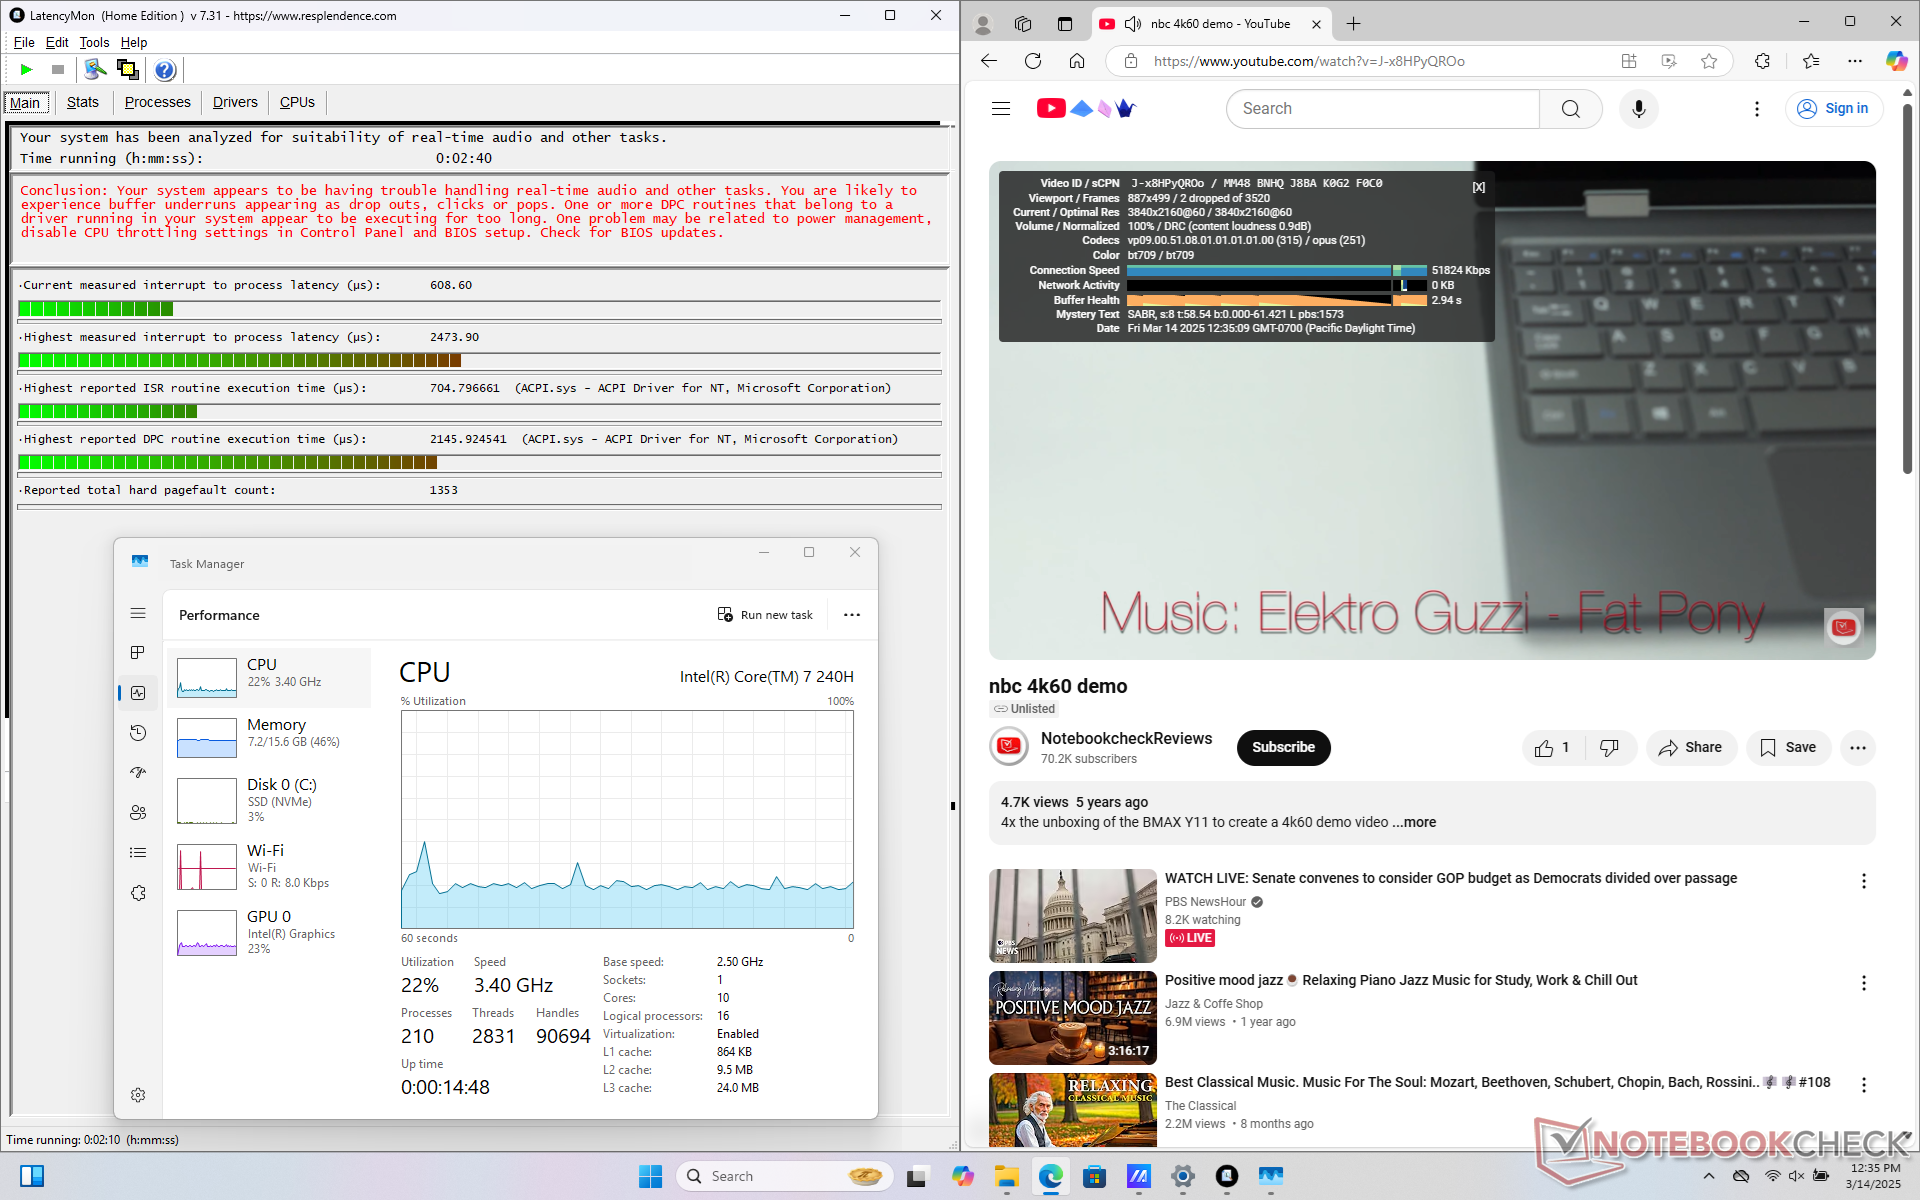
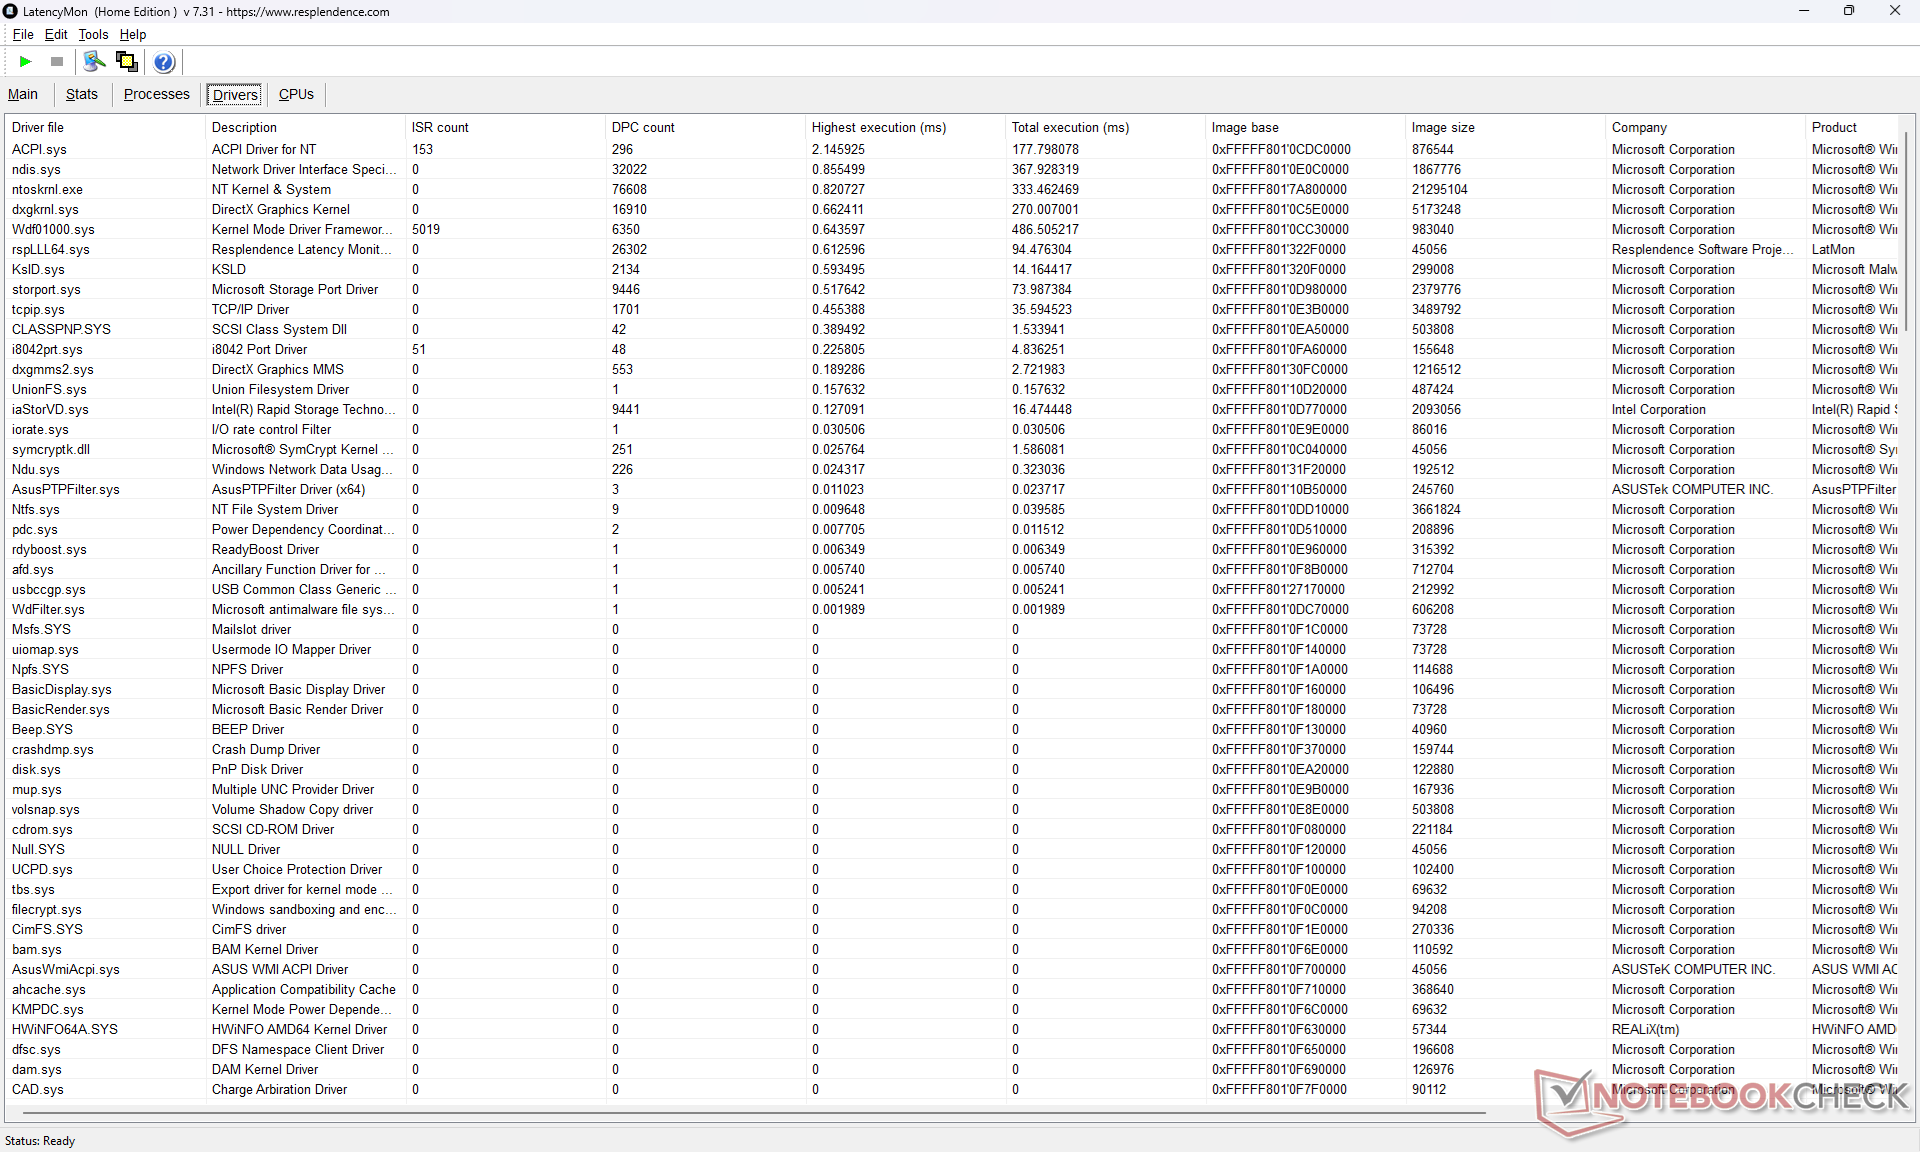
Opóźnienie DPC
LatencyMon pokazuje problemy z DPC podczas otwierania wielu kart na naszej stronie głównej i tylko kilka spadków klatek podczas naszego testu odtwarzania wideo 4K60.
| DPC Latencies / LatencyMon - interrupt to process latency (max), Web, Youtube, Prime95 | |
| Acer Swift Edge 16 SFE16-44-R0XV | |
| HP Pavilion Plus 16-ab0456tx | |
| Asus V16 V3607V | |
| Asus VivoBook Pro 16 K6602VU | |
| Lenovo ThinkBook 16 G7 IML | |
| Dell Inspiron 16 Plus 7640 | |
* ... im mniej tym lepiej
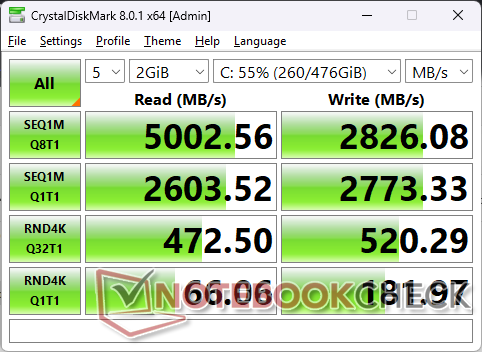
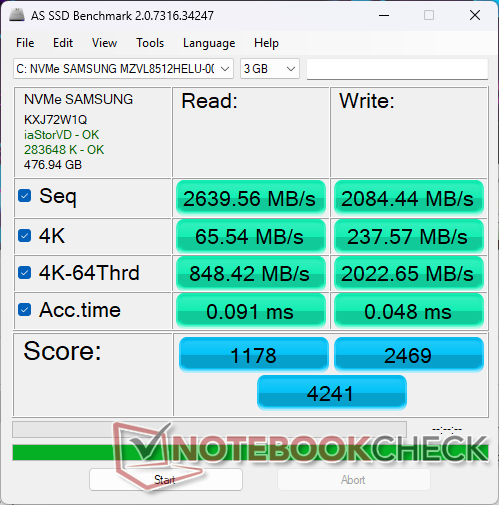
Urządzenia pamięci masowej
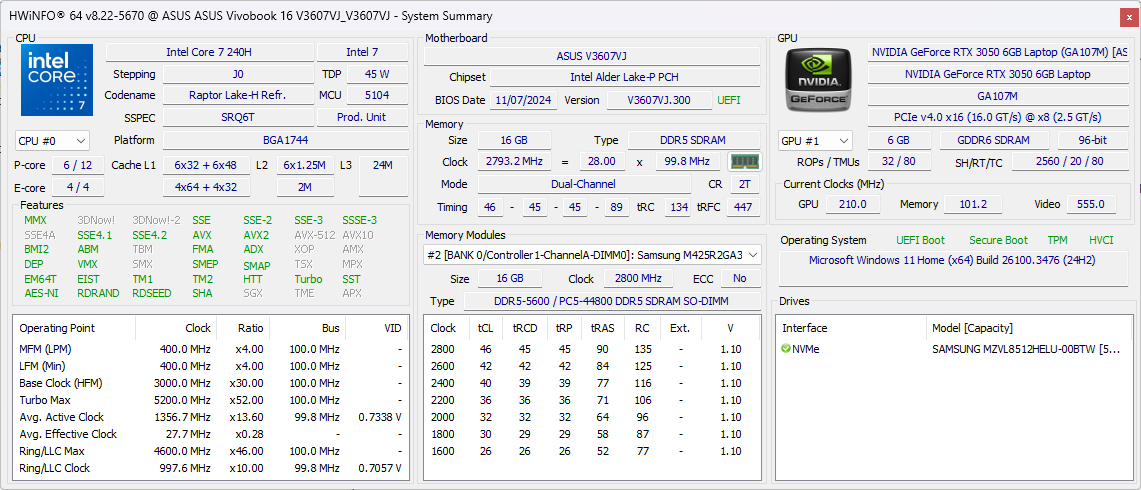
Dysk SSD Samsung MZVL8512HELU PCIe4 o pojemności 512 GB osiąga maksymalną prędkość nieco poniżej 5000 MB/s. Jednak wydajność spadnie po kilku minutach użytkowania, jak pokazuje poniższy wykres.

| Drive Performance Rating - Percent | |
| Acer Swift Edge 16 SFE16-44-R0XV | |
| HP Pavilion Plus 16-ab0456tx | |
| Asus V16 V3607V | |
| Asus VivoBook Pro 16 K6602VU | |
| Dell Inspiron 16 Plus 7640 | |
| Lenovo ThinkBook 16 G7 IML | |
* ... im mniej tym lepiej
Disk Throttling: DiskSpd Read Loop, Queue Depth 8
Wydajność GPU
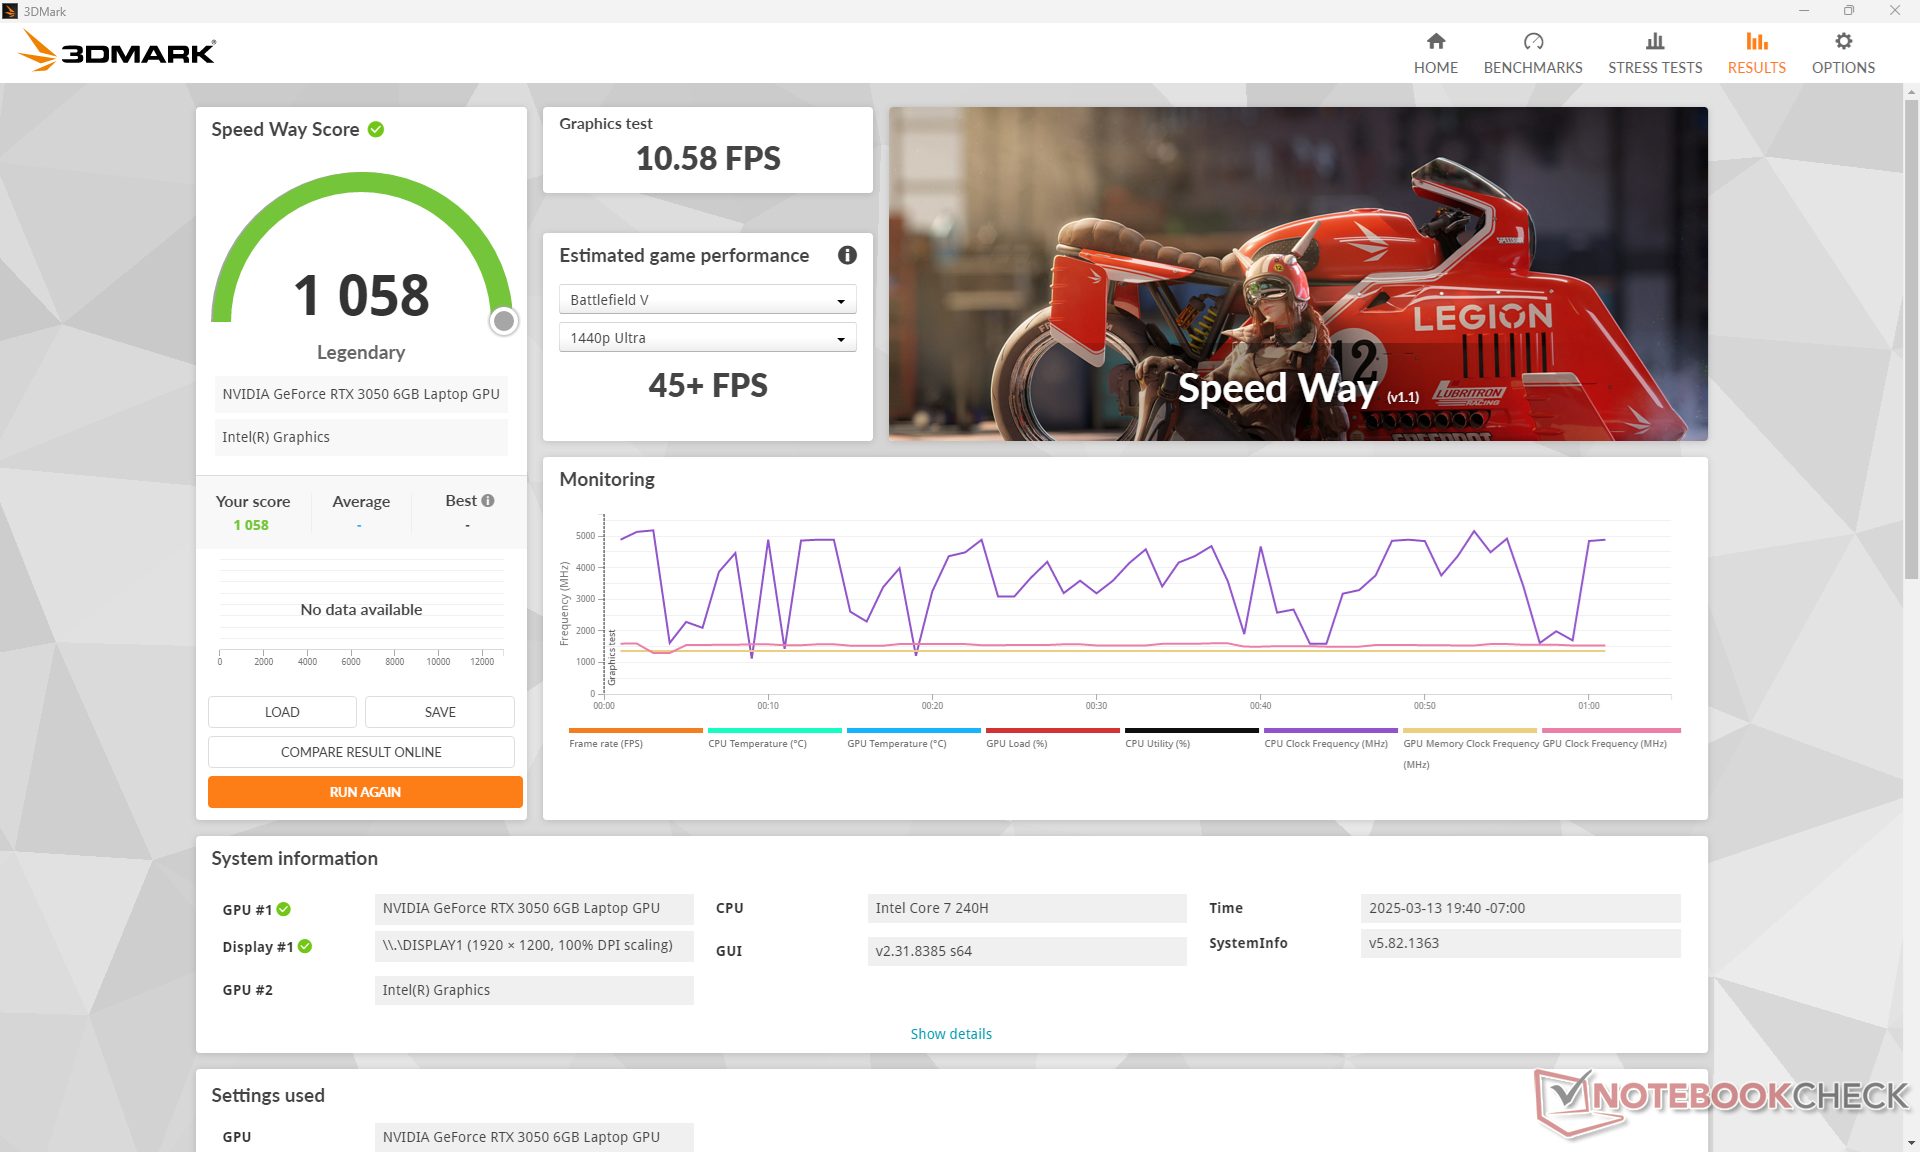
The GeForce RTX 3050 jest o około 20 do 25 procent szybsza niż RTX 2050 lub od 30 do 35 procent wolniejszy niż RTX 4050. Proszę zauważyć, że Asus jest dostarczany z lepszą wersją 6 GB RTX 3050 zamiast wersji 4 GB.
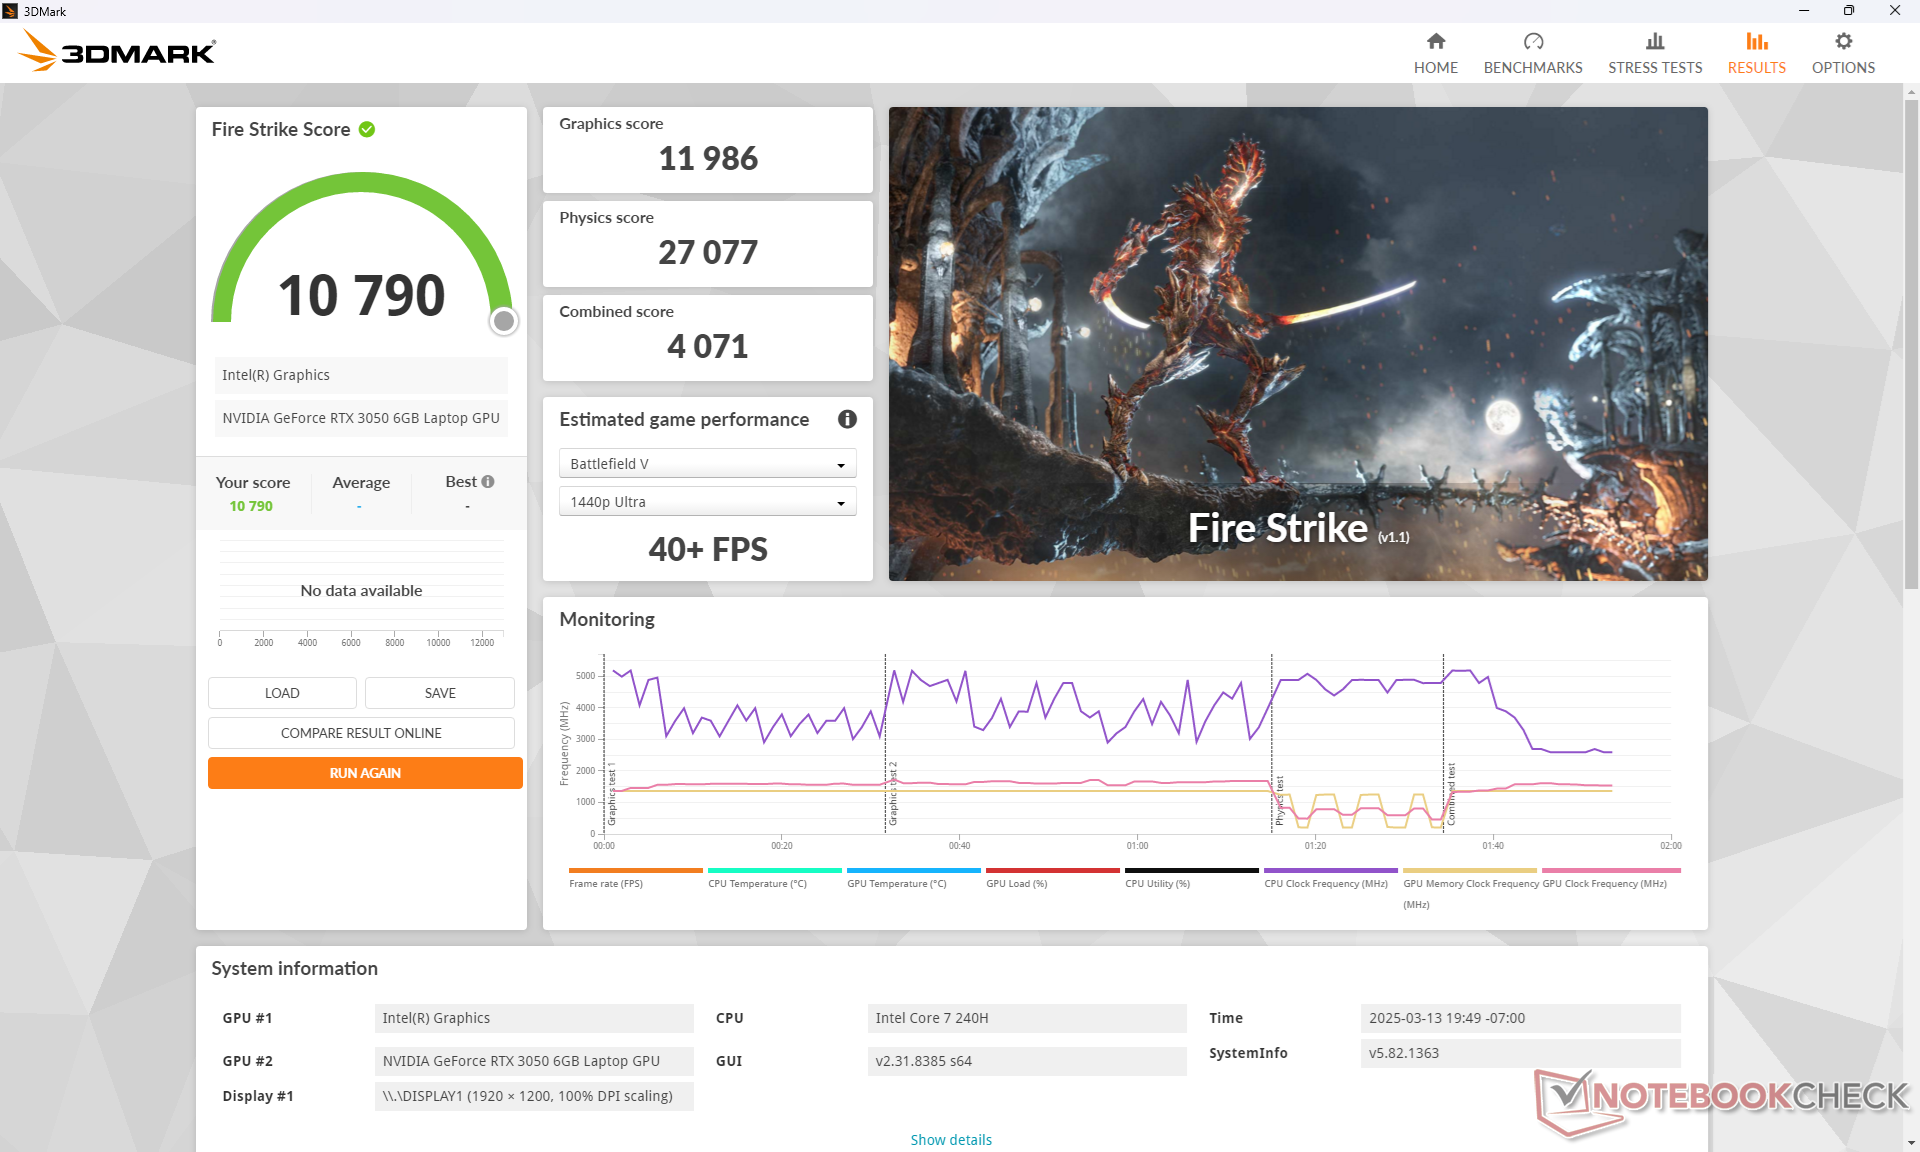
| Profil zasilania | Wynik grafiki | Wynik fizyki | Wynik łączny |
| Tryb wydajności | 11986 | 27077 | 4071 |
| Tryb zrównoważony | 11317 (-6%) | 28246 (-0%) | 3842 (-6%) |
| Zasilanie bateryjne | 9900 (-17%) | 20557 (-24%) | 3573 (-12%) |
Praca w trybie zrównoważonym nieznacznie wpływa na wydajność graficzną, podczas gdy tryb zasilania bateryjnego obniżyłby wydajność jeszcze bardziej, jak pokazuje nasza tabela wyników Fire Strike powyżej.
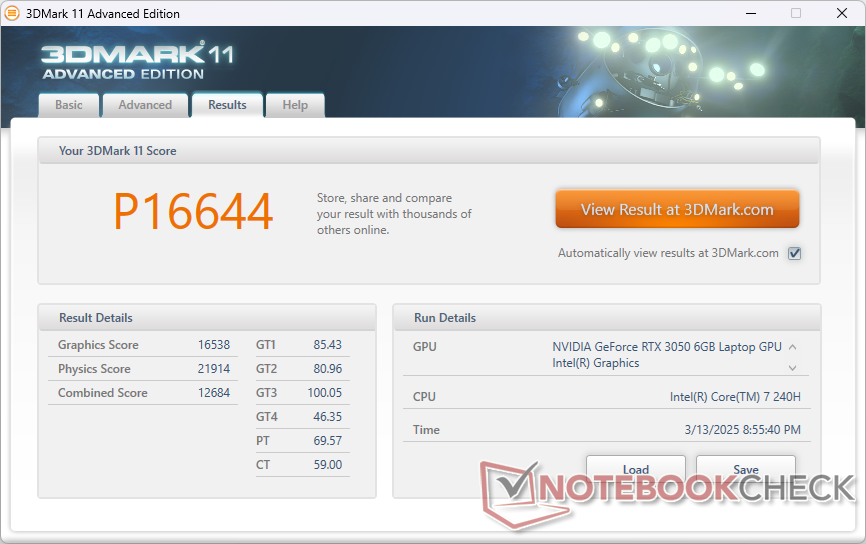
| 3DMark 11 Performance | 16644 pkt. | |
| 3DMark Fire Strike Score | 10790 pkt. | |
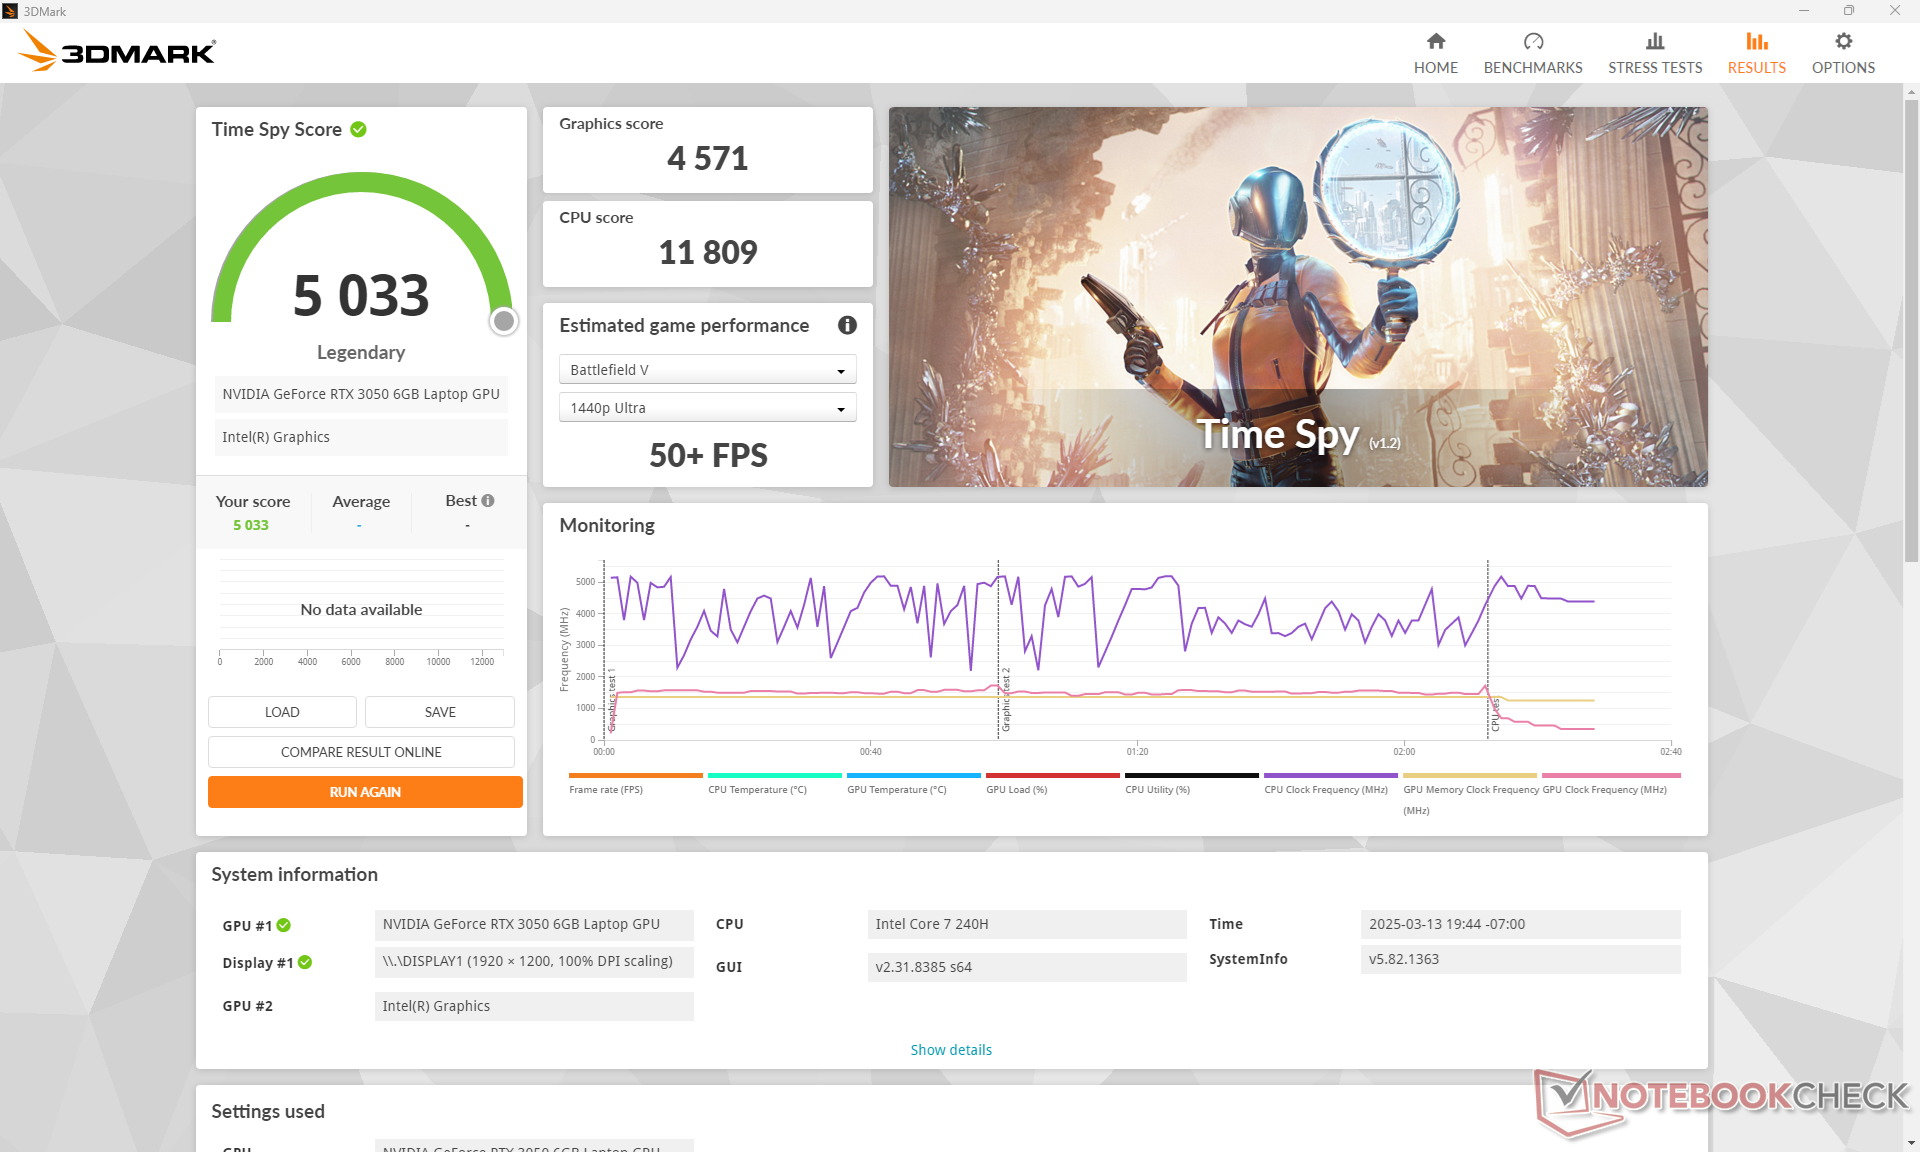
| 3DMark Time Spy Score | 5033 pkt. | |
Pomoc | ||
* ... im mniej tym lepiej
Wydajność w grach
RTX 3050 może i ma już swoje lata, ale wciąż jest wystarczająco wydajny, by uruchomić wymagające tytuły, takie jak Cyberpunk 2077 w natywnej rozdzielczości 1080p lub 1200p z większością ustawień na High.
| F1 22 | |
| 1280x720 Ultra Low Preset AA:T AF:16x | |
| Lenovo ThinkPad Z16 Gen 2 | |
| Asus V16 V3607V | |
| Przeciętny NVIDIA GeForce RTX 3050 6GB Laptop GPU (198 - 236, n=3) | |
| HP Spectre x360 16 RTX 4050 | |
| 1920x1080 Low Preset AA:T AF:16x | |
| HP Spectre x360 16 RTX 4050 | |
| Asus V16 V3607V | |
| Przeciętny NVIDIA GeForce RTX 3050 6GB Laptop GPU (110.9 - 163.5, n=4) | |
| Lenovo ThinkPad Z16 Gen 2 | |
| 1920x1080 Medium Preset AA:T AF:16x | |
| HP Spectre x360 16 RTX 4050 | |
| Asus V16 V3607V | |
| Przeciętny NVIDIA GeForce RTX 3050 6GB Laptop GPU (106.1 - 151.5, n=4) | |
| Lenovo ThinkPad Z16 Gen 2 | |
| 1920x1080 High Preset AA:T AF:16x | |
| HP Spectre x360 16 RTX 4050 | |
| Asus V16 V3607V | |
| Przeciętny NVIDIA GeForce RTX 3050 6GB Laptop GPU (85.5 - 109.7, n=4) | |
| Lenovo ThinkPad Z16 Gen 2 | |
| 1920x1080 Ultra High Preset AA:T AF:16x | |
| HP Spectre x360 16 RTX 4050 | |
| Przeciętny NVIDIA GeForce RTX 3050 6GB Laptop GPU (30.7 - 34, n=4) | |
| Asus V16 V3607V | |
| Lenovo ThinkPad Z16 Gen 2 | |
| Tiny Tina's Wonderlands | |
| 1280x720 Lowest Preset (DX12) | |
| Lenovo ThinkPad Z16 Gen 2 | |
| Asus V16 V3607V | |
| Przeciętny NVIDIA GeForce RTX 3050 6GB Laptop GPU (n=1) | |
| 1920x1080 Low Preset (DX12) | |
| HP Spectre x360 16 RTX 4050 | |
| Lenovo ThinkPad Z16 Gen 2 | |
| Przeciętny NVIDIA GeForce RTX 3050 6GB Laptop GPU (105.6 - 113.3, n=2) | |
| Asus V16 V3607V | |
| 1920x1080 Medium Preset (DX12) | |
| HP Spectre x360 16 RTX 4050 | |
| Lenovo ThinkPad Z16 Gen 2 | |
| Przeciętny NVIDIA GeForce RTX 3050 6GB Laptop GPU (84.7 - 89.7, n=2) | |
| Asus V16 V3607V | |
| 1920x1080 High Preset (DX12) | |
| HP Spectre x360 16 RTX 4050 | |
| Lenovo ThinkPad Z16 Gen 2 | |
| Przeciętny NVIDIA GeForce RTX 3050 6GB Laptop GPU (55.9 - 59.2, n=2) | |
| Asus V16 V3607V | |
| 1920x1080 Badass Preset (DX12) | |
| HP Spectre x360 16 RTX 4050 | |
| Przeciętny NVIDIA GeForce RTX 3050 6GB Laptop GPU (44.3 - 46.4, n=2) | |
| Asus V16 V3607V | |
| Lenovo ThinkPad Z16 Gen 2 | |
Cyberpunk 2077 ultra FPS Chart
| low | med. | high | ultra | |
|---|---|---|---|---|
| GTA V (2015) | 184.2 | 178.4 | 127.3 | 63.2 |
| Dota 2 Reborn (2015) | 181.4 | 161.2 | 146.8 | 135.1 |
| Final Fantasy XV Benchmark (2018) | 126.5 | 67.6 | 49.1 | |
| X-Plane 11.11 (2018) | 96.3 | 89.3 | 78.6 | |
| Far Cry 5 (2018) | 149 | 85 | 78 | 74 |
| Strange Brigade (2018) | 246 | 106.9 | 88.4 | 77 |
| Tiny Tina's Wonderlands (2022) | 105.6 | 84.7 | 55.9 | 44.3 |
| F1 22 (2022) | 149.9 | 138.9 | 102 | 31.6 |
| Baldur's Gate 3 (2023) | 59.7 | 50.3 | 45.4 | 44.3 |
| Cyberpunk 2077 2.2 Phantom Liberty (2023) | 66.7 | 51.4 | 42.7 | 36.1 |
Emisje
Hałas systemowy
Hałas wentylatora jest generalnie cichy przy niskich obciążeniach, ale niestety dość szybko wzrasta, gdy wprowadzane są bardziej wymagające obciążenia, takie jak uruchamianie aplikacji. Podczas grania w trybie Balanced jest nieco ciszej niż w trybie Performance (38,3 dB(A) vs. 40,5 dB(A)), kosztem nieco wolniejszej wydajności graficznej, o czym wspomnieliśmy powyżej.
Hałas
| luz |
| 23.5 / 23.7 / 23.7 dB |
| obciążenie |
| 48 / 51 dB |
 | ||
30 dB cichy 40 dB(A) słyszalny 50 dB(A) irytujący |
||
min: | ||
| Asus V16 V3607V GeForce RTX 3050 6GB Laptop GPU, Core 7 240H | Asus VivoBook Pro 16 K6602VU NVIDIA GeForce RTX 4050 Laptop GPU, i9-13900H, Micron 2400 MTFDKBA1T0QFM | Dell Inspiron 16 Plus 7640 NVIDIA GeForce RTX 4060 Laptop GPU, Ultra 7 155H, SK hynix BC901 HFS001TEJ4X164N | Lenovo ThinkBook 16 G7 IML Graphics 4-Core, Ultra 5 125U, SK hynix HFS512GEJ4X112N | HP Pavilion Plus 16-ab0456tx GeForce RTX 3050 6GB Laptop GPU, i7-13700H, WDC PC SN810 1TB | Acer Swift Edge 16 SFE16-44-R0XV Radeon 760M, R5 8640U, Micron 3400 MTFDKBA512TFH 512GB | |
|---|---|---|---|---|---|---|
| Noise | -4% | 5% | 18% | 9% | -13% | |
| wyłączone / środowisko * | 23.3 | 20.96 10% | 23.8 -2% | 23.1 1% | 22.22 5% | 25 -7% |
| Idle Minimum * | 23.5 | 25.28 -8% | 24.2 -3% | 23.1 2% | 22.22 5% | 26 -11% |
| Idle Average * | 23.7 | 25.28 -7% | 24.2 -2% | 23.1 3% | 22.22 6% | 29 -22% |
| Idle Maximum * | 23.7 | 25.28 -7% | 24.2 -2% | 23.1 3% | 22.22 6% | 39 -65% |
| Load Average * | 48 | 51.88 -8% | 28.9 40% | 23.2 52% | 42.03 12% | 45 6% |
| Cyberpunk 2077 ultra * | 40.5 | 29.2 28% | 43 -6% | |||
| Load Maximum * | 51 | 51.8 -2% | 51 -0% | 32.6 36% | 42.1 17% | 45 12% |
| Witcher 3 ultra * | 49 | 51 | 42.1 |
* ... im mniej tym lepiej
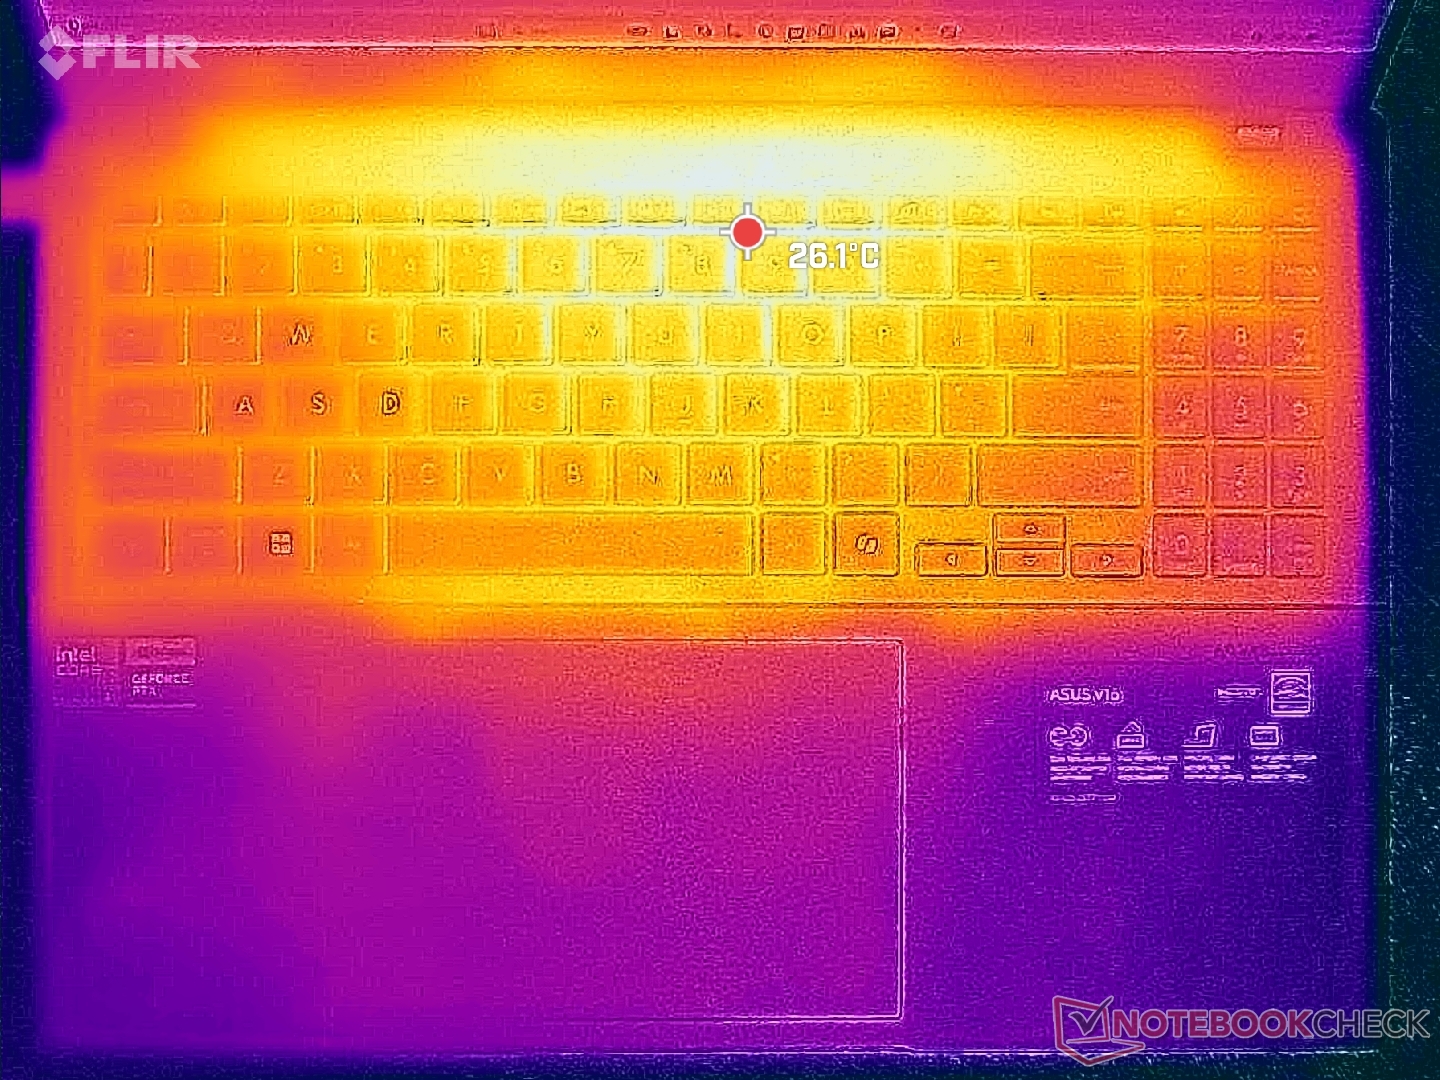
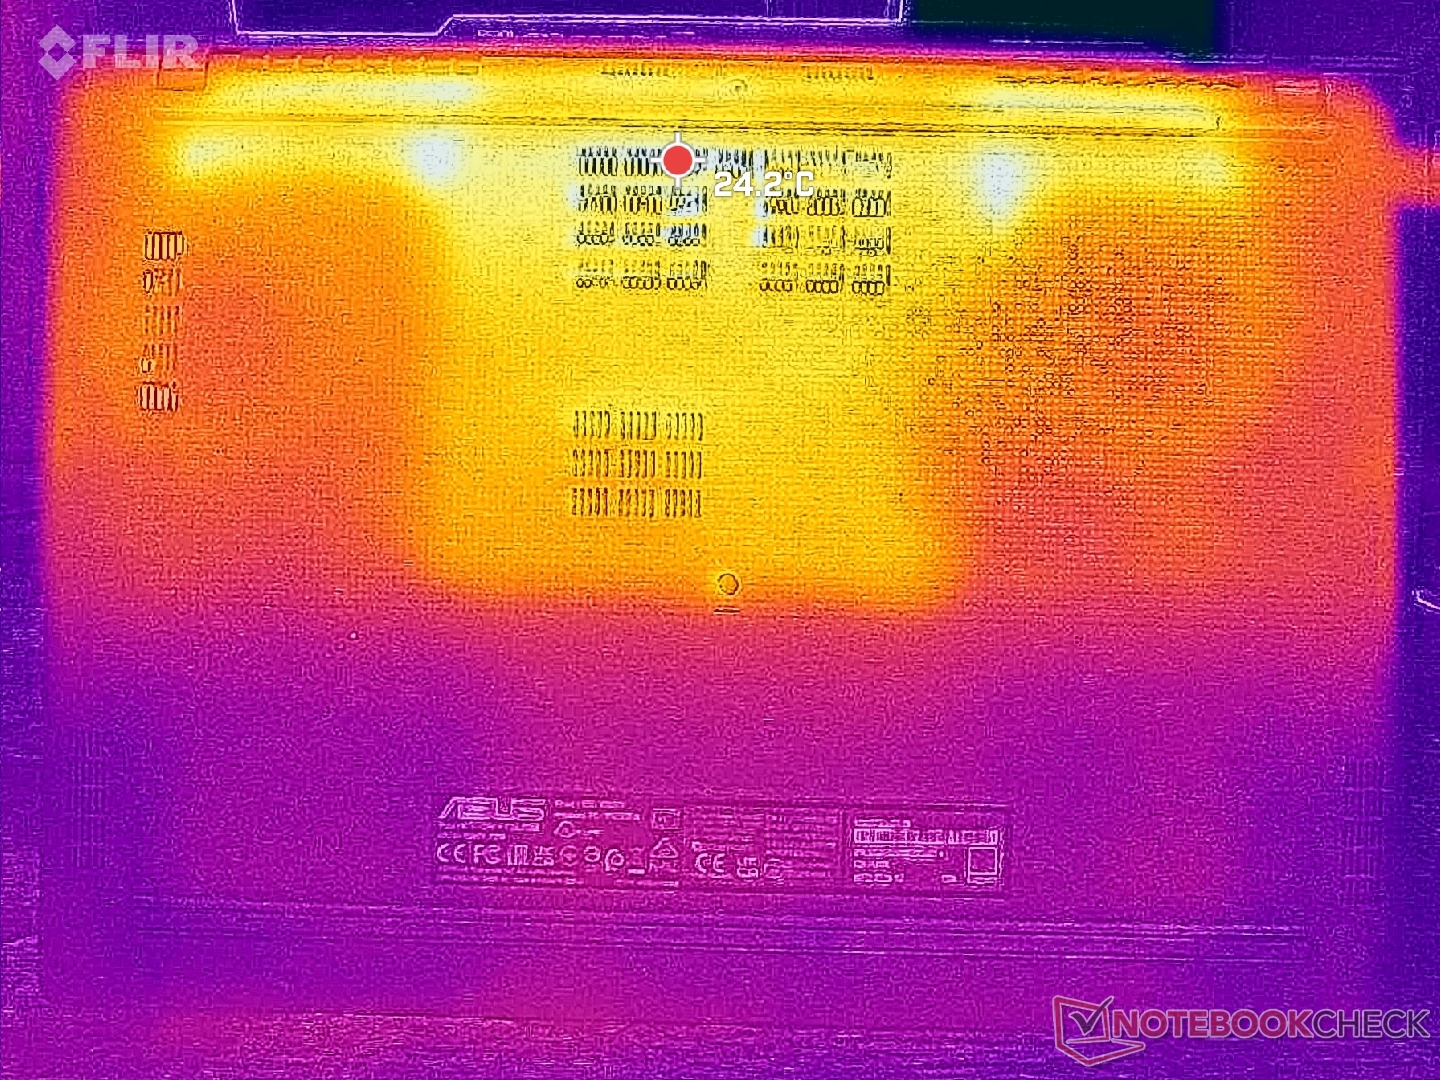
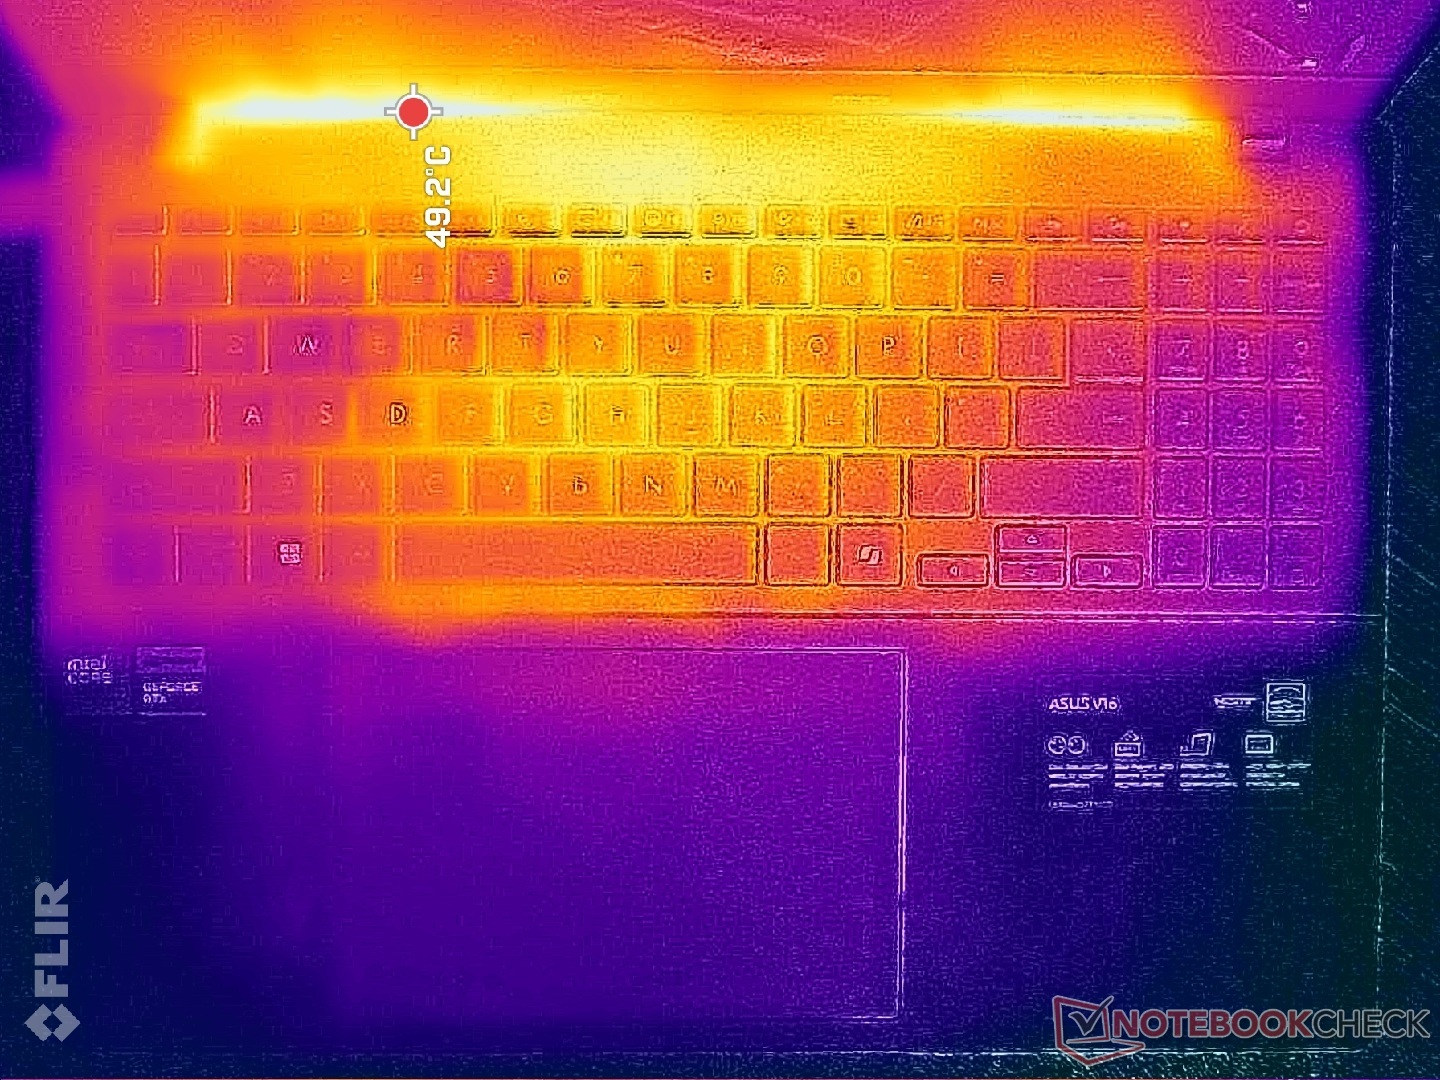
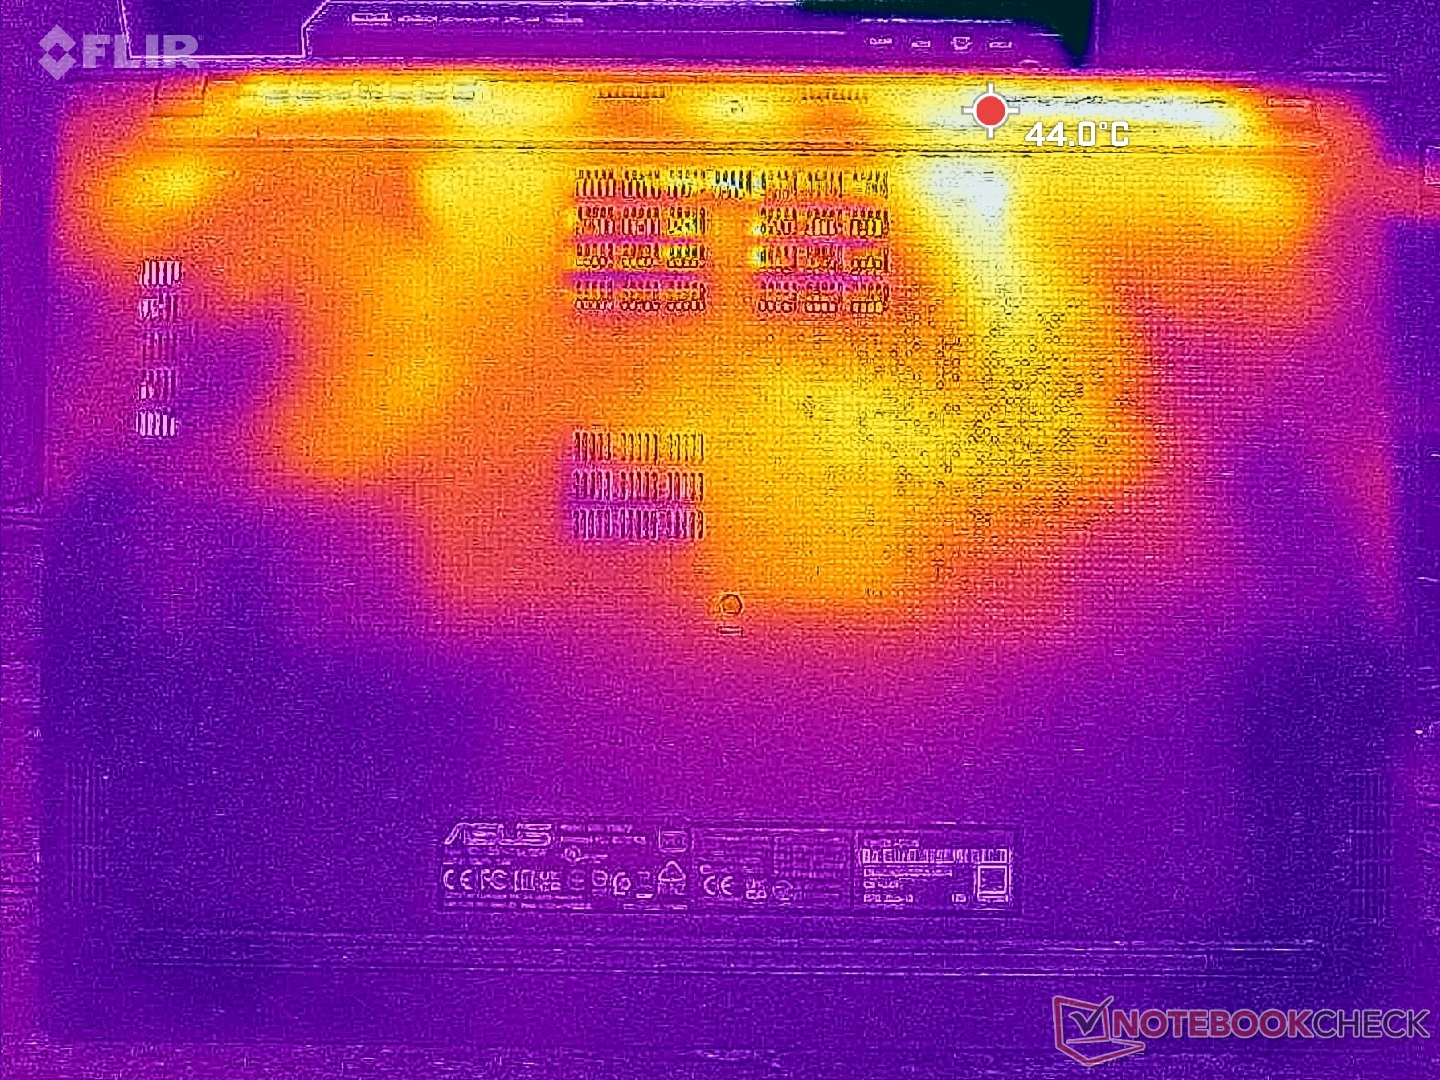
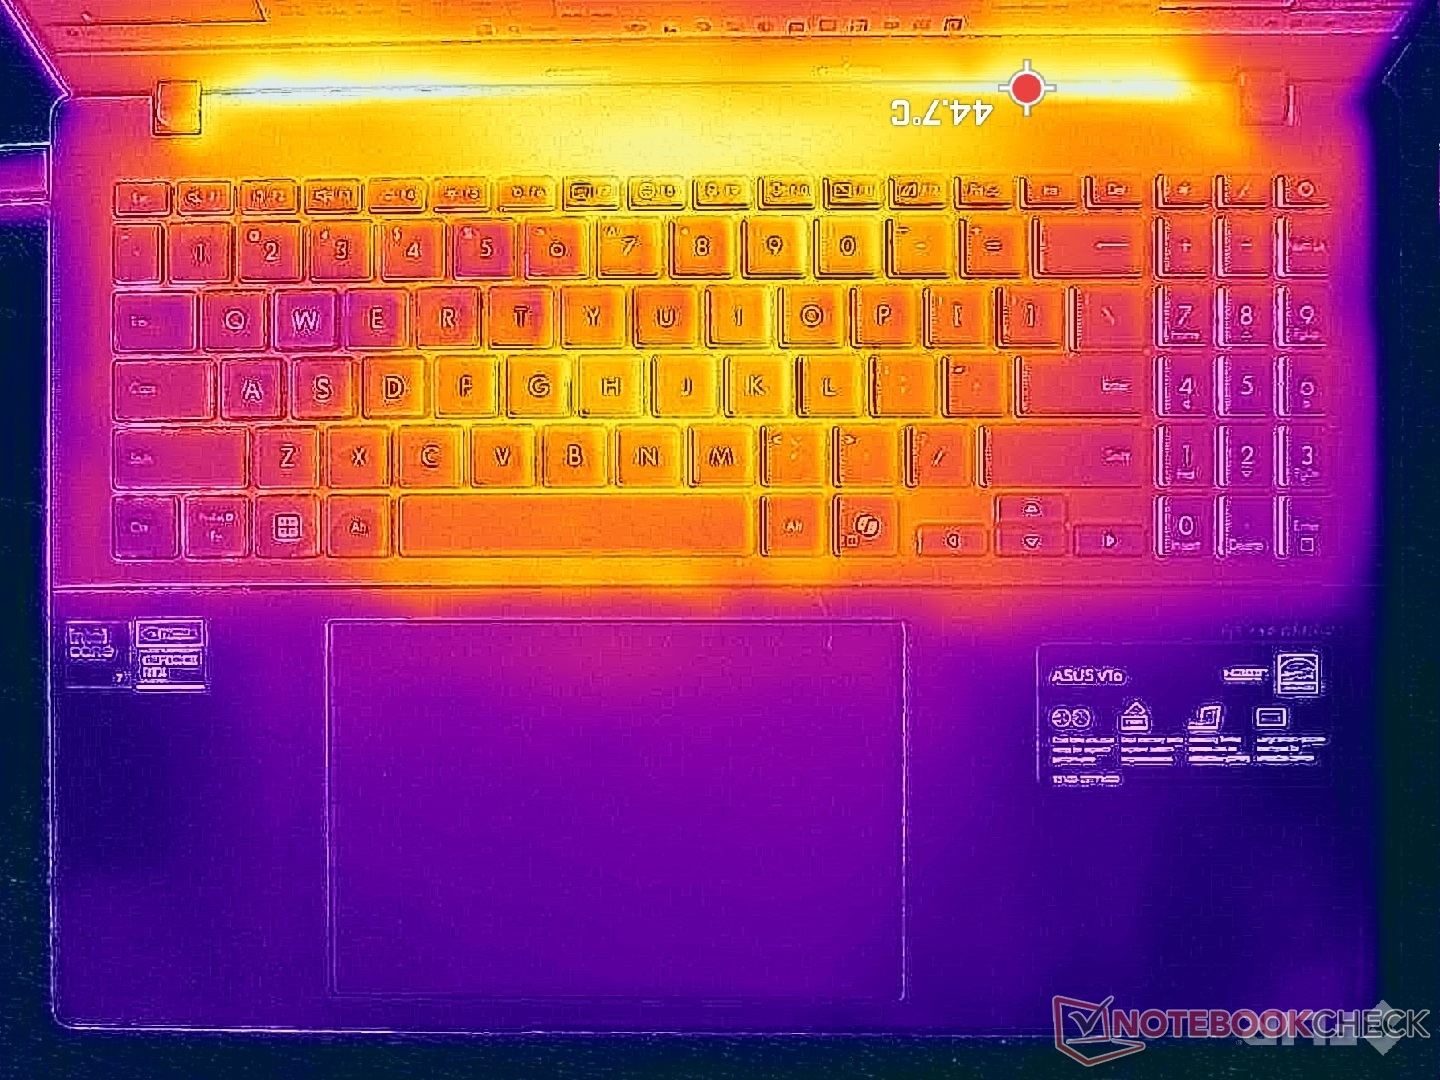
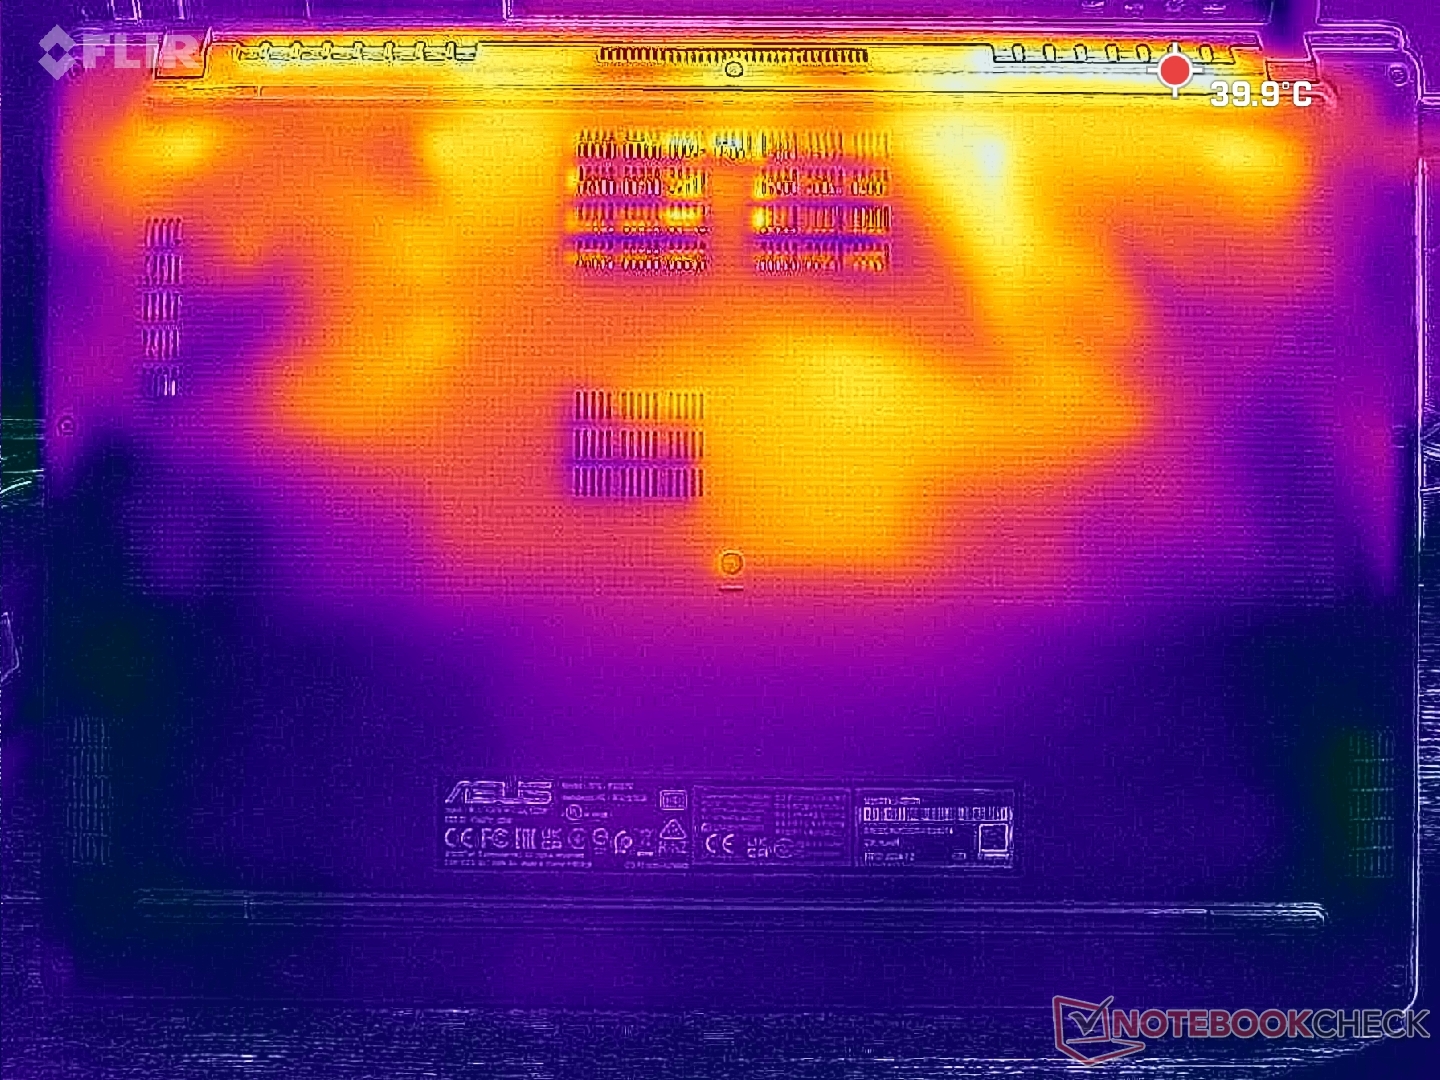
Temperatura
Gorące punkty znajdują się z tyłu, gdzie mogą osiągnąć ponad 40 C, jak pokazują poniższe mapy temperatur. Podpórki pod nadgarstki, klawiatura numeryczna i klawisze WASD pozostaną chłodniejsze podczas pisania lub grania.
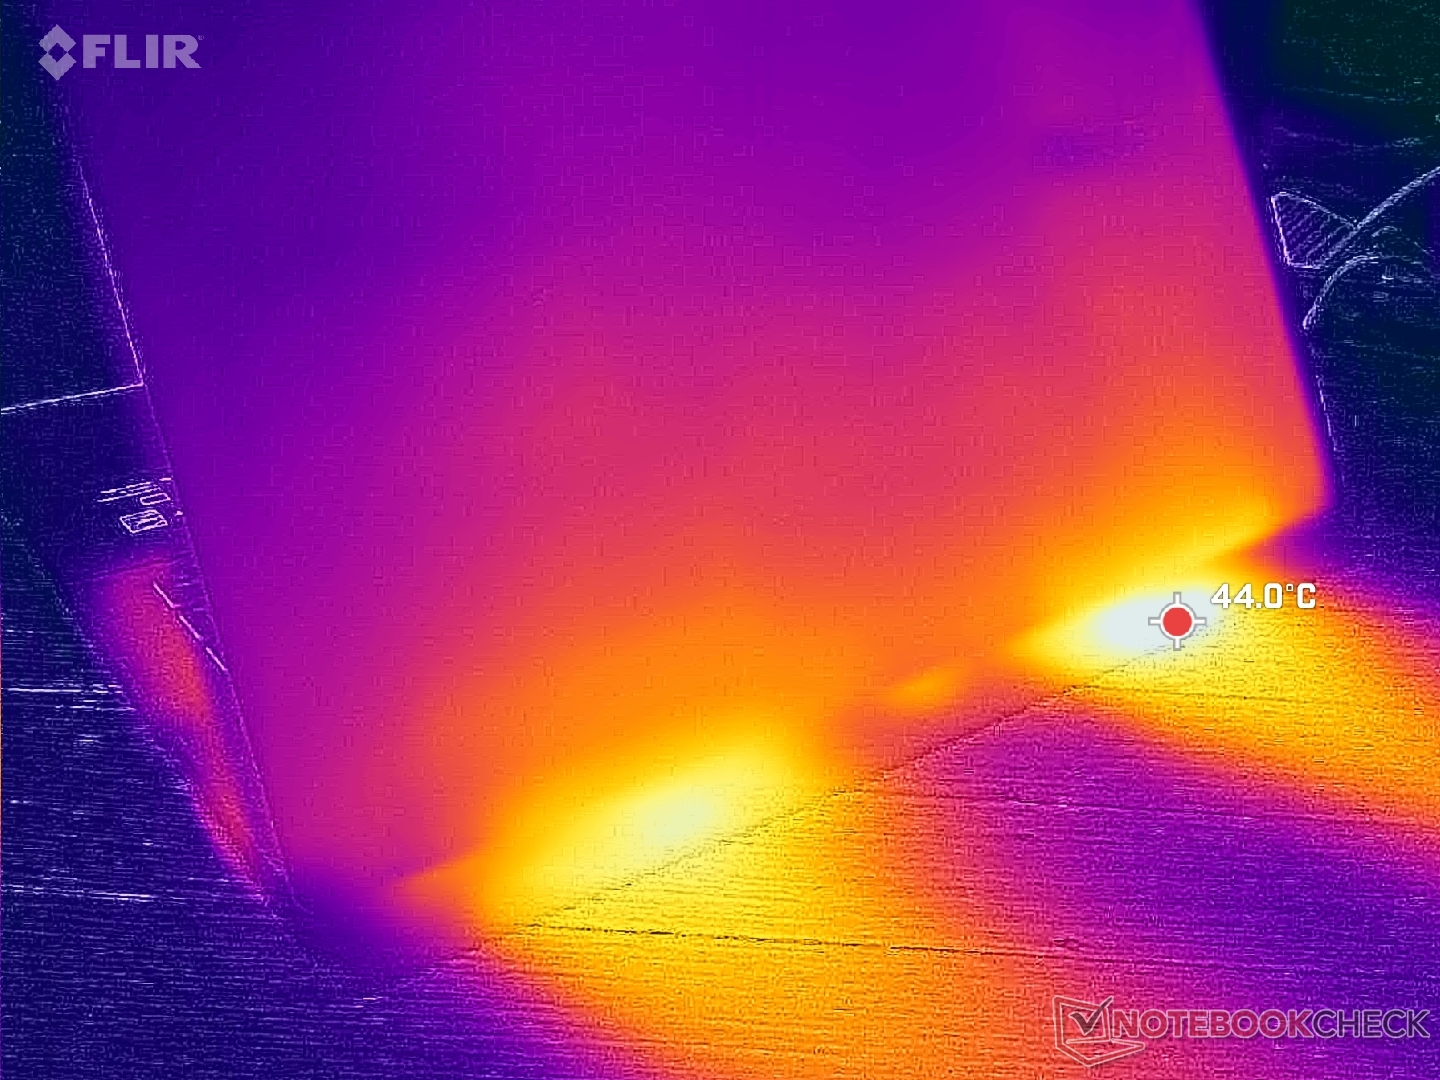
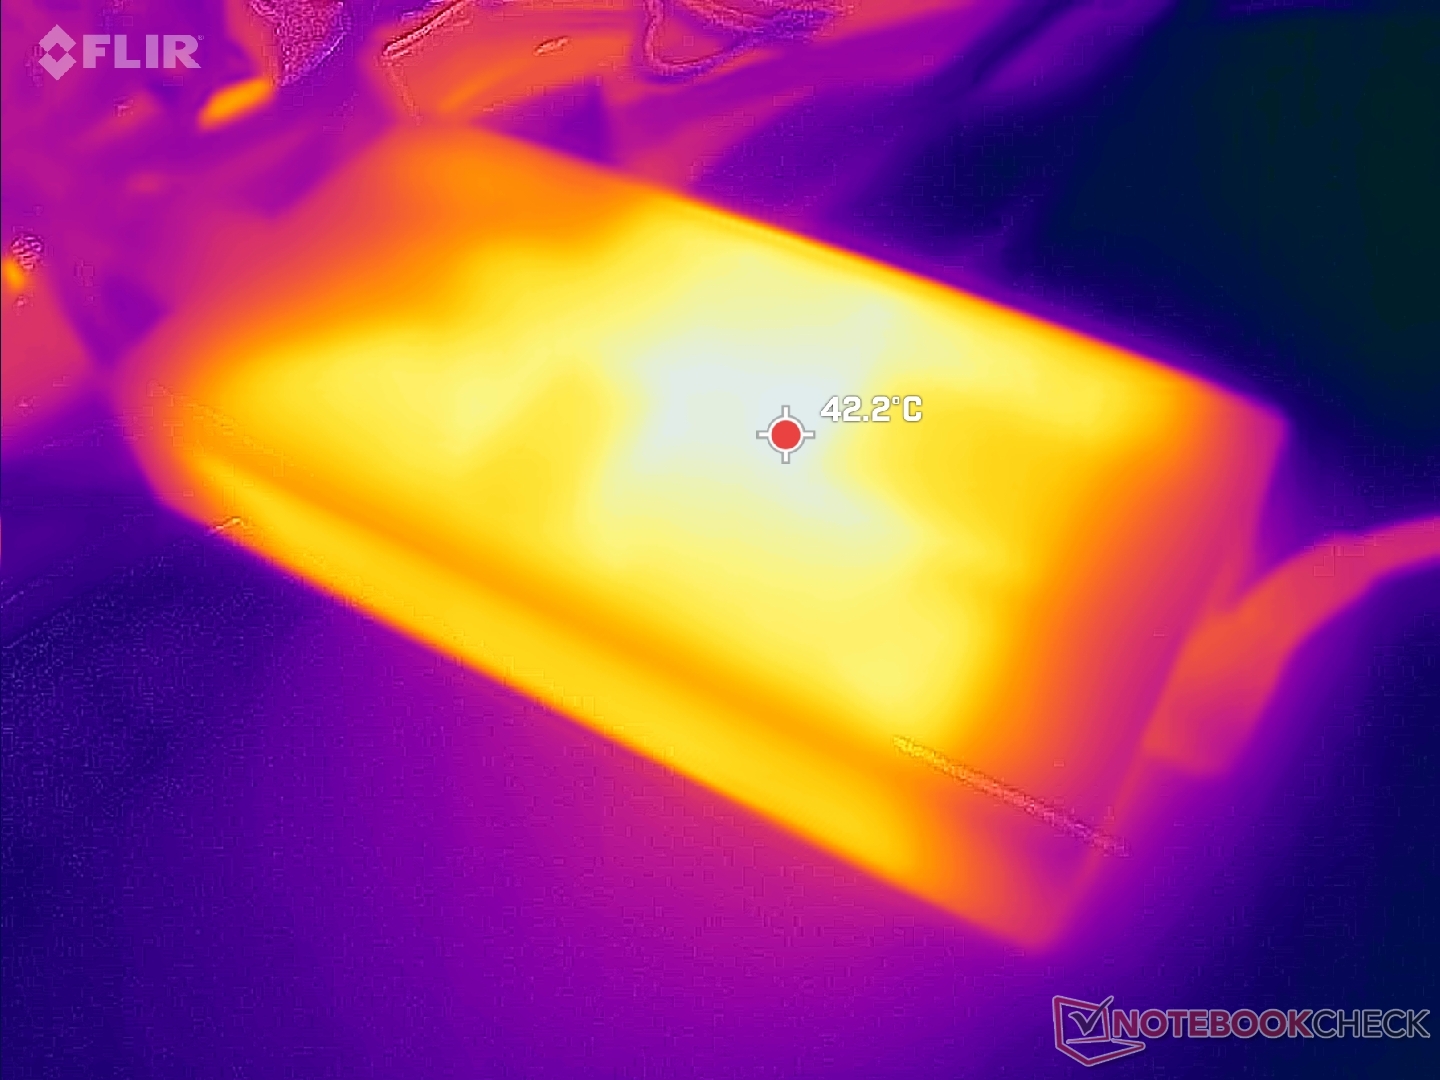
(±) Maksymalna temperatura w górnej części wynosi 41.2 °C / 106 F, w porównaniu do średniej 36.9 °C / 98 F , począwszy od 21.1 do 71 °C dla klasy Multimedia.
(+) Dno nagrzewa się maksymalnie do 34.4 °C / 94 F, w porównaniu do średniej 39.2 °C / 103 F
(+) W stanie bezczynności średnia temperatura górnej części wynosi 24.6 °C / 76 F, w porównaniu ze średnią temperaturą urządzenia wynoszącą 31.3 °C / ### class_avg_f### F.
(+) 3: The average temperature for the upper side is 31.2 °C / 88 F, compared to the average of 31.3 °C / 88 F for the class Multimedia.
(+) Podpórki pod nadgarstki i touchpad są chłodniejsze niż temperatura skóry i maksymalnie 21.8 °C / 71.2 F i dlatego są chłodne w dotyku.
(+) Średnia temperatura obszaru podparcia dłoni w podobnych urządzeniach wynosiła 28.8 °C / 83.8 F (+7 °C / 12.6 F).
| Asus V16 V3607V Intel Core 7 240H, NVIDIA GeForce RTX 3050 6GB Laptop GPU | Asus VivoBook Pro 16 K6602VU Intel Core i9-13900H, NVIDIA GeForce RTX 4050 Laptop GPU | Dell Inspiron 16 Plus 7640 Intel Core Ultra 7 155H, NVIDIA GeForce RTX 4060 Laptop GPU | Lenovo ThinkBook 16 G7 IML Intel Core Ultra 5 125U, Intel Graphics 4-Core iGPU (Arc) | HP Pavilion Plus 16-ab0456tx Intel Core i7-13700H, NVIDIA GeForce RTX 3050 6GB Laptop GPU | Acer Swift Edge 16 SFE16-44-R0XV AMD Ryzen 5 8640U, AMD Radeon 760M | |
|---|---|---|---|---|---|---|
| Heat | -30% | -13% | 7% | -28% | -24% | |
| Maximum Upper Side * | 41.2 | 42.6 -3% | 43.4 -5% | 33.2 19% | 49.6 -20% | 48 -17% |
| Maximum Bottom * | 34.4 | 48.4 -41% | 41.6 -21% | 41.2 -20% | 45.8 -33% | 60 -74% |
| Idle Upper Side * | 28.8 | 39.4 -37% | 32.8 -14% | 23.4 19% | 39.2 -36% | 28 3% |
| Idle Bottom * | 29 | 39.8 -37% | 32.4 -12% | 26.6 8% | 35.4 -22% | 31 -7% |
* ... im mniej tym lepiej
Głośniki
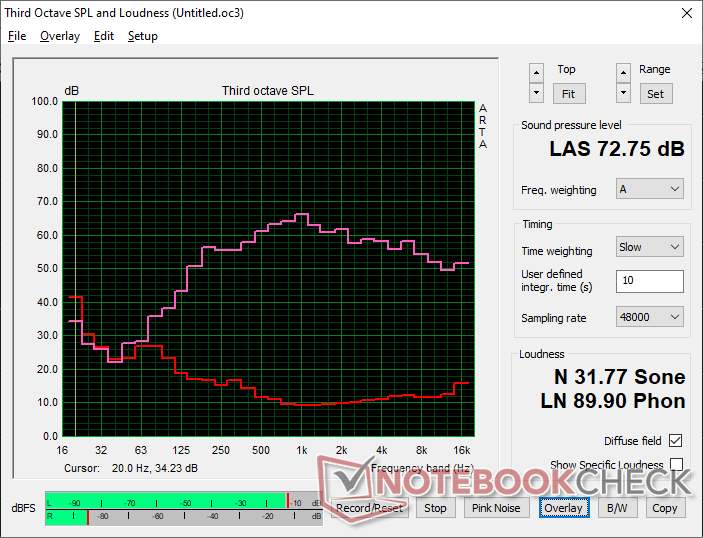
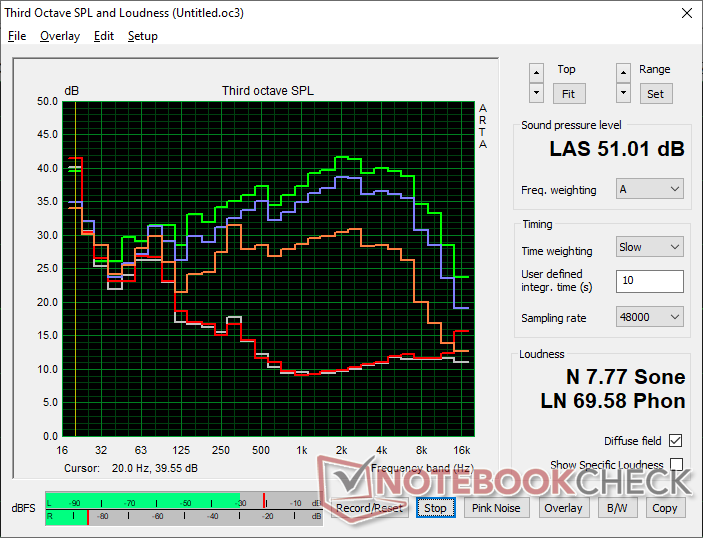
Asus V16 V3607V analiza dźwięku
(±) | głośność głośnika jest średnia, ale dobra (72.8 dB)
Bas 100 - 315 Hz
(±) | zredukowany bas - średnio 7.7% niższy od mediany
(±) | liniowość basu jest średnia (7.8% delta do poprzedniej częstotliwości)
Średnie 400 - 2000 Hz
(+) | zbalansowane środki średnie - tylko 4.7% od mediany
(+) | średnie są liniowe (4.8% delta do poprzedniej częstotliwości)
Wysokie 2–16 kHz
(+) | zrównoważone maksima - tylko 1.9% od mediany
(+) | wzloty są liniowe (5.3% delta do poprzedniej częstotliwości)
Ogólnie 100 - 16.000 Hz
(+) | ogólny dźwięk jest liniowy (13.2% różnicy w stosunku do mediany)
W porównaniu do tej samej klasy
» 23% wszystkich testowanych urządzeń w tej klasie było lepszych, 5% podobnych, 72% gorszych
» Najlepszy miał deltę 5%, średnia wynosiła ###średnia###%, najgorsza wynosiła 45%
W porównaniu do wszystkich testowanych urządzeń
» 12% wszystkich testowanych urządzeń było lepszych, 3% podobnych, 85% gorszych
» Najlepszy miał deltę 4%, średnia wynosiła ###średnia###%, najgorsza wynosiła 134%
Apple MacBook Pro 16 2021 M1 Pro analiza dźwięku
(+) | głośniki mogą odtwarzać stosunkowo głośno (84.7 dB)
Bas 100 - 315 Hz
(+) | dobry bas - tylko 3.8% od mediany
(+) | bas jest liniowy (5.2% delta do poprzedniej częstotliwości)
Średnie 400 - 2000 Hz
(+) | zbalansowane środki średnie - tylko 1.3% od mediany
(+) | średnie są liniowe (2.1% delta do poprzedniej częstotliwości)
Wysokie 2–16 kHz
(+) | zrównoważone maksima - tylko 1.9% od mediany
(+) | wzloty są liniowe (2.7% delta do poprzedniej częstotliwości)
Ogólnie 100 - 16.000 Hz
(+) | ogólny dźwięk jest liniowy (4.6% różnicy w stosunku do mediany)
W porównaniu do tej samej klasy
» 0% wszystkich testowanych urządzeń w tej klasie było lepszych, 0% podobnych, 100% gorszych
» Najlepszy miał deltę 5%, średnia wynosiła ###średnia###%, najgorsza wynosiła 45%
W porównaniu do wszystkich testowanych urządzeń
» 0% wszystkich testowanych urządzeń było lepszych, 0% podobnych, 100% gorszych
» Najlepszy miał deltę 4%, średnia wynosiła ###średnia###%, najgorsza wynosiła 134%
Zarządzanie energią
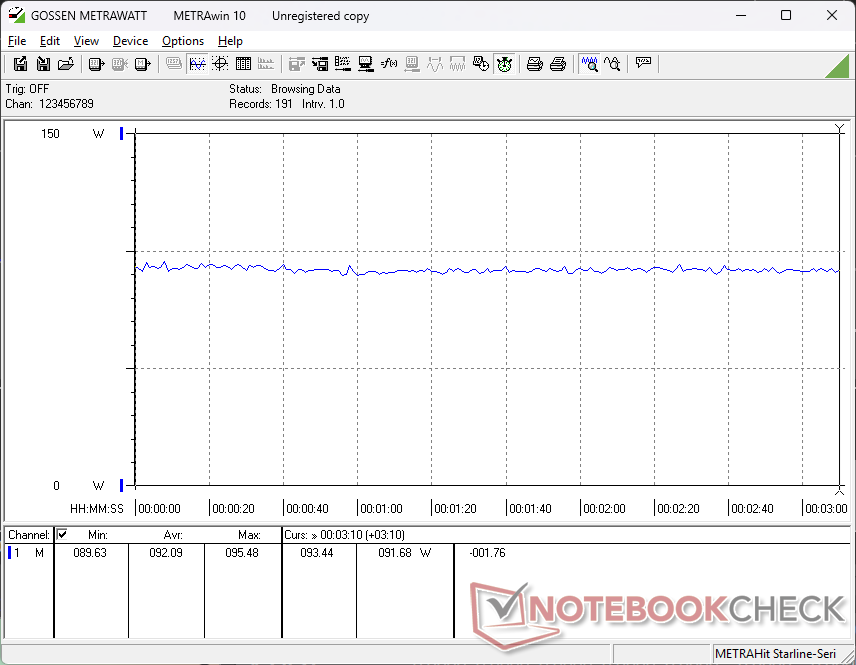
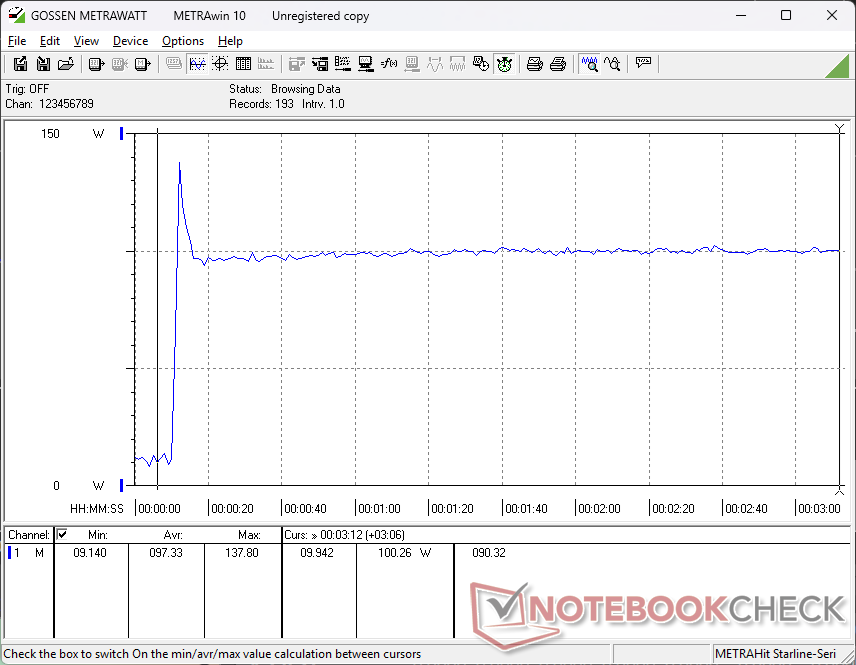
Zużycie energii
Praca na biegu jałowym może wahać się od zaledwie 2 W przy wyłączonym dGPU lub do 11 W przy włączonym dGPU i ustawieniu maksymalnej jasności. Zużycie energii ulega gwałtownym wahaniom podczas obciążania Prime95 ze względu na wspomniane powyżej ograniczanie wydajności.
| wyłączony / stan wstrzymania | |
| luz | |
| obciążenie |
|
Legenda:
min: | |
| Asus V16 V3607V Core 7 240H, GeForce RTX 3050 6GB Laptop GPU, , IPS, 1920x1200, 16" | Asus VivoBook Pro 16 K6602VU i9-13900H, NVIDIA GeForce RTX 4050 Laptop GPU, Micron 2400 MTFDKBA1T0QFM, OLED, 3200x2000, 16" | Dell Inspiron 16 Plus 7640 Ultra 7 155H, NVIDIA GeForce RTX 4060 Laptop GPU, SK hynix BC901 HFS001TEJ4X164N, IPS, 2560x1600, 16" | Lenovo ThinkBook 16 G7 IML Ultra 5 125U, Graphics 4-Core, SK hynix HFS512GEJ4X112N, IPS, 1920x1200, 16" | HP Pavilion Plus 16-ab0456tx i7-13700H, GeForce RTX 3050 6GB Laptop GPU, WDC PC SN810 1TB, IPS, 2560x1600, 16" | Acer Swift Edge 16 SFE16-44-R0XV R5 8640U, Radeon 760M, Micron 3400 MTFDKBA512TFH 512GB, OLED, 3200x2000, 16" | |
|---|---|---|---|---|---|---|
| Power Consumption | -247% | -22% | 18% | -13% | -19% | |
| Idle Minimum * | 2.1 | 21.06 -903% | 4.2 -100% | 4.3 -105% | 3.3 -57% | 8 -281% |
| Idle Average * | 7.2 | 24.27 -237% | 6.9 4% | 8.9 -24% | 7.3 -1% | 10 -39% |
| Idle Maximum * | 10.7 | 25.12 -135% | 15.2 -42% | 9.1 15% | 14.24 -33% | 15 -40% |
| Load Average * | 99.4 | 52.4 47% | 70.4 29% | 31.7 68% | 91.7 8% | 42 58% |
| Cyberpunk 2077 ultra external monitor * | 88.7 | 35.2 60% | 42.8 52% | |||
| Cyberpunk 2077 ultra * | 92.1 | 39.4 57% | 44.4 52% | |||
| Load Maximum * | 137.8 | 146 -6% | 137.4 -0% | 66.7 52% | 115.8 16% | 49 64% |
| Witcher 3 ultra * | 110.2 | 115.9 | 96.2 |
* ... im mniej tym lepiej
Power Consumption Cyberpunk / Stress Test
Power Consumption external Monitor
Żywotność baterii
Czas działania WLAN jest przyzwoity i wynosi prawie 9 godzin przeglądania w świecie rzeczywistym, pomimo średniej wielkości baterii 63 Wh. Test został przeprowadzony przy nieaktywnym dGPU i w trybie Eco/Balanced.
| Asus V16 V3607V Core 7 240H, GeForce RTX 3050 6GB Laptop GPU, 63 Wh | Asus VivoBook Pro 16 K6602VU i9-13900H, NVIDIA GeForce RTX 4050 Laptop GPU, 96 Wh | Dell Inspiron 16 Plus 7640 Ultra 7 155H, NVIDIA GeForce RTX 4060 Laptop GPU, 90 Wh | Lenovo ThinkBook 16 G7 IML Ultra 5 125U, Graphics 4-Core, 45 Wh | HP Pavilion Plus 16-ab0456tx i7-13700H, GeForce RTX 3050 6GB Laptop GPU, 68 Wh | Acer Swift Edge 16 SFE16-44-R0XV R5 8640U, Radeon 760M, 54 Wh | |
|---|---|---|---|---|---|---|
| Czasy pracy | 12% | 48% | -2% | 16% | -46% | |
| WiFi v1.3 | 539 | 606 12% | 799 48% | 528 -2% | 624 16% | 290 -46% |
| H.264 | 585 | 720 | ||||
| Reader / Idle | 1150 | |||||
| Load | 79 |
Ocena Notebookcheck
Asus V16 V3607V
- 19/03/2025 v8
Allen Ngo
 Total Sustainability Score:
 Potential Competitors in Comparison
Obraz | Model / recenzja | Cena | Waga | Wysokość | Ekran |
|---|---|---|---|---|---|
1. 78.5%  | Asus V16 V3607V Intel Core 7 240H ⎘ NVIDIA GeForce RTX 3050 6GB Laptop GPU ⎘ 16 GB Pamięć | Amazon: 1. $30.83 wangpeng New CPU Cooling Fan... 2. $99.99 180W 150W Charger for Asus V... 3. $30.83 wangpeng New GPU Cooling Fan... Cena katalogowa: 900 USD | 2 kg | 22 mm | 16.00" 1920x1200 142 PPI IPS |
2. 87.6% v7 (old)  | Asus VivoBook Pro 16 K6602VU Intel Core i9-13900H ⎘ NVIDIA GeForce RTX 4050 Laptop GPU ⎘ 16 GB Pamięć, 1024 GB SSD | Amazon: 1. $133.34 A-Tech 32GB RAM for ASUS Viv... 2. $38.99 JUYOON 20V 7.5A Charger for ... 3. $2,199.99 ASUS Vivobook Pro 16X Laptop... Cena katalogowa: 2199 EUR | 1.9 kg | 19 mm | 16.00" 3200x2000 236 PPI OLED |
3. 83.4%  | Dell Inspiron 16 Plus 7640 Intel Core Ultra 7 155H ⎘ NVIDIA GeForce RTX 4060 Laptop GPU ⎘ 16 GB Pamięć, 1024 GB SSD | Amazon: $1,699.00 Cena katalogowa: 1300 USD | 2.2 kg | 19.9 mm | 16.00" 2560x1600 189 PPI IPS |
4. 83%  | Lenovo ThinkBook 16 G7 IML Intel Core Ultra 5 125U ⎘ Intel Graphics 4-Core iGPU (Arc) ⎘ 16 GB Pamięć, 512 GB SSD | Amazon: $650.00 Cena katalogowa: 750 USD | 1.8 kg | 17.5 mm | 16.00" 1920x1200 142 PPI IPS |
5. 88.7% v7 (old)  | HP Pavilion Plus 16-ab0456tx Intel Core i7-13700H ⎘ NVIDIA GeForce RTX 3050 6GB Laptop GPU ⎘ 16 GB Pamięć, 1024 GB SSD | Amazon: 1. $24.95 mCover Case ONLY Compatible ... 2. $55.00 Laptop LCD Bezel for HP Pavi... 3. $799.99 HP Pavilion Plus 16 inch Lap... Cena katalogowa: 1350 USD | 1.9 kg | 19.9 mm | 16.00" 2560x1600 189 PPI IPS |
6. 81.3%  | Acer Swift Edge 16 SFE16-44-R0XV AMD Ryzen 5 8640U ⎘ AMD Radeon 760M ⎘ 16 GB Pamięć, 512 GB SSD | Cena katalogowa: 1000 EUR | 1.2 kg | 13 mm | 16.00" 3200x2000 236 PPI OLED |
Przezroczystość
Wyboru urządzeń do recenzji dokonuje nasza redakcja. Próbka testowa została udostępniona autorowi jako pożyczka od producenta lub sprzedawcy detalicznego na potrzeby tej recenzji. Pożyczkodawca nie miał wpływu na tę recenzję, producent nie otrzymał też kopii tej recenzji przed publikacją. Nie było obowiązku publikowania tej recenzji. Nigdy nie przyjmujemy rekompensaty ani płatności w zamian za nasze recenzje. Jako niezależna firma medialna, Notebookcheck nie podlega władzy producentów, sprzedawców detalicznych ani wydawców.
Tak testuje Notebookcheck
Każdego roku Notebookcheck niezależnie sprawdza setki laptopów i smartfonów, stosując standardowe procedury, aby zapewnić porównywalność wszystkich wyników. Od około 20 lat stale rozwijamy nasze metody badawcze, ustanawiając przy tym standardy branżowe. W naszych laboratoriach testowych doświadczeni technicy i redaktorzy korzystają z wysokiej jakości sprzętu pomiarowego. Testy te obejmują wieloetapowy proces walidacji. Nasz kompleksowy system ocen opiera się na setkach uzasadnionych pomiarów i benchmarków, co pozwala zachować obiektywizm.
