

Recenzja laptopa Maingear ML-16 MK2: GeForce Wydajność RTX 4070 za przyzwoitą cenę

Podobnie jak Schenker czy Eurocom, Maingear jest sprzedawcą wysokowydajnych laptopów typu white label, zaprojektowanych z myślą o graczach i profesjonalistach. Podejście to kontrastuje z bardziej znanymi producentami komputerów PC, takimi jak Dell, Lenovo czy HP, którzy projektują swoje laptopy we własnym zakresie. Najnowszym modelem od Maingear jest ML-16 MK2 wyposażony w najnowszy procesor Intel Meteor Lake i kartę graficzną Nvidia.
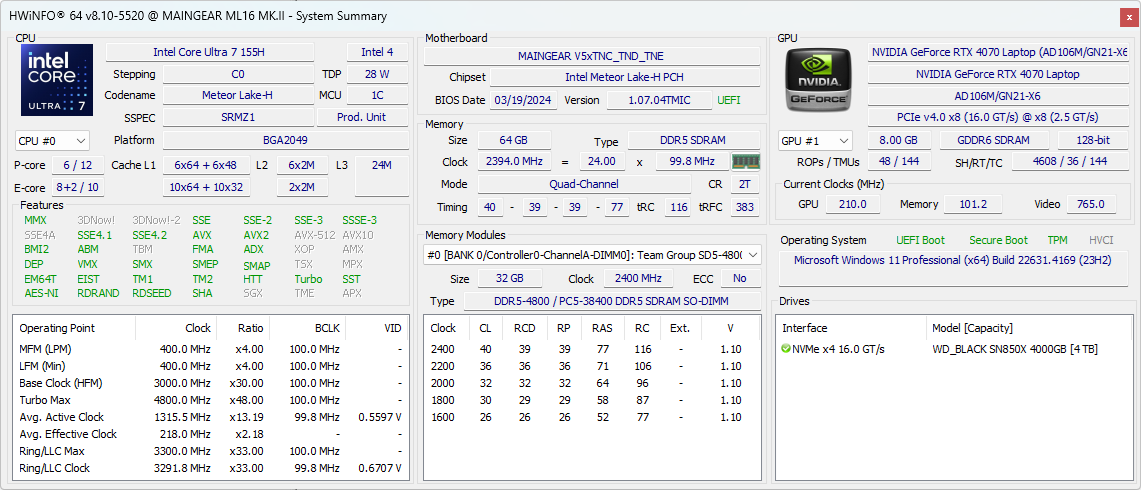
Nasza jednostka testowa została w pełni skonfigurowana z Core Ultra 7 155H, 105 W GeForce RTX 4070 i wyświetlaczem IPS 240 Hz 1600p za około 2000 USD. Mniejsze jednostki SKU są dostarczane z RTX 4060, ale procesor i wyświetlacz pozostają stałe.
Konkurentami ML-16 MK2 są inne ultracienkie 16-calowe laptopy do gier, takie jak Razer Blade 16, Alienware x16 R2, Asus ROG Zephyrus G16lub Lenovo Legion Pro 7 16.
Więcej recenzji Maingear:
Potencjalni konkurenci w porównaniu
Ocena | Wersja | Data | Model | Waga | Wysokość | Rozmiar | Rezolucja | Cena |
|---|---|---|---|---|---|---|---|---|
| 80.9 % | v8 | 09/2024 | Maingear ML-16 MK2 Ultra 7 155H, NVIDIA GeForce RTX 4070 Laptop GPU | 2.1 kg | 19.9 mm | 16.00" | 2560x1600 | |
| 85.9 % | v8 | 08/2024 | Asus ROG Zephyrus G16 GA605WV Ryzen AI 9 HX 370, NVIDIA GeForce RTX 4060 Laptop GPU | 1.8 kg | 17.2 mm | 16.00" | 2560x1600 | |
| 84.3 % v7 (old) | v7 (old) | 05/2024 | HP Victus 16 (2024) i7-14700HX, NVIDIA GeForce RTX 4060 Laptop GPU | 2.4 kg | 23.9 mm | 16.10" | 1920x1080 | |
| 88.4 % v7 (old) | v7 (old) | 05/2024 | Alienware x16 R2 P120F Ultra 9 185H, NVIDIA GeForce RTX 4080 Laptop GPU | 2.7 kg | 18.57 mm | 16.00" | 2560x1600 | |
| 89.3 % v7 (old) | v7 (old) | 04/2024 | Lenovo Legion Pro 5 16IRX9 i9-14900HX, NVIDIA GeForce RTX 4070 Laptop GPU | 2.5 kg | 26.95 mm | 16.00" | 2560x1600 | |
| 91.1 % v7 (old) | v7 (old) | 02/2024 | Razer Blade 16 2024, RTX 4090 i9-14900HX, NVIDIA GeForce RTX 4090 Laptop GPU | 2.5 kg | 22 mm | 16.00" | 2560x1600 |
Uwaga: Niedawno zaktualizowaliśmy nasz system oceny i wyniki wersji 8 nie są porównywalne z wynikami wersji 7. Więcej informacji znajdą Państwo tutaj .
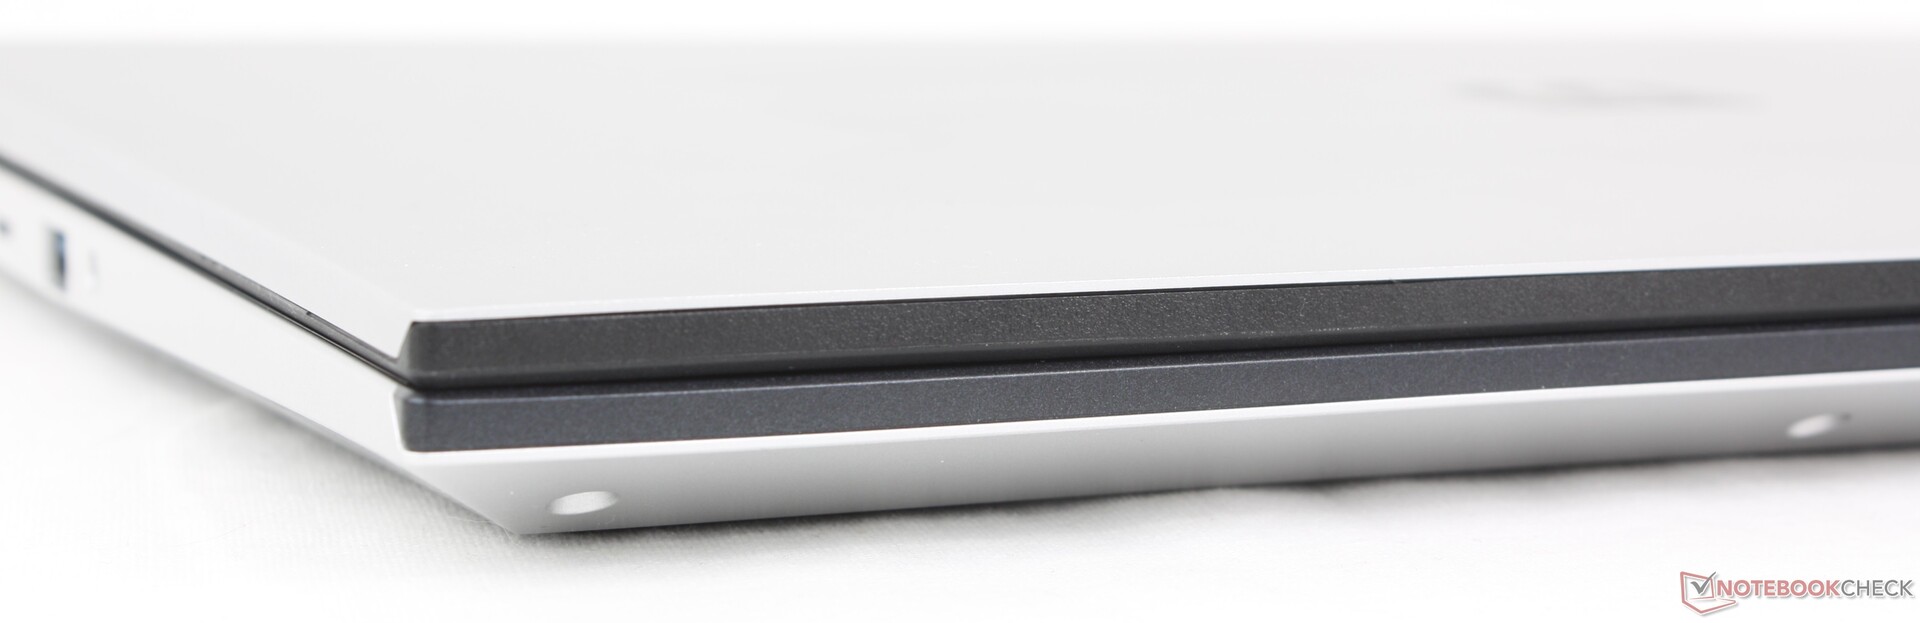
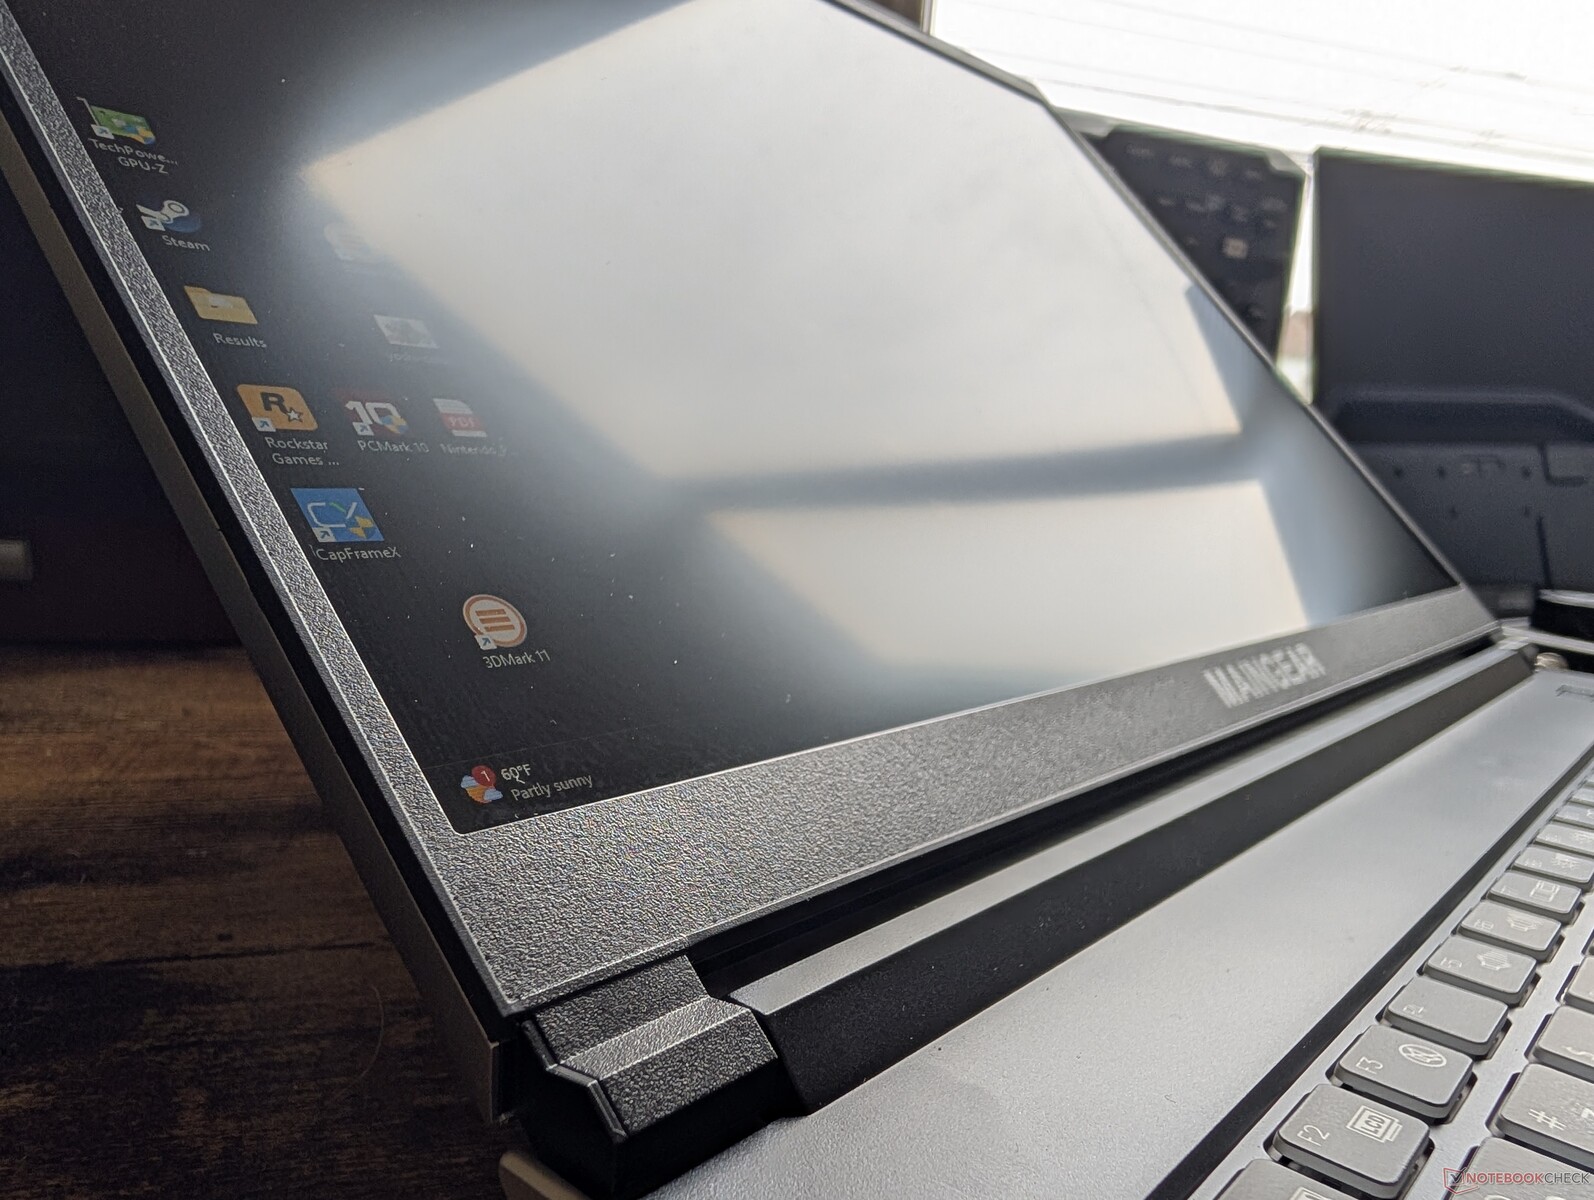
Obudowa - cienka i ostra
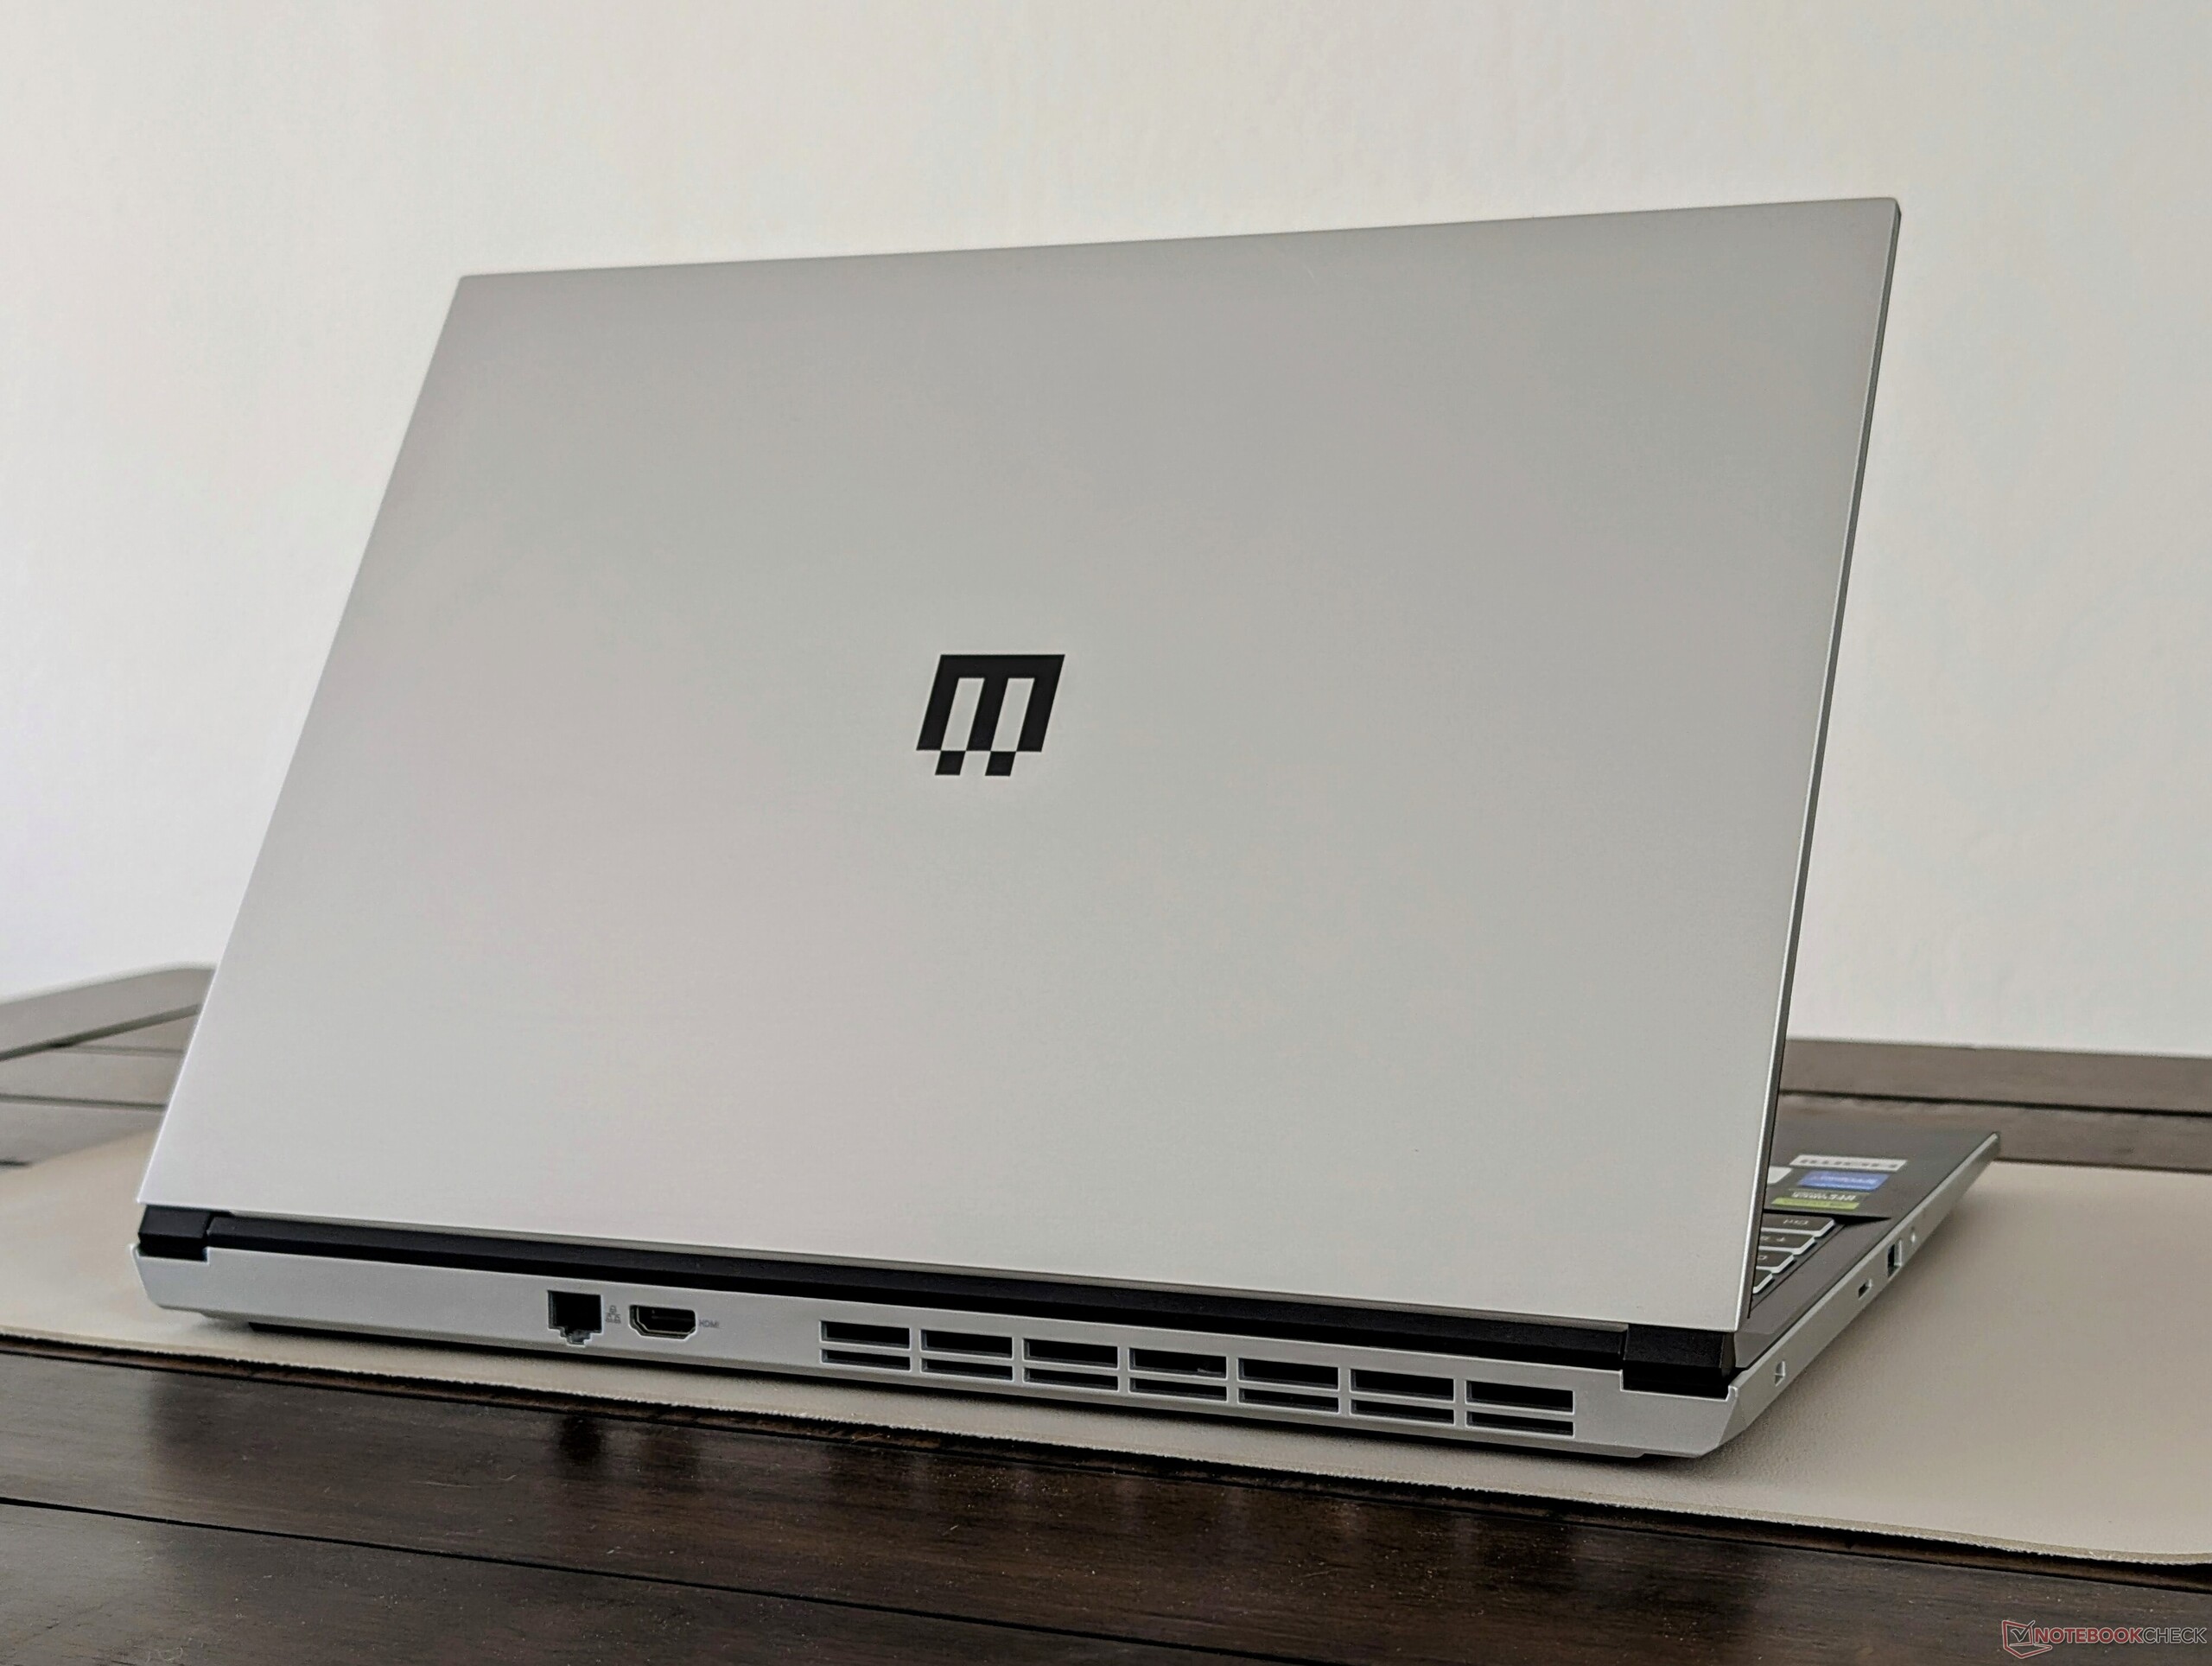
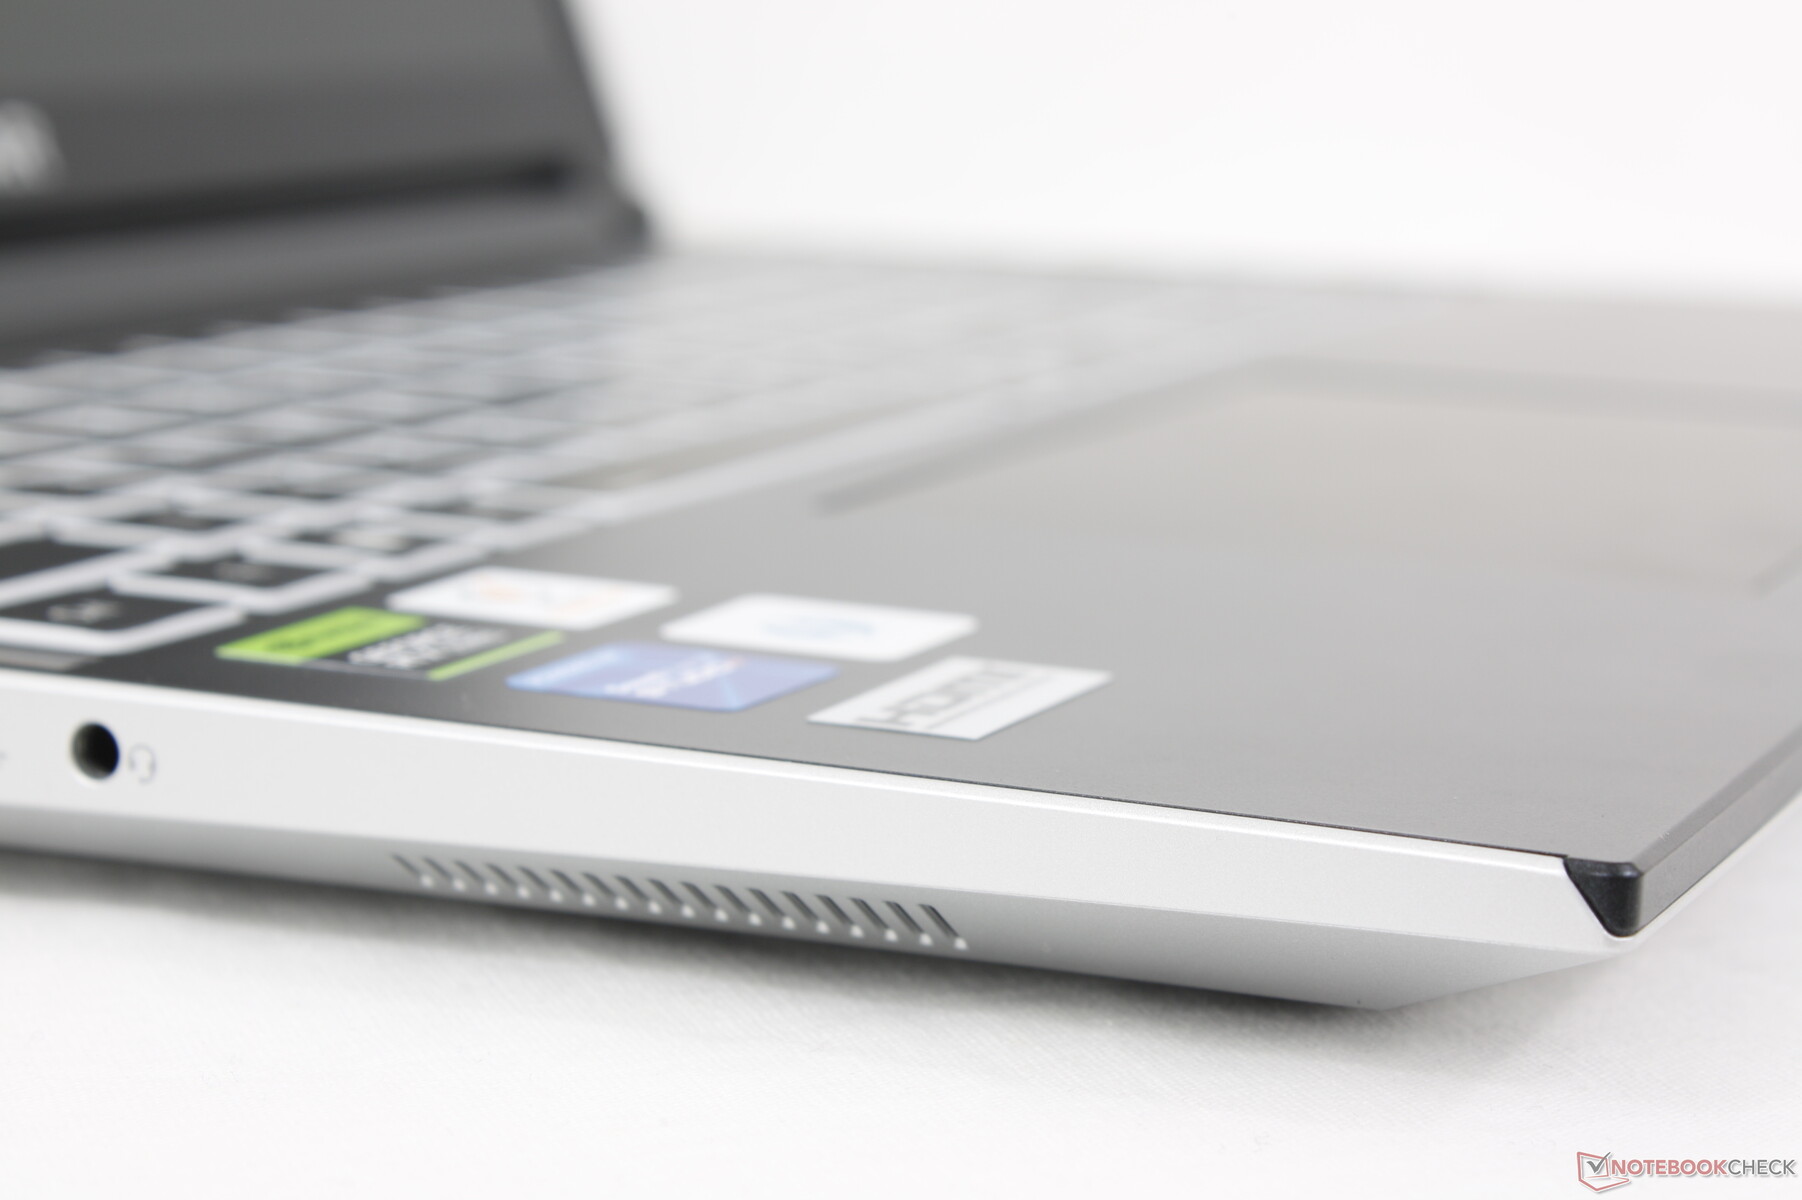
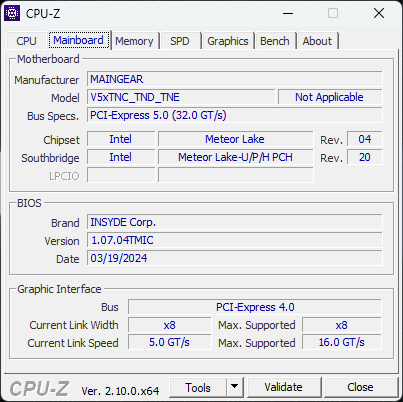
Obudowę można przypisać do Clevo (V560TNE-S) na podstawie producenta pochodzenia. Składa się ona głównie z aluminiowego metalu na zewnętrznej pokrywie i spodzie, podczas gdy czarna klawiatura jest plastikowa. Te dwa kontrastujące ze sobą kolory dobrze ze sobą współgrają, pomagając wizualnie odróżnić ten model od zwykłego, całkowicie czarnego lub matowo-białego laptopa do gier.
Jakość obudowy nie odzwierciedla jednak wysokiej ceny wywoławczej. Powierzchnie wypaczają się łatwiej i nie są tak sztywne, jak u konkurentów, takich jak Razer Blade 16 czy Alienware x16 R2. Przykładowo, naciśnięcie palcem środka klawiatury lub zewnętrznej pokrywy spowoduje zauważalne obniżenie powierzchni. Pokrywa chwieje się również łatwiej podczas regulacji kątów. Podczas obsługi ML-16 MK2 należy zachować większą ostrożność, gdyż w przeciwnym razie można uszkodzić małe zawiasy.
Waga i grubość są lżejsze i cieńsze niż u głównych konkurentów, w tym Blade 16 lub Lenovo Legion Pro 5 16IRX9. Asus ROG Zephyrus G16 jest jeszcze cieńszy i lżejszy niż nasz Maingear, ale kosztuje też setki dolarów więcej.
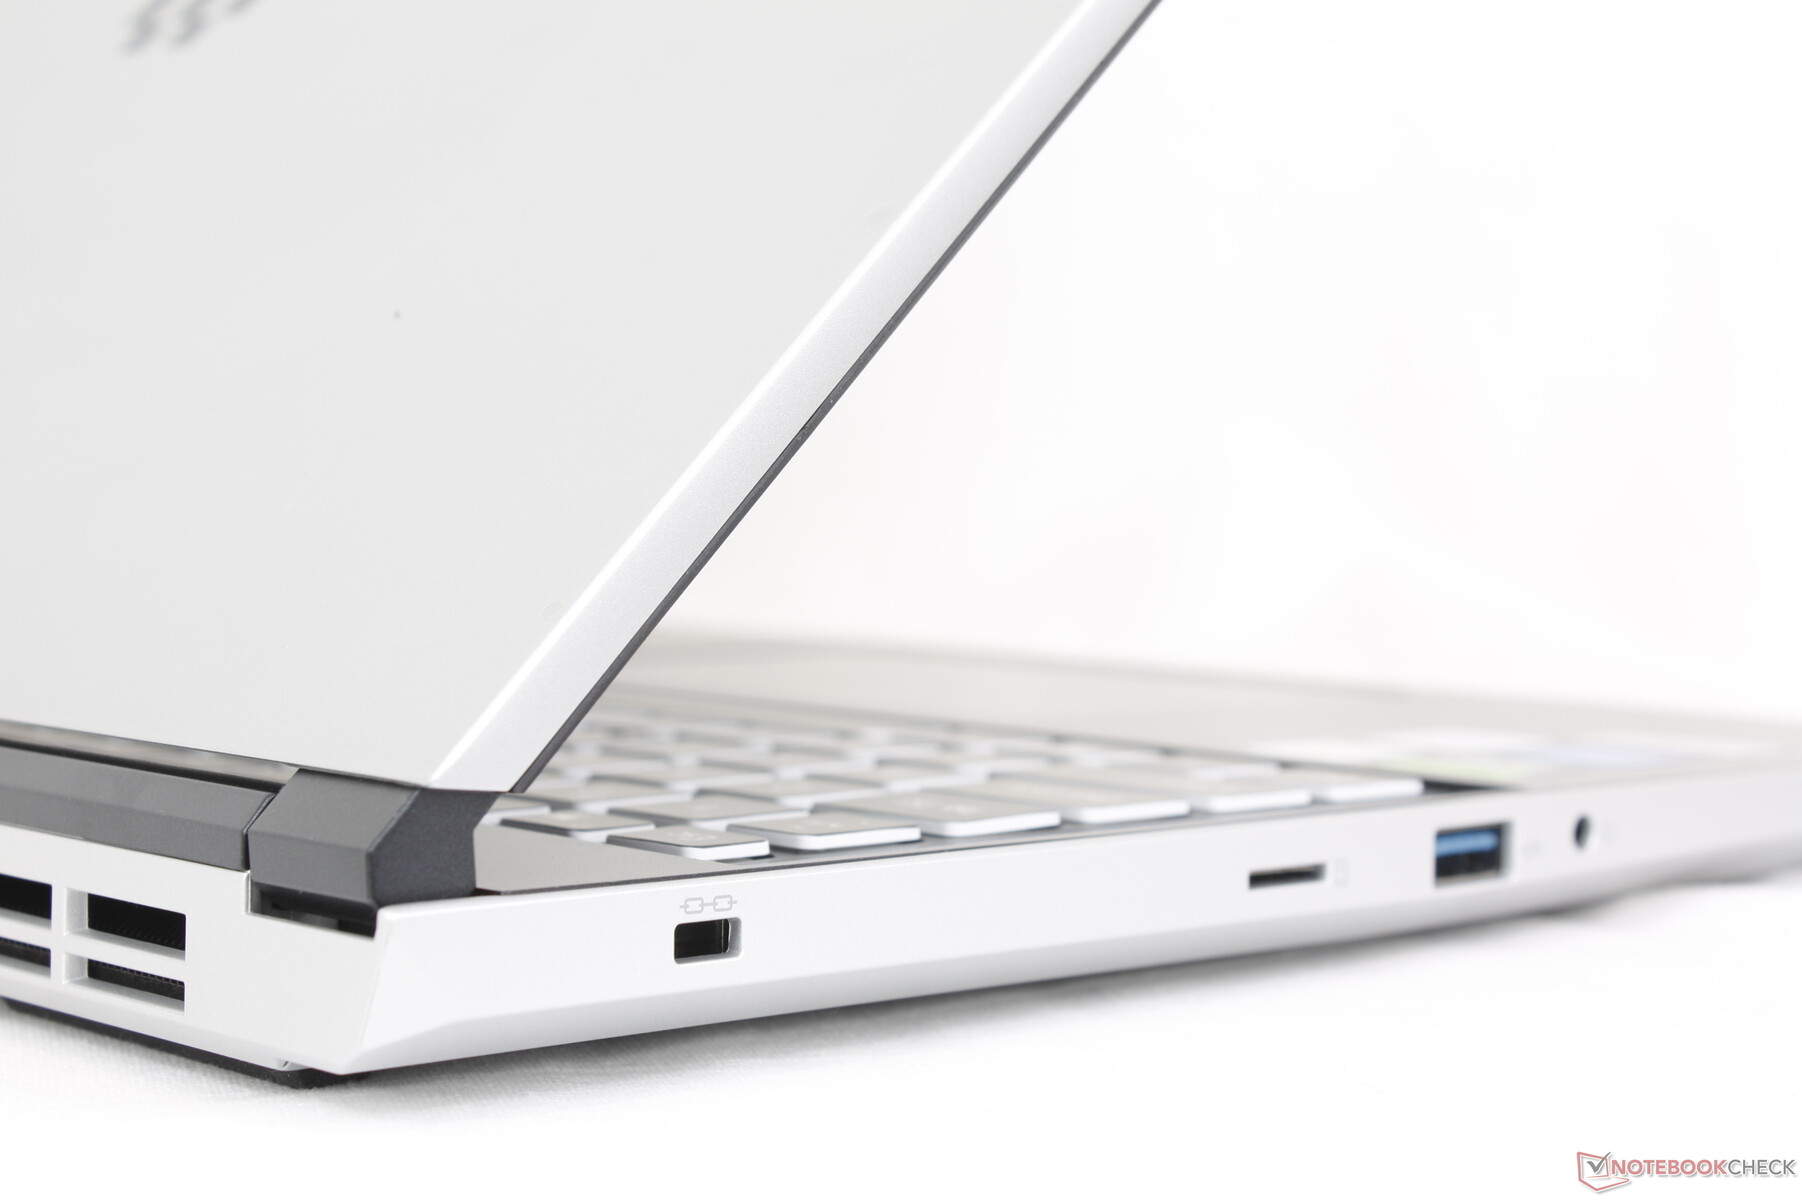
Łączność
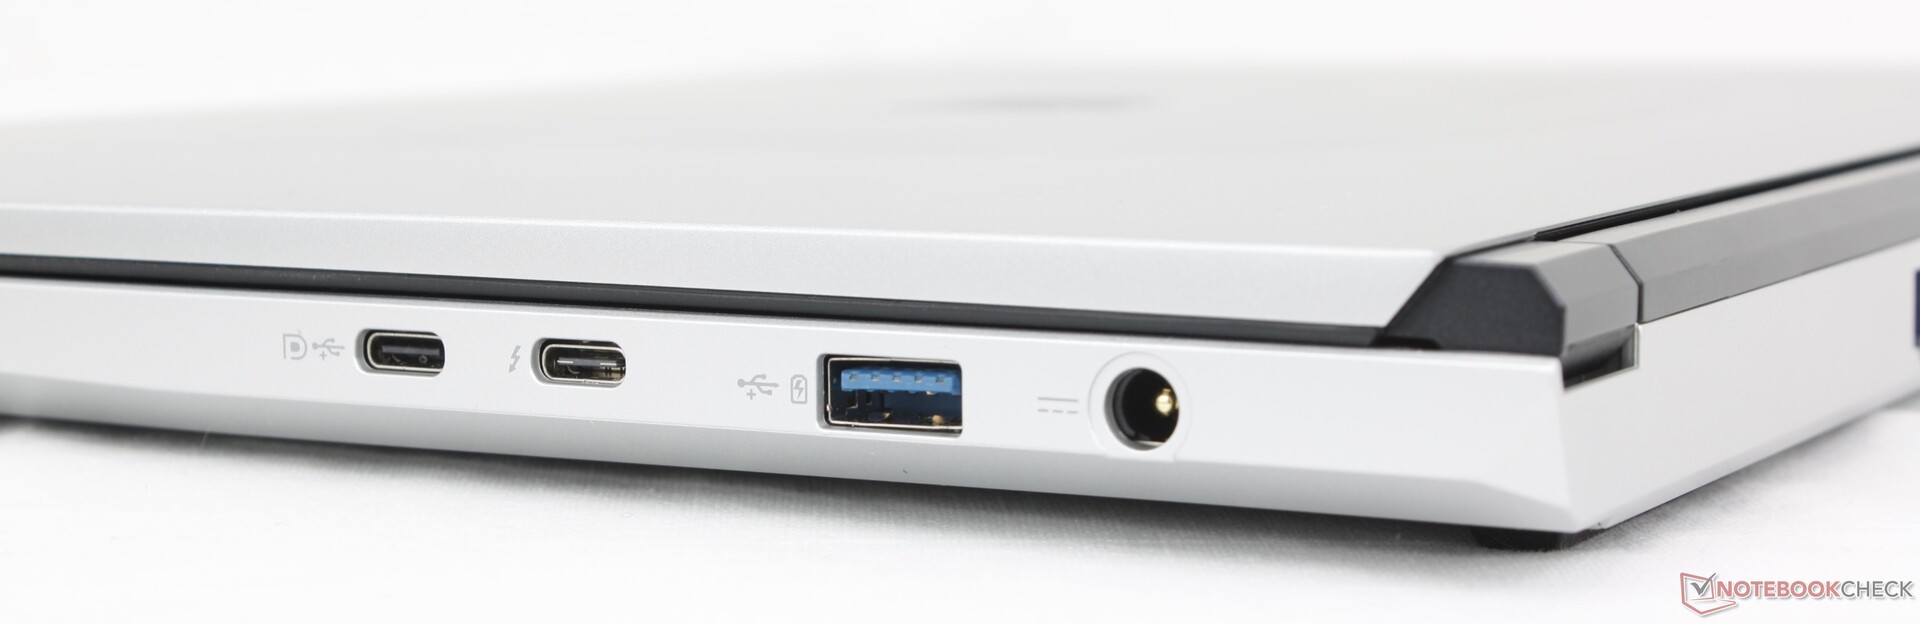
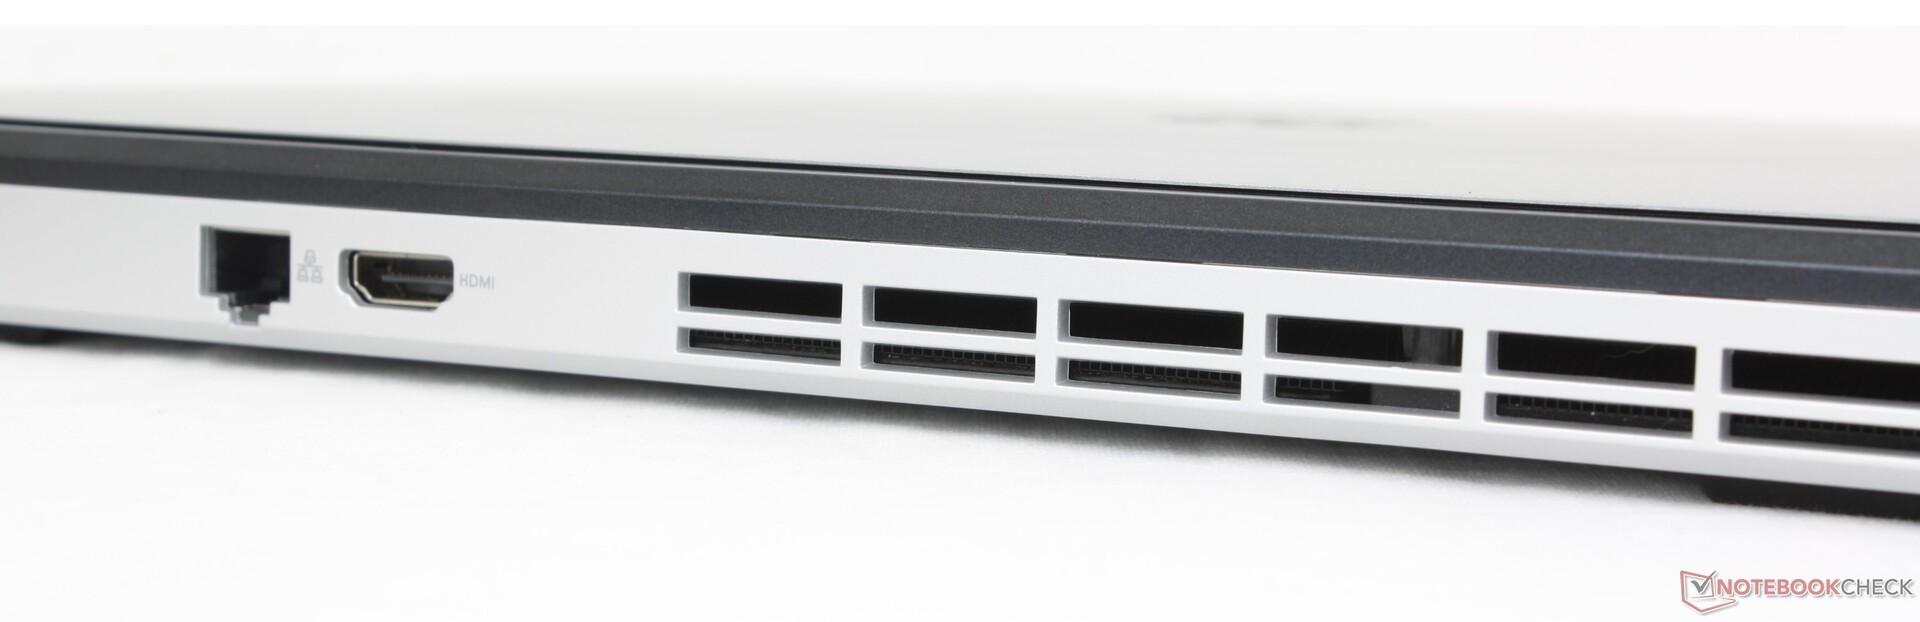
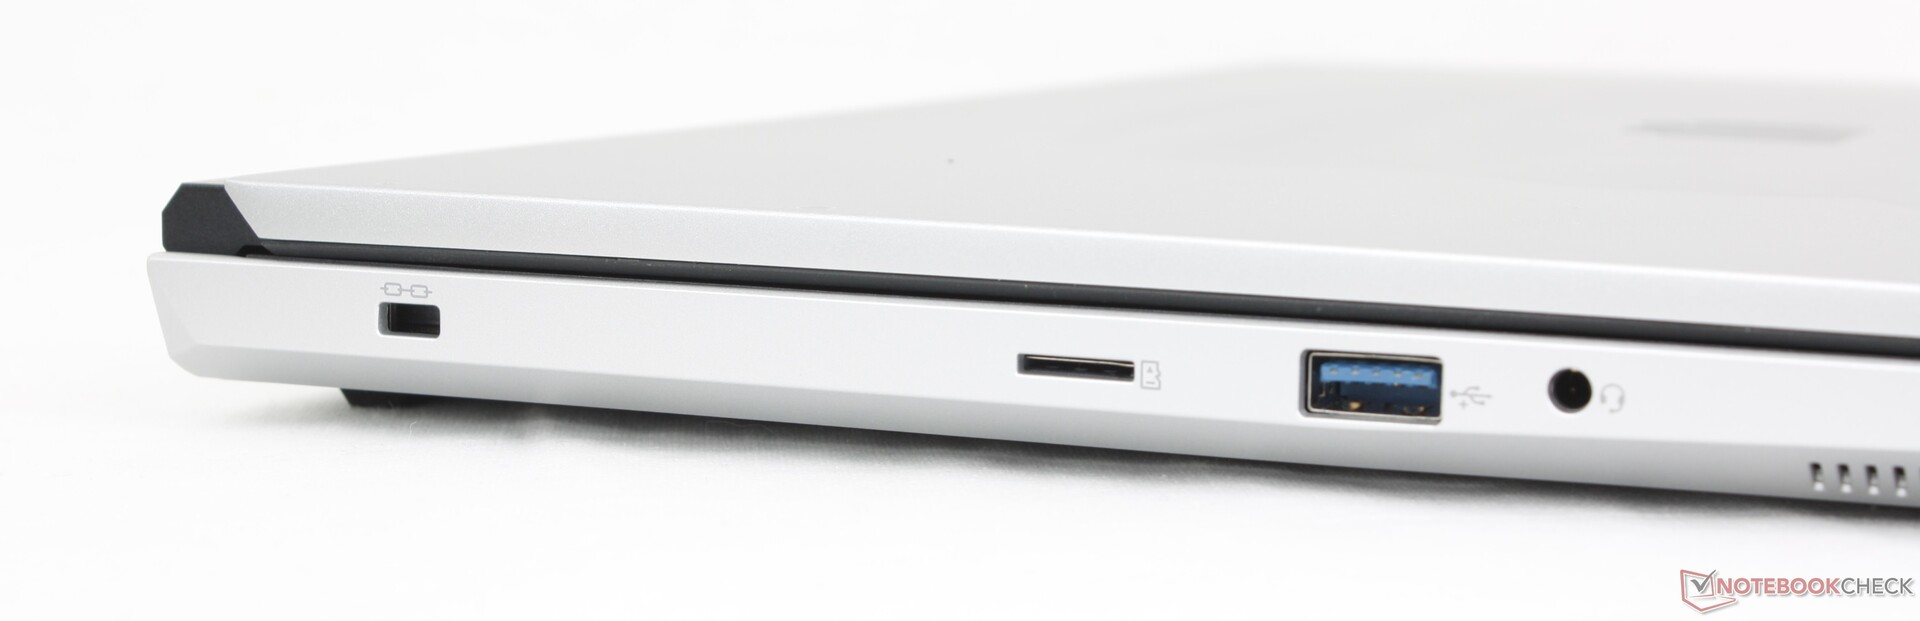
Portów jest pod dostatkiem, choć kilku brakuje. Na przykład Blade 16 zawiera więcej portów USB-A, podczas gdy Alienware x16 R2 zawiera mini-DisplayPort. Rozmieszczenie portów jest dobre i nie jest zbyt zatłoczone, w przeciwieństwie do wspomnianego wcześniej systemu Alienware.
Czytnik kart SD
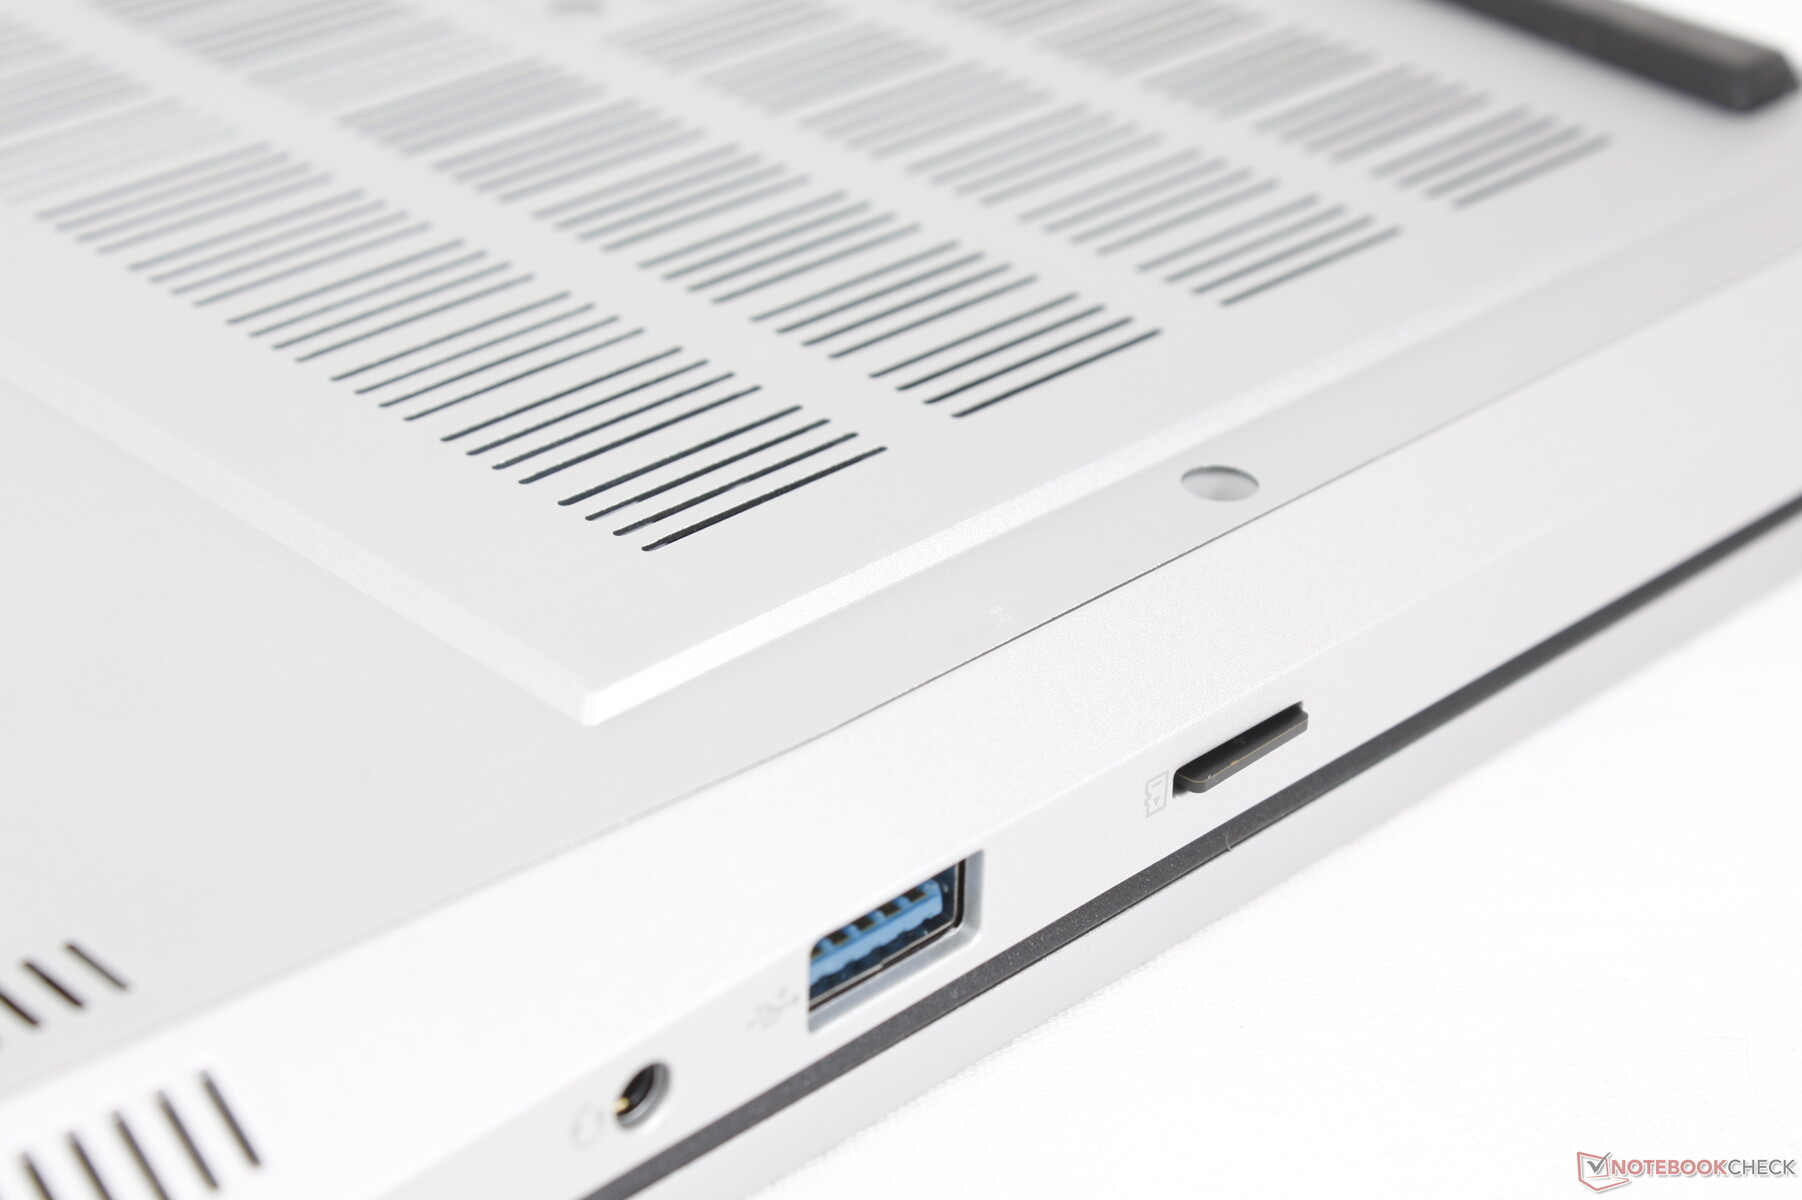
Chociaż doceniamy posiadanie małego czytnika MicroSD zamiast braku czytnika SD, ten tutaj jest powolny, szczególnie jak na 16-calowy laptop do gier. Przesłanie 1 GB zdjęć z naszej karty testowej UHS-II zajmuje około 25 sekund w porównaniu do zaledwie 6 sekund na laptopie Blade 16.
| SD Card Reader | |
| average JPG Copy Test (av. of 3 runs) | |
| Razer Blade 16 2024, RTX 4090 | |
| Alienware x16 R2 P120F (AV PRO microSD 128 GB V60) | |
| Maingear ML-16 MK2 (AV PRO microSD 128 GB V60) | |
| maximum AS SSD Seq Read Test (1GB) | |
| Alienware x16 R2 P120F (AV PRO microSD 128 GB V60) | |
| Razer Blade 16 2024, RTX 4090 | |
| Maingear ML-16 MK2 (AV PRO microSD 128 GB V60) | |
Komunikacja
Intel AX211 jest standardowo wyposażony w łączność Wi-Fi 6E i Bluetooth 5.3. Po sparowaniu z naszym routerem testowym AXE11000 doświadczyliśmy stabilnych prędkości transferu i nie napotkaliśmy żadnych problemów.
Kamera internetowa
Kamera internetowa 2 MP z podczerwienią i elektroniczną migawką jest standardem, aby być porównywalnym z rywalami.


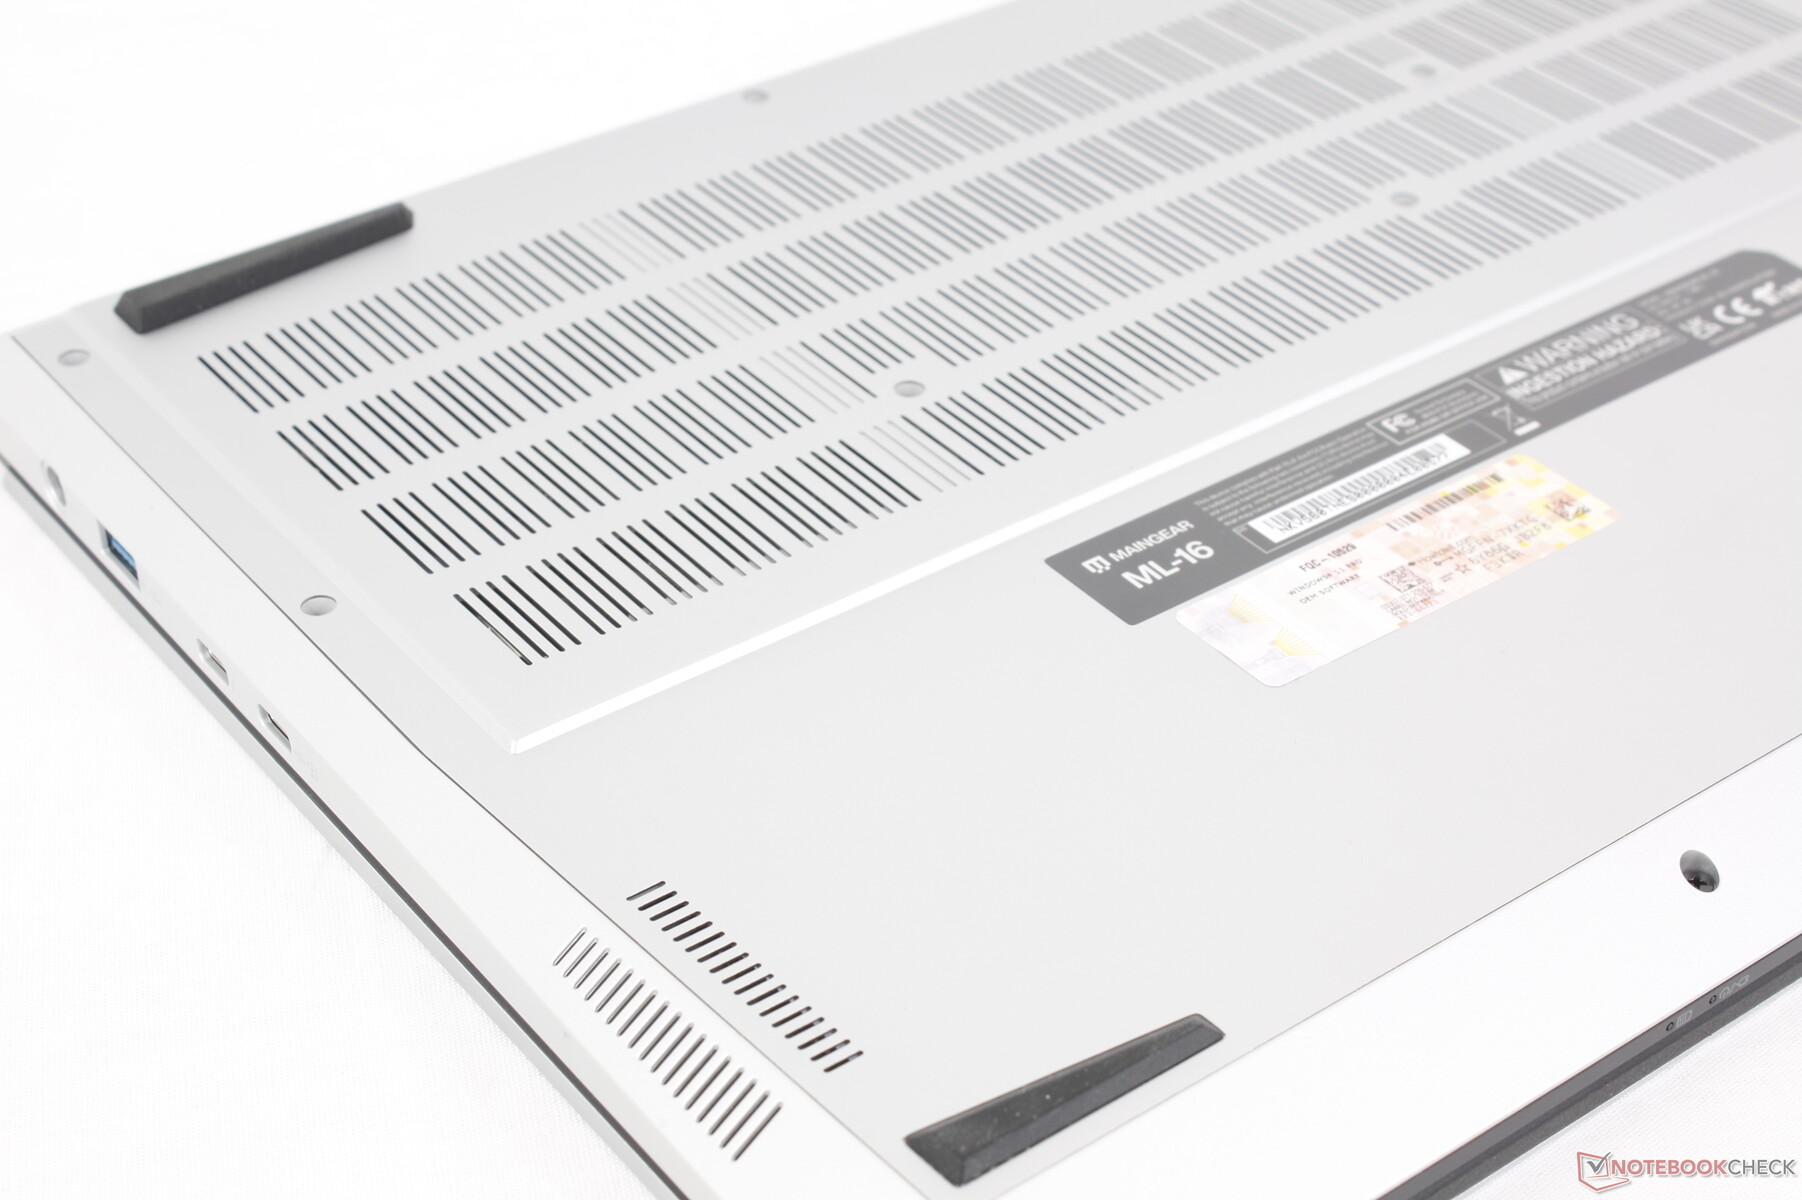
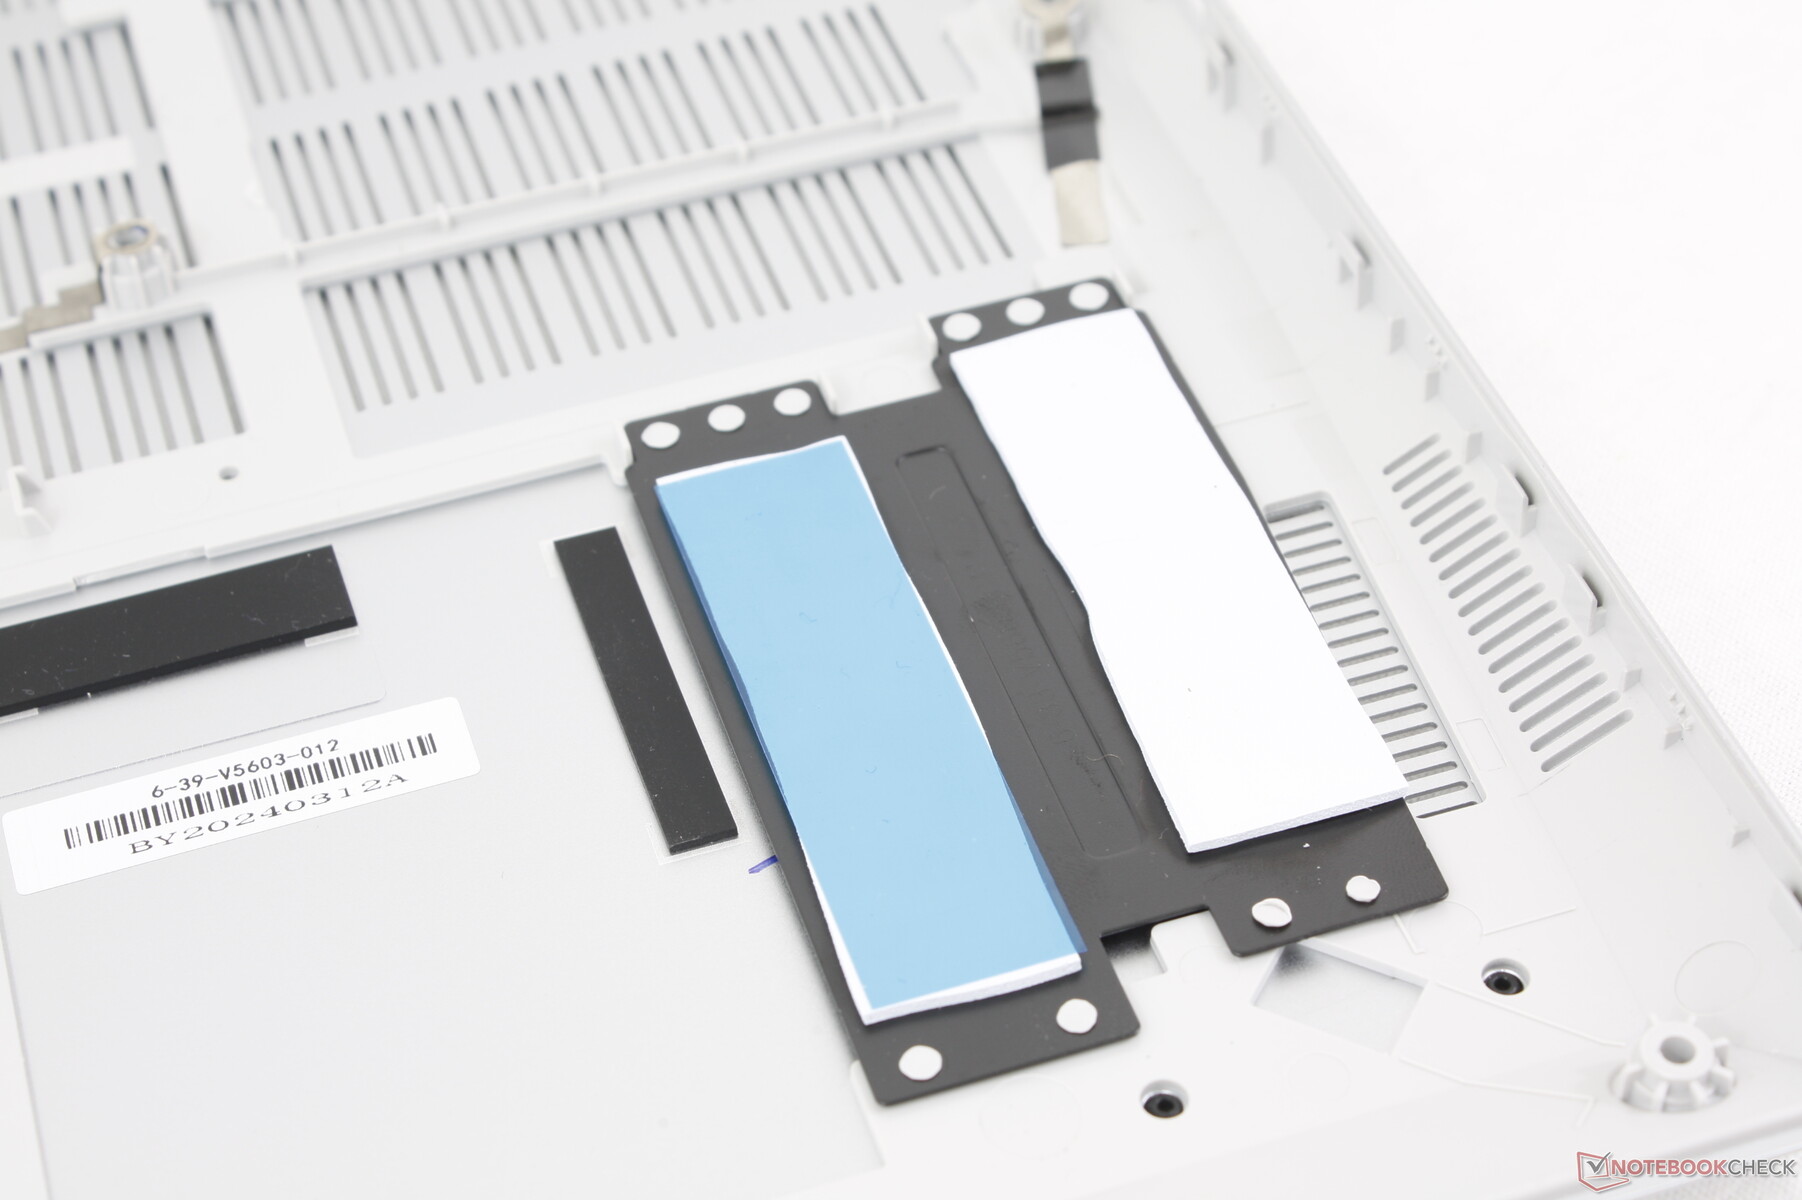
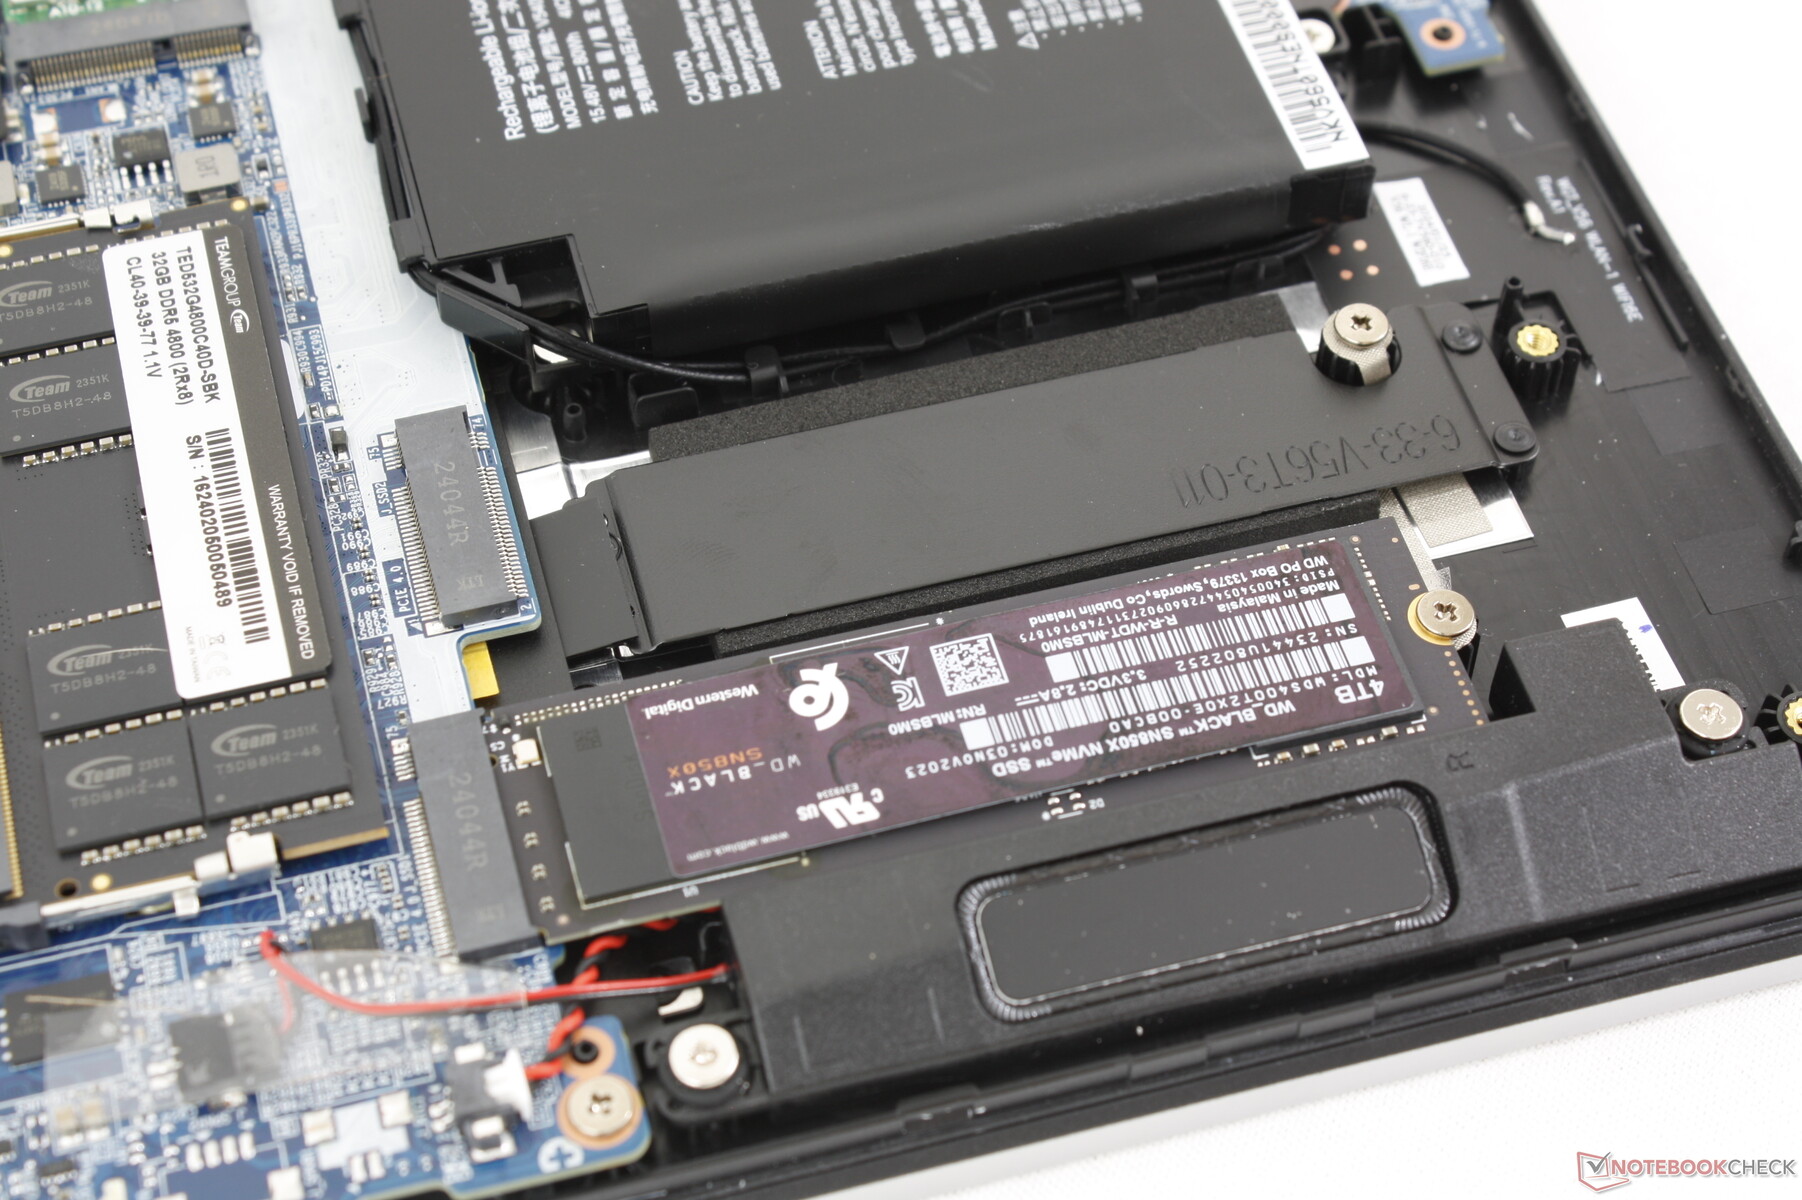
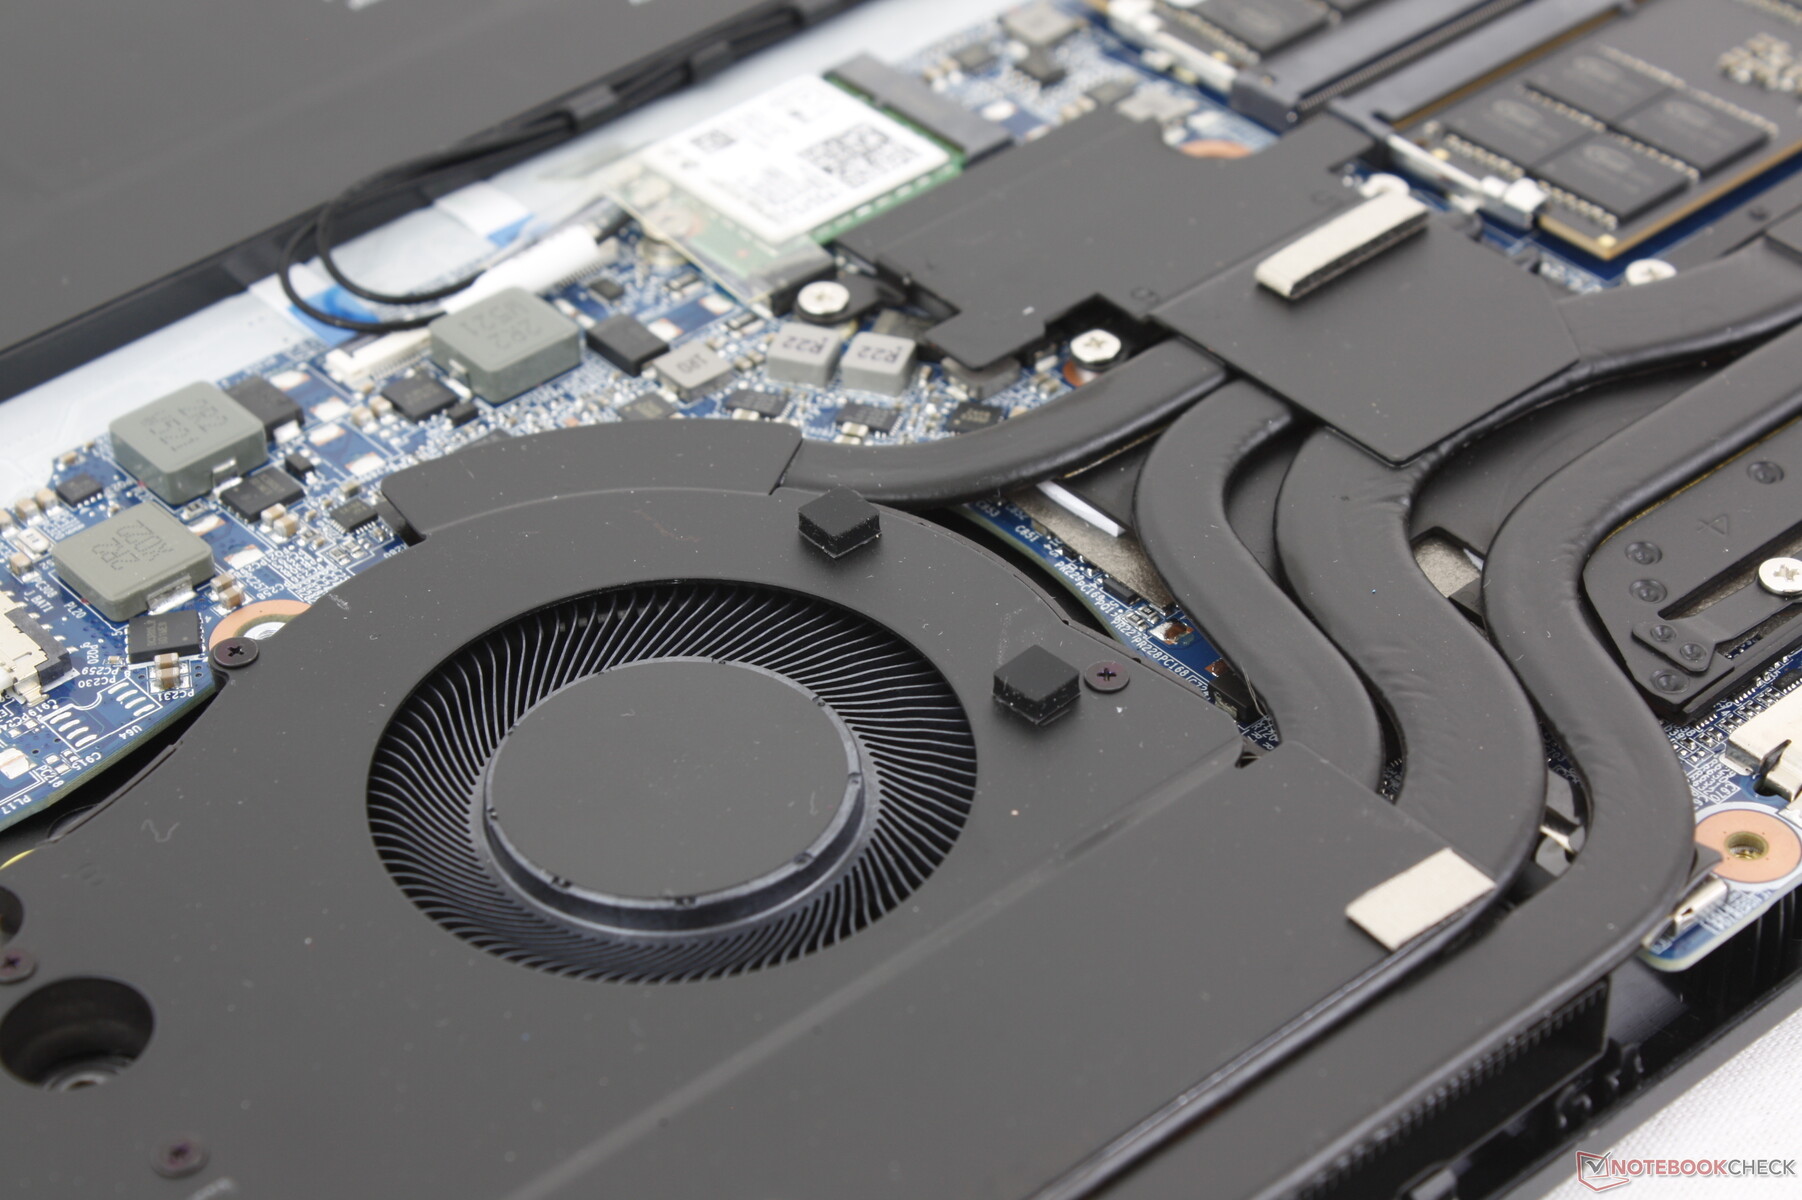
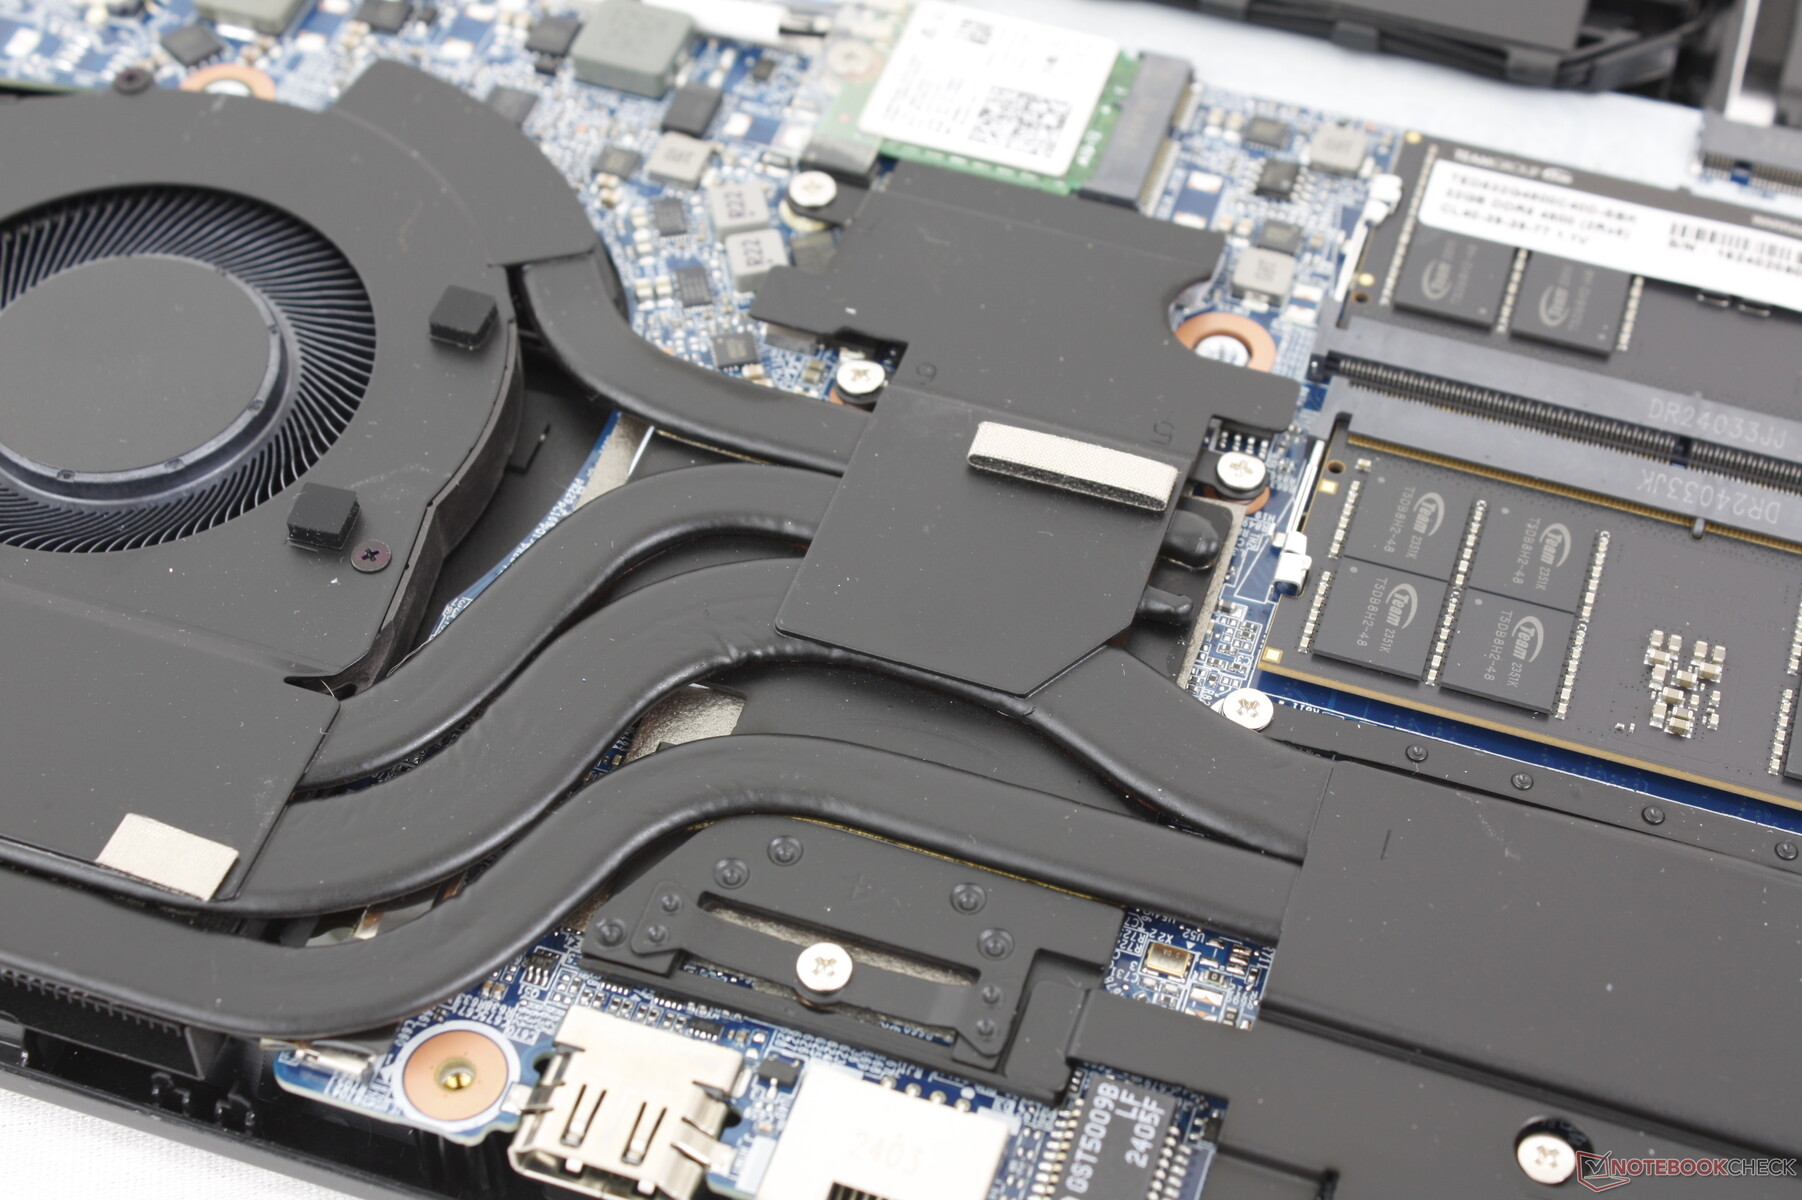
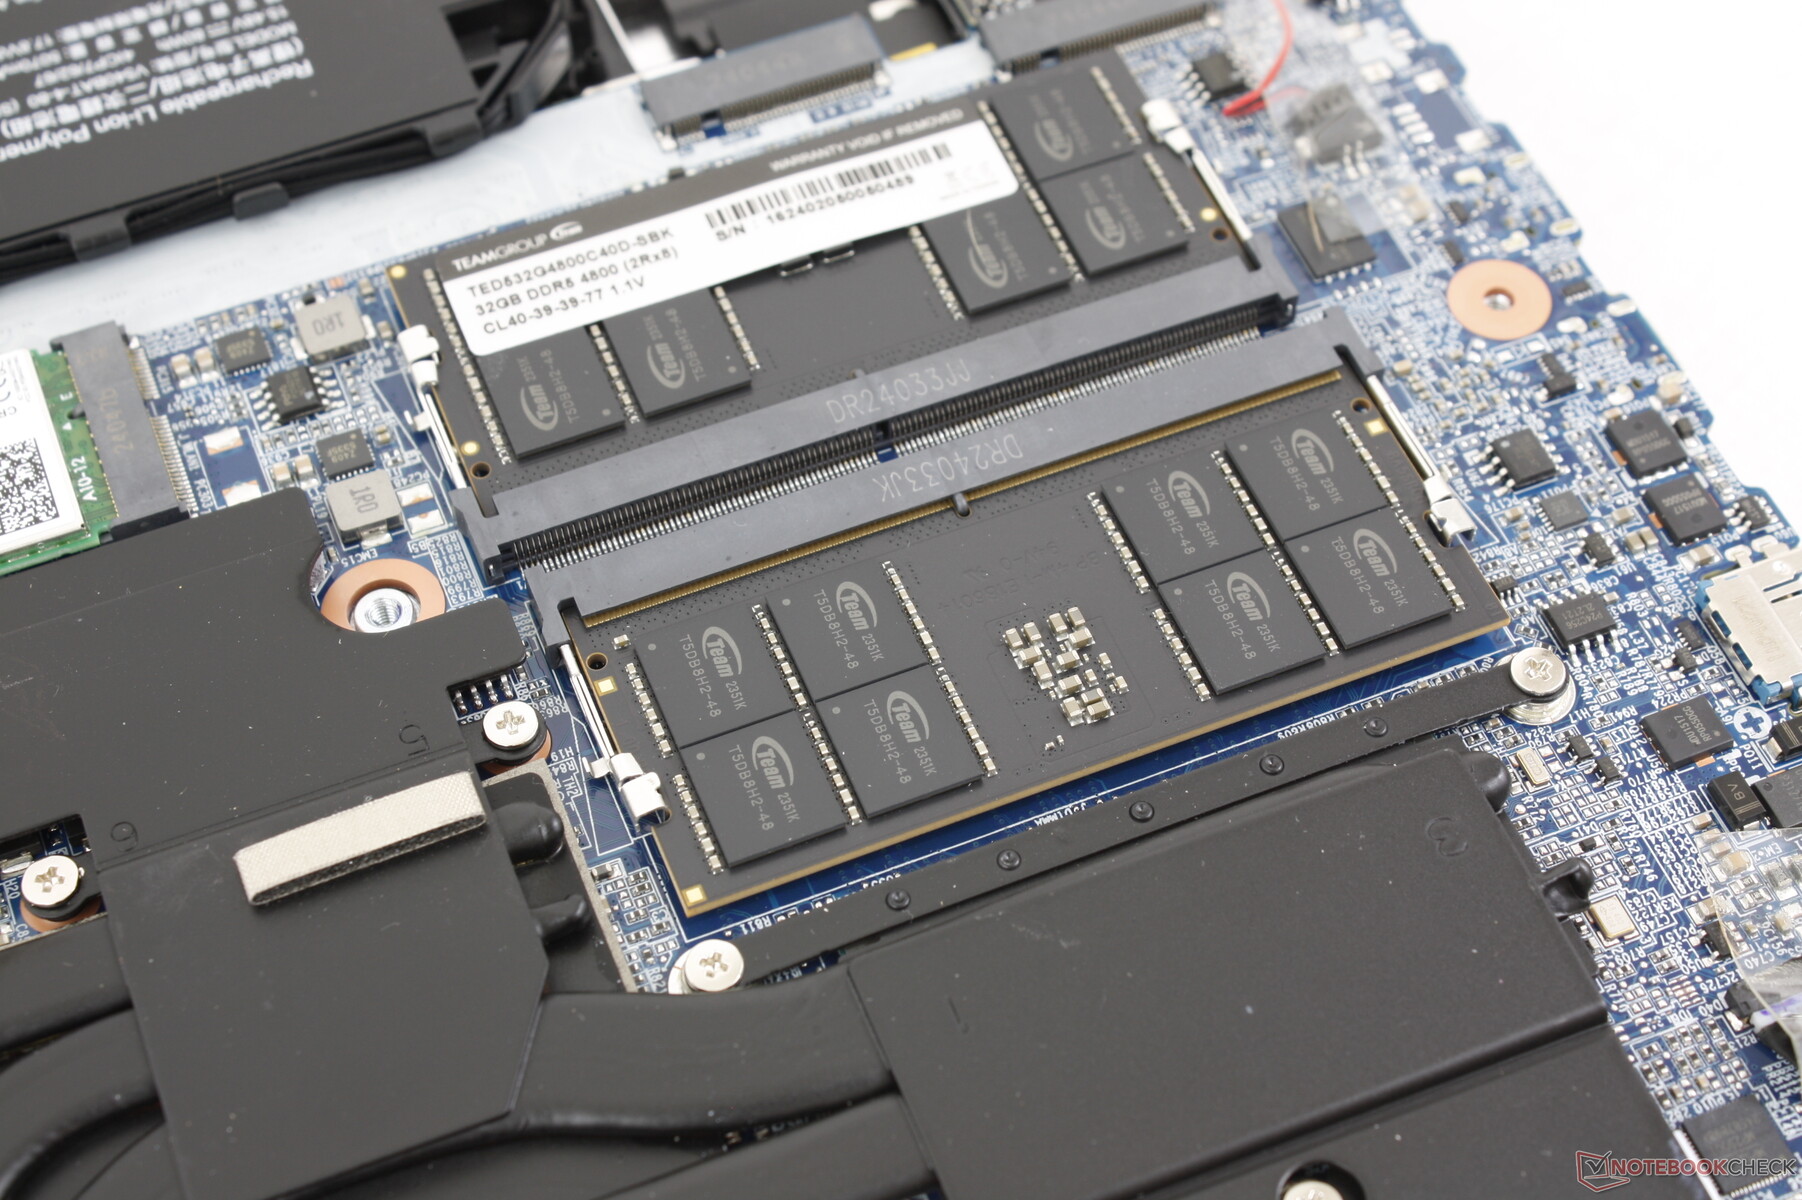
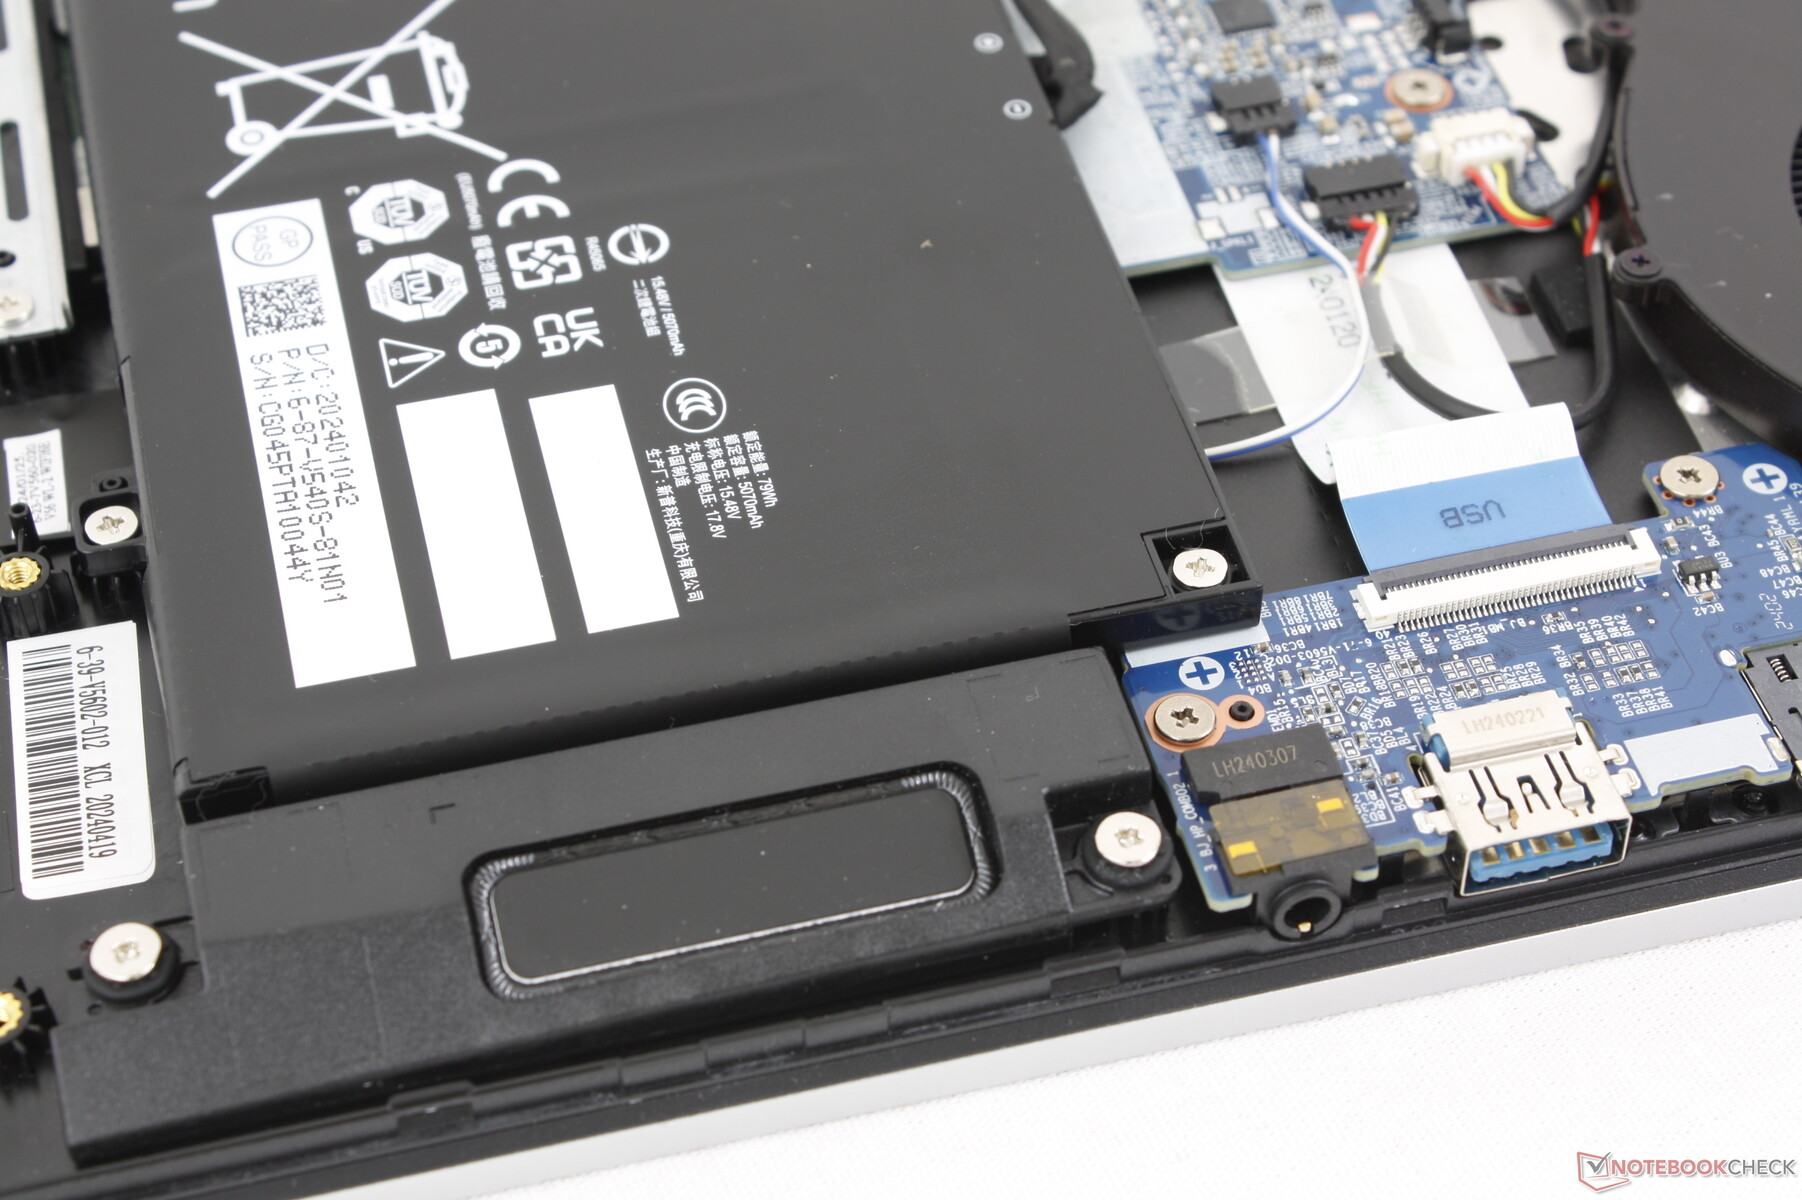
Konserwacja
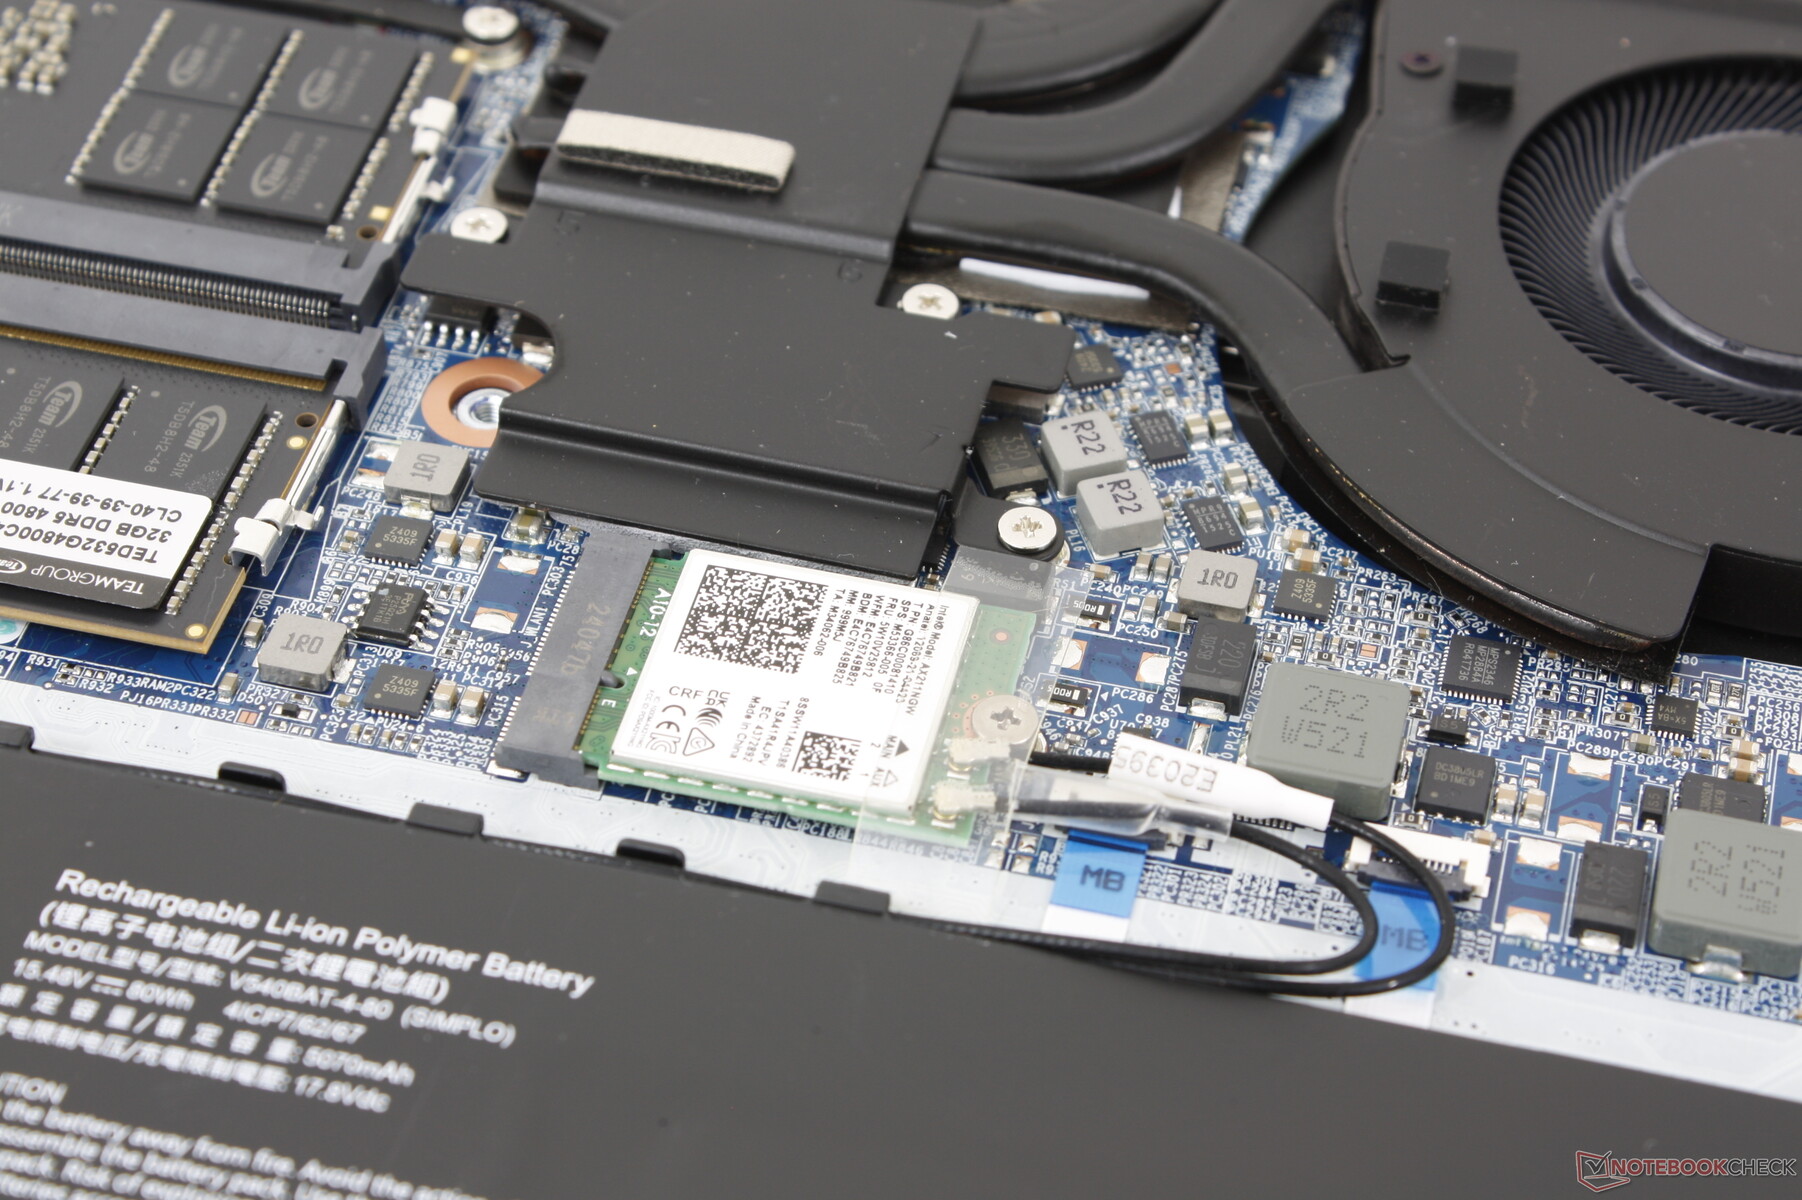
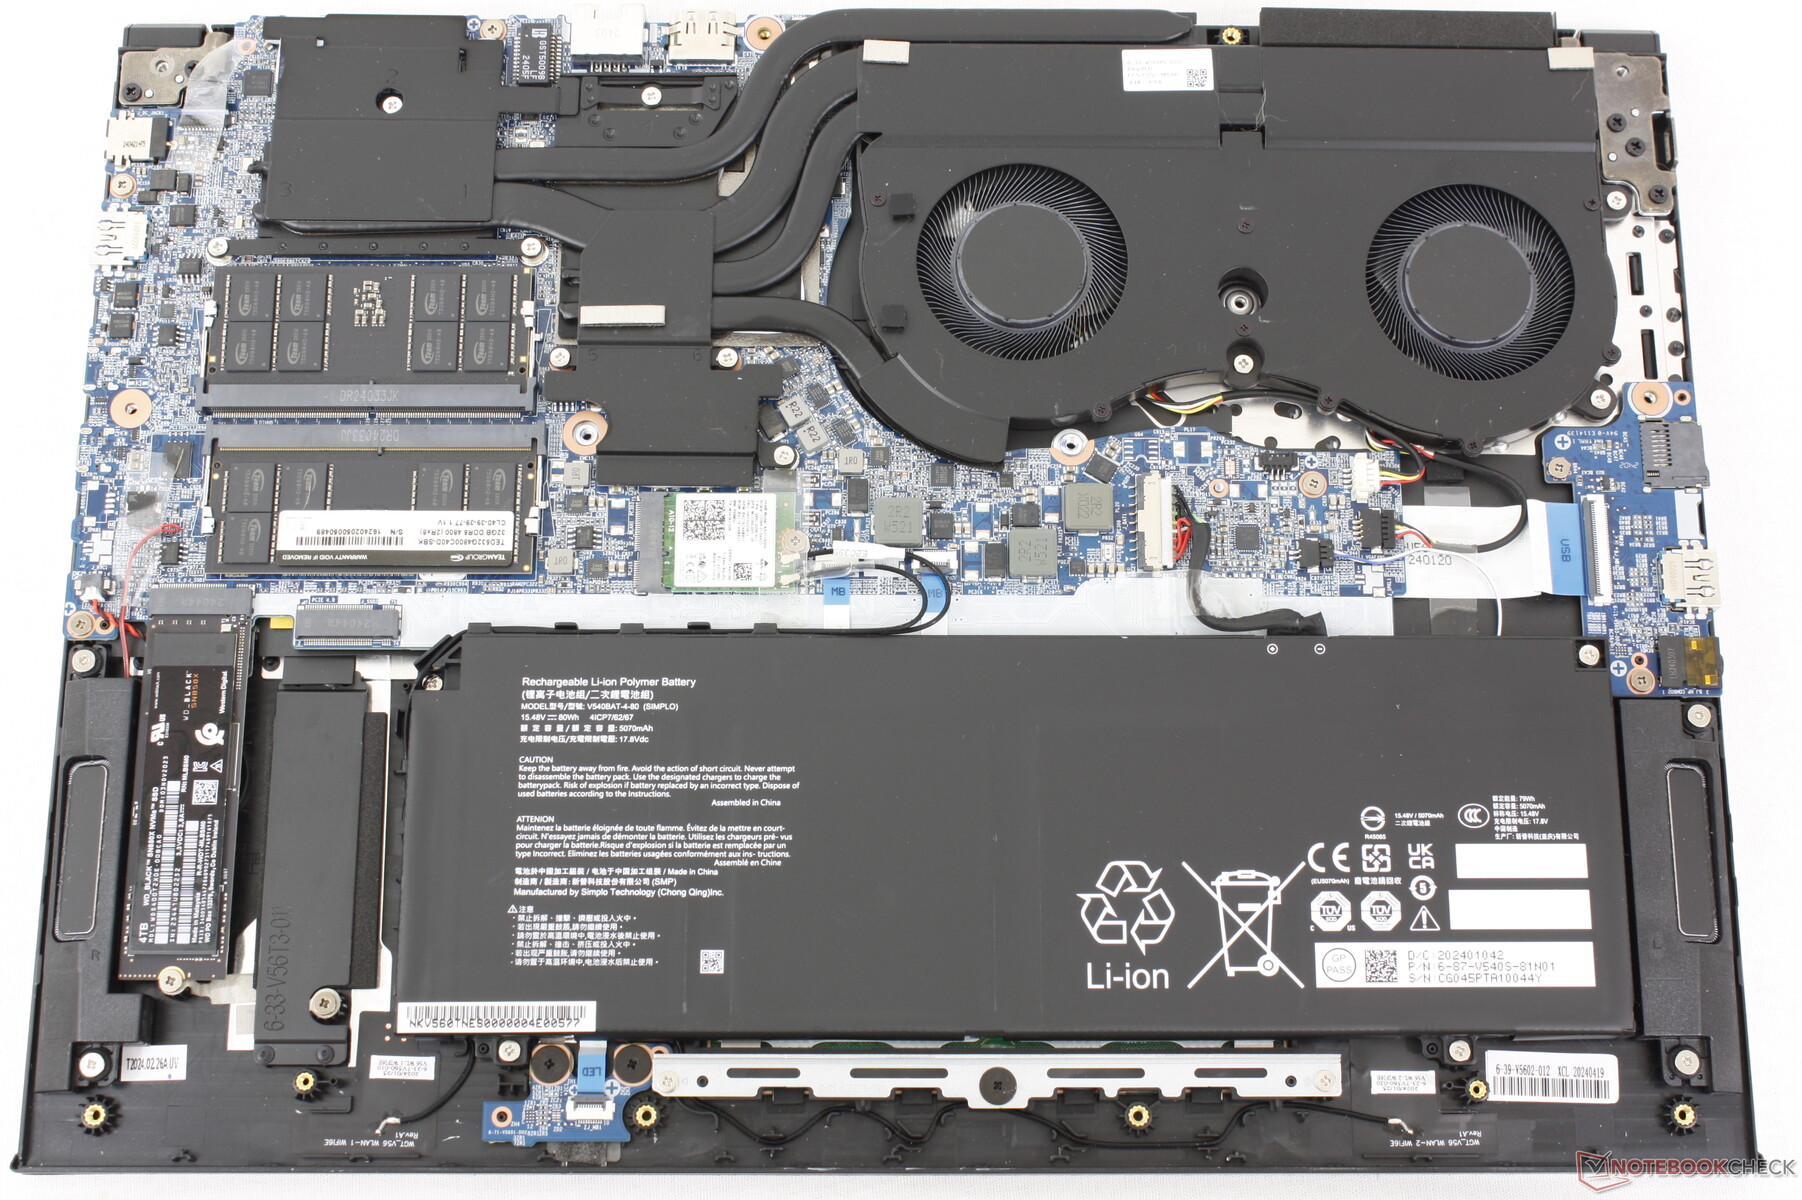
Zdejmowanie dolnego panelu wymaga nieco cierpliwości, gdyż jest on zabezpieczony 13 śrubami krzyżakowymi. W przeciwnym razie wyskakuje bez większego oporu, zapewniając łatwy dostęp do dwóch zatok M.2 PCIe4 x4 2280, dwóch gniazd SODIMM, baterii i wyjmowanego modułu WLAN. Opcje te są porównywalne z Razer Blade 16, a jednocześnie lepsze niż w przypadku Alienware x16 R2 który w ogóle nie posiada pamięci RAM z możliwością rozbudowy przez użytkownika.
Zrównoważony rozwój
Maingear nie reklamuje żadnych materiałów pochodzących z recyklingu użytych do produkcji laptopa.
Opakowanie składa się z kartonu, plastikowego opakowania i nienadającego się do recyklingu LDPE.
Akcesoria i gwarancja
W pudełku nie ma żadnych dodatków poza zasilaczem sieciowym i dokumentacją. W przypadku zakupu w Stanach Zjednoczonych obowiązuje standardowa roczna ograniczona gwarancja producenta.
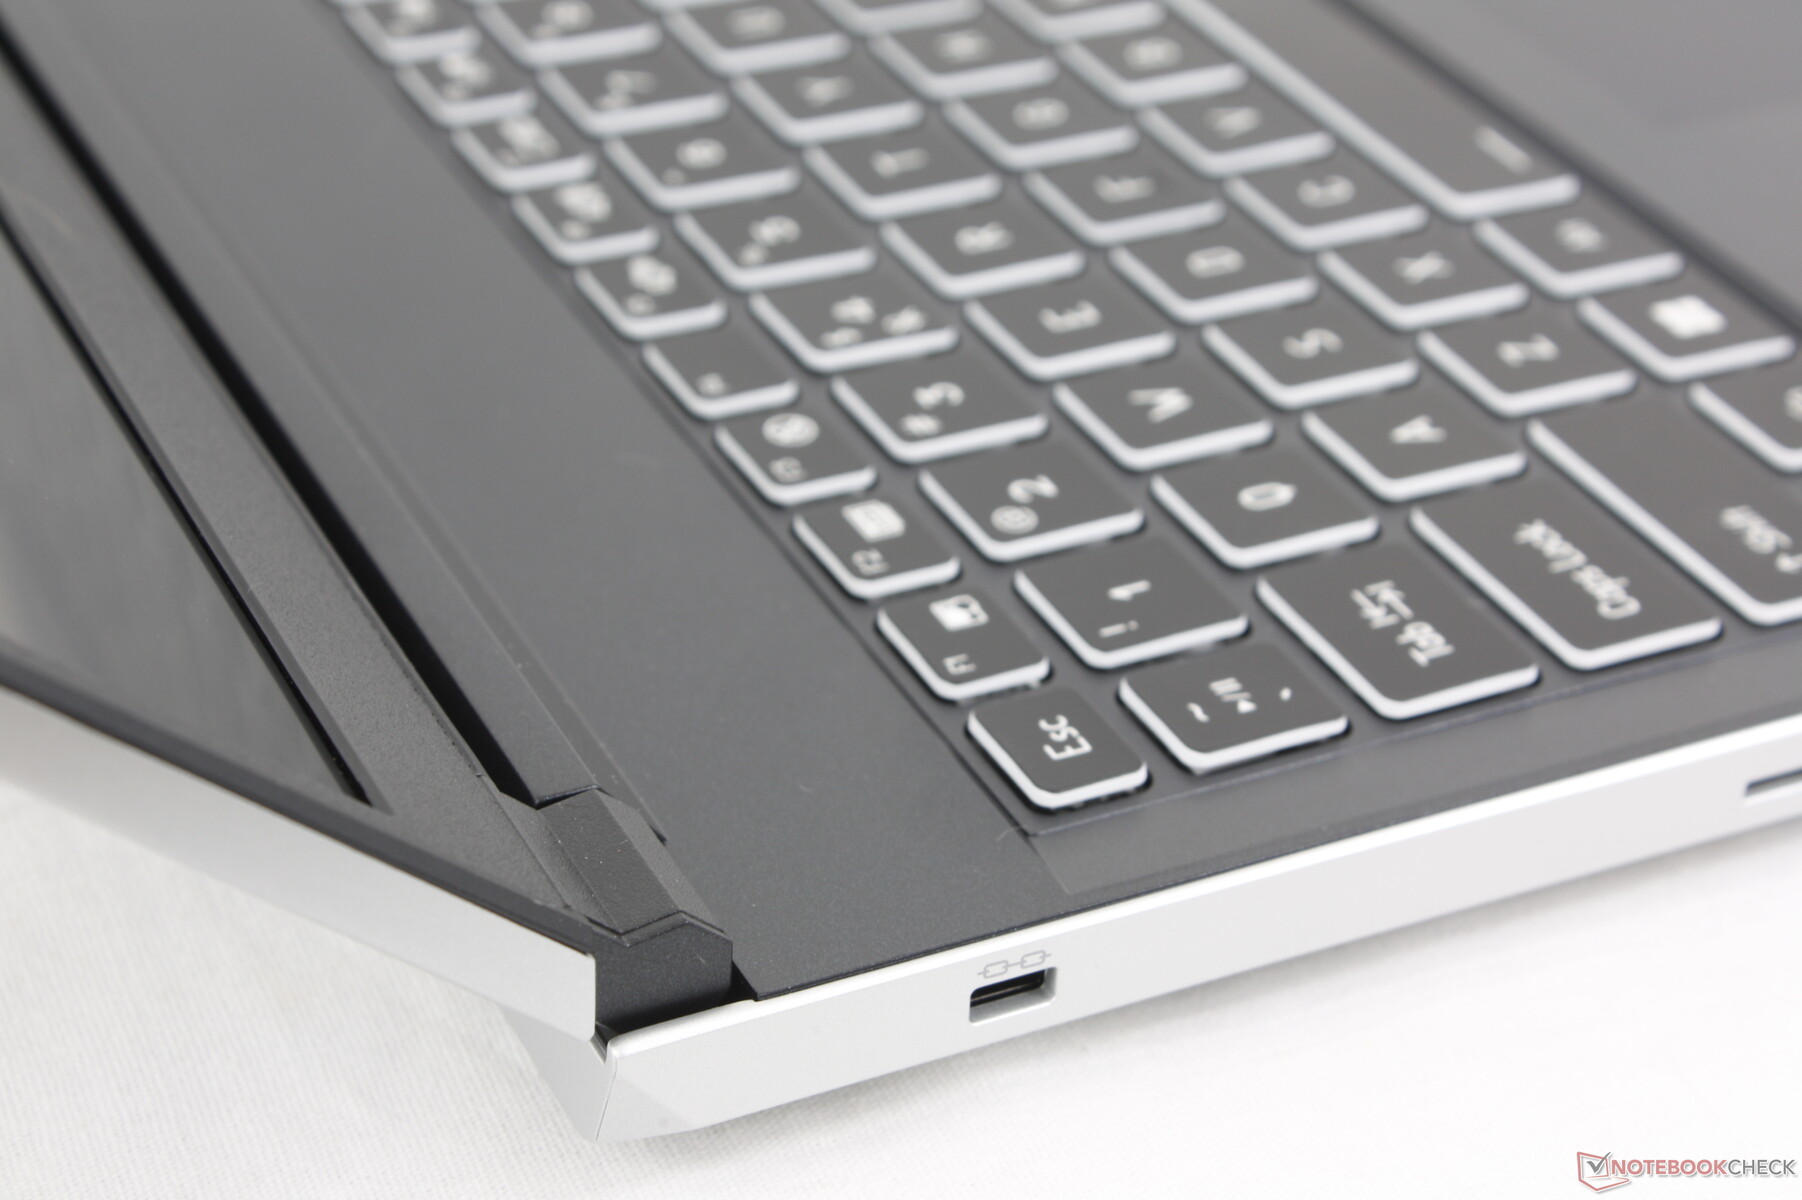
Urządzenia wejściowe
Klawiatura
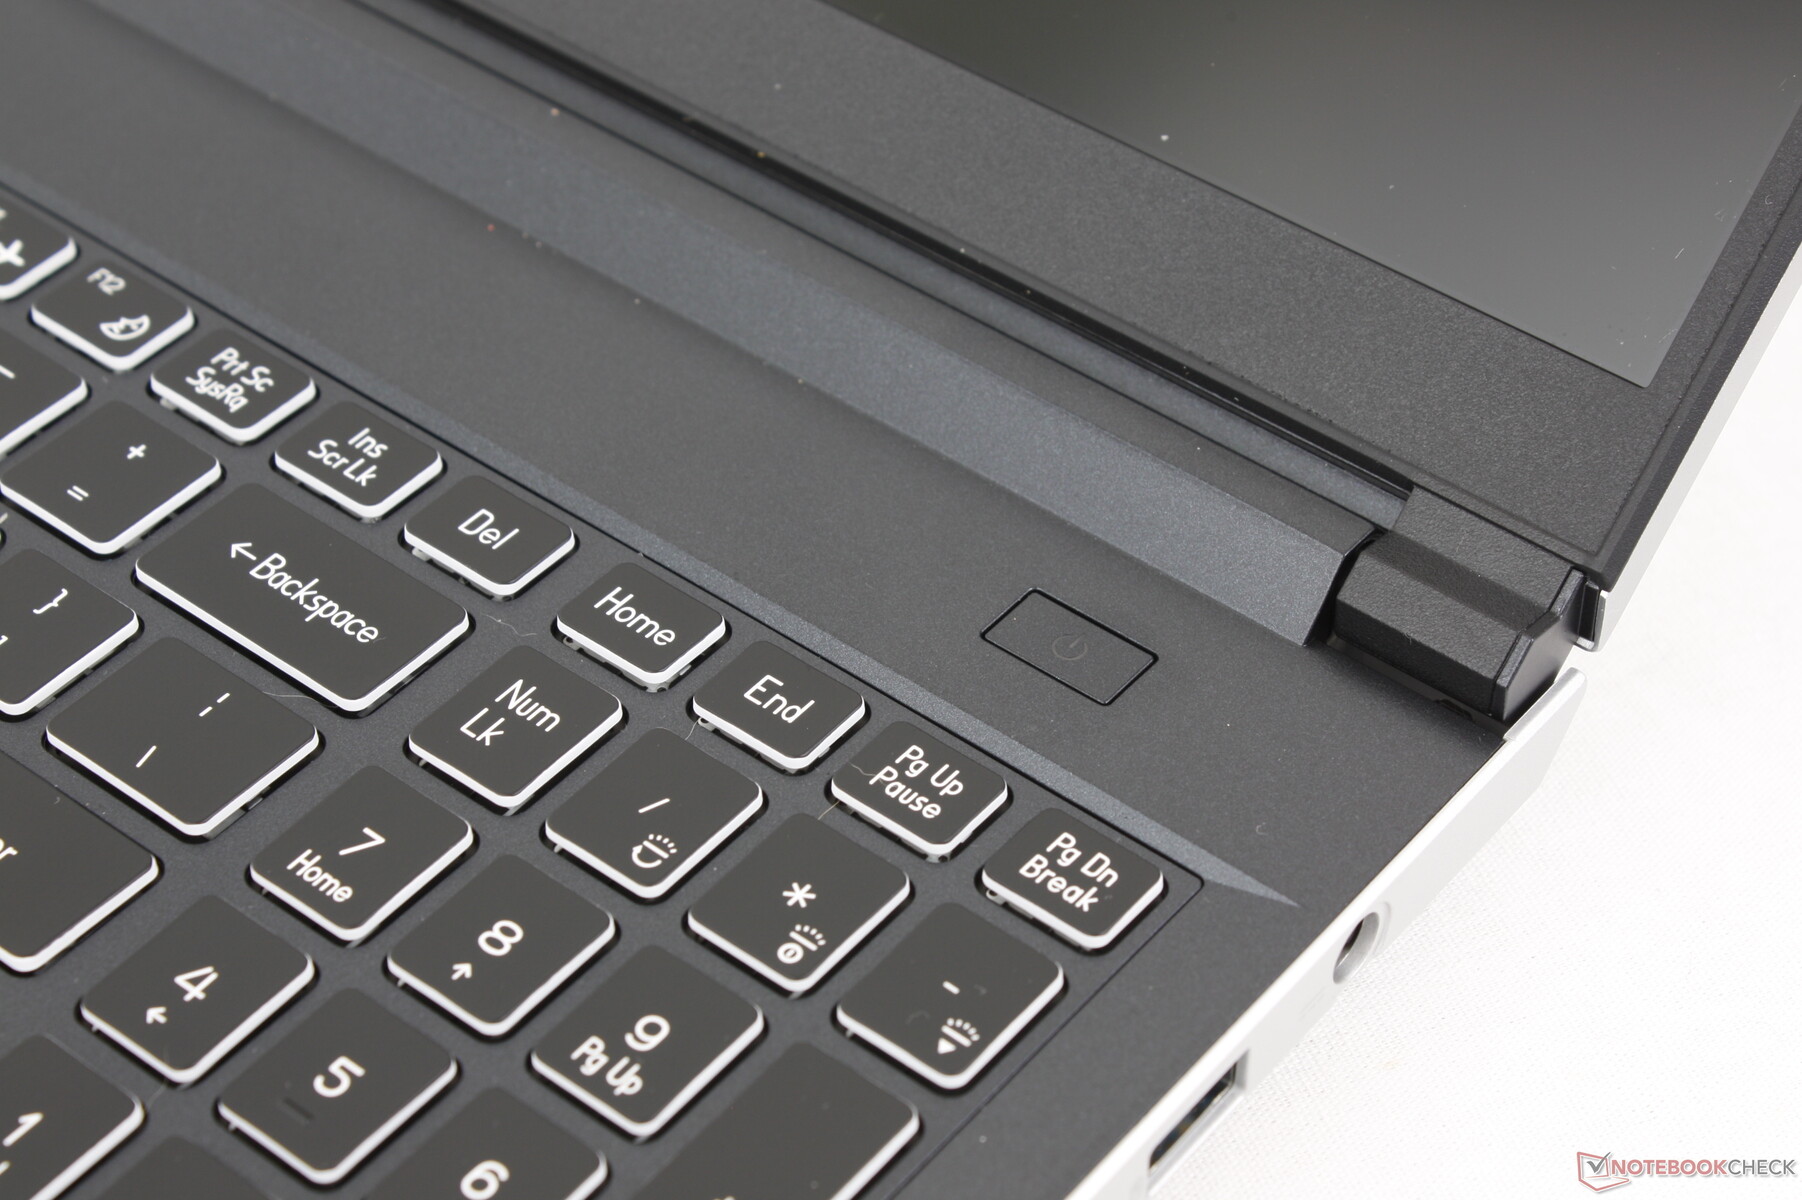
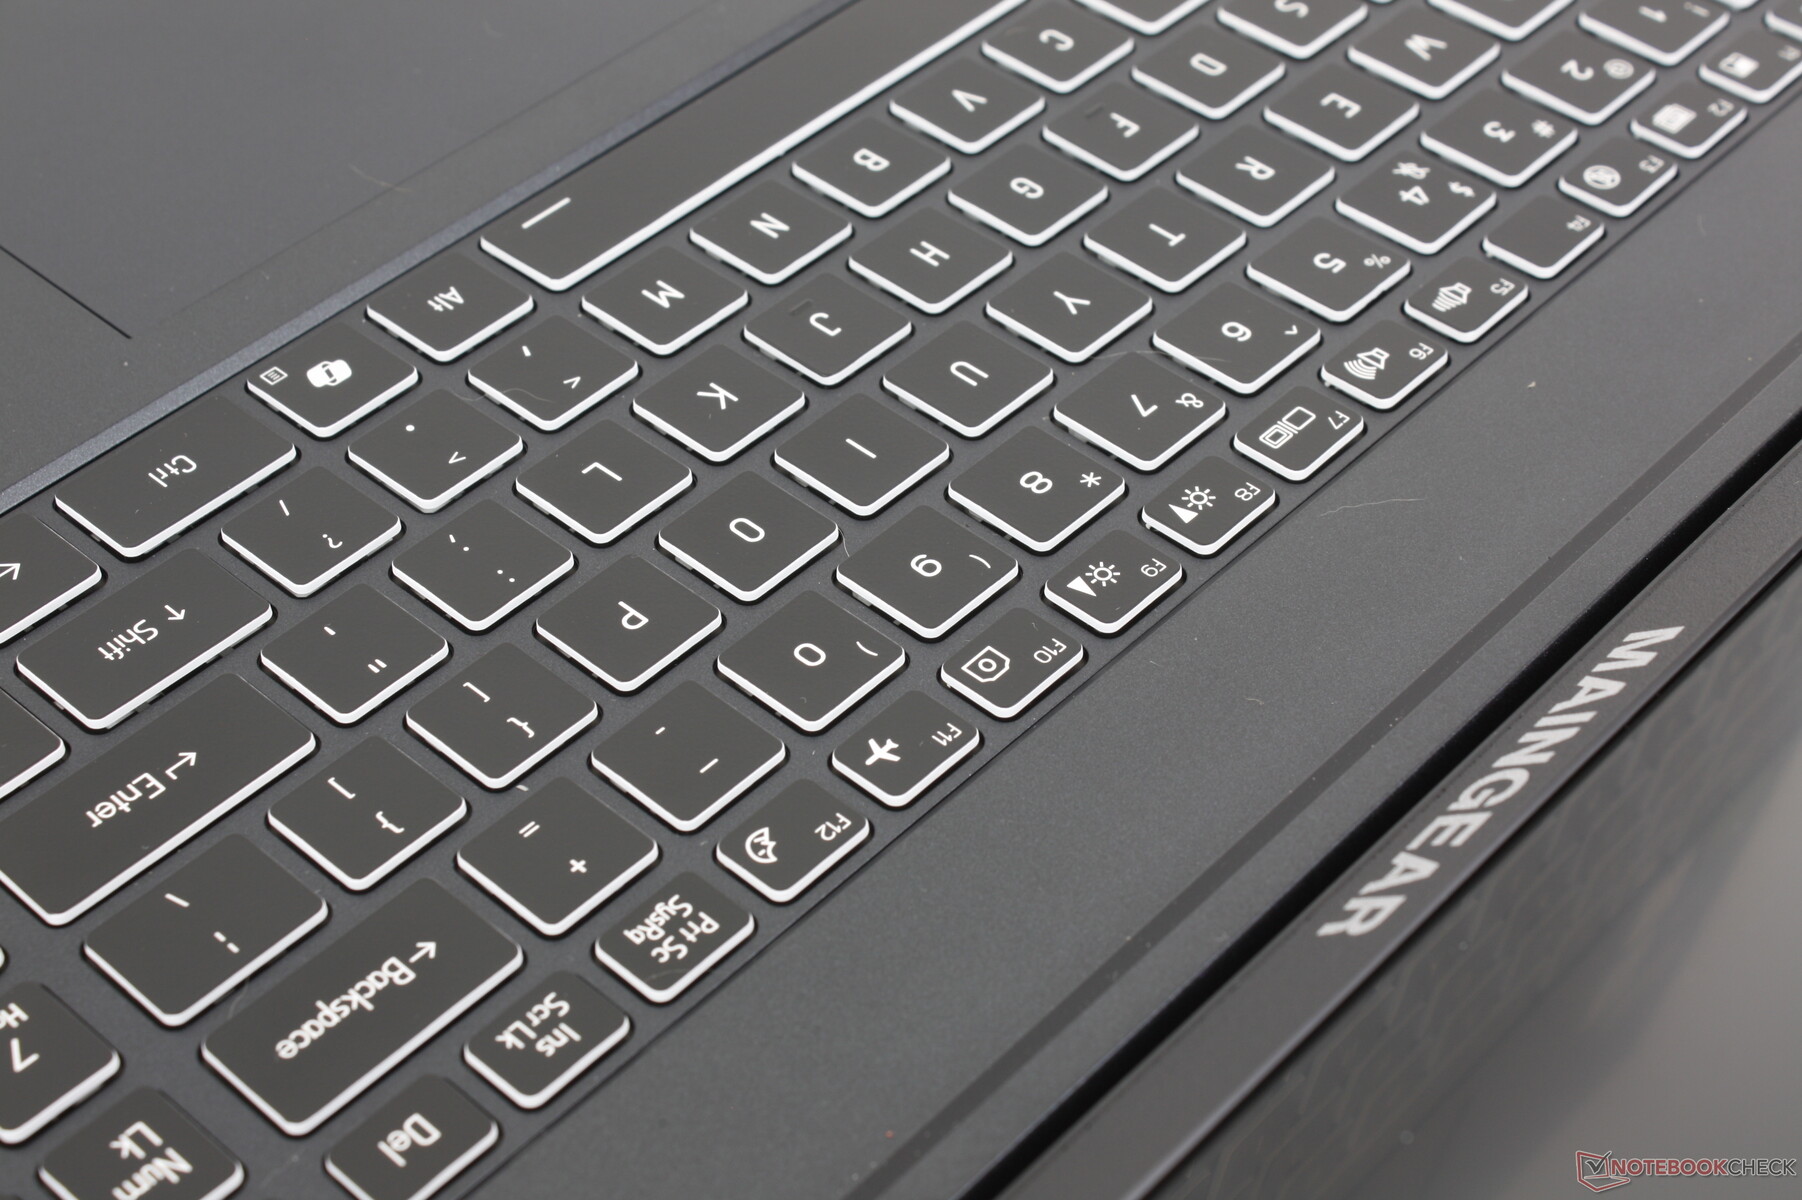
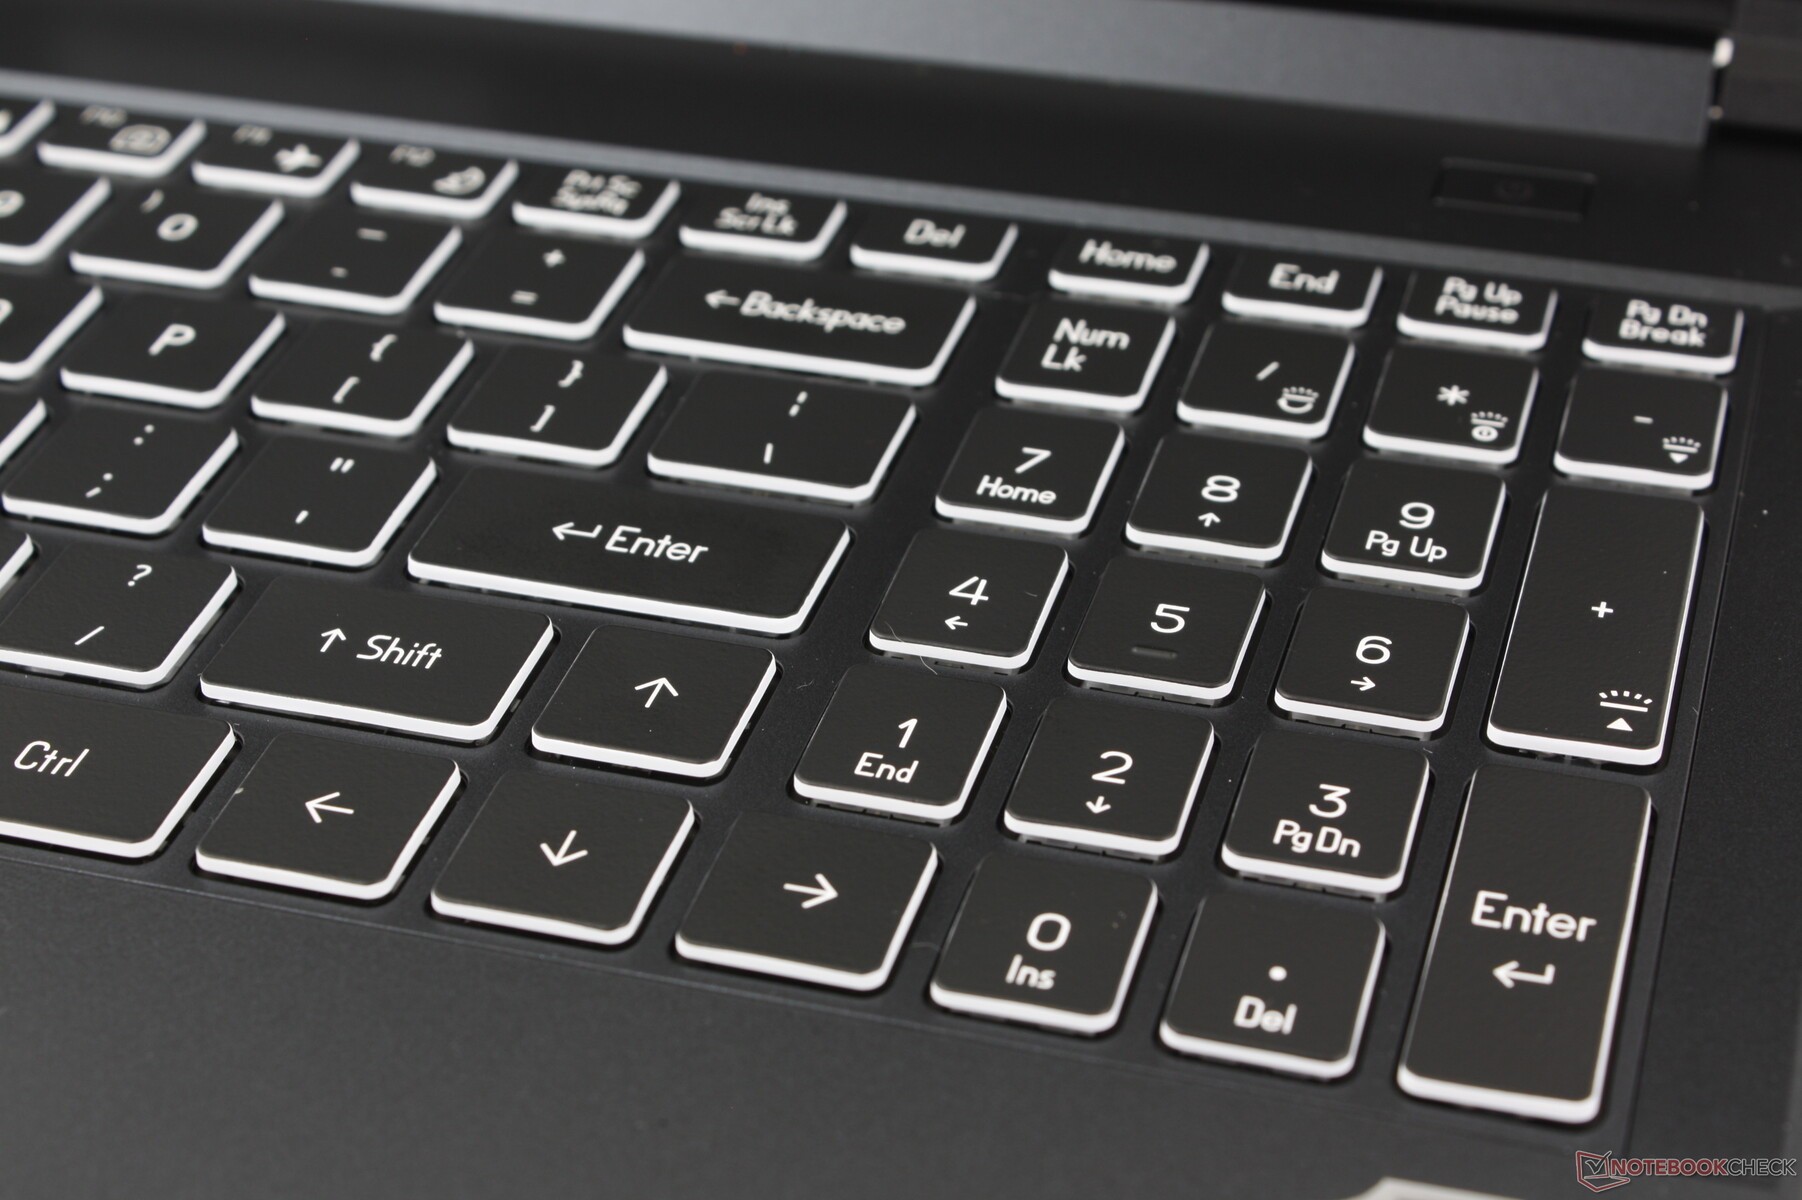
Pisanie jest głośniejsze niż w większości innych laptopów ze względu na wysoki stukot głównych klawiszy QWERTY. Głośny stukot zazwyczaj oznacza twardsze i bardziej satysfakcjonujące sprzężenie zwrotne, ale nie jest tak w przypadku ML-16 MK2, ponieważ skok jest nadal płytki, a miękkie sprzężenie zwrotne nie do końca pasuje do ostrego poziomu hałasu. Klawiatury na Legion Pro 5 16 lub Victus 16 które są bardziej znajome i łatwiej się do nich przyzwyczaić.
Jednostrefowe podświetlenie RGB jest standardem, bez opcji RGB na klawisz lub nawet opcji czterostrefowych.
Panel dotykowy
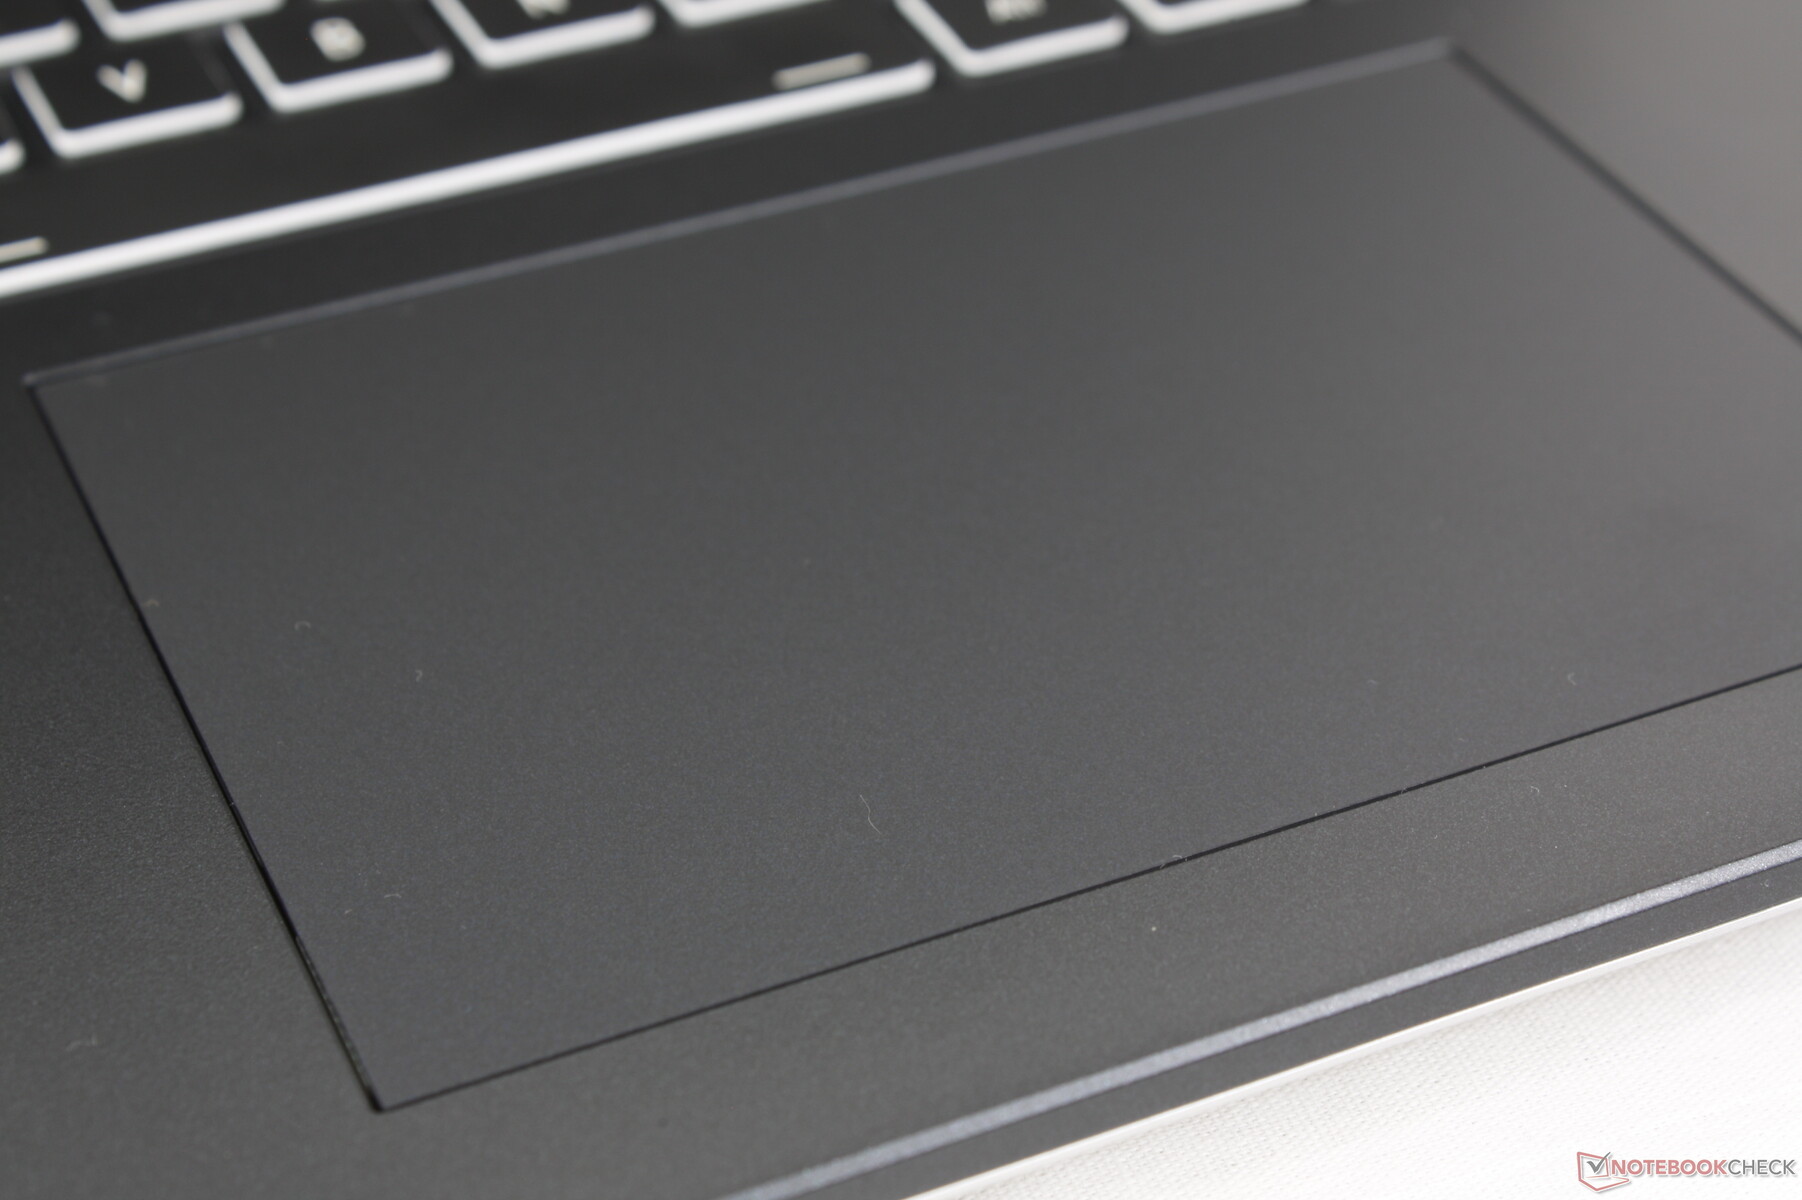
Klawiatura (12,2 x 8,3 cm) jest mniejsza niż w Blade 16 Blade 16 (17 x 9,7 cm), ale większy niż w Legion Pro 5 16IRX9 (12 x 7,5 cm). Jest przestronna, a po naciśnięciu reaguje stanowczo i klikająco. Poślizg jest jednak prawie zbyt płynny, szczególnie przy niższych prędkościach, co utrudnia precyzyjne kliknięcia lub przeciąganie i upuszczanie. Dla porównania, palec ma tendencję do przyklejania się podczas poruszania się z mniejszą prędkością w większości innych laptopów, co pomaga w precyzji.


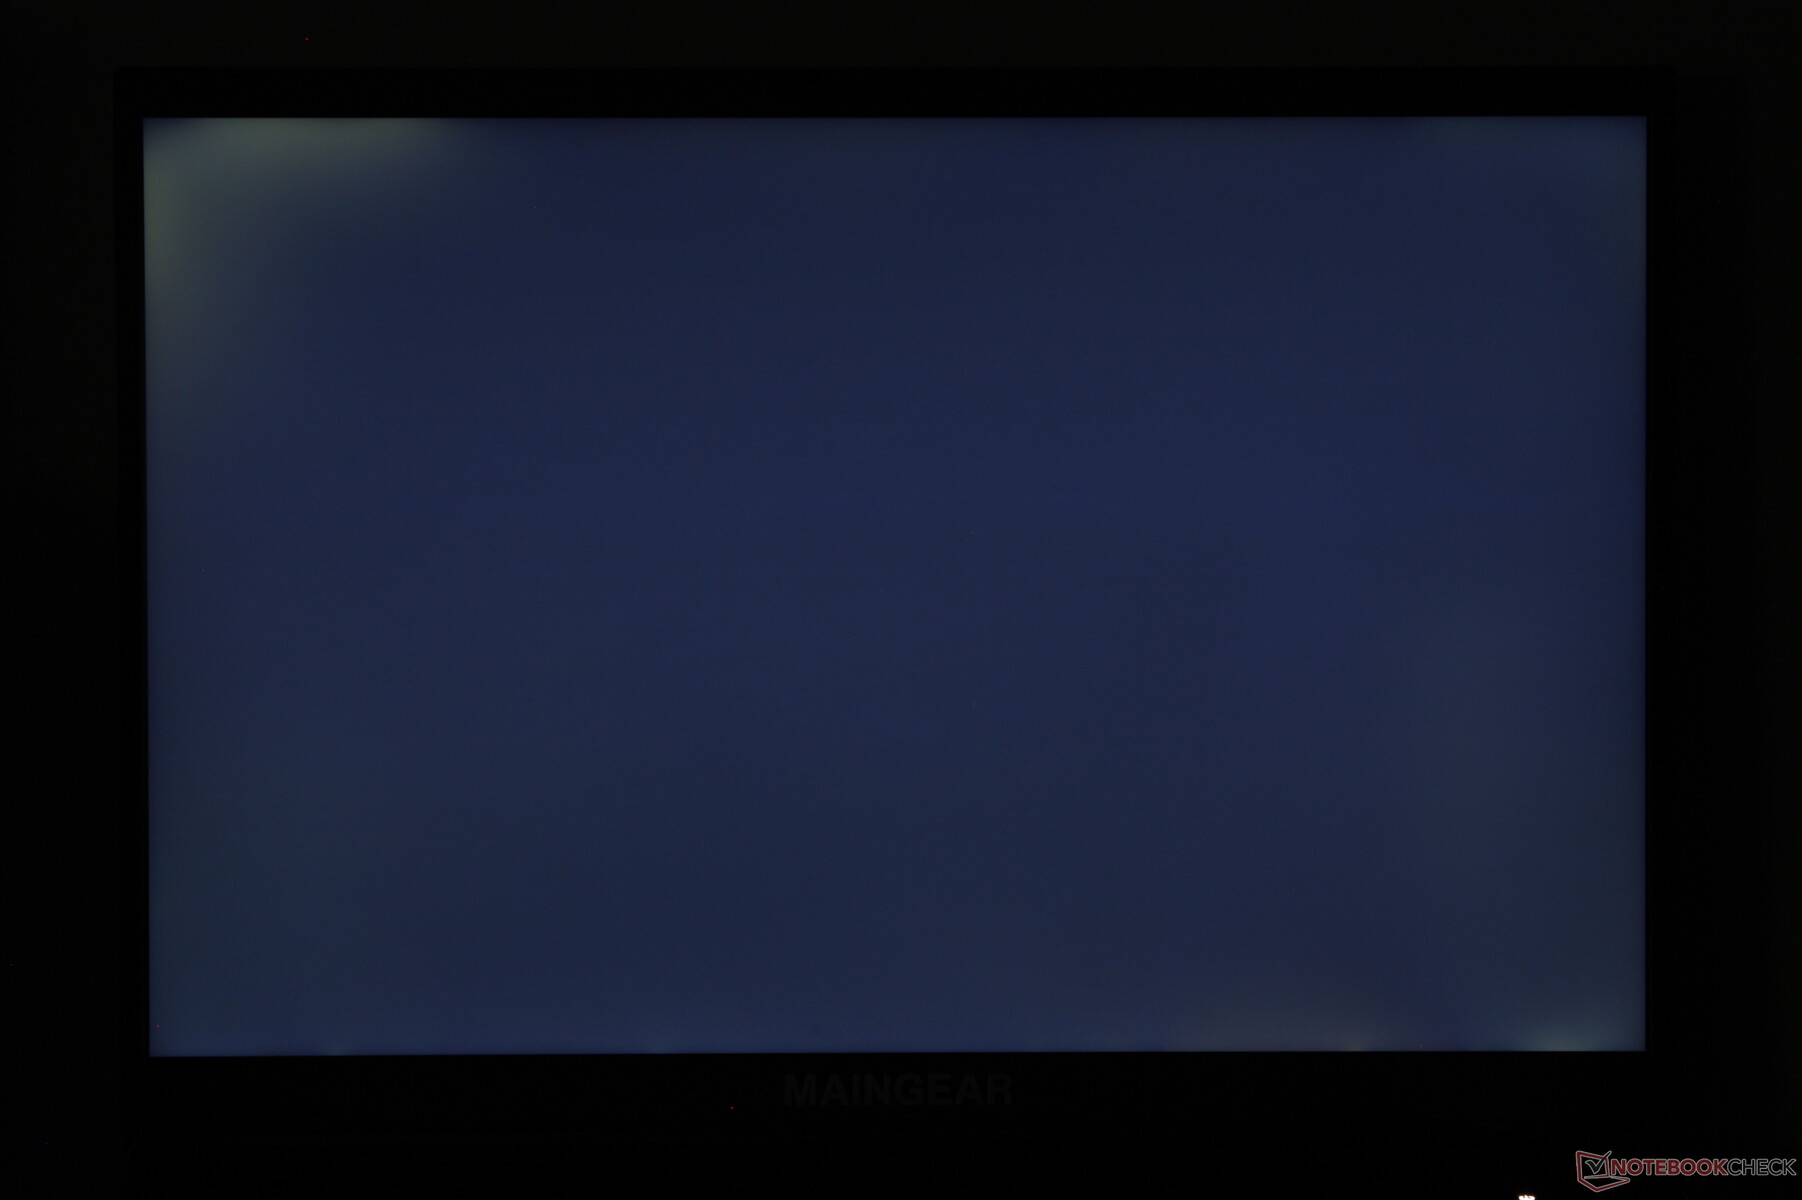
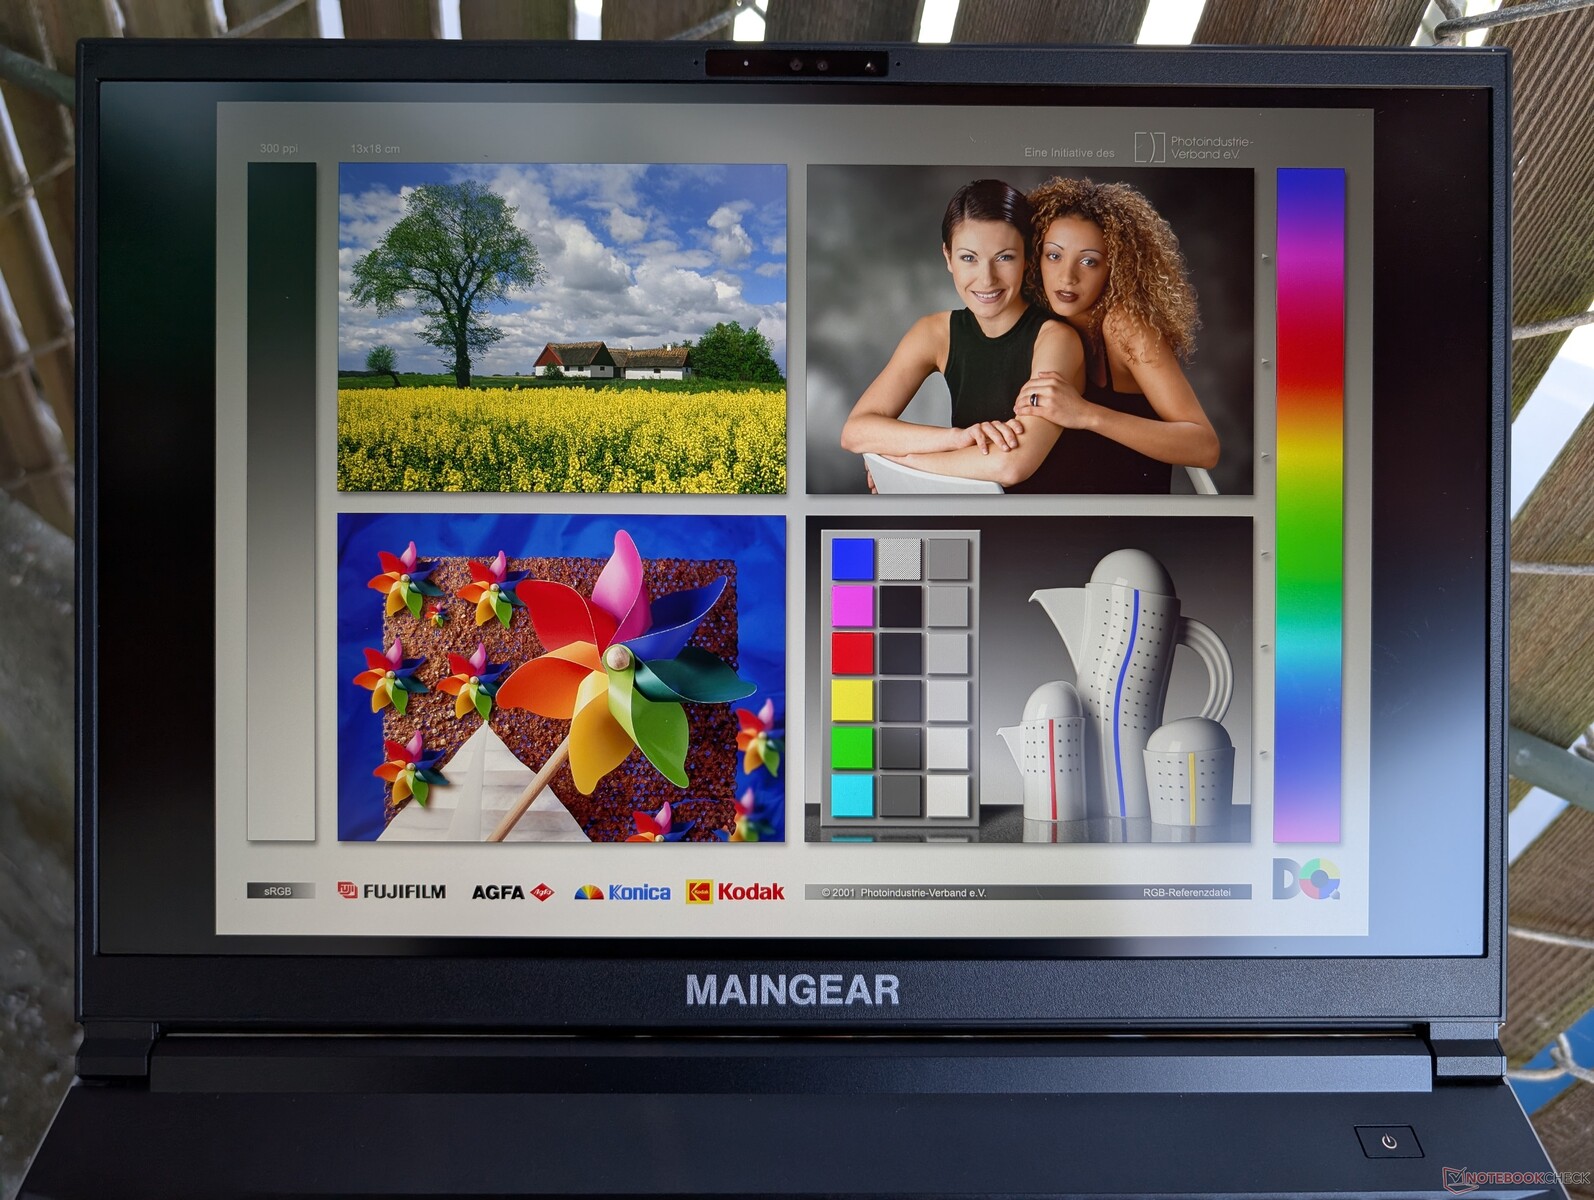
Wyświetlacz - IPS do gier
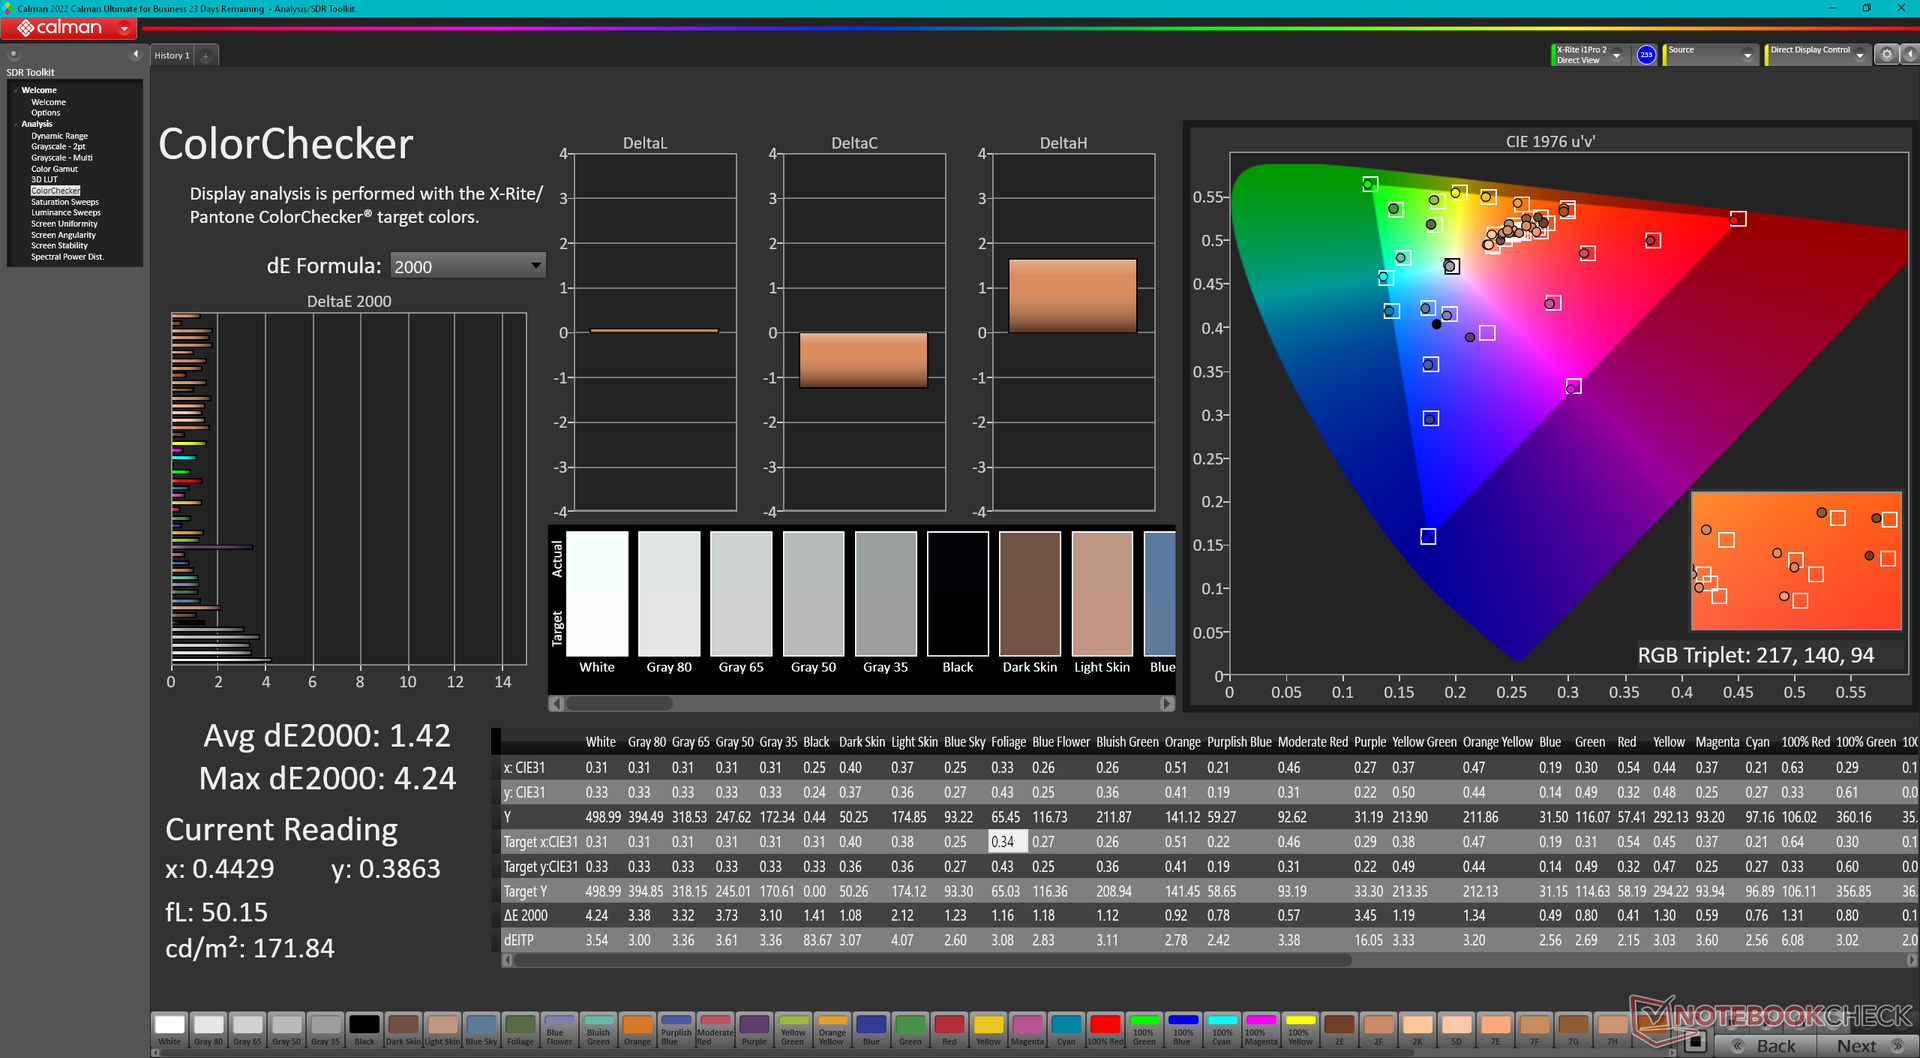
ML-16 MK2 to pierwszy model w naszej bazie danych wyposażony w panel IPS TL160ADMP11-0 240 Hz. Jest on porównywalny z panelem BOE B160QAN w Alienware x16 R2 pod względem częstotliwości odświeżania, współczynnika kontrastu i rozdzielczości, ale nie może się równać z wyświetlaczem Dell, jeśli chodzi o odwzorowanie kolorów lub czas reakcji. W rezultacie wyświetlacz ML-16 MK2 można uznać za średniej klasy, który nadal bardzo dobrze nadaje się do gier i większości amatorskiej edycji grafiki.
Bardziej zaawansowane funkcje, takie jak G-Sync lub HDR, nie są obsługiwane.


| |||||||||||||||||||||||||
rozświetlenie: 90 %
na akumulatorze: 518.2 cd/m²
kontrast: 1296:1 (czerń: 0.4 cd/m²)
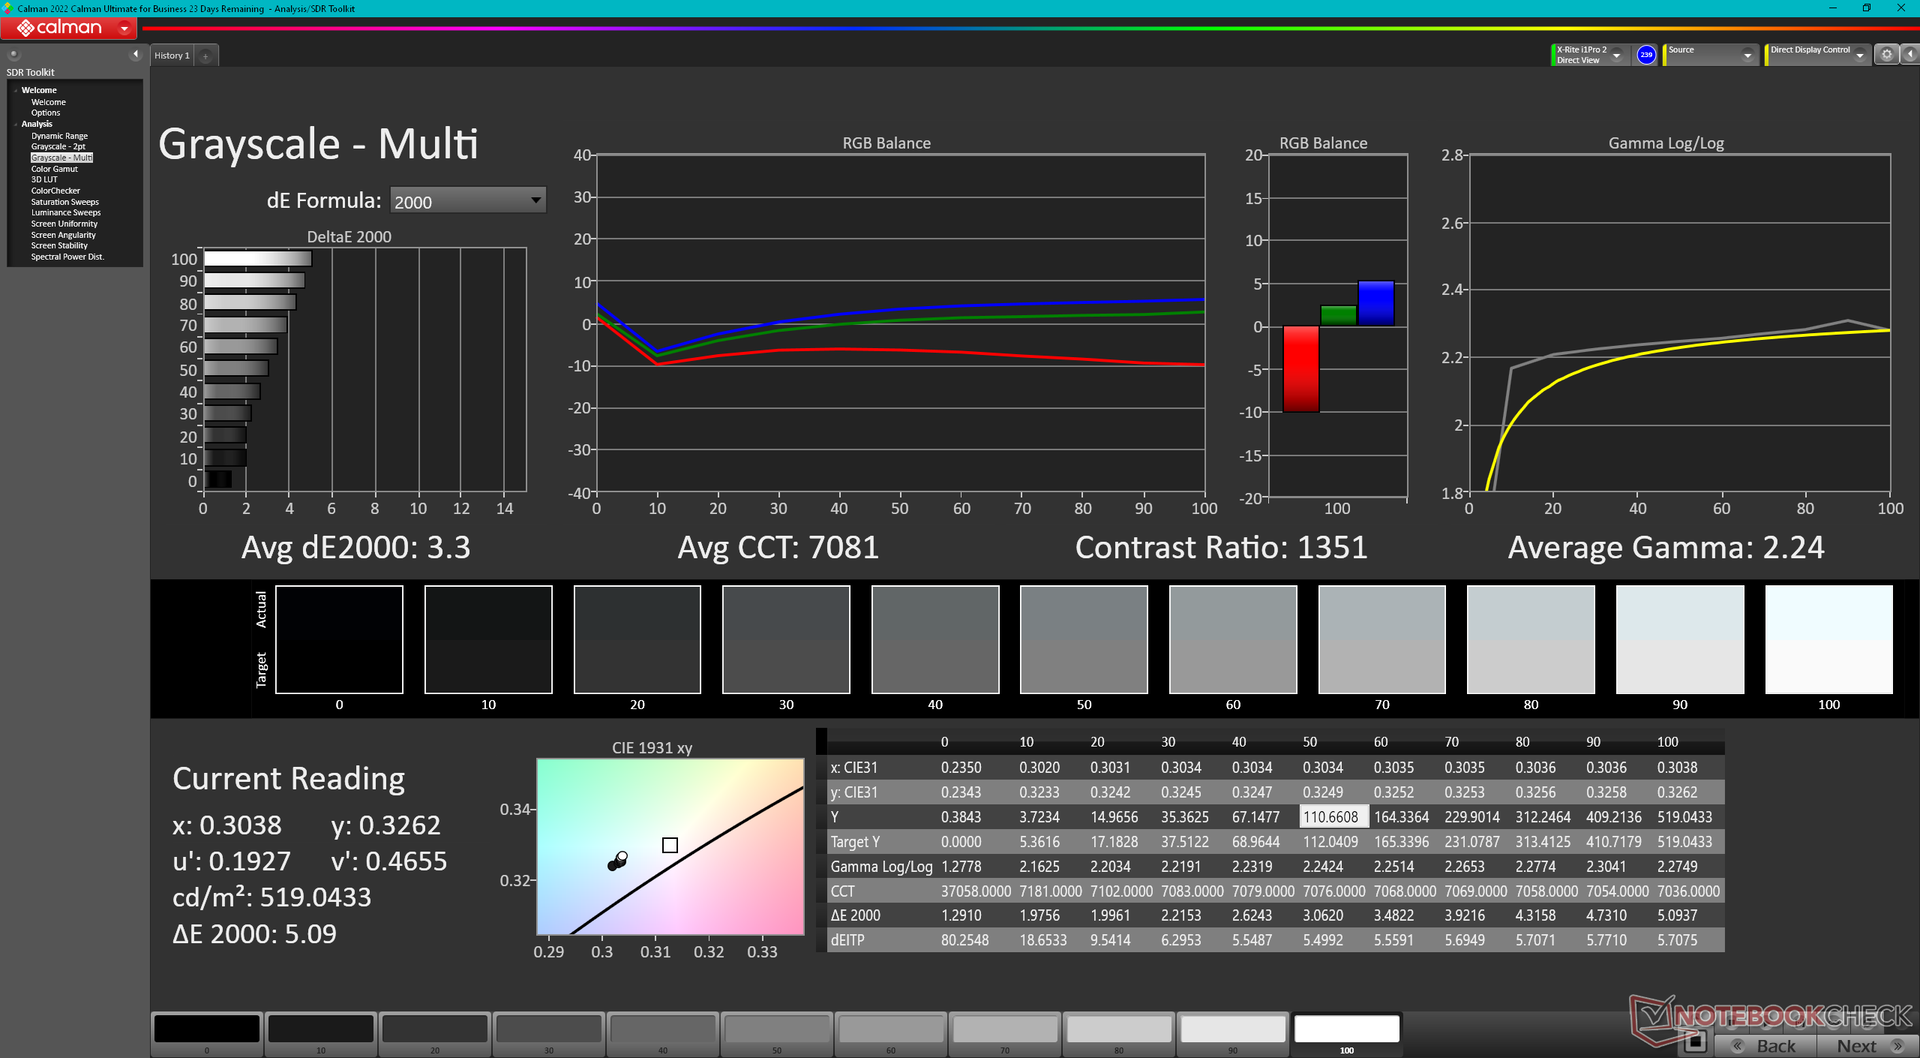
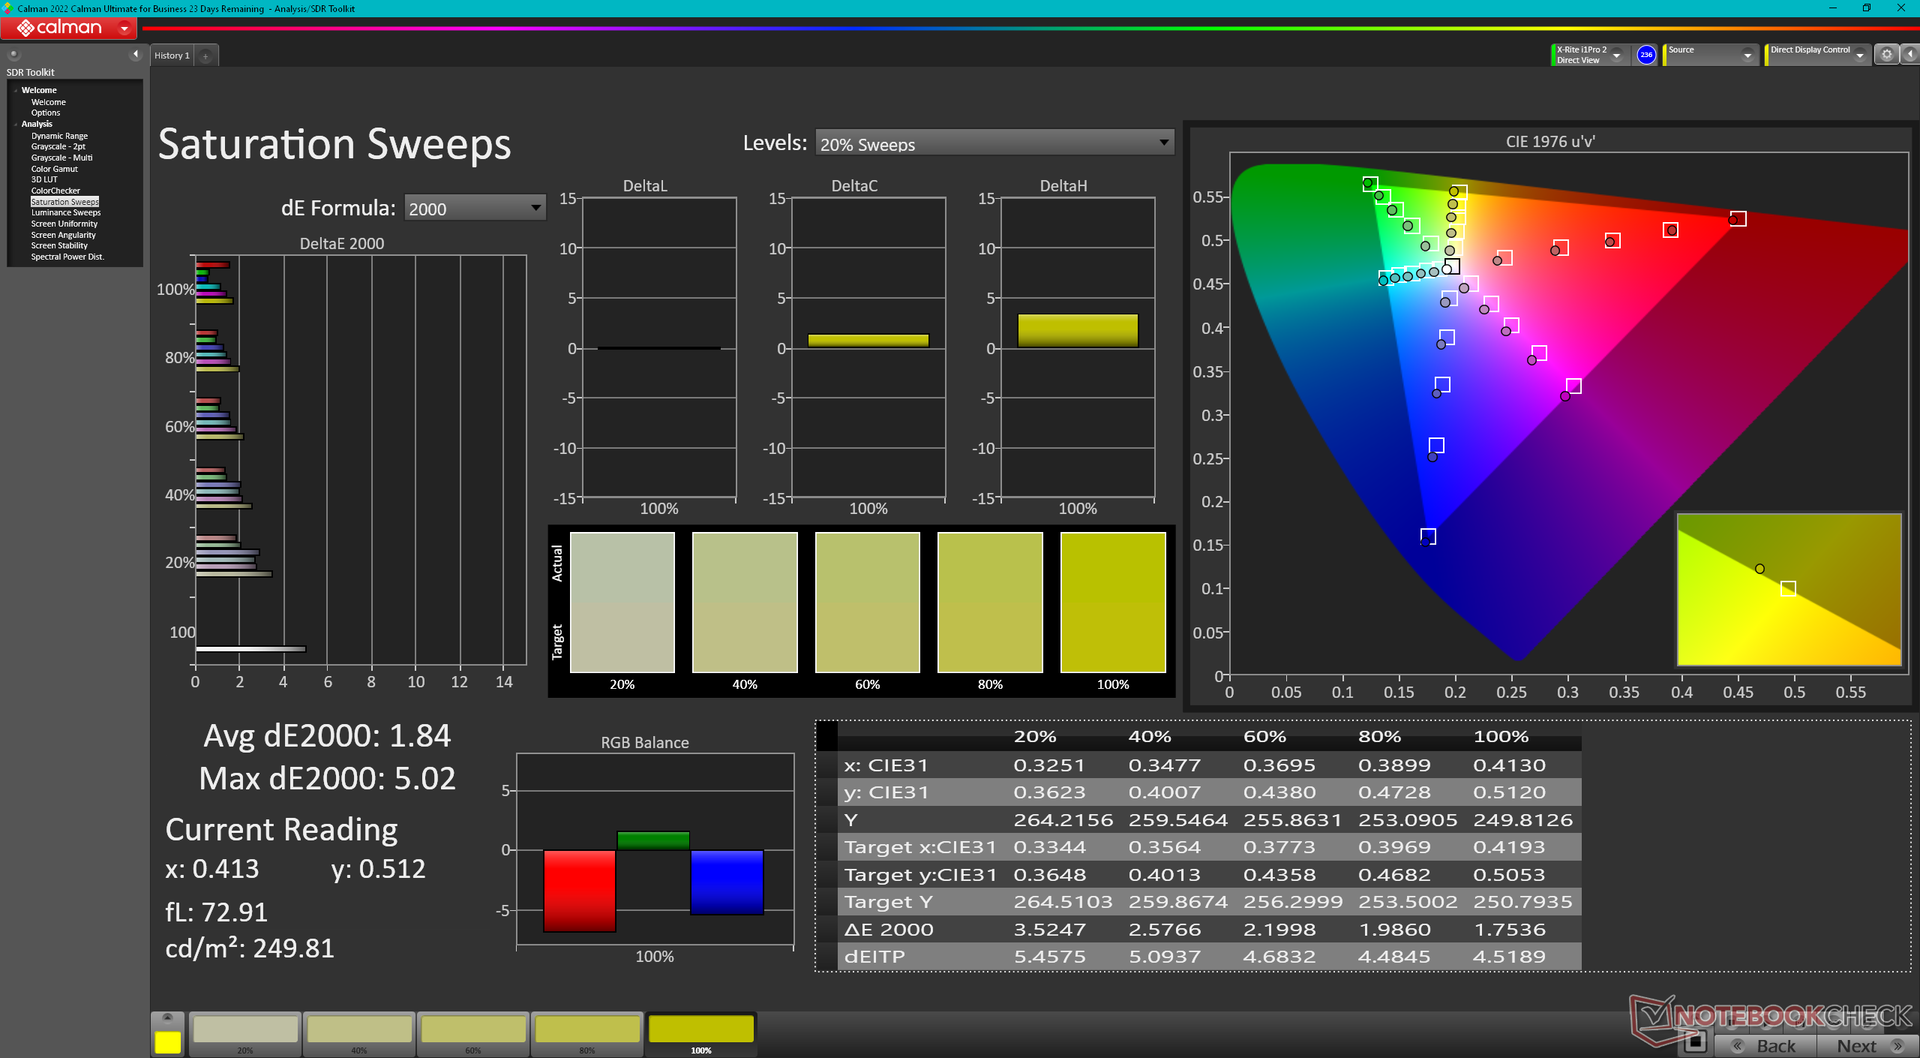
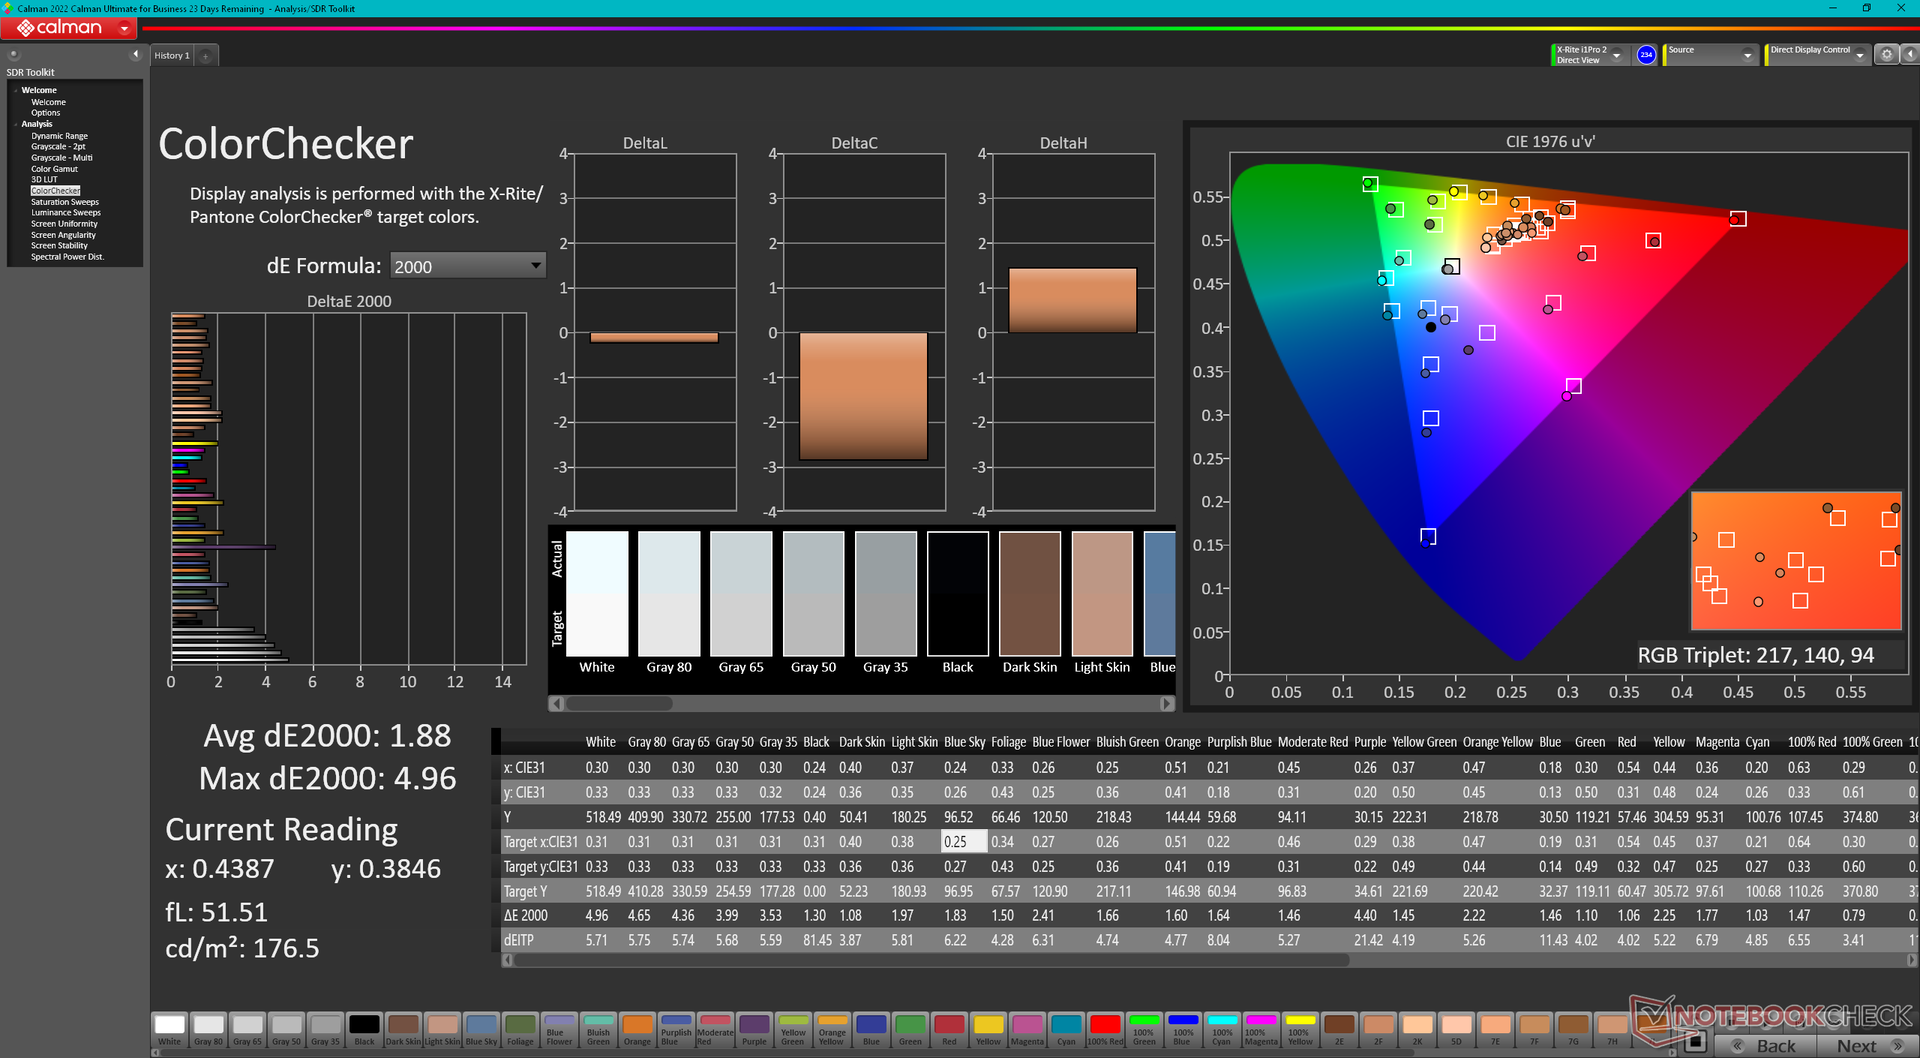
ΔE Color 1.88 | 0.5-29.43 Ø4.87, calibrated: 1.42
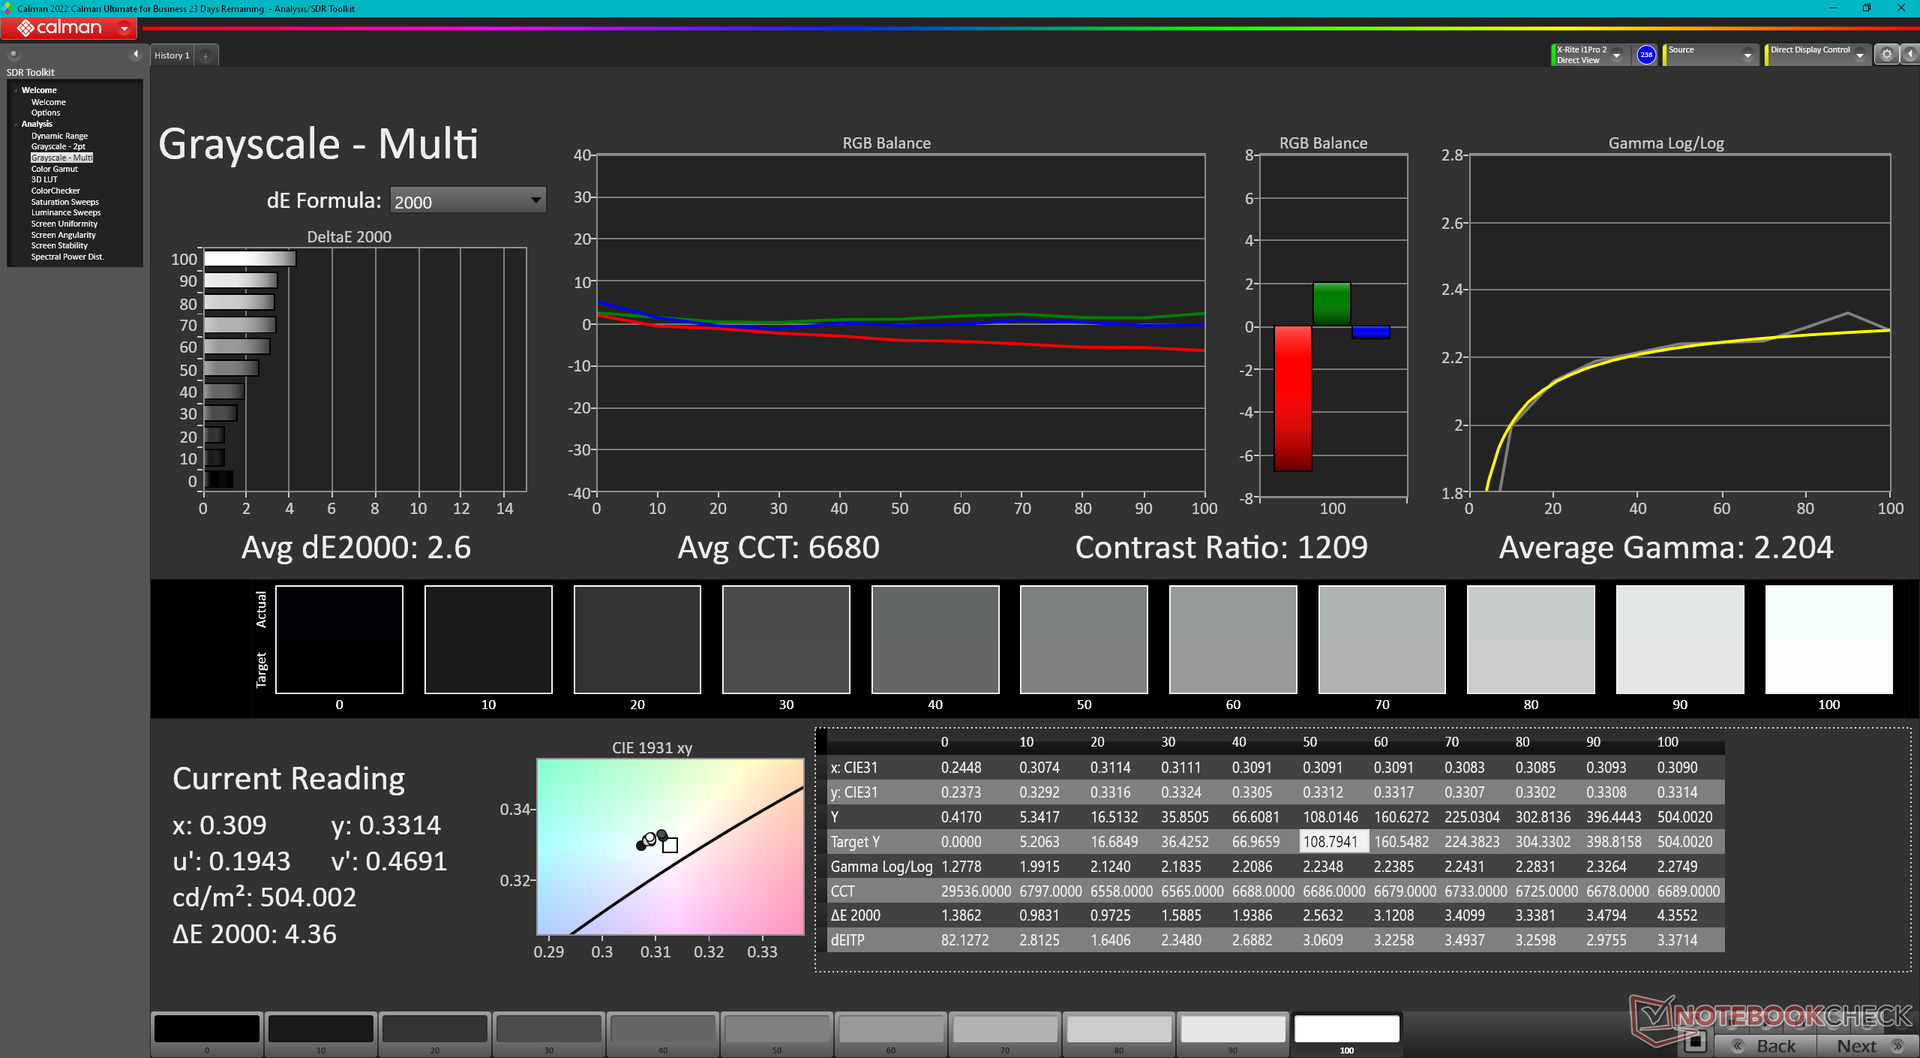
ΔE Greyscale 3.3 | 0.5-98 Ø5.1
69.2% AdobeRGB 1998 (Argyll 2.2.0 3D)
98.2% sRGB (Argyll 2.2.0 3D)
67.3% Display P3 (Argyll 2.2.0 3D)
Gamma: 2.24
| Maingear ML-16 MK2 TL160ADMP11-0, IPS, 2560x1600, 16", 240 Hz | Asus ROG Zephyrus G16 GA605WV ATNA60DL04-0, OLED, 2560x1600, 16", 240 Hz | HP Victus 16 (2024) Chi Mei CMN163E, IPS, 1920x1080, 16.1", 144 Hz | Alienware x16 R2 P120F BOE B160QAN, IPS, 2560x1600, 16", 240 Hz | Lenovo Legion Pro 5 16IRX9 BOE NE160QDM-NYC, IPS, 2560x1600, 16", 165 Hz | Razer Blade 16 2024, RTX 4090 Samsung SDC41AB (ATNA60DL03-0), OLED, 2560x1600, 16", 240 Hz | |
|---|---|---|---|---|---|---|
| Display | 30% | -38% | 25% | 2% | 29% | |
| Display P3 Coverage | 67.3 | 99.9 48% | 41.3 -39% | 98.3 46% | 69.3 3% | 99.1 47% |
| sRGB Coverage | 98.2 | 100 2% | 61.7 -37% | 100 2% | 99.4 1% | 99.9 2% |
| AdobeRGB 1998 Coverage | 69.2 | 96.9 40% | 42.7 -38% | 88.8 28% | 70.1 1% | 95.6 38% |
| Response Times | 98% | -117% | 42% | 4% | 97% | |
| Response Time Grey 50% / Grey 80% * | 12.5 ? | 0.22 ? 98% | 28.6 ? -129% | 3.9 ? 69% | 11.9 ? 5% | 0.24 ? 98% |
| Response Time Black / White * | 9.1 ? | 0.25 ? 97% | 18.7 ? -105% | 7.8 ? 14% | 8.9 ? 2% | 0.4 ? 96% |
| PWM Frequency | 960 | 960 | ||||
| Screen | 11% | -79% | -3% | 14% | 193% | |
| Brightness middle | 518.2 | 416 -20% | 287 -45% | 348.4 -33% | 384 -26% | 418 -19% |
| Brightness | 487 | 418 -14% | 288 -41% | 340 -30% | 366 -25% | 420 -14% |
| Brightness Distribution | 90 | 96 7% | 86 -4% | 90 0% | 91 1% | 98 9% |
| Black Level * | 0.4 | 0.19 52% | 0.33 17% | 0.35 12% | 0.02 95% | |
| Contrast | 1296 | 1511 17% | 1056 -19% | 1097 -15% | 20900 1513% | |
| Colorchecker dE 2000 * | 1.88 | 1.6 15% | 5.46 -190% | 2.68 -43% | 0.97 48% | 1.07 43% |
| Colorchecker dE 2000 max. * | 4.96 | 2.1 58% | 20.36 -310% | 4.14 17% | 3.57 28% | 4.04 19% |
| Colorchecker dE 2000 calibrated * | 1.42 | 3.52 -148% | 0.42 70% | 0.77 46% | 1.07 25% | |
| Greyscale dE 2000 * | 3.3 | 2.7 18% | 4.8 -45% | 3.4 -3% | 1.5 55% | 1.12 66% |
| Gamma | 2.24 98% | 2.16 102% | 2.108 104% | 2.41 91% | 2.24 98% | 2.29 96% |
| CCT | 7081 92% | 6331 103% | 6442 101% | 6083 107% | 6709 97% | 6417 101% |
| Całkowita średnia (program / ustawienia) | 46% /
32% | -78% /
-76% | 21% /
10% | 7% /
10% | 106% /
144% |
* ... im mniej tym lepiej
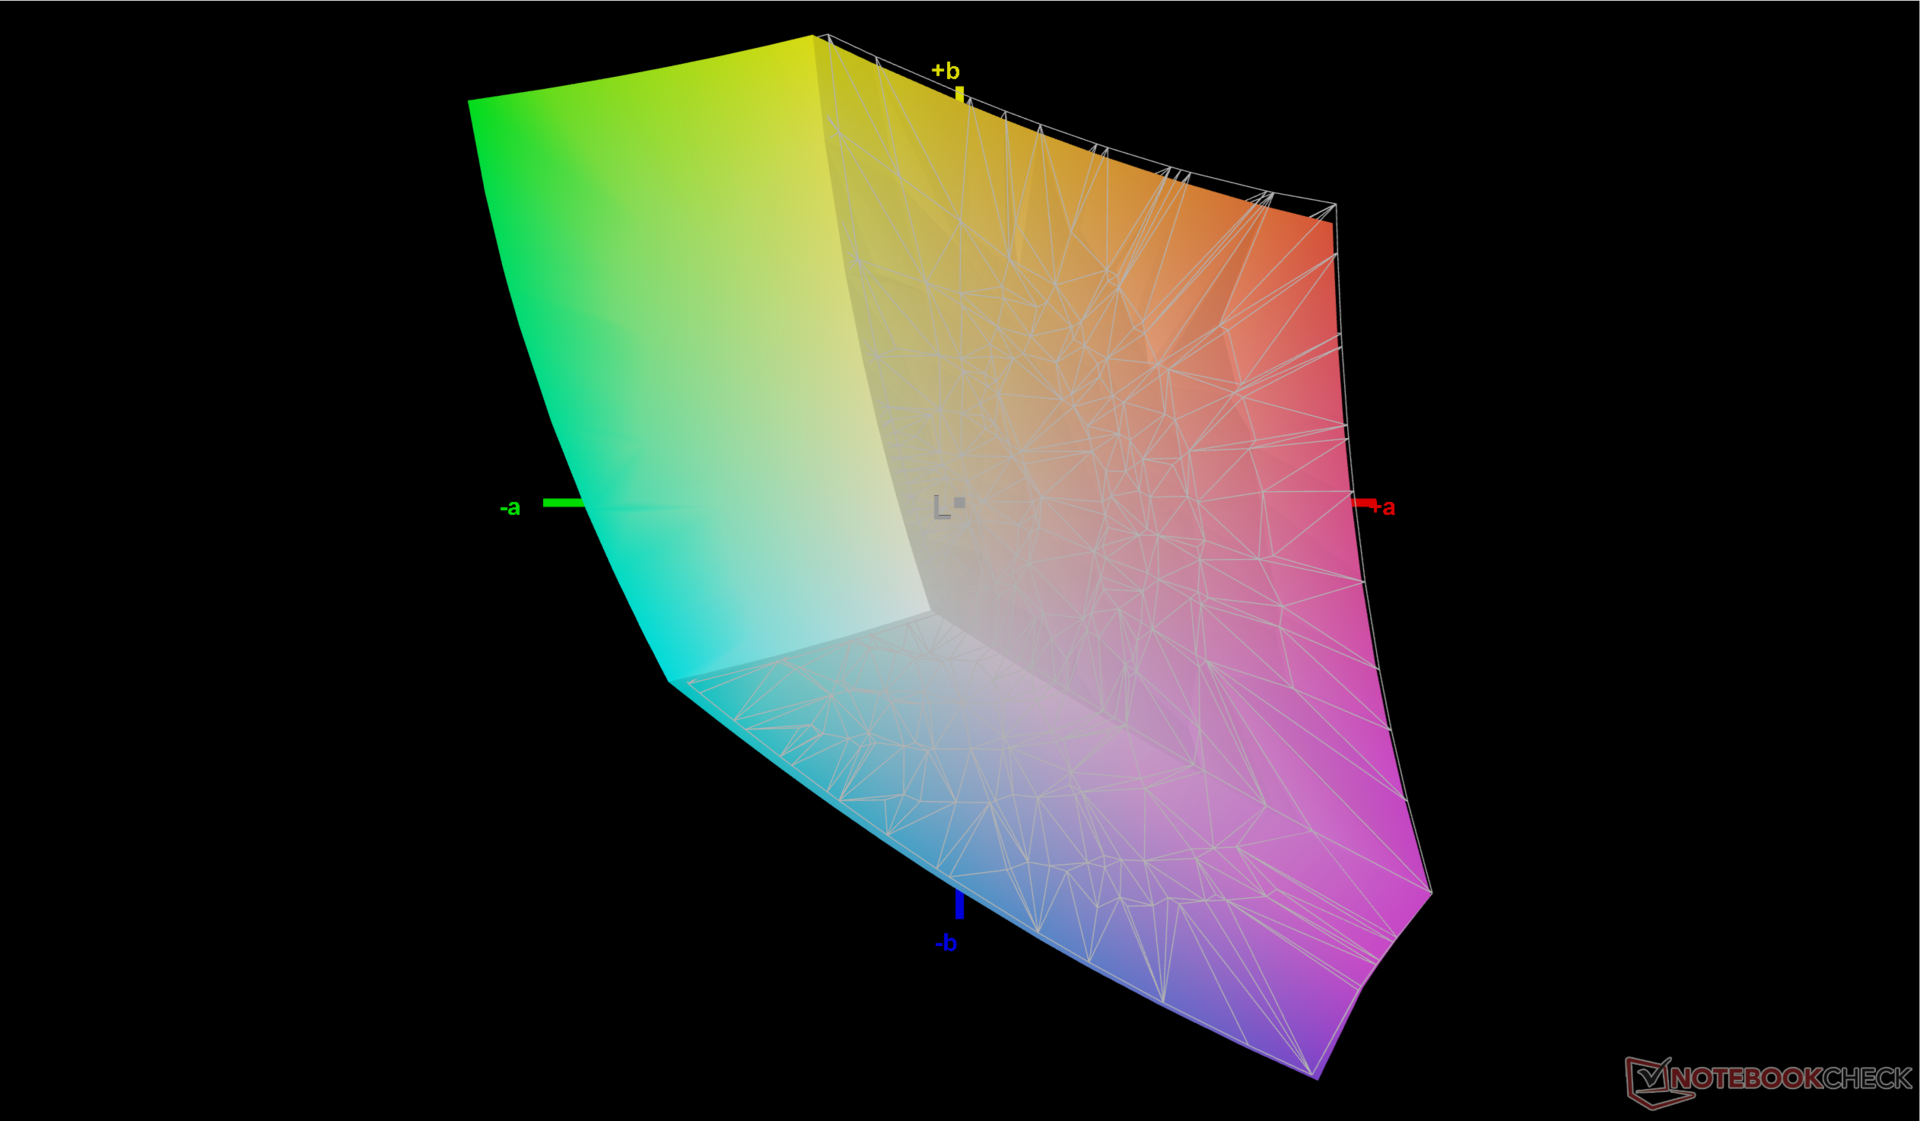
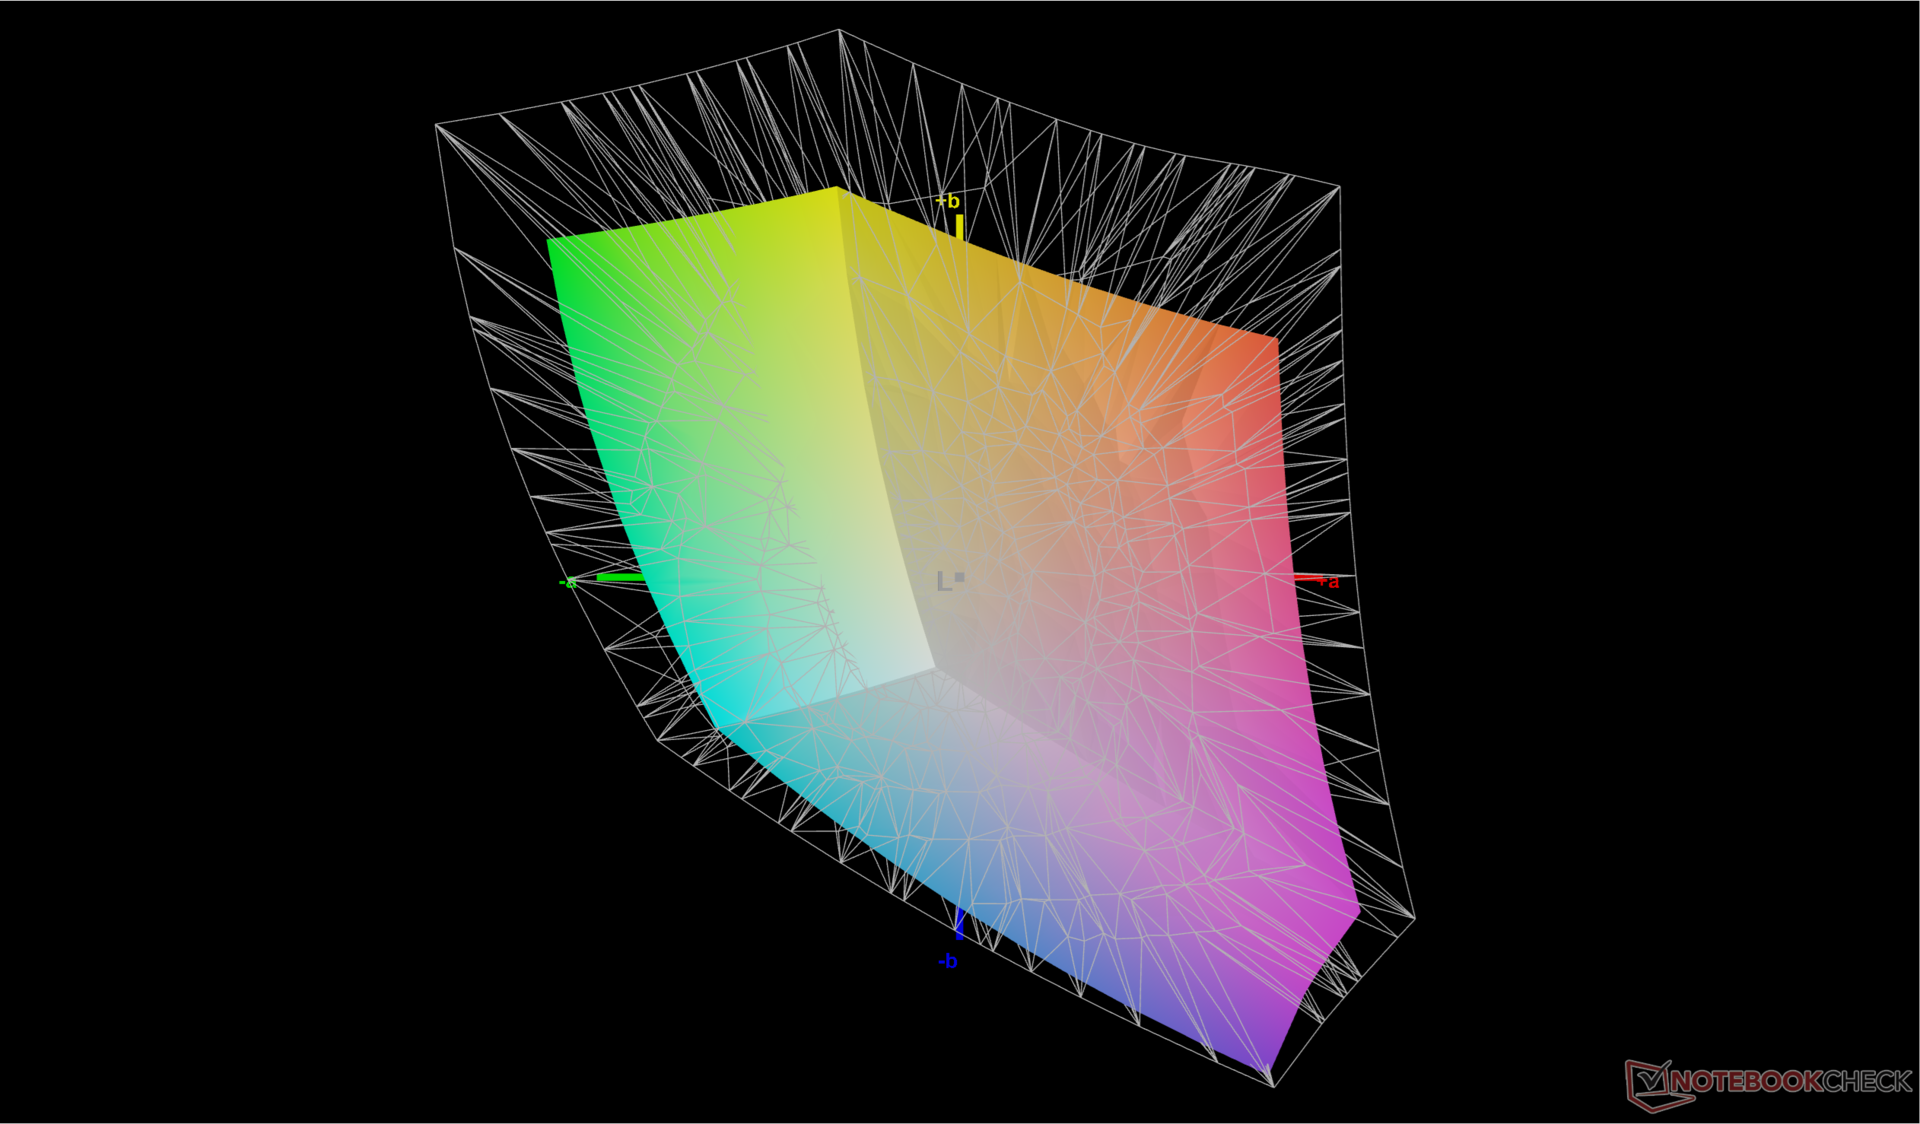
Chociaż wyświetlacz nie jest fabrycznie skalibrowany, średnie wartości DeltaE w skali szarości i kolorów są całkiem dobre po wyjęciu z pudełka i wynoszą odpowiednio 3,3 i 1,8. Temperatura barwowa jest nieco zbyt niska i wynosi prawie 7100, ale kalibracja za pomocą naszego kolorymetru X-Rite rozwiązuje ten problem, aby nieznacznie poprawić średnie wartości deltaE. Użytkownicy mogą bezpłatnie zastosować nasz skalibrowany profil ICM.

Wyświetl czasy reakcji
| ↔ Czas reakcji od czerni do bieli | ||
|---|---|---|
| 9.1 ms ... wzrost ↗ i spadek ↘ łącznie | ↗ 5 ms wzrost | 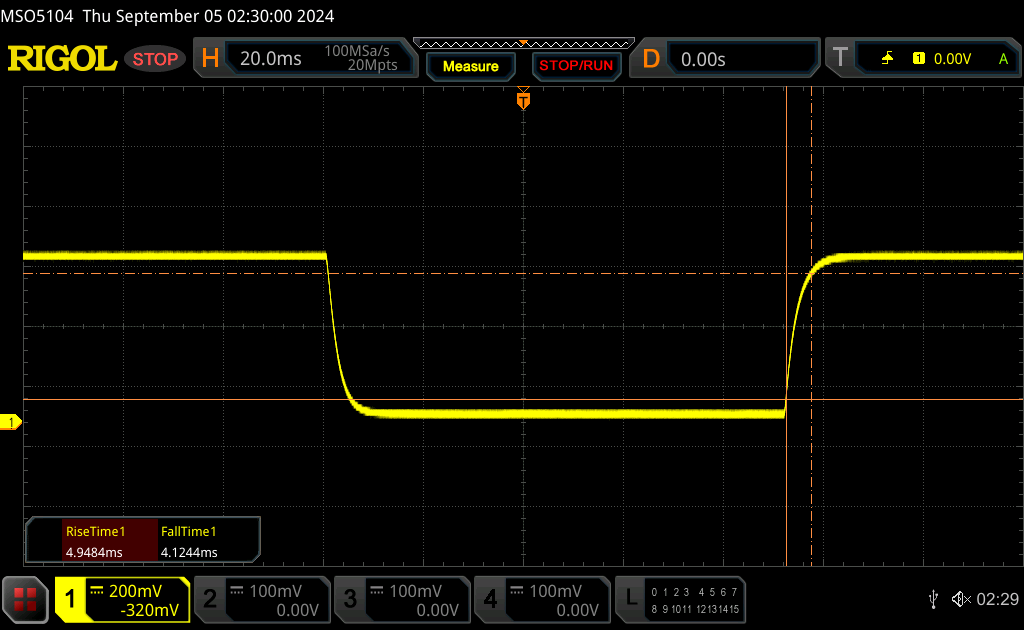 |
| ↘ 4.1 ms upadek | ||
| W naszych testach ekran wykazuje szybki czas reakcji i powinien nadawać się do gier. Dla porównania, wszystkie testowane urządzenia wahają się od 0.1 (minimum) do 240 (maksimum) ms. » 23 % wszystkich urządzeń jest lepszych. Oznacza to, że zmierzony czas reakcji jest lepszy od średniej wszystkich testowanych urządzeń (20.8 ms). | ||
| ↔ Czas reakcji 50% szarości do 80% szarości | ||
| 12.5 ms ... wzrost ↗ i spadek ↘ łącznie | ↗ 5.6 ms wzrost | 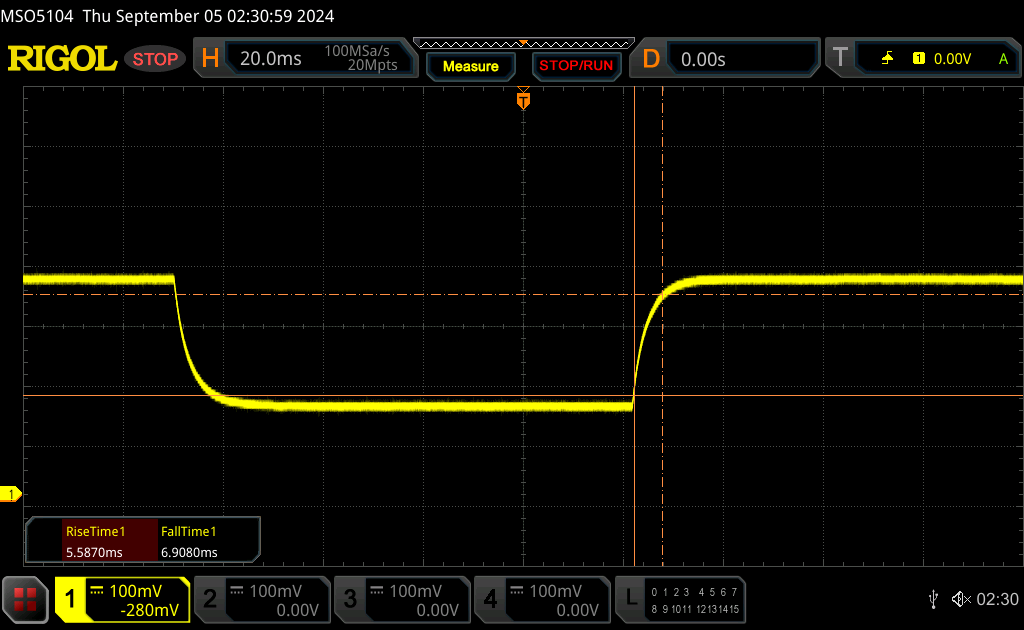 |
| ↘ 6.9 ms upadek | ||
| W naszych testach ekran wykazuje dobry współczynnik reakcji, ale może być zbyt wolny dla graczy rywalizujących ze sobą. Dla porównania, wszystkie testowane urządzenia wahają się od 0.165 (minimum) do 636 (maksimum) ms. » 23 % wszystkich urządzeń jest lepszych. Oznacza to, że zmierzony czas reakcji jest lepszy od średniej wszystkich testowanych urządzeń (32.5 ms). | ||
Migotanie ekranu / PWM (modulacja szerokości impulsu)
| Migotanie ekranu/nie wykryto PWM | 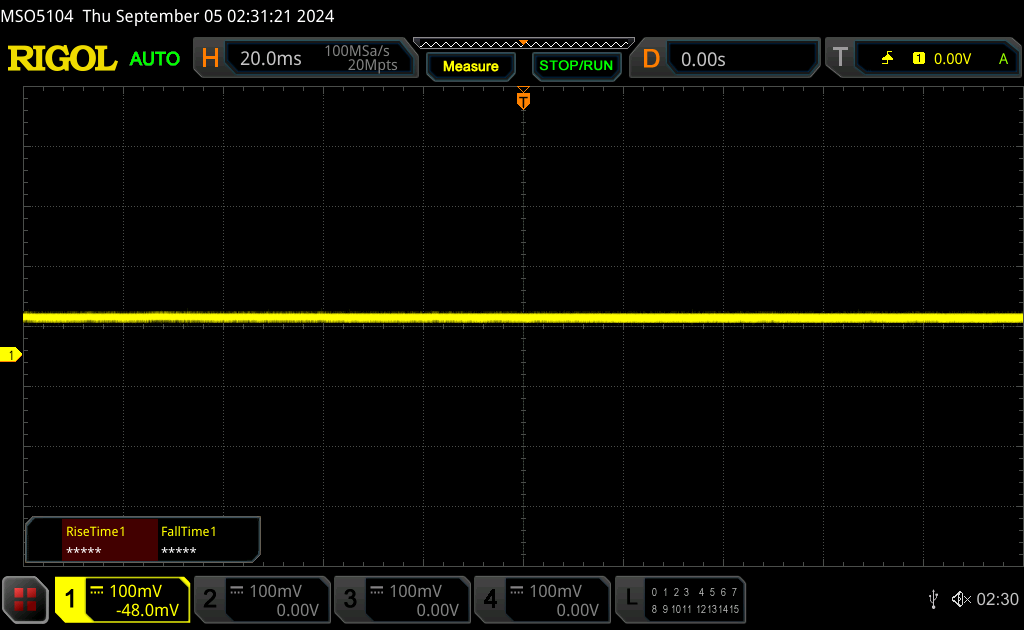 | ||
Dla porównania: 53 % wszystkich testowanych urządzeń nie używa PWM do przyciemniania wyświetlacza. Jeśli wykryto PWM, zmierzono średnio 8516 (minimum: 5 - maksimum: 343500) Hz. | |||
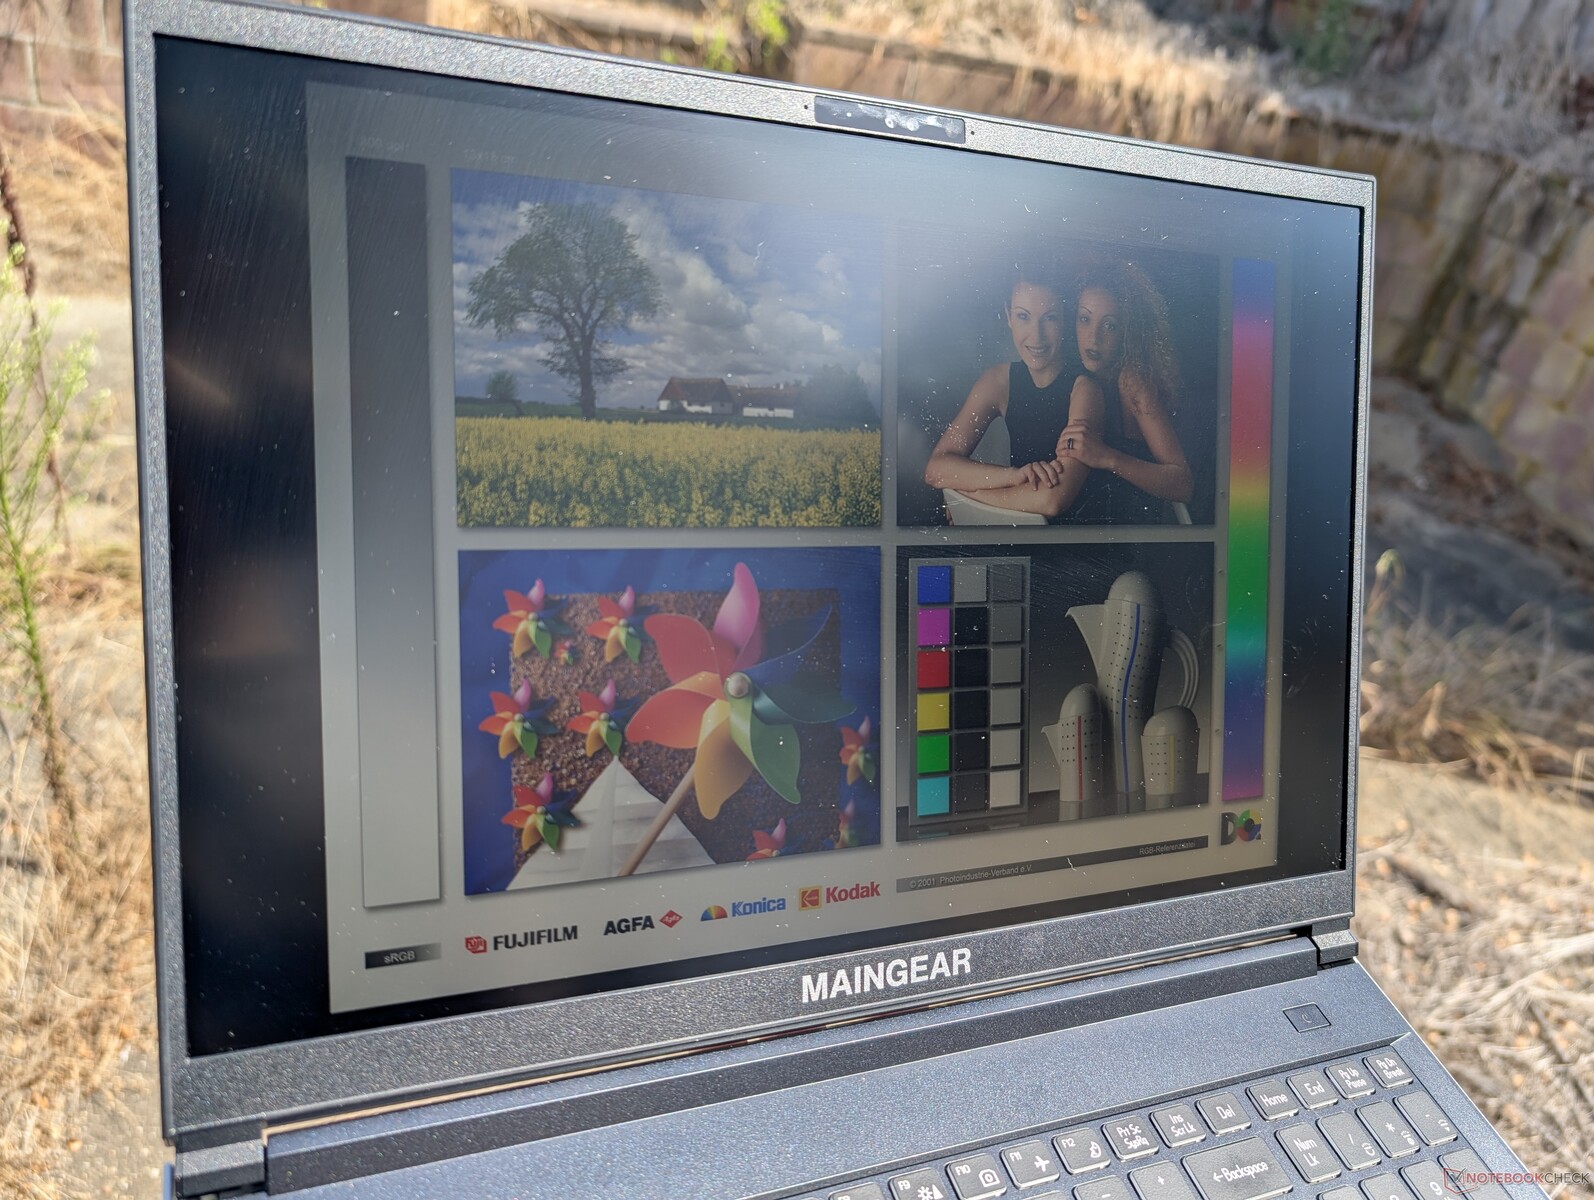
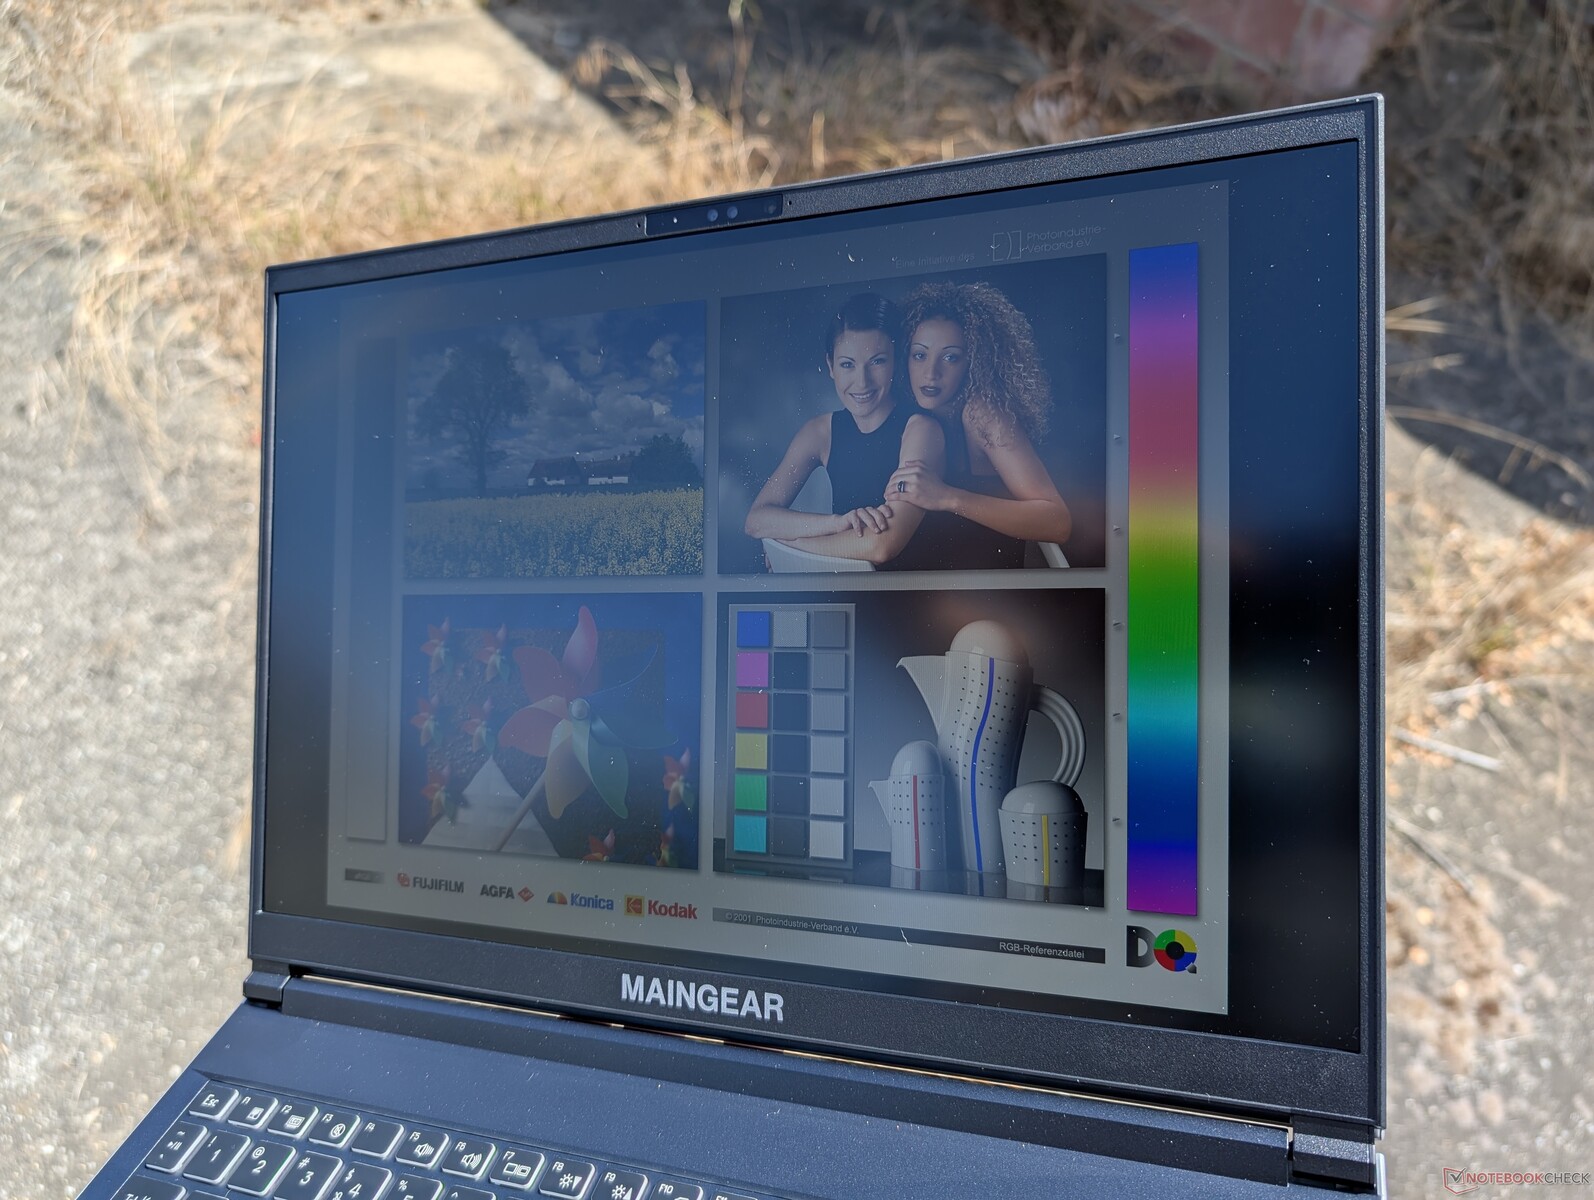
Widoczność na zewnątrz jest lepsza niż w przypadku większości innych 16-calowych laptopów do gier ze względu na stosunkowo jasne podświetlenie o jasności 500 nitów. The Victus 16, Alienware x16 R2 i Blade 16, na przykład, osiągają tylko 400 nitów lub nawet tylko 300 nitów, aby być zauważalnie ciemniejszymi. Nadal warto unikać bezpośredniego światła słonecznego, aby zachować kolory w jak największym stopniu.

Wydajność - odświeżenie Meteor Lake zamiast Raptor Lake
Warunki testowania
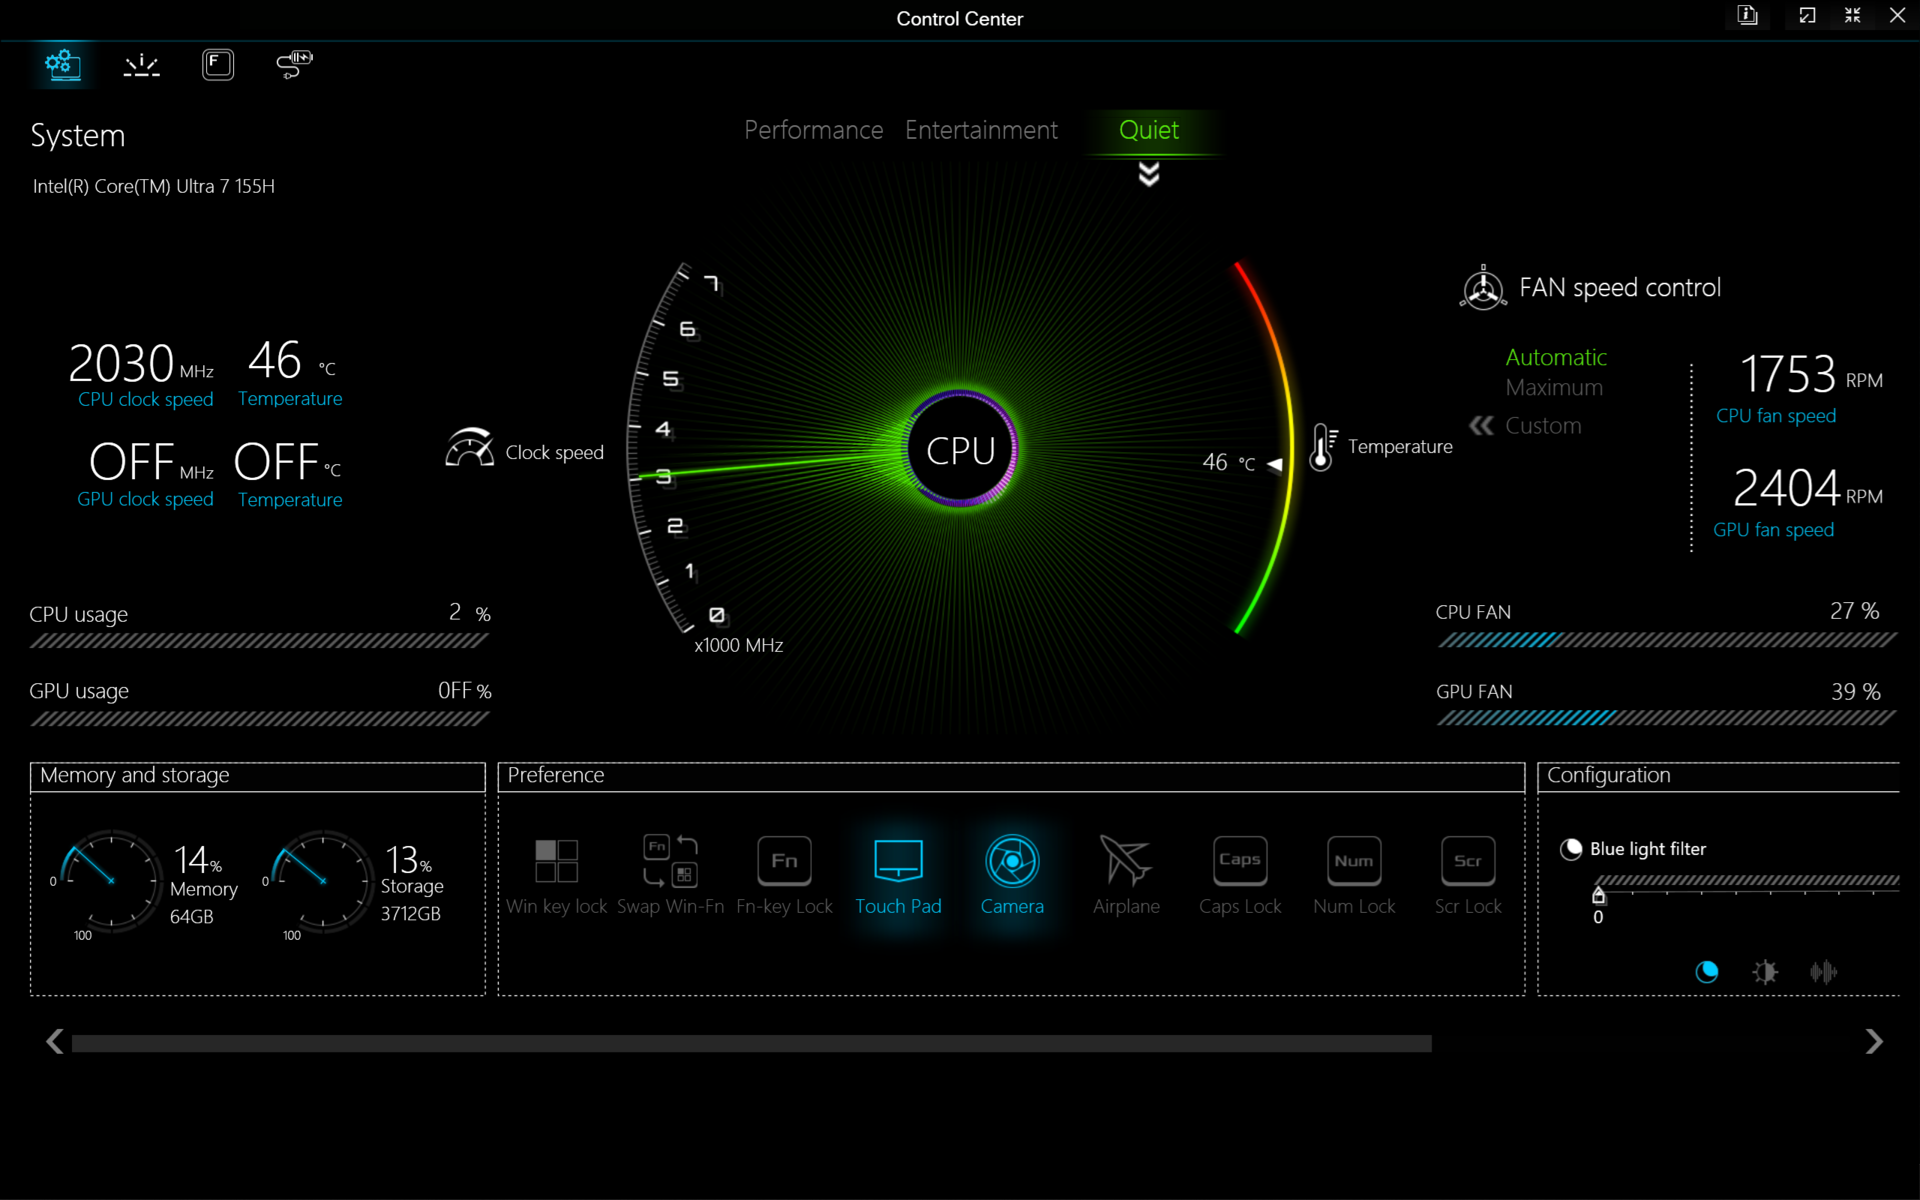
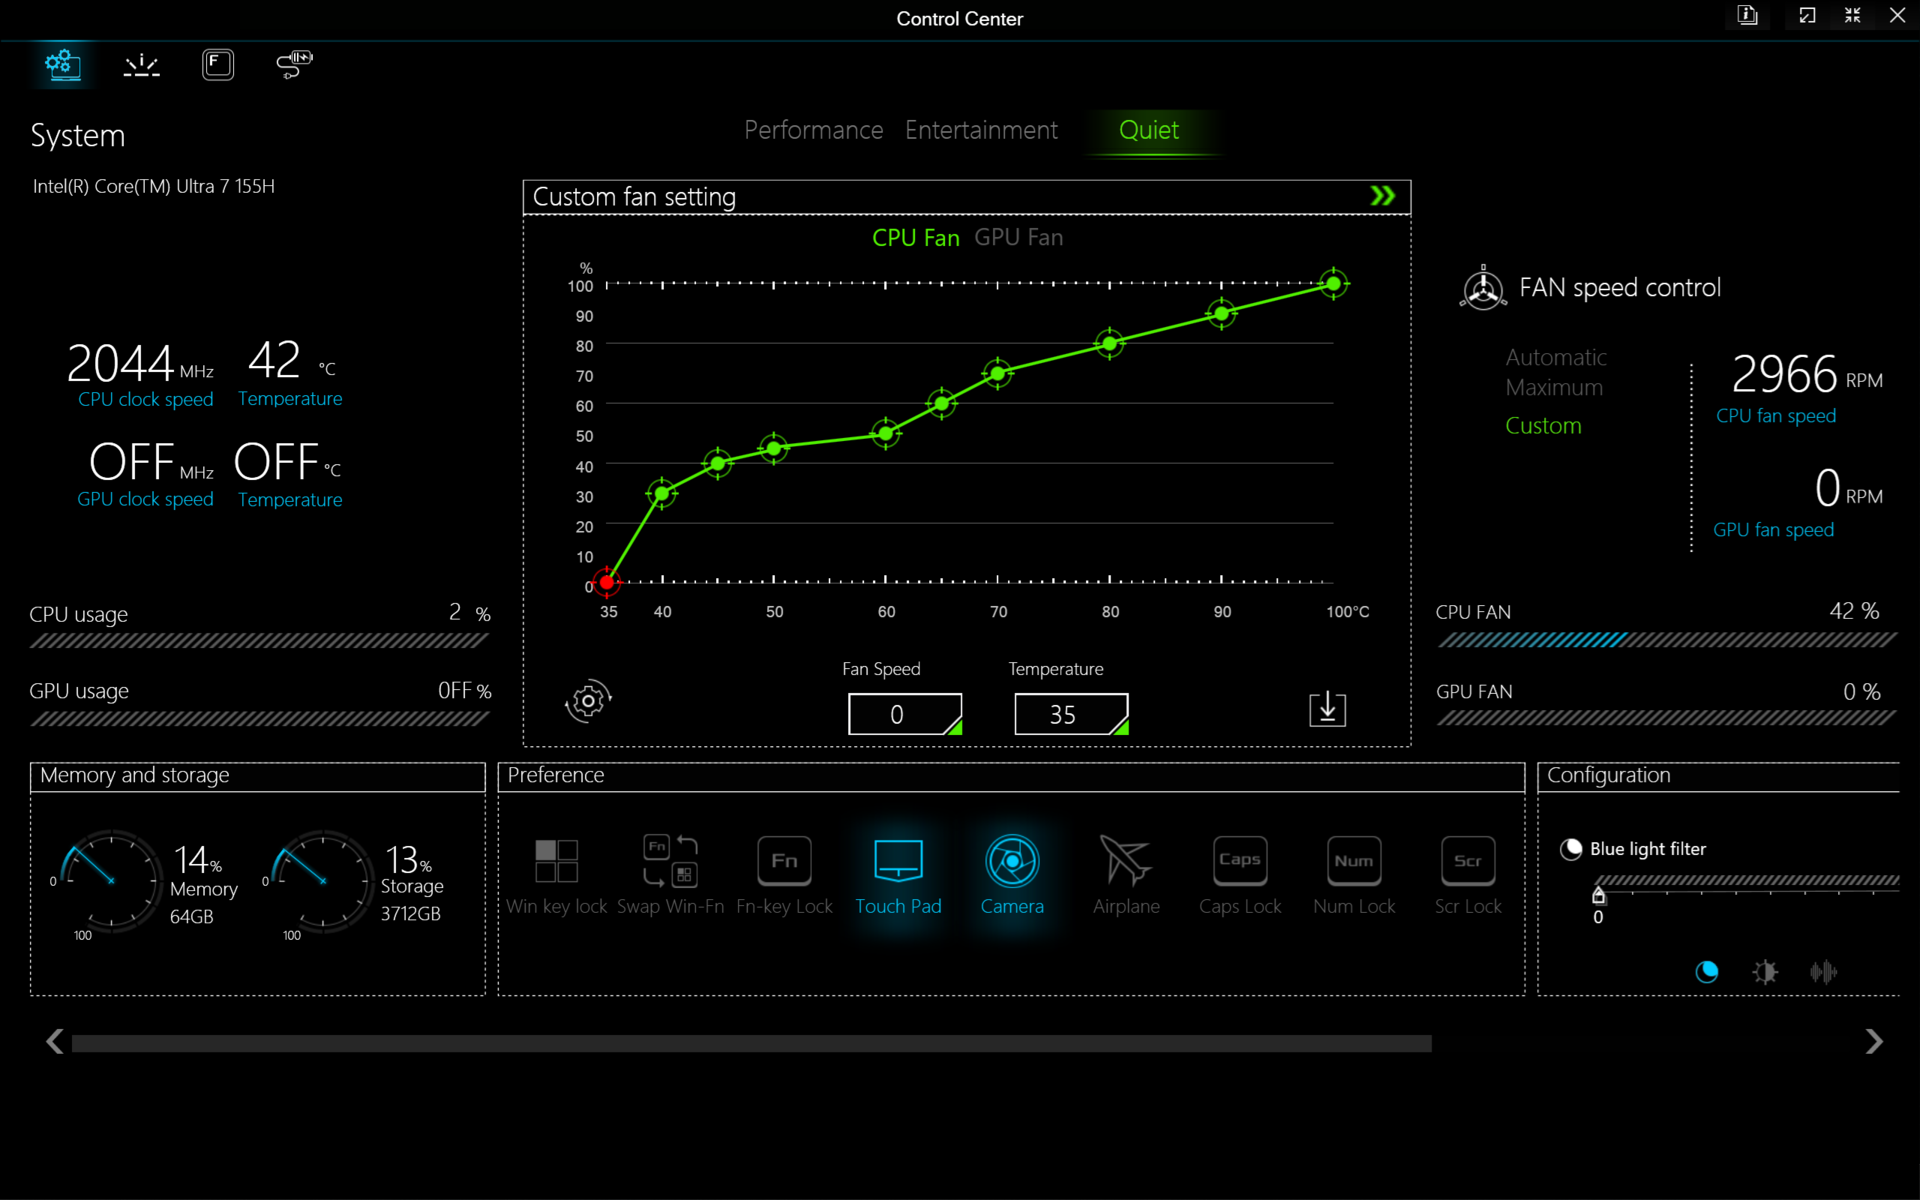
Przed uruchomieniem poniższych testów porównawczych ustawiliśmy system Windows i Centrum sterowania na tryb wydajności. Właściciele powinni zapoznać się z preinstalowanym oprogramowaniem Control Center, ponieważ jest to centrum regulacji kluczowych funkcji, w tym zachowania wentylatorów, elektronicznej migawki kamery, klawiszy RGB i ręcznego przełącznika GPU MUX. Proszę zauważyć, że ten ostatni jest irytująco ukryty w podmenu, do którego dostęp wymaga dodatkowego kliknięcia.
Obsługiwane są tylko standardowe Optimus i MUX, bez Advanced Optimus. W związku z tym podczas przełączania między trybami dGPU i MSHybrid wymagane jest ponowne uruchomienie komputera.

Procesor
Procesor Core Ultra 7 155H jest następcą Core i7-13700Hale wzrost wydajności jest stosunkowo marginalny i wynosi zaledwie od 5 do 15 procent. Wynika to z faktu, że nowa platforma Meteor Lake rezerwuje większość miejsca na matrycy dla nowego zintegrowanego NPU, więc surowe korzyści z wydajności zeszły w tym roku na dalszy plan. Procesor Core i7-14700HX zwiększyłby surową wydajność znacznie bardziej niż Core Ultra 7 155H, ale jest to również bardziej energochłonny procesor.
Zintegrowana jednostka NPU ma niestety bardzo ograniczone zastosowanie, ponieważ nie jest kompatybilna z Co-Pilot+; usługa Microsoftu wymaga co najmniej procesora Lunar Lake lub odpowiednika AMD/Qualcomm. Większość gier również nie wykorzystuje jeszcze NPU.
Cinebench R15 Multi Loop
Cinebench R23: Multi Core | Single Core
Cinebench R20: CPU (Multi Core) | CPU (Single Core)
Cinebench R15: CPU Multi 64Bit | CPU Single 64Bit
Blender: v2.79 BMW27 CPU
7-Zip 18.03: 7z b 4 | 7z b 4 -mmt1
Geekbench 6.4: Multi-Core | Single-Core
Geekbench 5.5: Multi-Core | Single-Core
HWBOT x265 Benchmark v2.2: 4k Preset
LibreOffice : 20 Documents To PDF
R Benchmark 2.5: Overall mean
| CPU Performance Rating | |
| Razer Blade 16 2024, RTX 4090 | |
| Asus ROG Zephyrus G16 GA605WV | |
| HP Victus 16 (2024) | |
| Asus TUF Gaming A16 FA617XS -2! | |
| MSI Stealth 16 Mercedes-AMG Motorsport A13VG | |
| Lenovo Legion Slim 7 16APH8 | |
| Dell Inspiron 16 Plus 7630 | |
| HP Victus 16-r0076TX -3! | |
| Alienware x16 R2 P120F | |
| Maingear ML-16 MK2 | |
| Przeciętny Intel Core Ultra 7 155H | |
| HP Victus 16-r0077ng | |
| CSL GameStar Notebook VenomGamer G16 | |
| HP Omen 16-n0033dx -2! | |
| Acer Nitro 16 AN16-41-R7YE | |
| Cinebench R23 / Multi Core | |
| Razer Blade 16 2024, RTX 4090 | |
| HP Victus 16 (2024) | |
| Asus ROG Zephyrus G16 GA605WV | |
| MSI Stealth 16 Mercedes-AMG Motorsport A13VG | |
| Alienware x16 R2 P120F | |
| HP Victus 16-r0076TX | |
| Maingear ML-16 MK2 | |
| Asus TUF Gaming A16 FA617XS | |
| Lenovo Legion Slim 7 16APH8 | |
| Dell Inspiron 16 Plus 7630 | |
| HP Victus 16-r0077ng | |
| Przeciętny Intel Core Ultra 7 155H (9769 - 19007, n=52) | |
| CSL GameStar Notebook VenomGamer G16 | |
| HP Omen 16-n0033dx | |
| Acer Nitro 16 AN16-41-R7YE | |
| Cinebench R23 / Single Core | |
| Razer Blade 16 2024, RTX 4090 | |
| MSI Stealth 16 Mercedes-AMG Motorsport A13VG | |
| Asus ROG Zephyrus G16 GA605WV | |
| Dell Inspiron 16 Plus 7630 | |
| Asus TUF Gaming A16 FA617XS | |
| Lenovo Legion Slim 7 16APH8 | |
| Przeciętny Intel Core Ultra 7 155H (1496 - 1815, n=52) | |
| HP Victus 16 (2024) | |
| HP Victus 16-r0076TX | |
| HP Victus 16-r0077ng | |
| Maingear ML-16 MK2 | |
| Alienware x16 R2 P120F | |
| CSL GameStar Notebook VenomGamer G16 | |
| HP Omen 16-n0033dx | |
| Acer Nitro 16 AN16-41-R7YE | |
| Cinebench R20 / CPU (Multi Core) | |
| Razer Blade 16 2024, RTX 4090 | |
| HP Victus 16 (2024) | |
| Asus ROG Zephyrus G16 GA605WV | |
| MSI Stealth 16 Mercedes-AMG Motorsport A13VG | |
| Alienware x16 R2 P120F | |
| HP Victus 16-r0076TX | |
| Maingear ML-16 MK2 | |
| Asus TUF Gaming A16 FA617XS | |
| Lenovo Legion Slim 7 16APH8 | |
| Dell Inspiron 16 Plus 7630 | |
| HP Victus 16-r0077ng | |
| Przeciętny Intel Core Ultra 7 155H (3798 - 7409, n=50) | |
| CSL GameStar Notebook VenomGamer G16 | |
| HP Omen 16-n0033dx | |
| Acer Nitro 16 AN16-41-R7YE | |
| Cinebench R20 / CPU (Single Core) | |
| Razer Blade 16 2024, RTX 4090 | |
| Asus ROG Zephyrus G16 GA605WV | |
| MSI Stealth 16 Mercedes-AMG Motorsport A13VG | |
| Dell Inspiron 16 Plus 7630 | |
| Asus TUF Gaming A16 FA617XS | |
| Lenovo Legion Slim 7 16APH8 | |
| Przeciętny Intel Core Ultra 7 155H (601 - 696, n=50) | |
| HP Victus 16 (2024) | |
| HP Victus 16-r0077ng | |
| HP Victus 16-r0076TX | |
| Maingear ML-16 MK2 | |
| Alienware x16 R2 P120F | |
| HP Omen 16-n0033dx | |
| CSL GameStar Notebook VenomGamer G16 | |
| Acer Nitro 16 AN16-41-R7YE | |
| Cinebench R15 / CPU Multi 64Bit | |
| Razer Blade 16 2024, RTX 4090 | |
| HP Victus 16 (2024) | |
| Asus ROG Zephyrus G16 GA605WV | |
| MSI Stealth 16 Mercedes-AMG Motorsport A13VG | |
| HP Victus 16-r0076TX | |
| Alienware x16 R2 P120F | |
| Maingear ML-16 MK2 | |
| Asus TUF Gaming A16 FA617XS | |
| Lenovo Legion Slim 7 16APH8 | |
| Przeciętny Intel Core Ultra 7 155H (1932 - 2880, n=56) | |
| Dell Inspiron 16 Plus 7630 | |
| HP Victus 16-r0077ng | |
| CSL GameStar Notebook VenomGamer G16 | |
| HP Omen 16-n0033dx | |
| Acer Nitro 16 AN16-41-R7YE | |
| Cinebench R15 / CPU Single 64Bit | |
| Razer Blade 16 2024, RTX 4090 | |
| Asus ROG Zephyrus G16 GA605WV | |
| Asus TUF Gaming A16 FA617XS | |
| MSI Stealth 16 Mercedes-AMG Motorsport A13VG | |
| Lenovo Legion Slim 7 16APH8 | |
| Dell Inspiron 16 Plus 7630 | |
| CSL GameStar Notebook VenomGamer G16 | |
| Przeciętny Intel Core Ultra 7 155H (99.6 - 268, n=52) | |
| HP Victus 16-r0077ng | |
| HP Omen 16-n0033dx | |
| HP Victus 16-r0076TX | |
| Maingear ML-16 MK2 | |
| Acer Nitro 16 AN16-41-R7YE | |
| HP Victus 16 (2024) | |
| Alienware x16 R2 P120F | |
| Blender / v2.79 BMW27 CPU | |
| Acer Nitro 16 AN16-41-R7YE | |
| HP Omen 16-n0033dx | |
| Przeciętny Intel Core Ultra 7 155H (175 - 381, n=47) | |
| MSI Stealth 16 Mercedes-AMG Motorsport A13VG | |
| Maingear ML-16 MK2 | |
| Dell Inspiron 16 Plus 7630 | |
| HP Victus 16-r0077ng | |
| CSL GameStar Notebook VenomGamer G16 | |
| Lenovo Legion Slim 7 16APH8 | |
| HP Victus 16-r0076TX | |
| Asus TUF Gaming A16 FA617XS | |
| Alienware x16 R2 P120F | |
| HP Victus 16 (2024) | |
| Asus ROG Zephyrus G16 GA605WV | |
| Razer Blade 16 2024, RTX 4090 | |
| 7-Zip 18.03 / 7z b 4 | |
| Razer Blade 16 2024, RTX 4090 | |
| HP Victus 16 (2024) | |
| Asus ROG Zephyrus G16 GA605WV | |
| HP Victus 16-r0076TX | |
| Lenovo Legion Slim 7 16APH8 | |
| Asus TUF Gaming A16 FA617XS | |
| Alienware x16 R2 P120F | |
| HP Victus 16-r0077ng | |
| Maingear ML-16 MK2 | |
| CSL GameStar Notebook VenomGamer G16 | |
| Dell Inspiron 16 Plus 7630 | |
| Przeciętny Intel Core Ultra 7 155H (41739 - 70254, n=50) | |
| HP Omen 16-n0033dx | |
| MSI Stealth 16 Mercedes-AMG Motorsport A13VG | |
| Acer Nitro 16 AN16-41-R7YE | |
| 7-Zip 18.03 / 7z b 4 -mmt1 | |
| Razer Blade 16 2024, RTX 4090 | |
| Asus TUF Gaming A16 FA617XS | |
| Lenovo Legion Slim 7 16APH8 | |
| MSI Stealth 16 Mercedes-AMG Motorsport A13VG | |
| Asus ROG Zephyrus G16 GA605WV | |
| CSL GameStar Notebook VenomGamer G16 | |
| Dell Inspiron 16 Plus 7630 | |
| Acer Nitro 16 AN16-41-R7YE | |
| HP Omen 16-n0033dx | |
| HP Victus 16 (2024) | |
| HP Victus 16-r0077ng | |
| HP Victus 16-r0076TX | |
| Przeciętny Intel Core Ultra 7 155H (4594 - 5621, n=50) | |
| Maingear ML-16 MK2 | |
| Alienware x16 R2 P120F | |
| Geekbench 6.4 / Multi-Core | |
| Razer Blade 16 2024, RTX 4090 | |
| Asus ROG Zephyrus G16 GA605WV | |
| HP Victus 16 (2024) | |
| Dell Inspiron 16 Plus 7630 | |
| Lenovo Legion Slim 7 16APH8 | |
| Alienware x16 R2 P120F | |
| Przeciętny Intel Core Ultra 7 155H (7732 - 13656, n=55) | |
| MSI Stealth 16 Mercedes-AMG Motorsport A13VG | |
| Maingear ML-16 MK2 | |
| HP Victus 16-r0077ng | |
| CSL GameStar Notebook VenomGamer G16 | |
| Acer Nitro 16 AN16-41-R7YE | |
| Geekbench 6.4 / Single-Core | |
| Razer Blade 16 2024, RTX 4090 | |
| Asus ROG Zephyrus G16 GA605WV | |
| MSI Stealth 16 Mercedes-AMG Motorsport A13VG | |
| Dell Inspiron 16 Plus 7630 | |
| Lenovo Legion Slim 7 16APH8 | |
| HP Victus 16-r0077ng | |
| HP Victus 16 (2024) | |
| Przeciętny Intel Core Ultra 7 155H (1901 - 2473, n=52) | |
| Maingear ML-16 MK2 | |
| Alienware x16 R2 P120F | |
| CSL GameStar Notebook VenomGamer G16 | |
| Acer Nitro 16 AN16-41-R7YE | |
| Geekbench 5.5 / Multi-Core | |
| Razer Blade 16 2024, RTX 4090 | |
| HP Victus 16 (2024) | |
| Asus ROG Zephyrus G16 GA605WV | |
| Dell Inspiron 16 Plus 7630 | |
| Alienware x16 R2 P120F | |
| HP Victus 16-r0076TX | |
| Maingear ML-16 MK2 | |
| Asus TUF Gaming A16 FA617XS | |
| Przeciętny Intel Core Ultra 7 155H (10017 - 13556, n=52) | |
| Lenovo Legion Slim 7 16APH8 | |
| HP Victus 16-r0077ng | |
| MSI Stealth 16 Mercedes-AMG Motorsport A13VG | |
| CSL GameStar Notebook VenomGamer G16 | |
| HP Omen 16-n0033dx | |
| Acer Nitro 16 AN16-41-R7YE | |
| Geekbench 5.5 / Single-Core | |
| Razer Blade 16 2024, RTX 4090 | |
| Asus ROG Zephyrus G16 GA605WV | |
| Asus TUF Gaming A16 FA617XS | |
| MSI Stealth 16 Mercedes-AMG Motorsport A13VG | |
| Lenovo Legion Slim 7 16APH8 | |
| Dell Inspiron 16 Plus 7630 | |
| Przeciętny Intel Core Ultra 7 155H (1462 - 1824, n=52) | |
| HP Victus 16 (2024) | |
| Alienware x16 R2 P120F | |
| HP Victus 16-r0076TX | |
| HP Victus 16-r0077ng | |
| Maingear ML-16 MK2 | |
| CSL GameStar Notebook VenomGamer G16 | |
| HP Omen 16-n0033dx | |
| Acer Nitro 16 AN16-41-R7YE | |
| HWBOT x265 Benchmark v2.2 / 4k Preset | |
| Razer Blade 16 2024, RTX 4090 | |
| Asus ROG Zephyrus G16 GA605WV | |
| HP Victus 16 (2024) | |
| Asus TUF Gaming A16 FA617XS | |
| Alienware x16 R2 P120F | |
| HP Victus 16-r0076TX | |
| Lenovo Legion Slim 7 16APH8 | |
| CSL GameStar Notebook VenomGamer G16 | |
| Maingear ML-16 MK2 | |
| HP Victus 16-r0077ng | |
| Przeciętny Intel Core Ultra 7 155H (9.93 - 21.2, n=50) | |
| HP Omen 16-n0033dx | |
| Dell Inspiron 16 Plus 7630 | |
| MSI Stealth 16 Mercedes-AMG Motorsport A13VG | |
| Acer Nitro 16 AN16-41-R7YE | |
| LibreOffice / 20 Documents To PDF | |
| Lenovo Legion Slim 7 16APH8 | |
| CSL GameStar Notebook VenomGamer G16 | |
| HP Victus 16-r0077ng | |
| HP Omen 16-n0033dx | |
| MSI Stealth 16 Mercedes-AMG Motorsport A13VG | |
| HP Victus 16 (2024) | |
| Asus ROG Zephyrus G16 GA605WV | |
| Przeciętny Intel Core Ultra 7 155H (37.5 - 79.2, n=49) | |
| Razer Blade 16 2024, RTX 4090 | |
| Acer Nitro 16 AN16-41-R7YE | |
| Alienware x16 R2 P120F | |
| Dell Inspiron 16 Plus 7630 | |
| Maingear ML-16 MK2 | |
| Asus TUF Gaming A16 FA617XS | |
| R Benchmark 2.5 / Overall mean | |
| Maingear ML-16 MK2 | |
| HP Victus 16-r0077ng | |
| Acer Nitro 16 AN16-41-R7YE | |
| Alienware x16 R2 P120F | |
| HP Omen 16-n0033dx | |
| HP Victus 16 (2024) | |
| HP Victus 16-r0076TX | |
| CSL GameStar Notebook VenomGamer G16 | |
| Przeciętny Intel Core Ultra 7 155H (0.4457 - 0.53, n=49) | |
| Lenovo Legion Slim 7 16APH8 | |
| Dell Inspiron 16 Plus 7630 | |
| MSI Stealth 16 Mercedes-AMG Motorsport A13VG | |
| Asus TUF Gaming A16 FA617XS | |
| Asus ROG Zephyrus G16 GA605WV | |
| Razer Blade 16 2024, RTX 4090 | |
Cinebench R23: Multi Core | Single Core
Cinebench R20: CPU (Multi Core) | CPU (Single Core)
Cinebench R15: CPU Multi 64Bit | CPU Single 64Bit
Blender: v2.79 BMW27 CPU
7-Zip 18.03: 7z b 4 | 7z b 4 -mmt1
Geekbench 6.4: Multi-Core | Single-Core
Geekbench 5.5: Multi-Core | Single-Core
HWBOT x265 Benchmark v2.2: 4k Preset
LibreOffice : 20 Documents To PDF
R Benchmark 2.5: Overall mean
* ... im mniej tym lepiej
AIDA64: FP32 Ray-Trace | FPU Julia | CPU SHA3 | CPU Queen | FPU SinJulia | FPU Mandel | CPU AES | CPU ZLib | FP64 Ray-Trace | CPU PhotoWorxx
| Performance Rating | |
| Asus ROG Zephyrus G16 GA605WV | |
| Razer Blade 16 2024, RTX 4090 | |
| Lenovo Legion Pro 5 16IRX9 | |
| Alienware x16 R2 P120F | |
| HP Victus 16 (2024) | |
| Maingear ML-16 MK2 | |
| Przeciętny Intel Core Ultra 7 155H | |
| AIDA64 / FP32 Ray-Trace | |
| Asus ROG Zephyrus G16 GA605WV | |
| Razer Blade 16 2024, RTX 4090 | |
| Lenovo Legion Pro 5 16IRX9 | |
| Alienware x16 R2 P120F | |
| HP Victus 16 (2024) | |
| Maingear ML-16 MK2 | |
| Przeciętny Intel Core Ultra 7 155H (6670 - 18470, n=50) | |
| AIDA64 / FPU Julia | |
| Asus ROG Zephyrus G16 GA605WV | |
| Lenovo Legion Pro 5 16IRX9 | |
| Razer Blade 16 2024, RTX 4090 | |
| Alienware x16 R2 P120F | |
| HP Victus 16 (2024) | |
| Maingear ML-16 MK2 | |
| Przeciętny Intel Core Ultra 7 155H (40905 - 93181, n=50) | |
| AIDA64 / CPU SHA3 | |
| Lenovo Legion Pro 5 16IRX9 | |
| Razer Blade 16 2024, RTX 4090 | |
| Asus ROG Zephyrus G16 GA605WV | |
| Alienware x16 R2 P120F | |
| HP Victus 16 (2024) | |
| Maingear ML-16 MK2 | |
| Przeciętny Intel Core Ultra 7 155H (1940 - 4436, n=50) | |
| AIDA64 / CPU Queen | |
| Lenovo Legion Pro 5 16IRX9 | |
| Razer Blade 16 2024, RTX 4090 | |
| HP Victus 16 (2024) | |
| Alienware x16 R2 P120F | |
| Asus ROG Zephyrus G16 GA605WV | |
| Maingear ML-16 MK2 | |
| Przeciętny Intel Core Ultra 7 155H (64698 - 94181, n=50) | |
| AIDA64 / FPU SinJulia | |
| Asus ROG Zephyrus G16 GA605WV | |
| Razer Blade 16 2024, RTX 4090 | |
| Lenovo Legion Pro 5 16IRX9 | |
| HP Victus 16 (2024) | |
| Alienware x16 R2 P120F | |
| Maingear ML-16 MK2 | |
| Przeciętny Intel Core Ultra 7 155H (5639 - 10647, n=50) | |
| AIDA64 / FPU Mandel | |
| Asus ROG Zephyrus G16 GA605WV | |
| Razer Blade 16 2024, RTX 4090 | |
| Lenovo Legion Pro 5 16IRX9 | |
| Alienware x16 R2 P120F | |
| HP Victus 16 (2024) | |
| Maingear ML-16 MK2 | |
| Przeciętny Intel Core Ultra 7 155H (18236 - 47685, n=50) | |
| AIDA64 / CPU AES | |
| Maingear ML-16 MK2 | |
| Razer Blade 16 2024, RTX 4090 | |
| Lenovo Legion Pro 5 16IRX9 | |
| Alienware x16 R2 P120F | |
| HP Victus 16 (2024) | |
| Asus ROG Zephyrus G16 GA605WV | |
| Przeciętny Intel Core Ultra 7 155H (45713 - 152179, n=50) | |
| AIDA64 / CPU ZLib | |
| Lenovo Legion Pro 5 16IRX9 | |
| Razer Blade 16 2024, RTX 4090 | |
| Asus ROG Zephyrus G16 GA605WV | |
| Alienware x16 R2 P120F | |
| Maingear ML-16 MK2 | |
| HP Victus 16 (2024) | |
| Przeciętny Intel Core Ultra 7 155H (557 - 1250, n=50) | |
| AIDA64 / FP64 Ray-Trace | |
| Asus ROG Zephyrus G16 GA605WV | |
| Razer Blade 16 2024, RTX 4090 | |
| Lenovo Legion Pro 5 16IRX9 | |
| Alienware x16 R2 P120F | |
| HP Victus 16 (2024) | |
| Maingear ML-16 MK2 | |
| Przeciętny Intel Core Ultra 7 155H (3569 - 9802, n=50) | |
| AIDA64 / CPU PhotoWorxx | |
| Alienware x16 R2 P120F | |
| Lenovo Legion Pro 5 16IRX9 | |
| Razer Blade 16 2024, RTX 4090 | |
| Asus ROG Zephyrus G16 GA605WV | |
| Przeciętny Intel Core Ultra 7 155H (32719 - 54223, n=50) | |
| HP Victus 16 (2024) | |
| Maingear ML-16 MK2 | |
Test warunków skrajnych
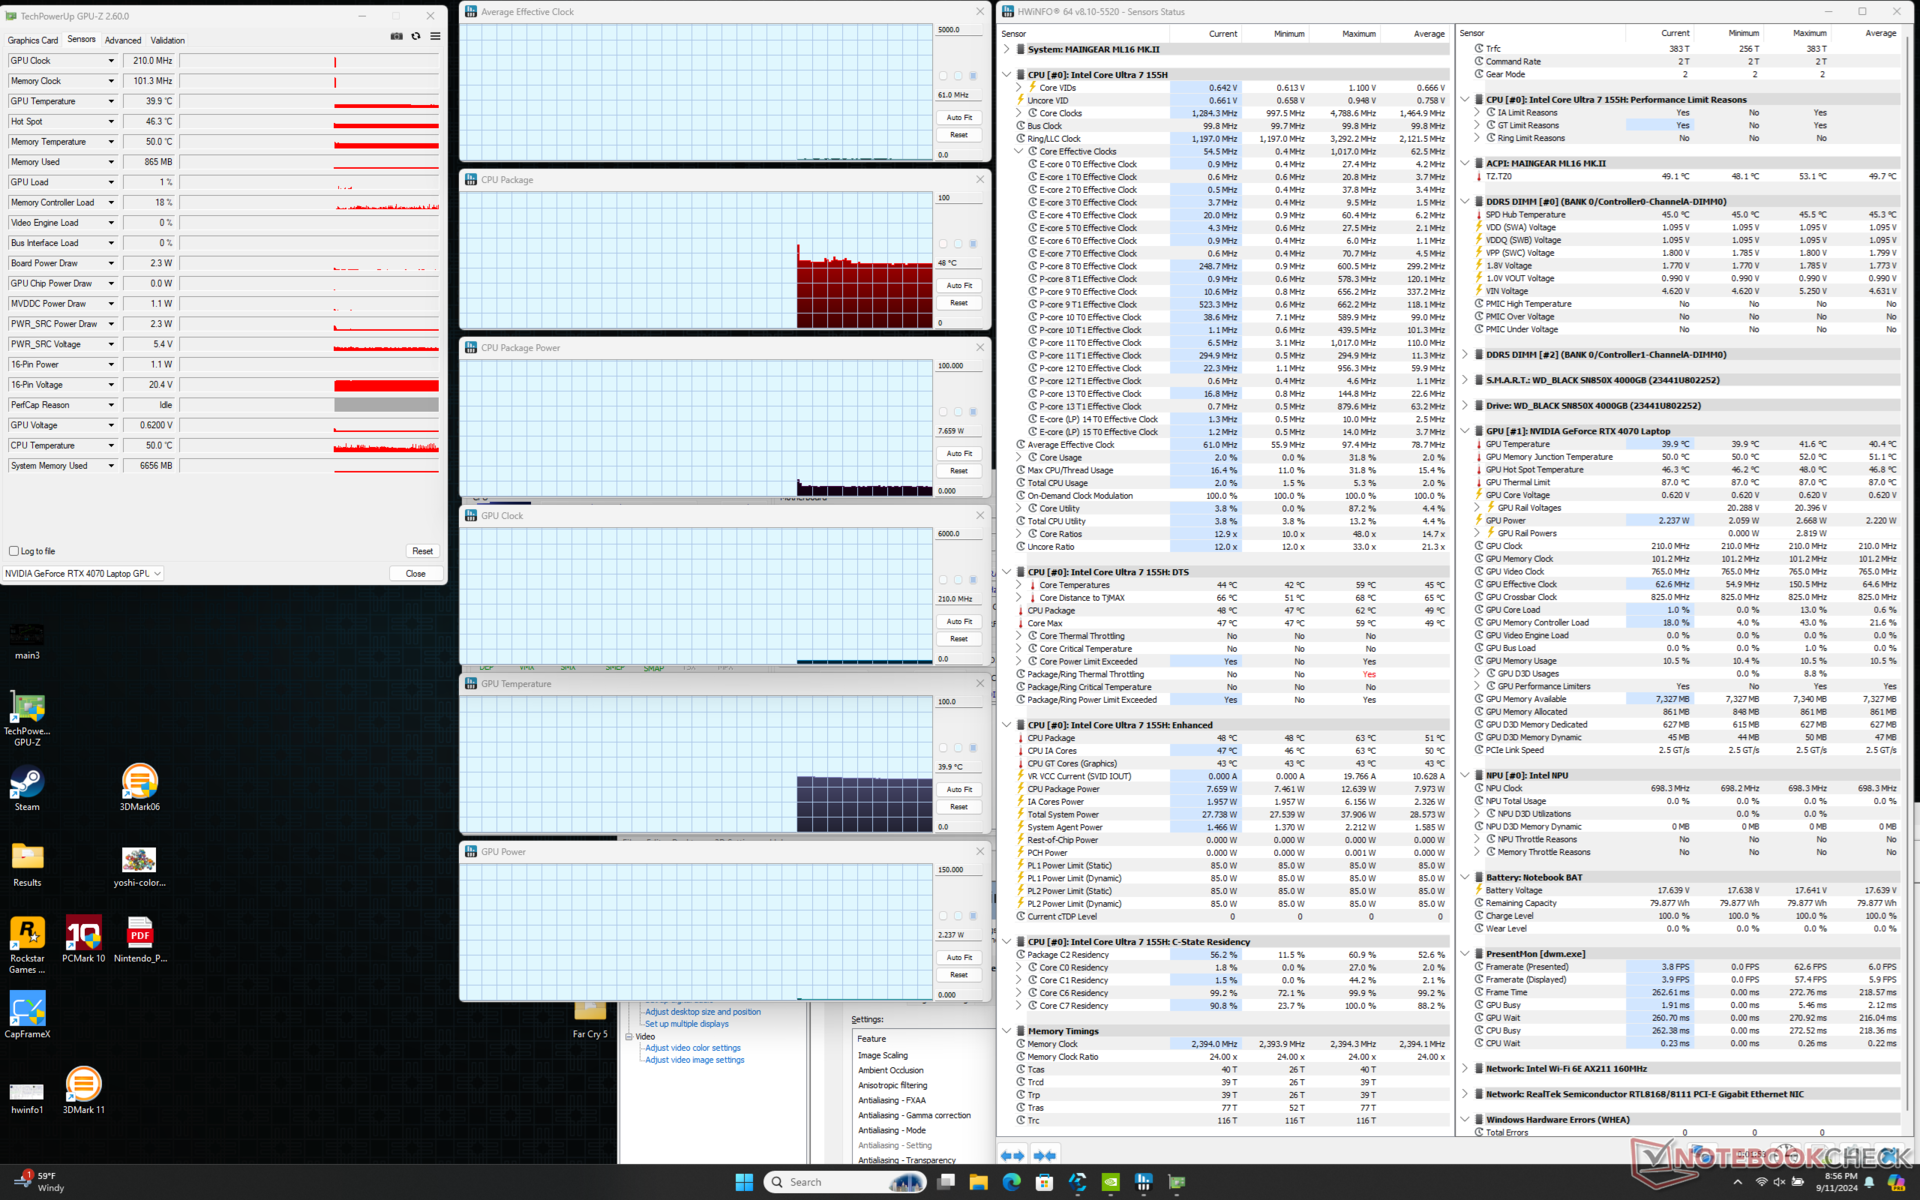
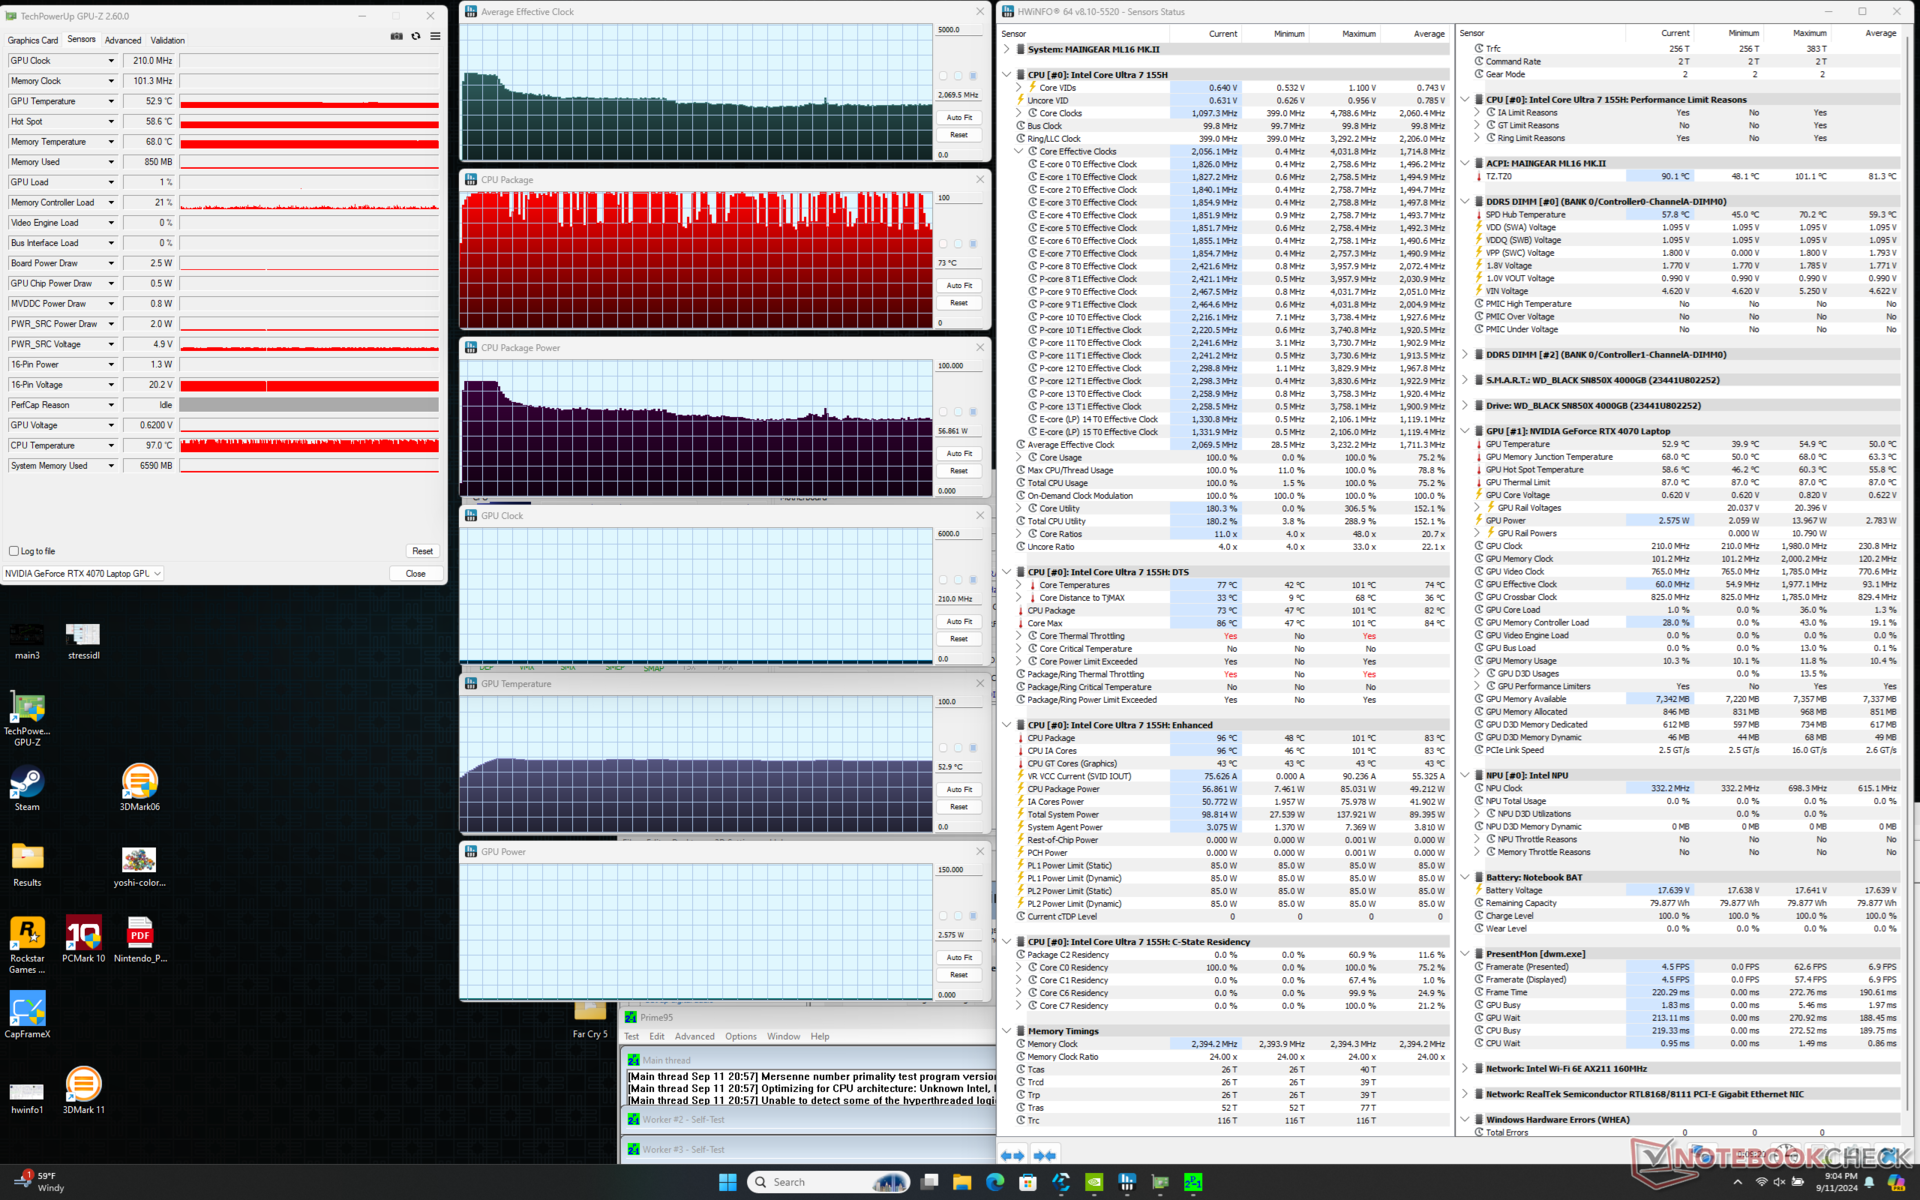
Procesor zwiększał taktowanie do 3,2 GHz, 100 C i 85 W podczas inicjowania stresu Prime95. Po kilku sekundach taktowanie CPU spadło jednak do 2,6 GHz i 69 W, a następnie ostatecznie ustabilizowało się na poziomie 2,1 GHz i 57 W. Temperatura rdzenia wahała się między 73 C a 100 C z wykrytym dławieniem termicznym według HWiNFO. Te wysokie temperatury rdzenia są wyższe niż w przypadku Razer Blade 16 w podobnych warunkach i są one również odpowiedzialne za bardzo wysokie temperatury powierzchni.
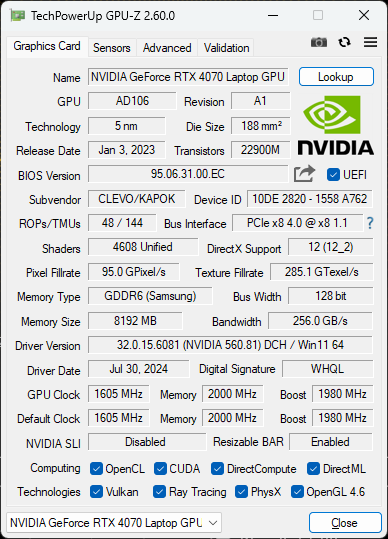
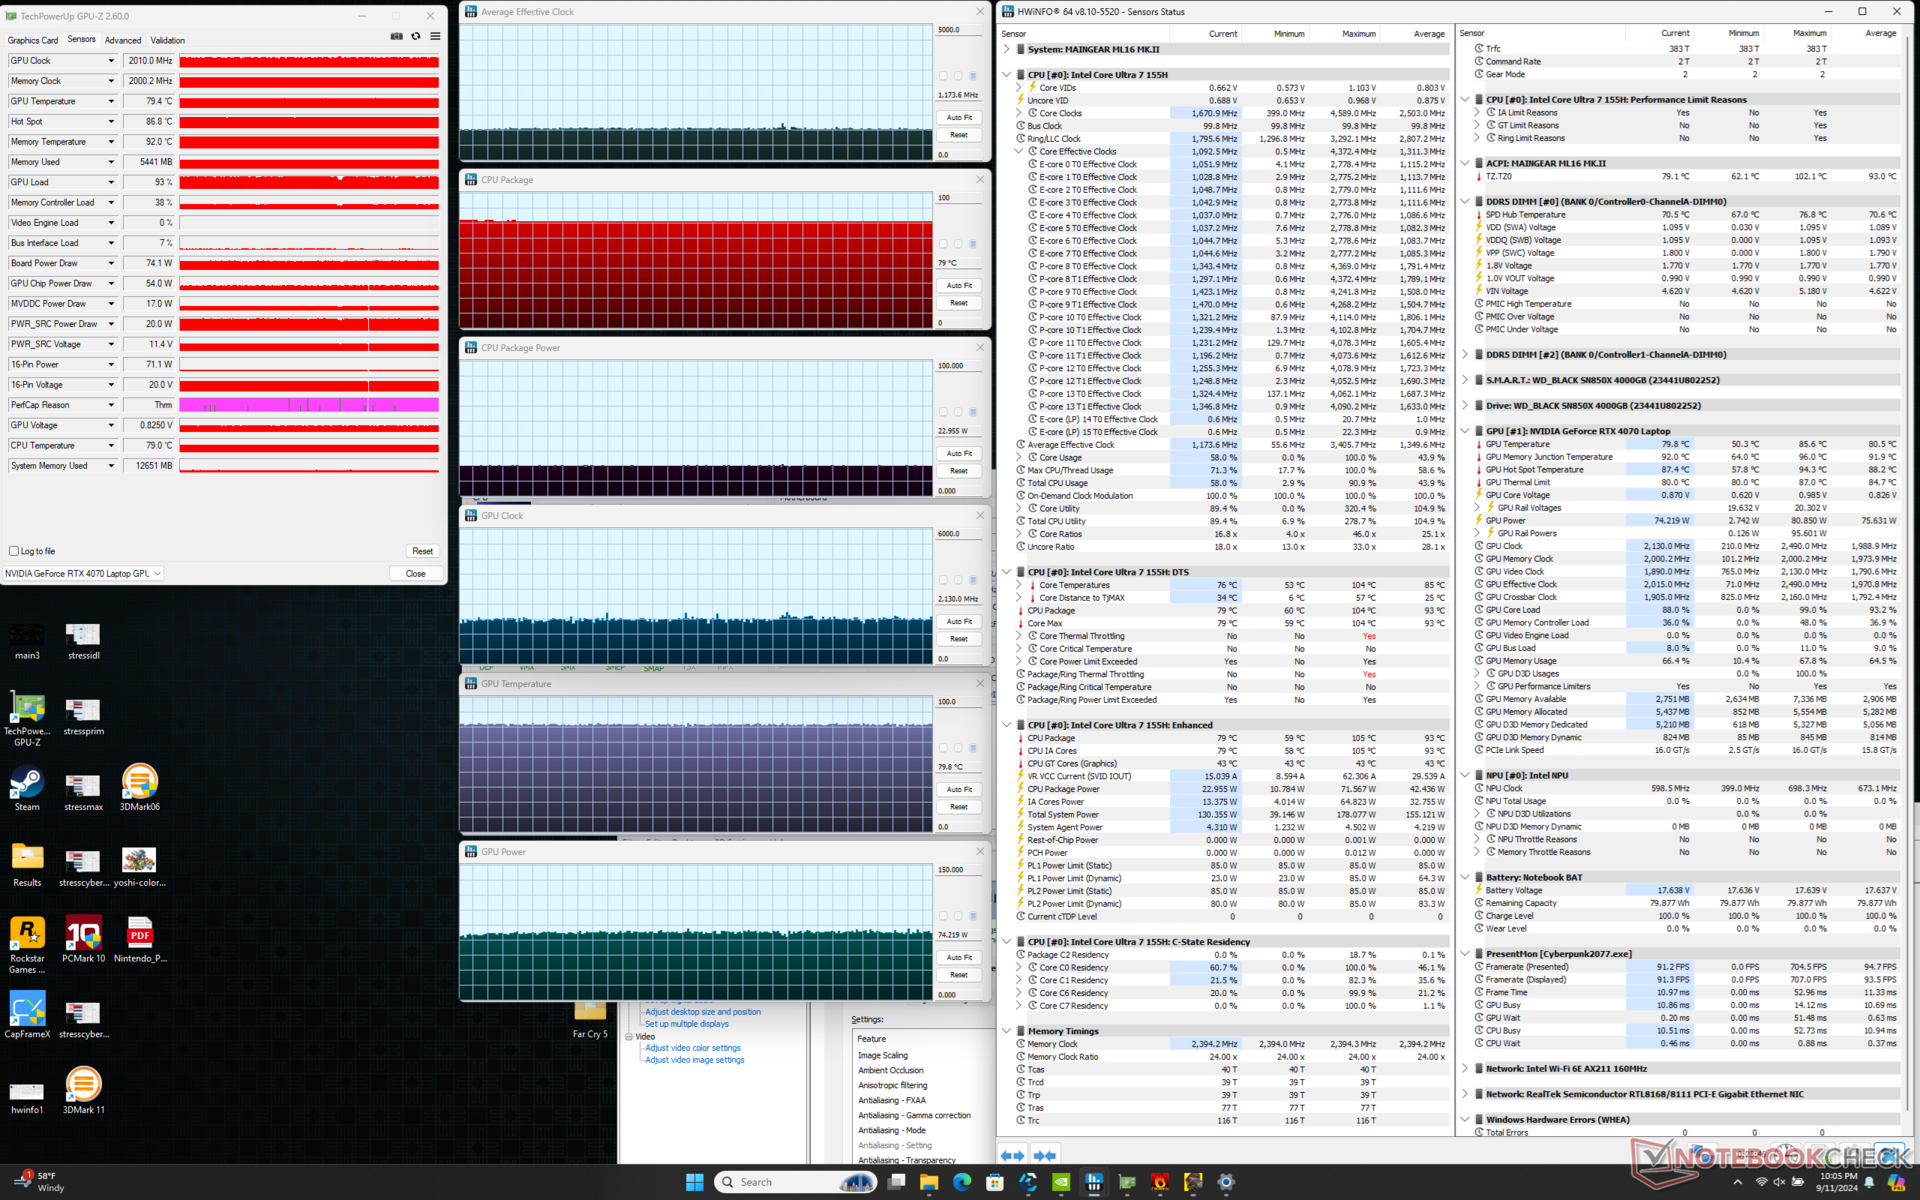
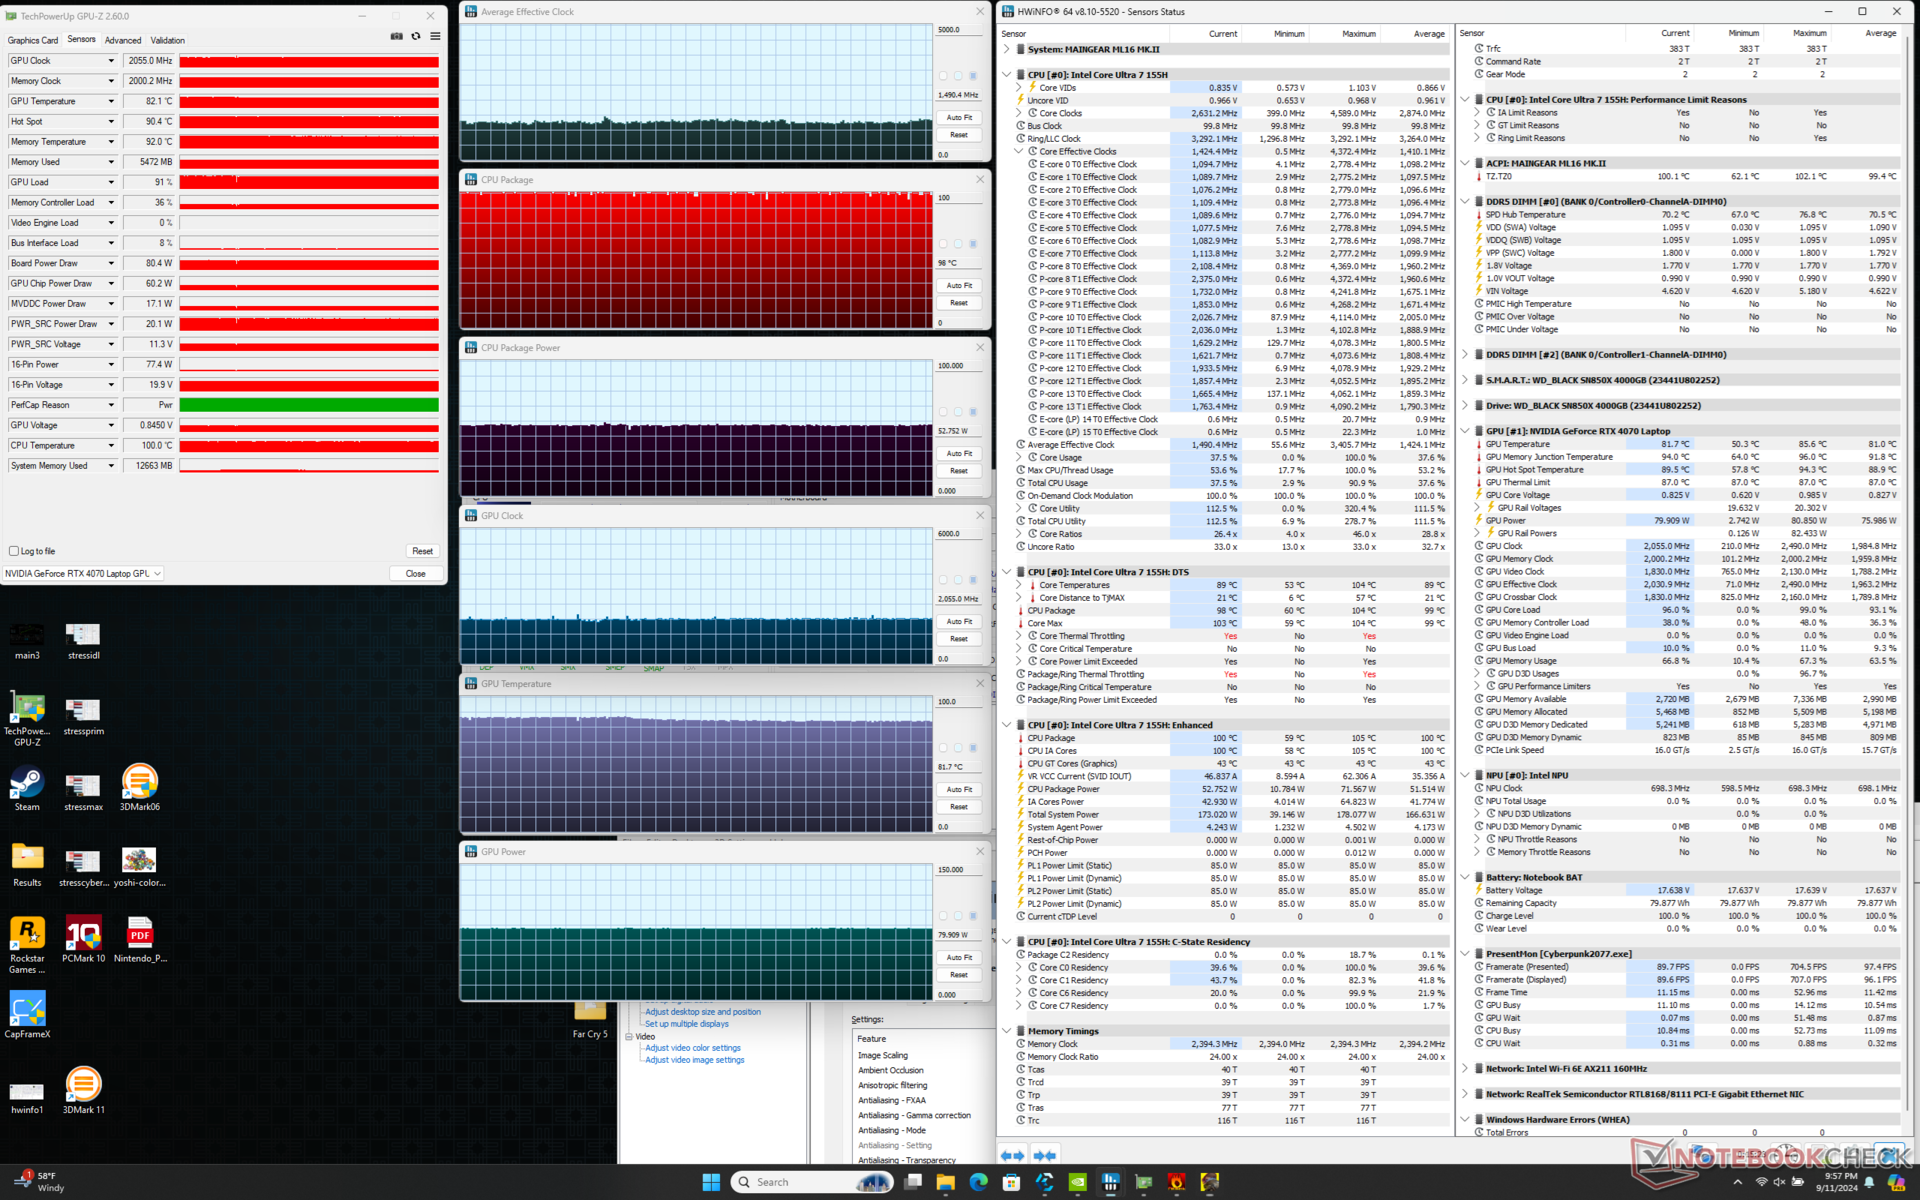
Podczas uruchamiania Cyberpunk 2077 w trybie Performance, GPU ustabilizowałoby się na poziomie 2160 MHz, 85 C i 80 W w porównaniu do 2010 MHz, 80 C i 74 W w cichszym trybie Balanced. Jeśli Państwa gra nie obciąża procesora, to uruchomienie jej w trybie Balanced może być lepszym rozwiązaniem, gdyż nie ma to większego wpływu na GPU. Proszę zauważyć, że Panel Sterowania Nvidii podaje TGP na poziomie 105 W, ale według GPU-Z jesteśmy w stanie osiągnąć maksymalnie 80 W podczas grania.
Ogólne temperatury rdzenia podczas grania są znacznie wyższe niż w przypadku alternatyw, takich jak Blade 16. Nasze CPU i GPU ustabilizowałyby się odpowiednio na poziomie 101 C i 85 C, w porównaniu do 78 C i 75 C na Razerze. Włączenie trybu maksymalnego wentylatora zmniejszyłoby temperaturę rdzenia tylko o kilka stopni C bez poprawy wydajności.

| Średnie taktowanie CPU (GHz) | Taktowanie GPU (MHz) | Średnia temperatura CPU (°C) | Średnia temperatura GPU (°C) | |
| System w stanie spoczynku | -- | -- | 48 | 40 |
| Prime95 Stress | 2.1 | -- | 73 - 101 | 53 |
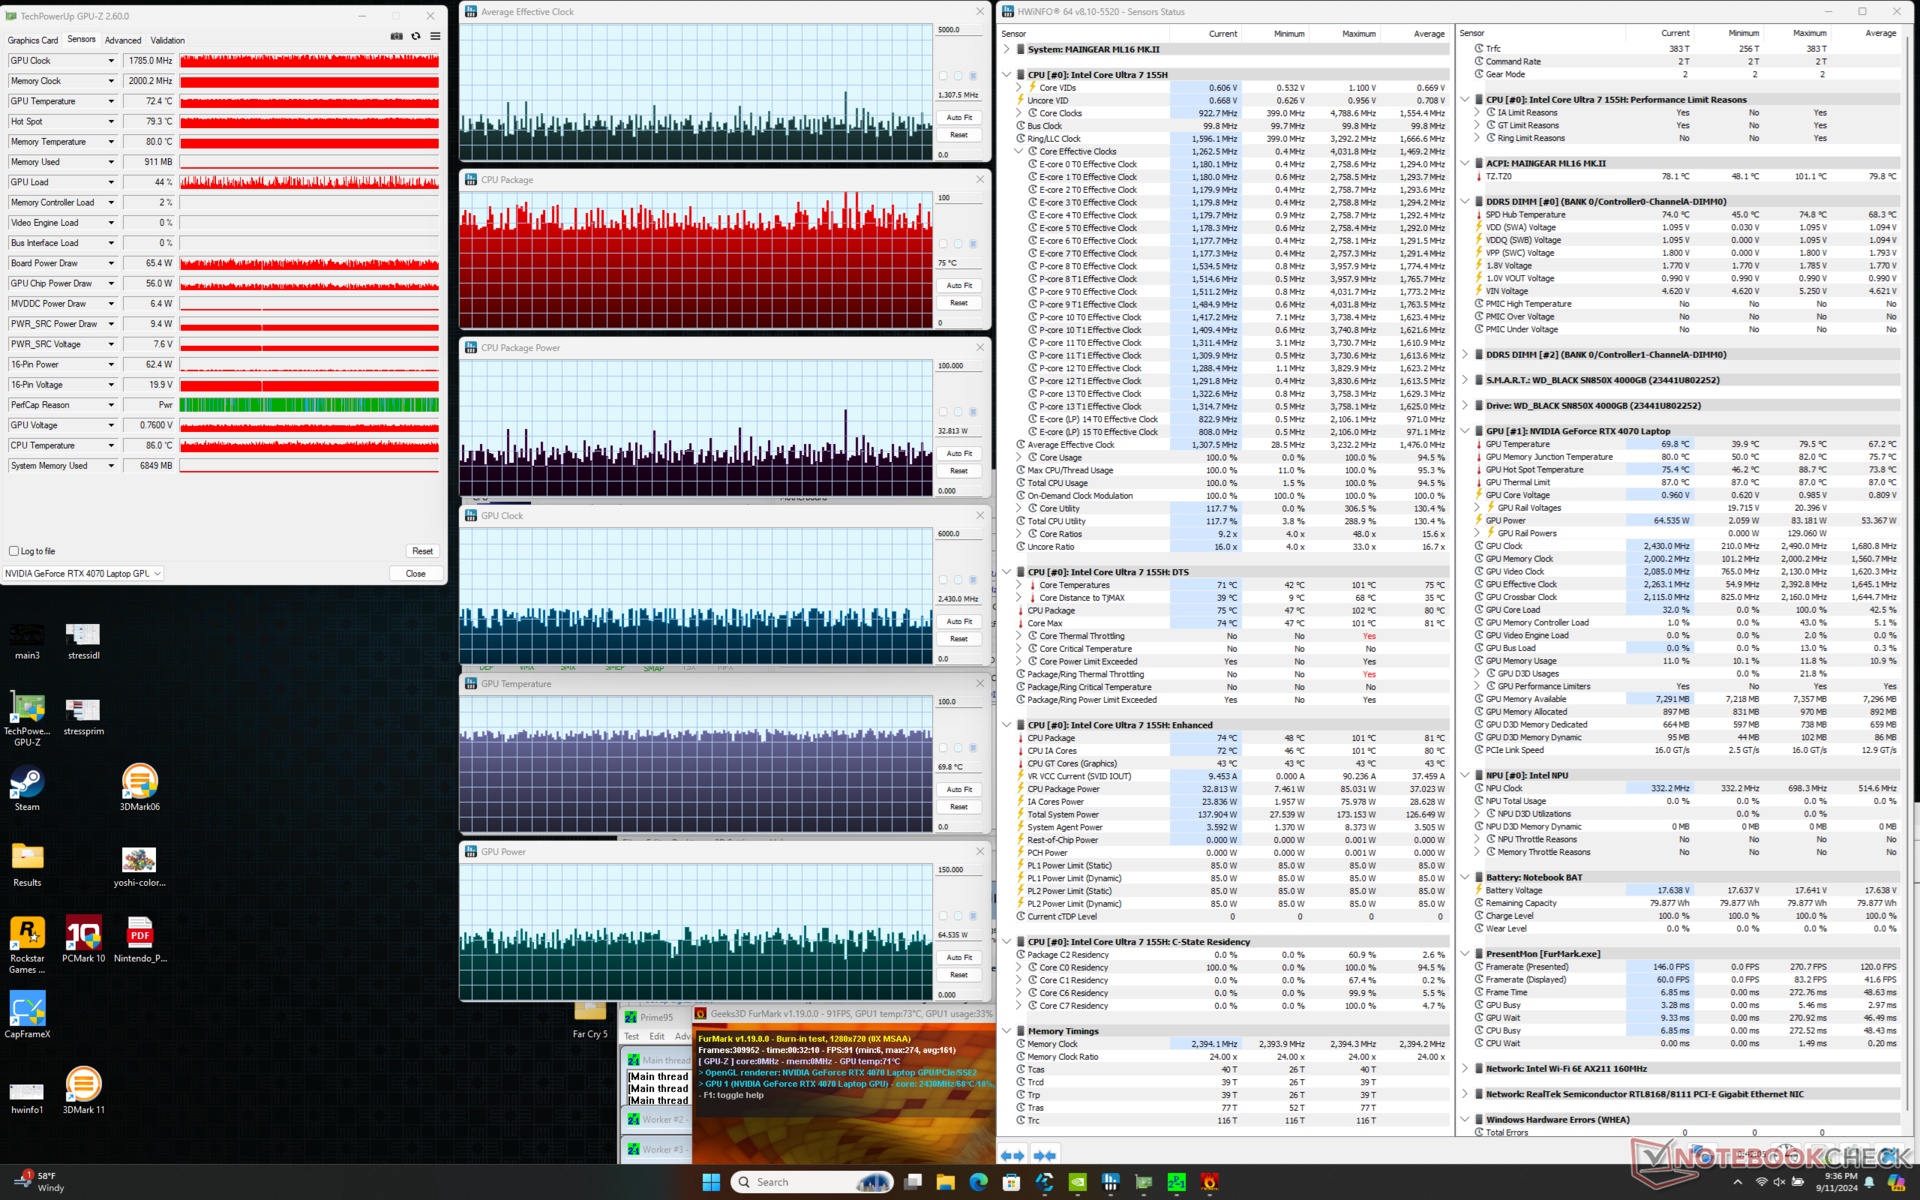
| Prime95 + FurMark Stress | 1.1 - 1.4 | ~1785 | 75 - 95 | ~70 |
| Cyberpunk 2077 Stress (tryb zrównoważony) | 1.2 | 2010 | 79 | 80 |
| Cyberpunk 2077 Stress (tryb wydajności z wyłączonym maksymalnym wentylatorem) | 1.4 | 2160 | 101 | 85 |
| Cyberpunk 2077 Stress (tryb wydajności z maksymalnie włączonym wentylatorem) | 1.5 | 2055 | 98 | 82 |
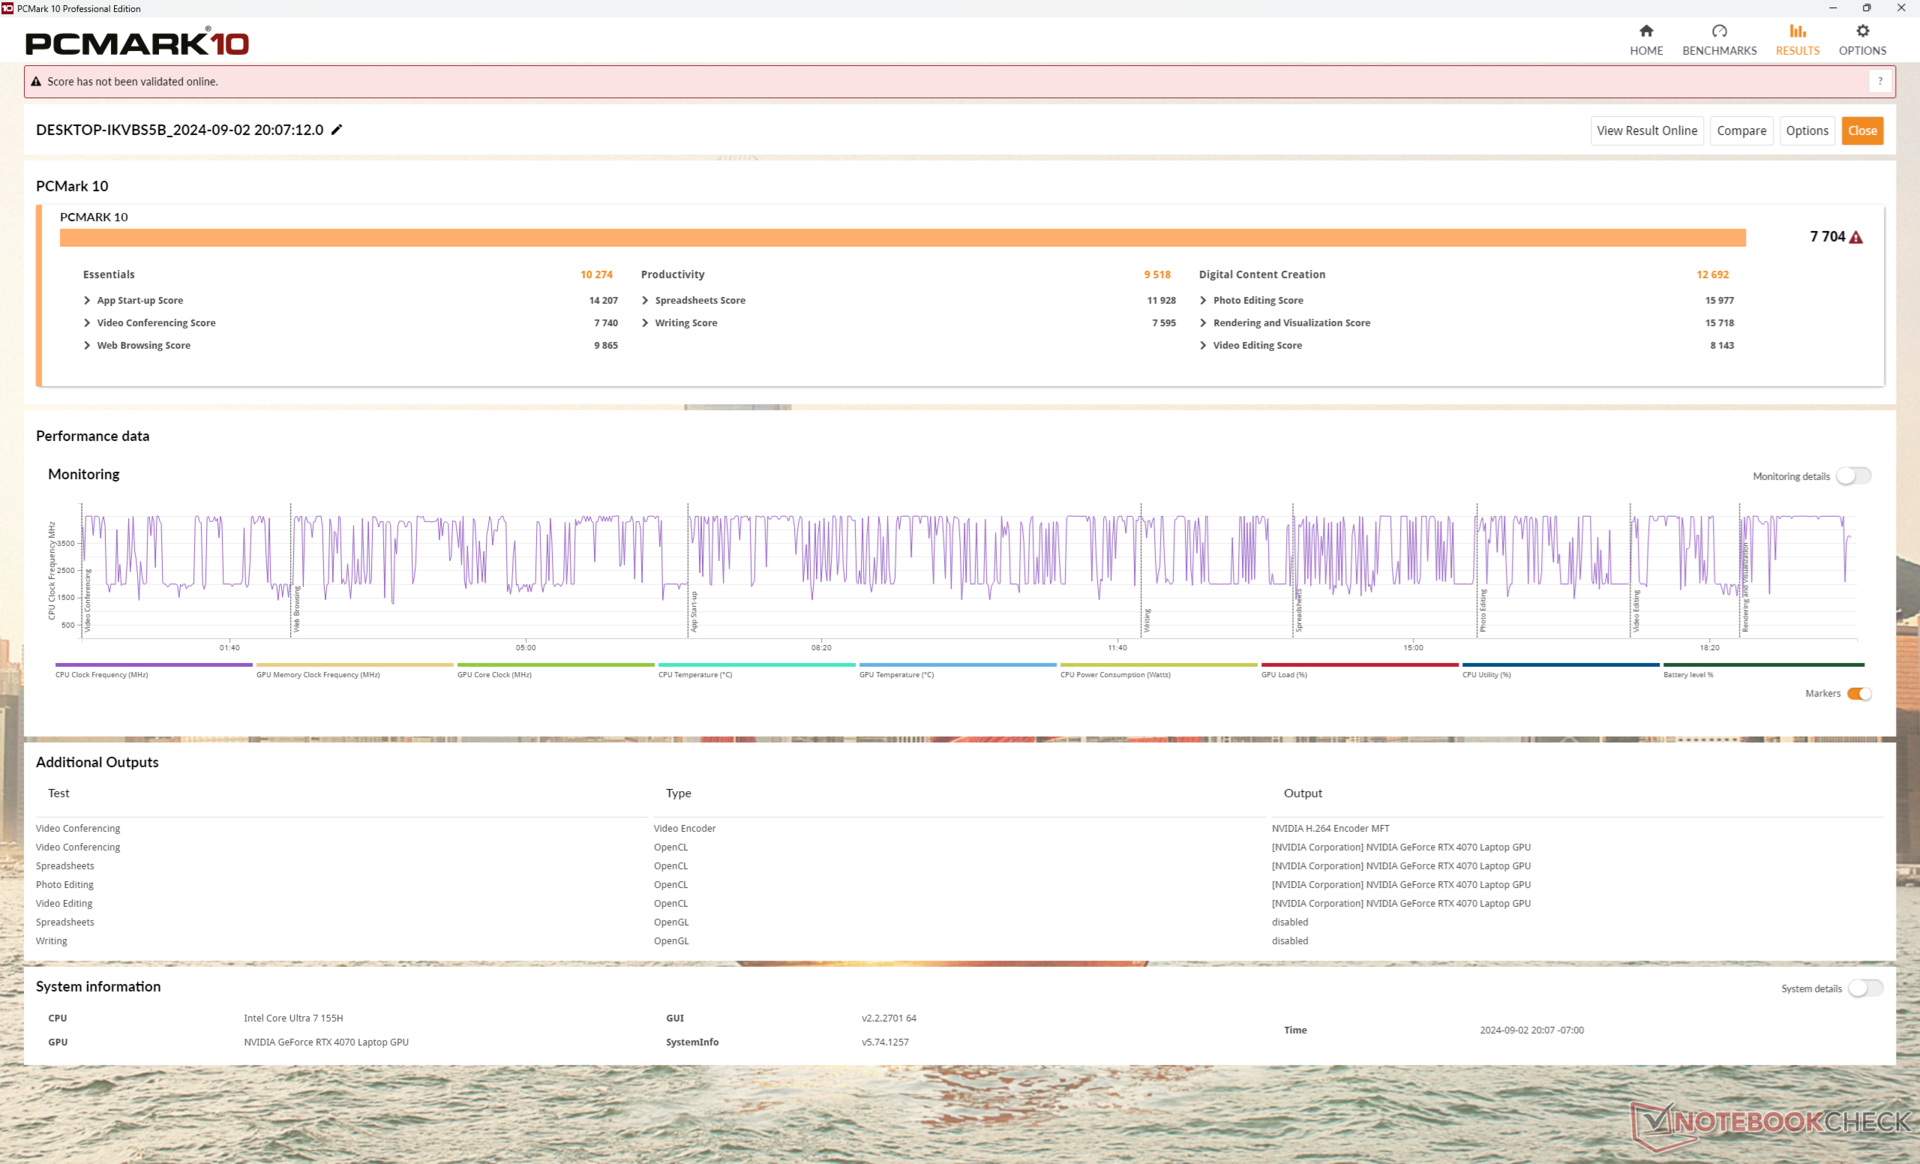
Wydajność systemu
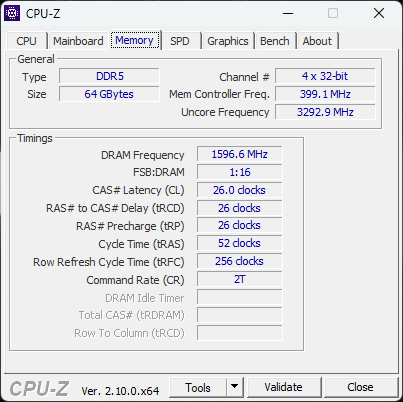
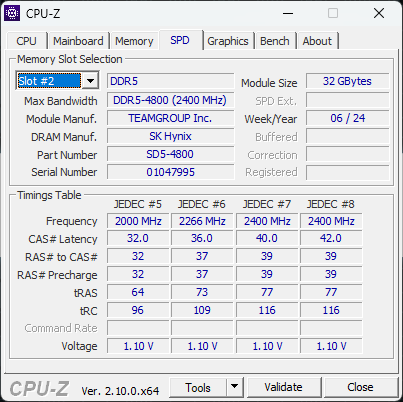
Wyniki PCMark są porównywalne do konkurencyjnych maszyn, takich jak HP Victus 16 lub Asus ROG Zephyrus G16 aby pokazać, że większość codziennych zadań nie działa znacząco szybciej lub wolniej na Maingear pomimo różnic w specyfikacji. Jednak wyniki CrossMark i AIDA64 są niższe niż oczekiwano ze względu na stosunkowo niższą surową wydajność procesora i pamięć RAM DDR5-4800. Konkurenci, tacy jak Blade 16 lub Alienware m16 R2, są wyposażeni odpowiednio w szybsze pamięci DDR5-5600 lub LPDDR5-7467.
CrossMark: Overall | Productivity | Creativity | Responsiveness
WebXPRT 3: Overall
WebXPRT 4: Overall
Mozilla Kraken 1.1: Total
| PCMark 10 / Score | |
| Lenovo Legion Pro 5 16IRX9 | |
| Razer Blade 16 2024, RTX 4090 | |
| Asus ROG Zephyrus G16 GA605WV | |
| Maingear ML-16 MK2 | |
| HP Victus 16 (2024) | |
| Przeciętny Intel Core Ultra 7 155H, NVIDIA GeForce RTX 4070 Laptop GPU (7084 - 7761, n=4) | |
| Alienware x16 R2 P120F | |
| PCMark 10 / Essentials | |
| Lenovo Legion Pro 5 16IRX9 | |
| Razer Blade 16 2024, RTX 4090 | |
| HP Victus 16 (2024) | |
| Maingear ML-16 MK2 | |
| Przeciętny Intel Core Ultra 7 155H, NVIDIA GeForce RTX 4070 Laptop GPU (10038 - 10393, n=4) | |
| Asus ROG Zephyrus G16 GA605WV | |
| Alienware x16 R2 P120F | |
| PCMark 10 / Productivity | |
| Razer Blade 16 2024, RTX 4090 | |
| Lenovo Legion Pro 5 16IRX9 | |
| Asus ROG Zephyrus G16 GA605WV | |
| HP Victus 16 (2024) | |
| Maingear ML-16 MK2 | |
| Przeciętny Intel Core Ultra 7 155H, NVIDIA GeForce RTX 4070 Laptop GPU (9192 - 9518, n=4) | |
| Alienware x16 R2 P120F | |
| PCMark 10 / Digital Content Creation | |
| Lenovo Legion Pro 5 16IRX9 | |
| Asus ROG Zephyrus G16 GA605WV | |
| Razer Blade 16 2024, RTX 4090 | |
| Alienware x16 R2 P120F | |
| Maingear ML-16 MK2 | |
| Przeciętny Intel Core Ultra 7 155H, NVIDIA GeForce RTX 4070 Laptop GPU (10100 - 13035, n=4) | |
| HP Victus 16 (2024) | |
| CrossMark / Overall | |
| Razer Blade 16 2024, RTX 4090 | |
| Lenovo Legion Pro 5 16IRX9 | |
| HP Victus 16 (2024) | |
| Asus ROG Zephyrus G16 GA605WV | |
| Przeciętny Intel Core Ultra 7 155H, NVIDIA GeForce RTX 4070 Laptop GPU (1687 - 1848, n=4) | |
| Maingear ML-16 MK2 | |
| Alienware x16 R2 P120F | |
| CrossMark / Productivity | |
| Razer Blade 16 2024, RTX 4090 | |
| Lenovo Legion Pro 5 16IRX9 | |
| HP Victus 16 (2024) | |
| Przeciętny Intel Core Ultra 7 155H, NVIDIA GeForce RTX 4070 Laptop GPU (1589 - 1750, n=4) | |
| Asus ROG Zephyrus G16 GA605WV | |
| Maingear ML-16 MK2 | |
| Alienware x16 R2 P120F | |
| CrossMark / Creativity | |
| Razer Blade 16 2024, RTX 4090 | |
| Lenovo Legion Pro 5 16IRX9 | |
| Asus ROG Zephyrus G16 GA605WV | |
| HP Victus 16 (2024) | |
| Przeciętny Intel Core Ultra 7 155H, NVIDIA GeForce RTX 4070 Laptop GPU (1860 - 2014, n=4) | |
| Maingear ML-16 MK2 | |
| Alienware x16 R2 P120F | |
| CrossMark / Responsiveness | |
| Razer Blade 16 2024, RTX 4090 | |
| HP Victus 16 (2024) | |
| Lenovo Legion Pro 5 16IRX9 | |
| Alienware x16 R2 P120F | |
| Przeciętny Intel Core Ultra 7 155H, NVIDIA GeForce RTX 4070 Laptop GPU (1424 - 1683, n=4) | |
| Maingear ML-16 MK2 | |
| Asus ROG Zephyrus G16 GA605WV | |
| WebXPRT 3 / Overall | |
| Razer Blade 16 2024, RTX 4090 | |
| Lenovo Legion Pro 5 16IRX9 | |
| Przeciętny Intel Core Ultra 7 155H, NVIDIA GeForce RTX 4070 Laptop GPU (264 - 294, n=4) | |
| HP Victus 16 (2024) | |
| Maingear ML-16 MK2 | |
| Alienware x16 R2 P120F | |
| WebXPRT 4 / Overall | |
| Lenovo Legion Pro 5 16IRX9 | |
| Asus ROG Zephyrus G16 GA605WV | |
| Przeciętny Intel Core Ultra 7 155H, NVIDIA GeForce RTX 4070 Laptop GPU (247 - 257, n=4) | |
| HP Victus 16 (2024) | |
| Maingear ML-16 MK2 | |
| Alienware x16 R2 P120F | |
| Mozilla Kraken 1.1 / Total | |
| Alienware x16 R2 P120F | |
| Maingear ML-16 MK2 | |
| Przeciętny Intel Core Ultra 7 155H, NVIDIA GeForce RTX 4070 Laptop GPU (546 - 568, n=3) | |
| HP Victus 16 (2024) | |
| Razer Blade 16 2024, RTX 4090 | |
| Lenovo Legion Pro 5 16IRX9 | |
| Asus ROG Zephyrus G16 GA605WV | |
* ... im mniej tym lepiej
| PCMark 10 Score | 7704 pkt. | |
Pomoc | ||
| AIDA64 / Memory Copy | |
| Alienware x16 R2 P120F | |
| Asus ROG Zephyrus G16 GA605WV | |
| Przeciętny Intel Core Ultra 7 155H (62397 - 96791, n=50) | |
| Lenovo Legion Pro 5 16IRX9 | |
| Razer Blade 16 2024, RTX 4090 | |
| HP Victus 16 (2024) | |
| Maingear ML-16 MK2 | |
| AIDA64 / Memory Read | |
| Asus ROG Zephyrus G16 GA605WV | |
| Razer Blade 16 2024, RTX 4090 | |
| Lenovo Legion Pro 5 16IRX9 | |
| Alienware x16 R2 P120F | |
| HP Victus 16 (2024) | |
| Przeciętny Intel Core Ultra 7 155H (60544 - 90647, n=50) | |
| Maingear ML-16 MK2 | |
| AIDA64 / Memory Write | |
| Asus ROG Zephyrus G16 GA605WV | |
| Lenovo Legion Pro 5 16IRX9 | |
| Razer Blade 16 2024, RTX 4090 | |
| Alienware x16 R2 P120F | |
| Przeciętny Intel Core Ultra 7 155H (58692 - 93451, n=50) | |
| HP Victus 16 (2024) | |
| Maingear ML-16 MK2 | |
| AIDA64 / Memory Latency | |
| Maingear ML-16 MK2 | |
| Przeciętny Intel Core Ultra 7 155H (116.2 - 233, n=50) | |
| Alienware x16 R2 P120F | |
| Asus ROG Zephyrus G16 GA605WV | |
| HP Victus 16 (2024) | |
| Razer Blade 16 2024, RTX 4090 | |
| Lenovo Legion Pro 5 16IRX9 | |
* ... im mniej tym lepiej
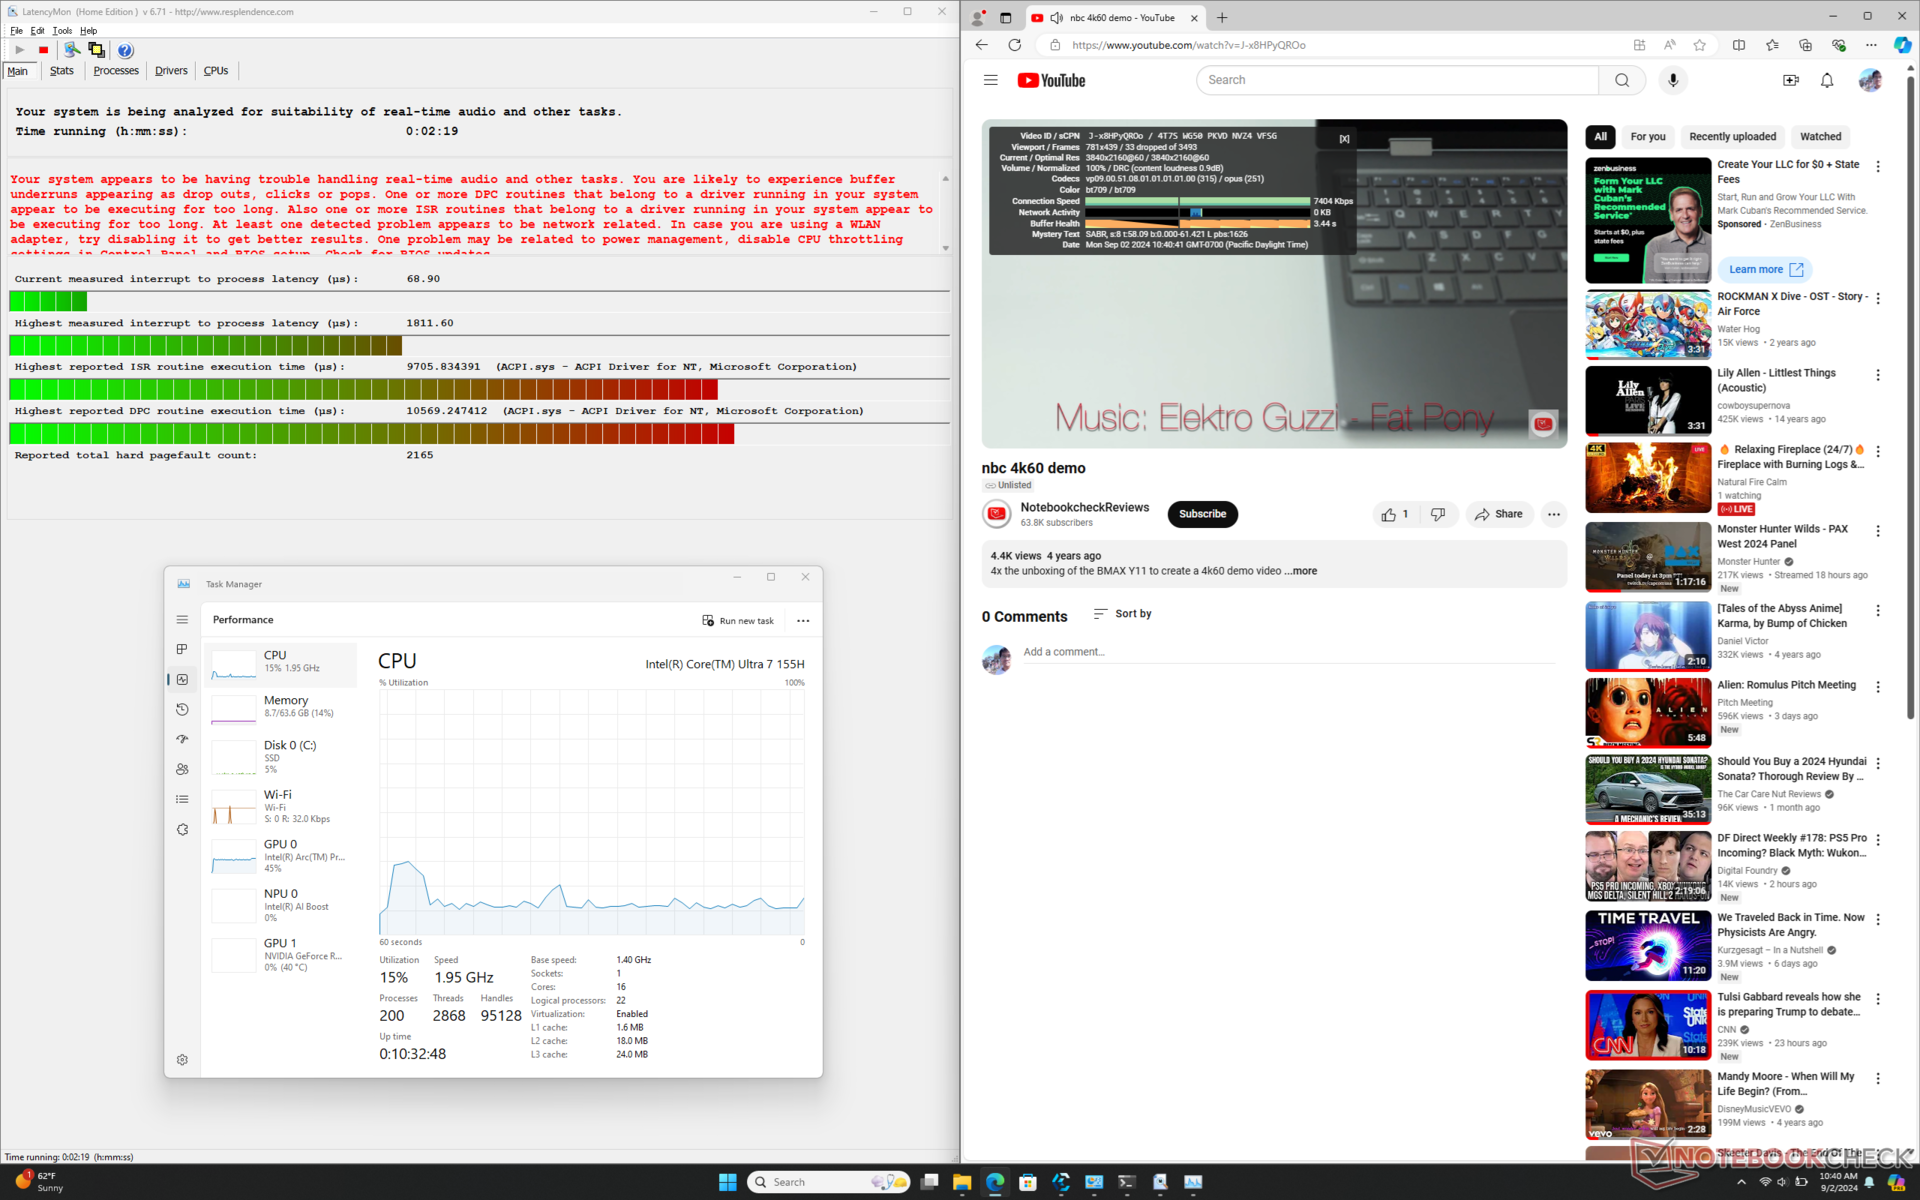
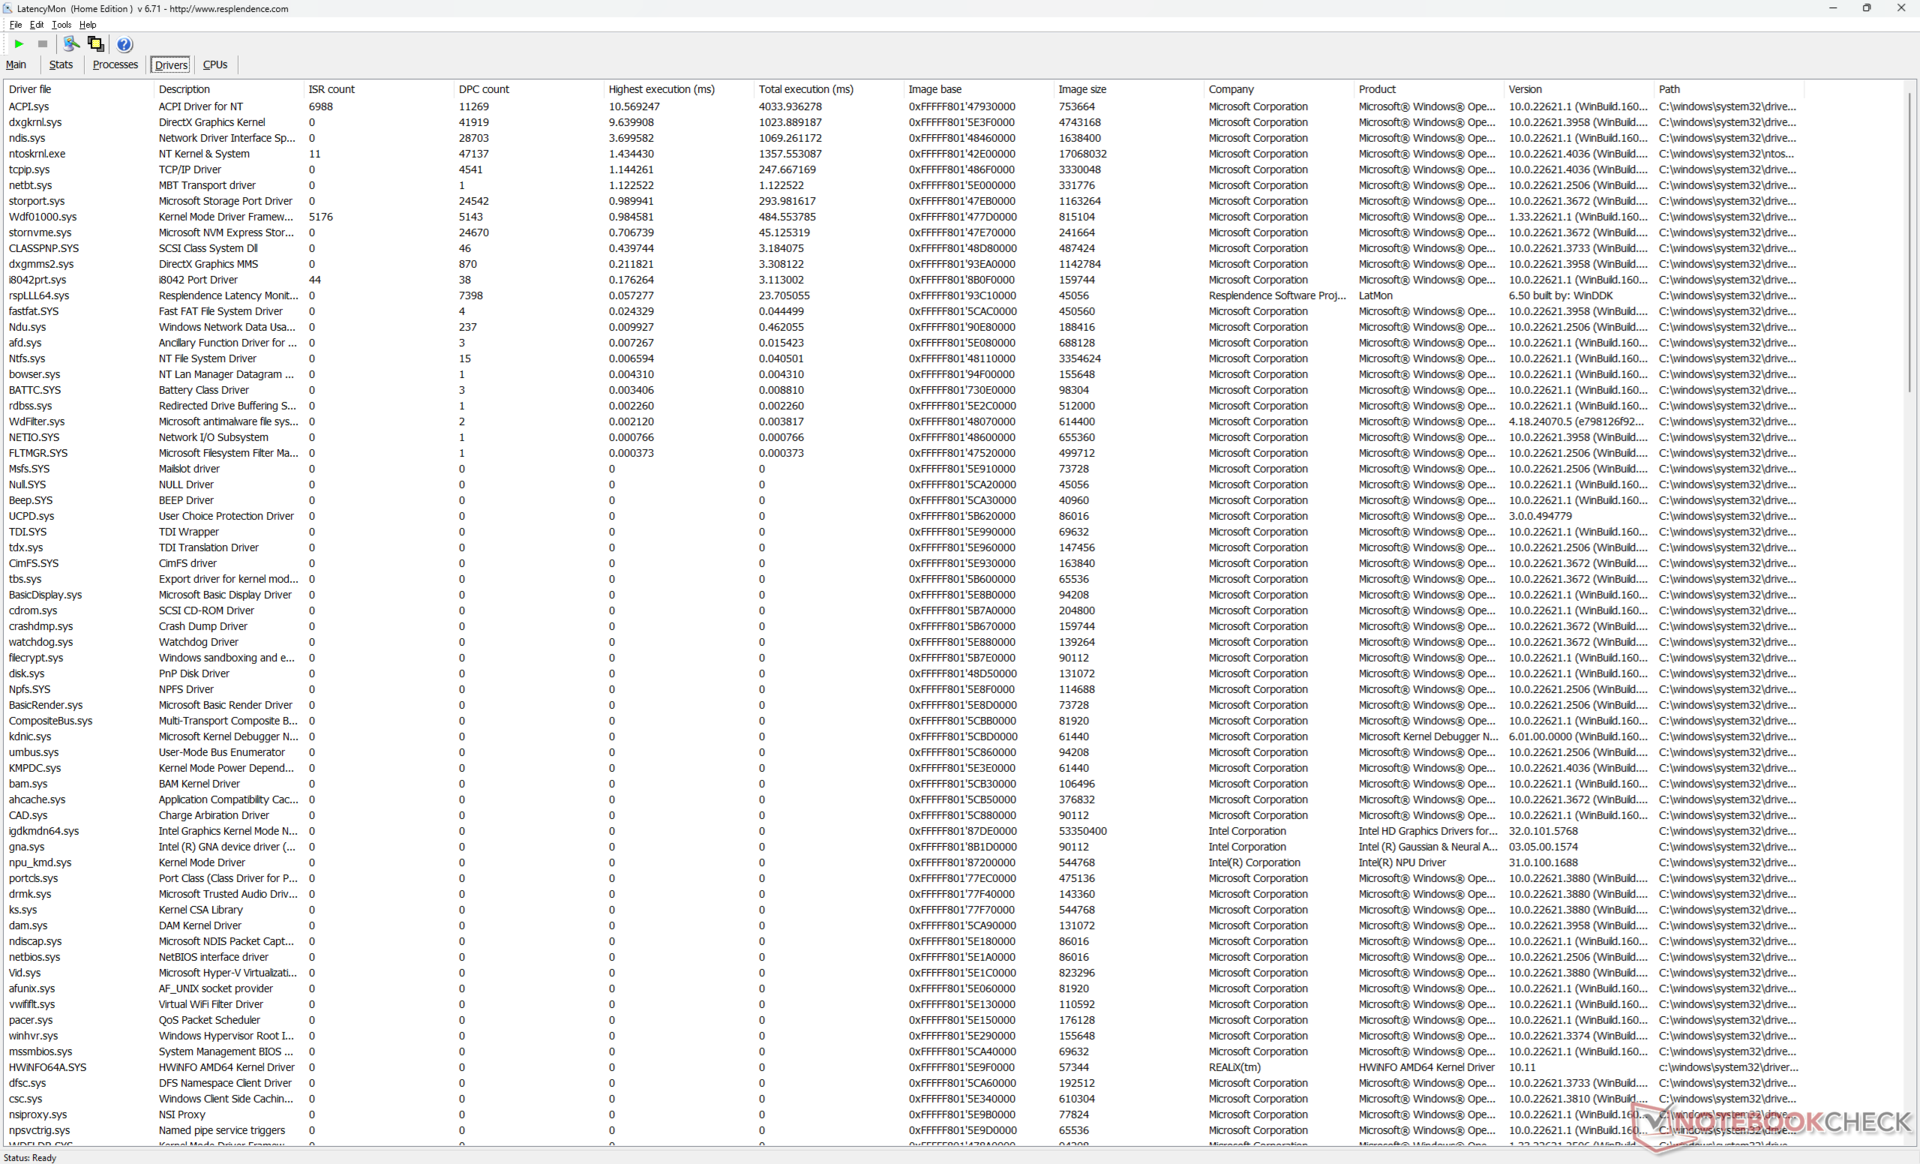
Opóźnienie DPC
LatencyMon ujawnia większe niż oczekiwano problemy z DPC związane ze sterownikami ACPI, nawet w trybie MSHybrid. Co więcej, jesteśmy w stanie zarejestrować 33 spadki klatek podczas 60-sekundowego wideo testowego 4K60, podczas gdy powinno ich być zero, zwłaszcza biorąc pod uwagę procesor Meteor Lake-H w środku. Te zrzucone klatki objawiają się jako zacinanie podczas strumieniowania wideo 4K i sugerują podstawowy problem ze sterownikiem lub słabe zarządzanie działaniami w tle, które mogą przerywać główne okno.
| DPC Latencies / LatencyMon - interrupt to process latency (max), Web, Youtube, Prime95 | |
| Alienware x16 R2 P120F | |
| Maingear ML-16 MK2 | |
| Razer Blade 16 2024, RTX 4090 | |
| Lenovo Legion Pro 5 16IRX9 | |
| HP Victus 16 (2024) | |
| Asus ROG Zephyrus G16 GA605WV | |
* ... im mniej tym lepiej
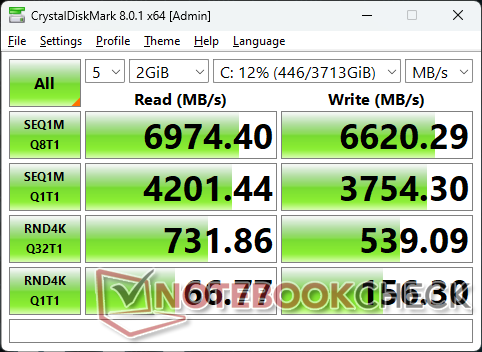
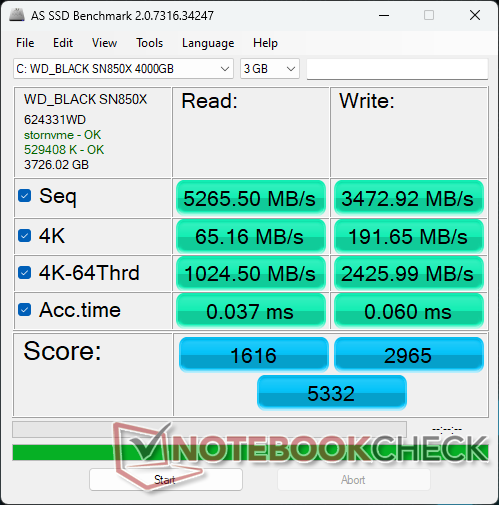
Urządzenia pamięci masowej
Maingear jest jednym z niewielu systemów dostarczanych z 4 TB WD Black SN850X PCIe4 x4 NVMe. Prędkości transferu są doskonałe i wynoszą prawie 7000 MB/s, przy czym nie wykryto dławienia przy obciążeniu. Doceniamy fakt, że radiator i podkładki termiczne są standardem, aby pomóc w rozpraszaniu ciepła.

| Drive Performance Rating - Percent | |
| Lenovo Legion Pro 5 16IRX9 | |
| Alienware x16 R2 P120F | |
| Razer Blade 16 2024, RTX 4090 | |
| HP Victus 16 (2024) | |
| Maingear ML-16 MK2 | |
| Asus ROG Zephyrus G16 GA605WV | |
* ... im mniej tym lepiej
Disk Throttling: DiskSpd Read Loop, Queue Depth 8
Wydajność GPU
Mobilny GeForce RTX 4070 działa o kilka punktów procentowych wolniej niż przeciętny laptop w naszej bazie danych z tą samą opcją GPU. Ogólna wydajność jest tylko od 5 do 15 procent lepsza niż w przypadku podstawowej wersji RTX 4060 lub o około 15 procent lepsza niż starsza opcja RTX 3070 Ti. Różnica staje się znacznie większa, gdy porównamy mobilne RTX 4070 do mobilnym RTX 4080ale ta ostatnia nie jest konfigurowalna w tym modelu.
Proszę pamiętać, że mobilny RTX 4070 jest znacznie wolniejszy niż jego desktopowy odpowiednik o około 35 do 40 procent.
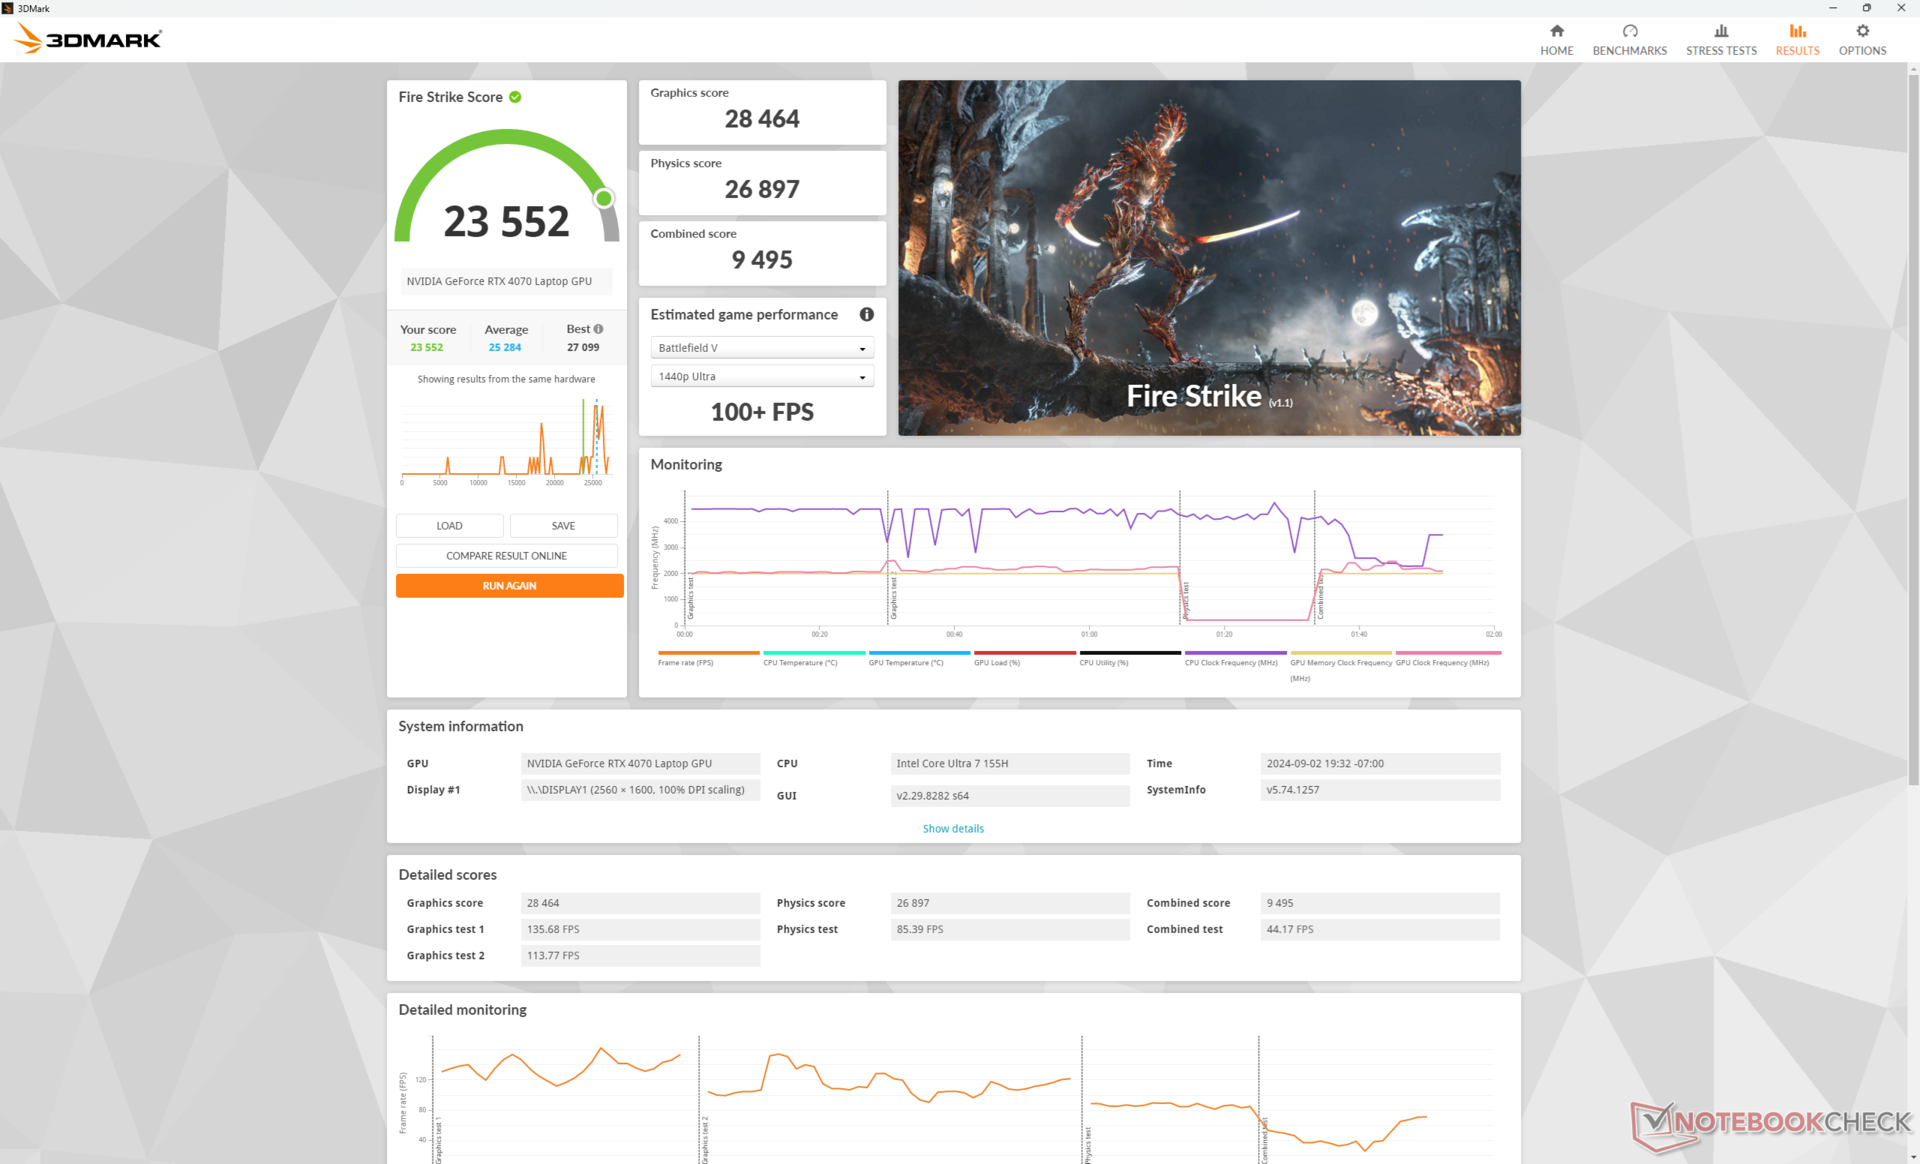
| Profil zasilania | Wynik grafiki | Wynik fizyki | Wynik łączny |
| Tryb wydajności | 28464 | 26897 | 9495 |
| Tryb zrównoważony | 28238 (-0%) | 16060 (-40%) | 8049 (-15%) |
| Zasilanie bateryjne | 5539 (-81%) | 12186 (-55%) | 1715 (-82%) |
Uruchamianie w trybie zrównoważonym zamiast w trybie wydajności znacząco wpływa na wydajność procesora, podczas gdy wydajność grafiki pozostaje bez zmian, zgodnie z naszą tabelą wyników Fire Strike powyżej. Jest to zgodne z naszymi obserwacjami w sekcji testu obciążeniowego powyżej. Praca na zasilaniu bateryjnym dodatkowo wpływa na ogólną wydajność, nawet w trybie wydajności.
| 3DMark Performance Rating - Percent | |
| Razer Blade 16 2024, RTX 4090 -1! | |
| KFA2 GeForce RTX 4070 EX Gamer | |
| Alienware x16 R2 P120F | |
| Lenovo Yoga Pro 9 16IMH9 -1! | |
| Przeciętny NVIDIA GeForce RTX 4070 Laptop GPU | |
| Maingear ML-16 MK2 | |
| HP Victus 16 (2024) -1! | |
| HP Omen 16-b0085ng -1! | |
| CSL GameStar Notebook VenomGamer G16 -1! | |
| Asus ROG Zephyrus M16 GU603Z -1! | |
| Asus TUF Gaming A16 FA617XS | |
| HP Victus 16-r0076TX | |
| HP Omen 16-n0033dx | |
| Acer Nitro 16 AN16-41-R7YE | |
| Lenovo Legion C7 15IMH05 82EH0030GE -1! | |
| 3DMark 11 - 1280x720 Performance GPU | |
| Razer Blade 16 2024, RTX 4090 | |
| KFA2 GeForce RTX 4070 EX Gamer | |
| Alienware x16 R2 P120F | |
| Lenovo Yoga Pro 9 16IMH9 | |
| Przeciętny NVIDIA GeForce RTX 4070 Laptop GPU (24229 - 46434, n=66) | |
| Maingear ML-16 MK2 | |
| CSL GameStar Notebook VenomGamer G16 | |
| HP Victus 16 (2024) | |
| HP Omen 16-b0085ng | |
| Asus TUF Gaming A16 FA617XS | |
| HP Omen 16-n0033dx | |
| Asus ROG Zephyrus M16 GU603Z | |
| HP Victus 16-r0076TX | |
| Acer Nitro 16 AN16-41-R7YE | |
| Lenovo Legion C7 15IMH05 82EH0030GE | |
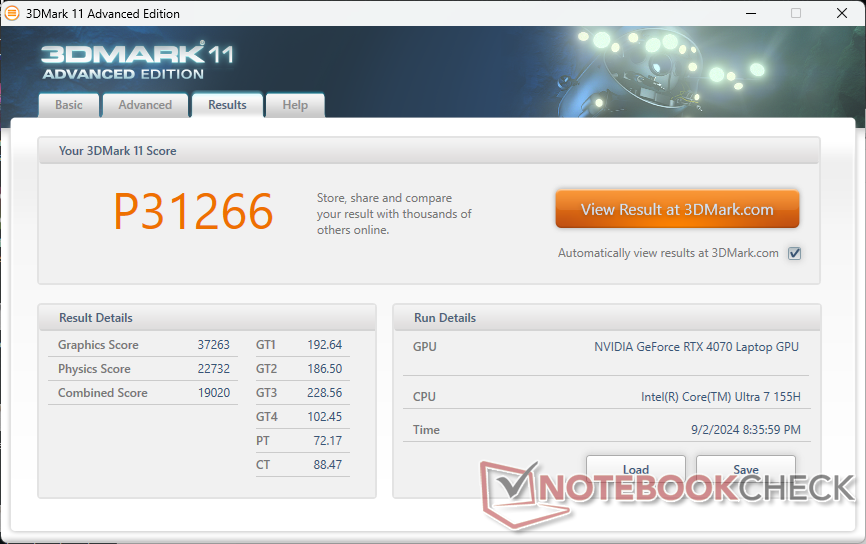
| 3DMark 11 Performance | 31266 pkt. | |
| 3DMark Cloud Gate Standard Score | 57717 pkt. | |
| 3DMark Fire Strike Score | 23552 pkt. | |
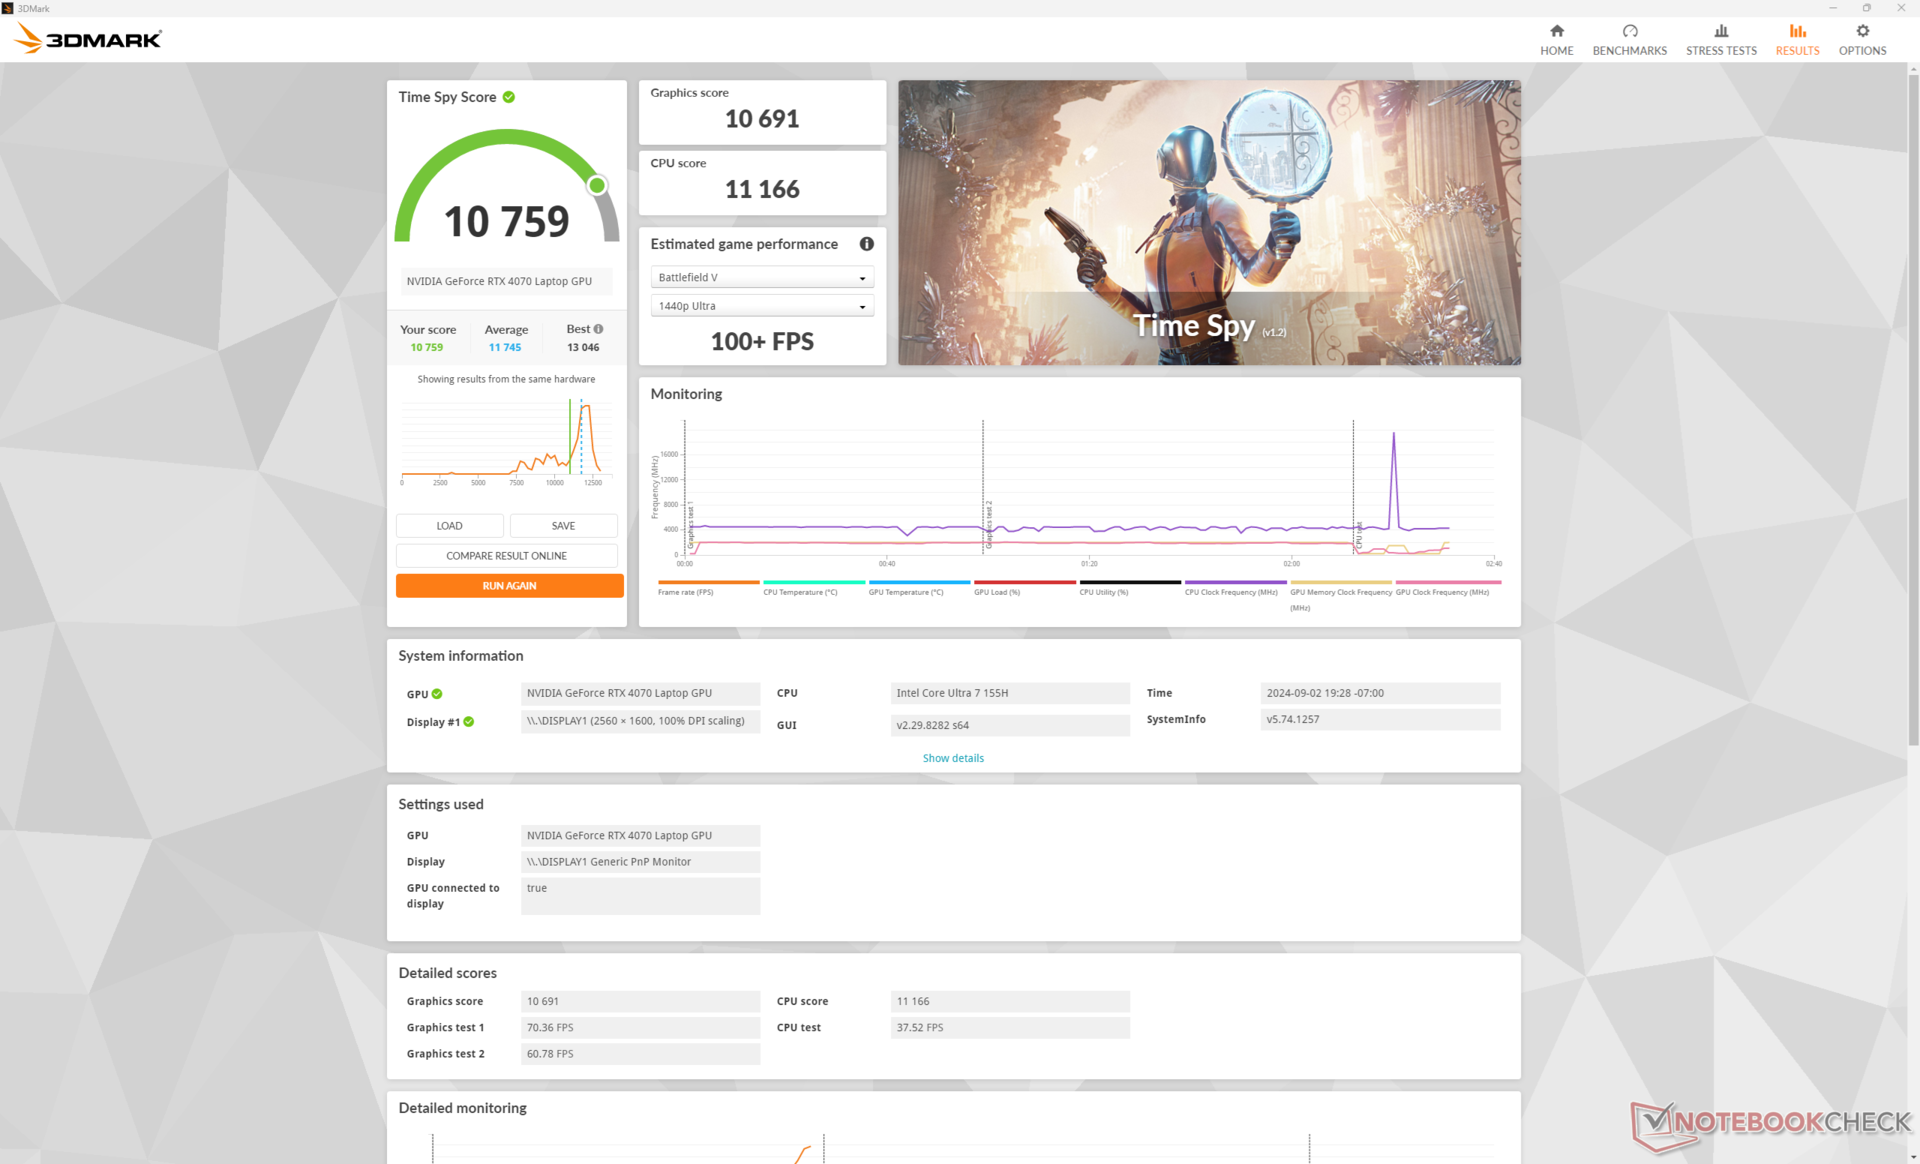
| 3DMark Time Spy Score | 10759 pkt. | |
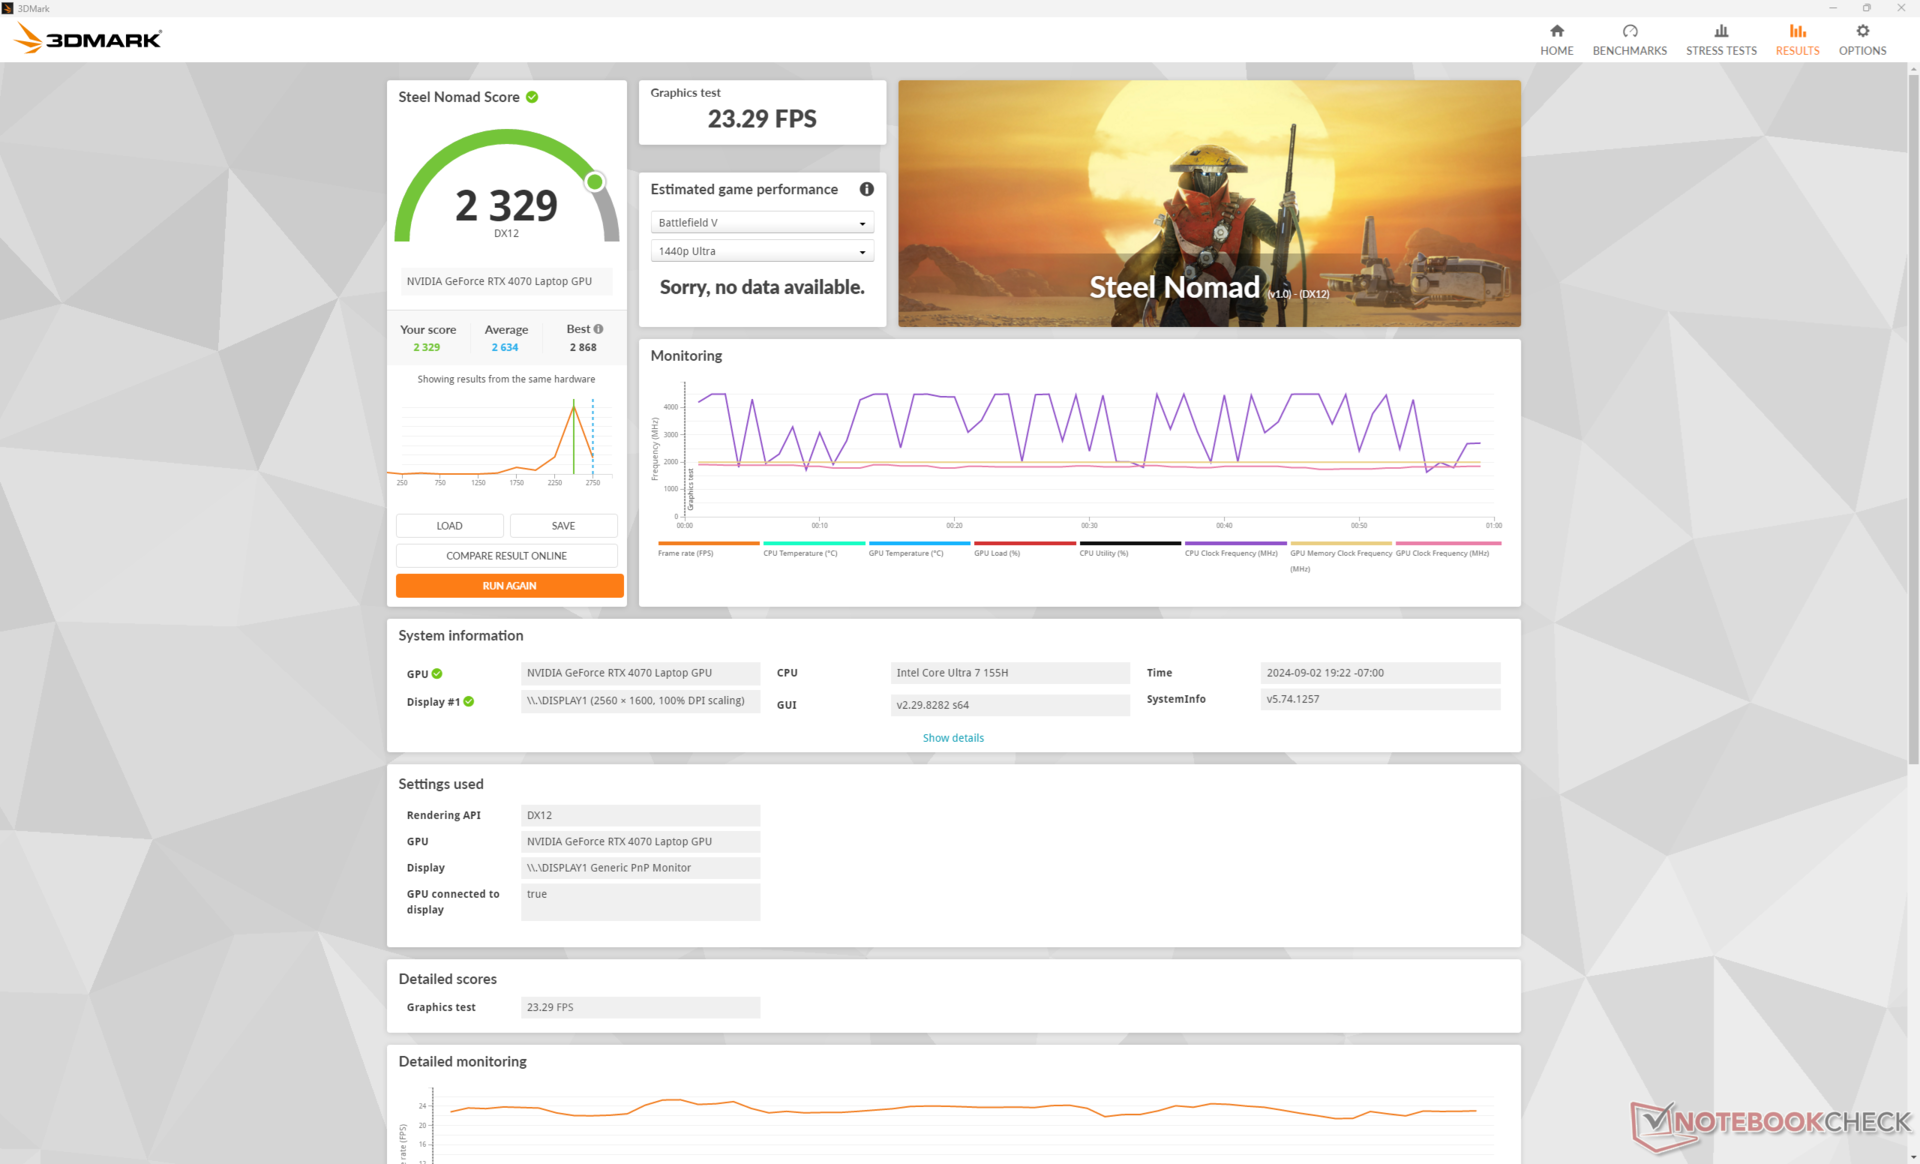
| 3DMark Steel Nomad Score | 2329 pkt. | |
Pomoc | ||
* ... im mniej tym lepiej
Wydajność w grach
Mobilny RTX 4070 jest wystarczająco wydajny, by uruchomić nowoczesne tytuły na maksymalnych ustawieniach w natywnej rozdzielczości QHD+. Bardziej wymagające tytuły, takie jak Cyberpunk 2077, są również możliwe do uruchomienia, aczkolwiek będą wymagać DLSS, aby osiągnąć 60 FPS lub więcej. Przykładowo, uruchomienie benchmarka w grze z ustawieniami Ultra RT i natywną rozdzielczością 1600p zwróciłoby średnią liczbę klatek na sekundę na poziomie zaledwie 20,2 w porównaniu do 63,1 z włączonym DLSS 3 Balanced.
| Performance Rating - Percent | |
| Razer Blade 16 2024, RTX 4090 | |
| Lenovo Legion Pro 5 16IRX9 | |
| Alienware x16 R2 P120F -1! | |
| Maingear ML-16 MK2 | |
| HP Victus 16 (2024) -1! | |
| Asus ROG Zephyrus G16 GA605WV | |
| GTA V - 1920x1080 Highest Settings possible AA:4xMSAA + FX AF:16x | |
| Razer Blade 16 2024, RTX 4090 | |
| Lenovo Legion Pro 5 16IRX9 | |
| Maingear ML-16 MK2 | |
| HP Victus 16 (2024) | |
| Asus ROG Zephyrus G16 GA605WV | |
| Final Fantasy XV Benchmark - 1920x1080 High Quality | |
| Alienware x16 R2 P120F | |
| Razer Blade 16 2024, RTX 4090 | |
| Lenovo Legion Pro 5 16IRX9 | |
| Maingear ML-16 MK2 | |
| HP Victus 16 (2024) | |
| Asus ROG Zephyrus G16 GA605WV | |
| Strange Brigade - 1920x1080 ultra AA:ultra AF:16 | |
| Razer Blade 16 2024, RTX 4090 | |
| Alienware x16 R2 P120F | |
| Lenovo Legion Pro 5 16IRX9 | |
| Maingear ML-16 MK2 | |
| HP Victus 16 (2024) | |
| Asus ROG Zephyrus G16 GA605WV | |
| Dota 2 Reborn - 1920x1080 ultra (3/3) best looking | |
| Razer Blade 16 2024, RTX 4090 | |
| Lenovo Legion Pro 5 16IRX9 | |
| HP Victus 16 (2024) | |
| Asus ROG Zephyrus G16 GA605WV | |
| Maingear ML-16 MK2 | |
| Alienware x16 R2 P120F | |
| X-Plane 11.11 - 1920x1080 high (fps_test=3) | |
| Razer Blade 16 2024, RTX 4090 | |
| Lenovo Legion Pro 5 16IRX9 | |
| HP Victus 16 (2024) | |
| Maingear ML-16 MK2 | |
| Alienware x16 R2 P120F | |
| Asus ROG Zephyrus G16 GA605WV | |
| Far Cry 5 - 1920x1080 Ultra Preset AA:T | |
| Lenovo Legion Pro 5 16IRX9 | |
| Razer Blade 16 2024, RTX 4090 | |
| Alienware x16 R2 P120F | |
| Maingear ML-16 MK2 | |
| Asus ROG Zephyrus G16 GA605WV | |
| Baldur's Gate 3 | |
| 1920x1080 High Preset | |
| Alienware x16 R2 P120F | |
| Lenovo Yoga Pro 9 16IMH9 | |
| Maingear ML-16 MK2 | |
| Przeciętny NVIDIA GeForce RTX 4070 Laptop GPU (72.7 - 129.3, n=26) | |
| CSL GameStar Notebook VenomGamer G16 | |
| 1920x1080 Ultra Preset | |
| Razer Blade 16 2024, RTX 4090 | |
| Alienware x16 R2 P120F | |
| Lenovo Yoga Pro 9 16IMH9 | |
| Maingear ML-16 MK2 | |
| Przeciętny NVIDIA GeForce RTX 4070 Laptop GPU (66.7 - 128.5, n=28) | |
| CSL GameStar Notebook VenomGamer G16 | |
| 2560x1440 Ultra Preset | |
| Razer Blade 16 2024, RTX 4090 | |
| Alienware x16 R2 P120F | |
| Lenovo Yoga Pro 9 16IMH9 | |
| Przeciętny NVIDIA GeForce RTX 4070 Laptop GPU (54.4 - 89.6, n=23) | |
| Maingear ML-16 MK2 | |
| CSL GameStar Notebook VenomGamer G16 | |
| Dota 2 Reborn | |
| 1920x1080 high (2/3) | |
| KFA2 GeForce RTX 4070 EX Gamer | |
| Razer Blade 16 2024, RTX 4090 | |
| Asus ROG Zephyrus M16 GU603Z | |
| HP Victus 16 (2024) | |
| HP Victus 16-r0076TX | |
| Przeciętny NVIDIA GeForce RTX 4070 Laptop GPU (88.2 - 210, n=66) | |
| Lenovo Yoga Pro 9 16IMH9 | |
| Maingear ML-16 MK2 | |
| HP Omen 16-b0085ng | |
| Alienware x16 R2 P120F | |
| Asus TUF Gaming A16 FA617XS | |
| Acer Nitro 16 AN16-41-R7YE | |
| Lenovo Legion C7 15IMH05 82EH0030GE | |
| CSL GameStar Notebook VenomGamer G16 | |
| HP Omen 16-n0033dx | |
| 1920x1080 ultra (3/3) best looking | |
| KFA2 GeForce RTX 4070 EX Gamer | |
| Razer Blade 16 2024, RTX 4090 | |
| Asus ROG Zephyrus M16 GU603Z | |
| HP Victus 16 (2024) | |
| Przeciętny NVIDIA GeForce RTX 4070 Laptop GPU (89.7 - 191.2, n=66) | |
| HP Victus 16-r0076TX | |
| Maingear ML-16 MK2 | |
| Lenovo Yoga Pro 9 16IMH9 | |
| HP Omen 16-b0085ng | |
| Alienware x16 R2 P120F | |
| Acer Nitro 16 AN16-41-R7YE | |
| Lenovo Legion C7 15IMH05 82EH0030GE | |
| Asus TUF Gaming A16 FA617XS | |
| CSL GameStar Notebook VenomGamer G16 | |
| HP Omen 16-n0033dx | |
| X-Plane 11.11 | |
| 1920x1080 med (fps_test=2) | |
| KFA2 GeForce RTX 4070 EX Gamer | |
| Razer Blade 16 2024, RTX 4090 | |
| Asus ROG Zephyrus M16 GU603Z | |
| HP Victus 16-r0076TX | |
| Przeciętny NVIDIA GeForce RTX 4070 Laptop GPU (74.7 - 191.1, n=66) | |
| HP Victus 16 (2024) | |
| Maingear ML-16 MK2 | |
| HP Omen 16-b0085ng | |
| Lenovo Yoga Pro 9 16IMH9 | |
| Alienware x16 R2 P120F | |
| Acer Nitro 16 AN16-41-R7YE | |
| Lenovo Legion C7 15IMH05 82EH0030GE | |
| CSL GameStar Notebook VenomGamer G16 | |
| Asus TUF Gaming A16 FA617XS | |
| HP Omen 16-n0033dx | |
| 1920x1080 high (fps_test=3) | |
| KFA2 GeForce RTX 4070 EX Gamer | |
| Razer Blade 16 2024, RTX 4090 | |
| Asus ROG Zephyrus M16 GU603Z | |
| HP Victus 16-r0076TX | |
| Przeciętny NVIDIA GeForce RTX 4070 Laptop GPU (52.1 - 147.9, n=68) | |
| HP Victus 16 (2024) | |
| HP Omen 16-b0085ng | |
| Lenovo Yoga Pro 9 16IMH9 | |
| Maingear ML-16 MK2 | |
| Alienware x16 R2 P120F | |
| Lenovo Legion C7 15IMH05 82EH0030GE | |
| Acer Nitro 16 AN16-41-R7YE | |
| CSL GameStar Notebook VenomGamer G16 | |
| Asus TUF Gaming A16 FA617XS | |
| HP Omen 16-n0033dx | |
| Tiny Tina's Wonderlands | |
| 1920x1080 High Preset (DX12) | |
| KFA2 GeForce RTX 4070 EX Gamer | |
| Alienware x16 R2 P120F | |
| Przeciętny NVIDIA GeForce RTX 4070 Laptop GPU (74.3 - 151.4, n=14) | |
| Maingear ML-16 MK2 | |
| Asus TUF Gaming A16 FA617XS | |
| 1920x1080 Badass Preset (DX12) | |
| KFA2 GeForce RTX 4070 EX Gamer | |
| Alienware x16 R2 P120F | |
| Przeciętny NVIDIA GeForce RTX 4070 Laptop GPU (58.6 - 115.9, n=17) | |
| Maingear ML-16 MK2 | |
| Asus TUF Gaming A16 FA617XS | |
| 2560x1440 Badass Preset (DX12) | |
| KFA2 GeForce RTX 4070 EX Gamer | |
| Alienware x16 R2 P120F | |
| Przeciętny NVIDIA GeForce RTX 4070 Laptop GPU (49.8 - 79.5, n=16) | |
| Maingear ML-16 MK2 | |
| Cyberpunk 2077 2.2 Phantom Liberty | |
| 1920x1080 Medium Preset (FSR off) | |
| Alienware x16 R2 P120F | |
| Przeciętny NVIDIA GeForce RTX 4070 Laptop GPU (81.6 - 124.5, n=29) | |
| Lenovo Yoga Pro 9 16IMH9 | |
| Maingear ML-16 MK2 | |
| HP Victus 16 (2024) | |
| CSL GameStar Notebook VenomGamer G16 | |
| 1920x1080 High Preset (FSR off) | |
| Alienware x16 R2 P120F | |
| Przeciętny NVIDIA GeForce RTX 4070 Laptop GPU (74.7 - 103.6, n=30) | |
| Lenovo Yoga Pro 9 16IMH9 | |
| Maingear ML-16 MK2 | |
| HP Victus 16 (2024) | |
| CSL GameStar Notebook VenomGamer G16 | |
| 1920x1080 Ultra Preset (FSR off) | |
| Alienware x16 R2 P120F | |
| Razer Blade 16 2024, RTX 4090 | |
| Przeciętny NVIDIA GeForce RTX 4070 Laptop GPU (30.7 - 90.7, n=38) | |
| Lenovo Yoga Pro 9 16IMH9 | |
| Maingear ML-16 MK2 | |
| HP Victus 16 (2024) | |
| CSL GameStar Notebook VenomGamer G16 | |
| 2560x1440 Ultra Preset (FSR off) | |
| Razer Blade 16 2024, RTX 4090 | |
| Alienware x16 R2 P120F | |
| Przeciętny NVIDIA GeForce RTX 4070 Laptop GPU (24.8 - 57.1, n=35) | |
| Lenovo Yoga Pro 9 16IMH9 | |
| Maingear ML-16 MK2 | |
| CSL GameStar Notebook VenomGamer G16 | |
Cyberpunk 2077 ultra FPS Chart
| low | med. | high | ultra | QHD | |
|---|---|---|---|---|---|
| GTA V (2015) | 183.3 | 180.4 | 175 | 115.1 | 90.6 |
| Dota 2 Reborn (2015) | 173.4 | 152.8 | 145.3 | 139.2 | |
| Final Fantasy XV Benchmark (2018) | 187.6 | 146.3 | 110.6 | 80 | |
| X-Plane 11.11 (2018) | 139.9 | 124.4 | 89.8 | ||
| Far Cry 5 (2018) | 125 | 125 | 114 | 101 | |
| Strange Brigade (2018) | 477 | 284 | 224 | 192.8 | 127.9 |
| Tiny Tina's Wonderlands (2022) | 218.7 | 180.9 | 119.4 | 92.9 | 62.7 |
| F1 22 (2022) | 252 | 250 | 206 | 69.2 | 42.9 |
| Baldur's Gate 3 (2023) | 152 | 125.9 | 108.2 | 106.8 | 70.6 |
| Cyberpunk 2077 2.2 Phantom Liberty (2023) | 130 | 106.1 | 88.1 | 76.4 | 44.3 |
Emisje - gorące i głośne
Hałas systemowy
Hałas wentylatora podczas przeglądania stron internetowych lub strumieniowania wideo osiąga wartość szczytową 27 dB(A) na cichym tle 23 dB(A), co jest zauważalne, ale znośne po ustawieniu trybu cichego. W przypadku grania w trybie wydajności hałas wentylatora stałby się bardzo głośny i wynosiłby nieco ponad 55 dB(A), aby być głośniejszym niż konkurenci, tacy jak Victus 16, Alienware x16 R2czy Legion Pro 5 16. Włączenie maksymalnego hałasu wentylatora jeszcze bardziej zwiększyłoby hałas wentylatora do prawie 58 dB(A).

Hałas
| luz |
| 24.1 / 24.1 / 25.6 dB |
| obciążenie |
| 44.3 / 57.8 dB |
 | ||
30 dB cichy 40 dB(A) słyszalny 50 dB(A) irytujący |
||
min: | ||
| Maingear ML-16 MK2 NVIDIA GeForce RTX 4070 Laptop GPU, Ultra 7 155H | Asus ROG Zephyrus G16 GA605WV NVIDIA GeForce RTX 4060 Laptop GPU, Ryzen AI 9 HX 370, Micron 2400 MTFDKBA1T0QFM | HP Victus 16 (2024) NVIDIA GeForce RTX 4060 Laptop GPU, i7-14700HX, Kioxia XG8 KXG80ZNV512G | Alienware x16 R2 P120F NVIDIA GeForce RTX 4080 Laptop GPU, Ultra 9 185H, WDC PC SN810 1TB | Lenovo Legion Pro 5 16IRX9 NVIDIA GeForce RTX 4070 Laptop GPU, i9-14900HX, Samsung PM9A1 MZVL21T0HCLR | Razer Blade 16 2024, RTX 4090 NVIDIA GeForce RTX 4090 Laptop GPU, i9-14900HX, Samsung PM9A1 MZVL22T0HBLB | |
|---|---|---|---|---|---|---|
| Noise | -4% | -10% | 2% | -3% | 3% | |
| wyłączone / środowisko * | 23 | 24.6 -7% | 25 -9% | 23.4 -2% | 23.9 -4% | 23 -0% |
| Idle Minimum * | 24.1 | 28.6 -19% | 28 -16% | 23.8 1% | 24.3 -1% | 23 5% |
| Idle Average * | 24.1 | 28.6 -19% | 29 -20% | 28.5 -18% | 24.3 -1% | 23 5% |
| Idle Maximum * | 25.6 | 28.6 -12% | 33 -29% | 28.5 -11% | 28.9 -13% | 27.66 -8% |
| Load Average * | 44.3 | 42.8 3% | 45 -2% | 28.8 35% | 45.8 -3% | 43.76 1% |
| Cyberpunk 2077 ultra * | 55.4 | 48.3 13% | ||||
| Load Maximum * | 57.8 | 48.3 16% | 48 17% | 54.2 6% | 56.6 2% | 50.37 13% |
| Witcher 3 ultra * | 43 | 49.5 | 51 | 46.81 |
* ... im mniej tym lepiej
Temperatura
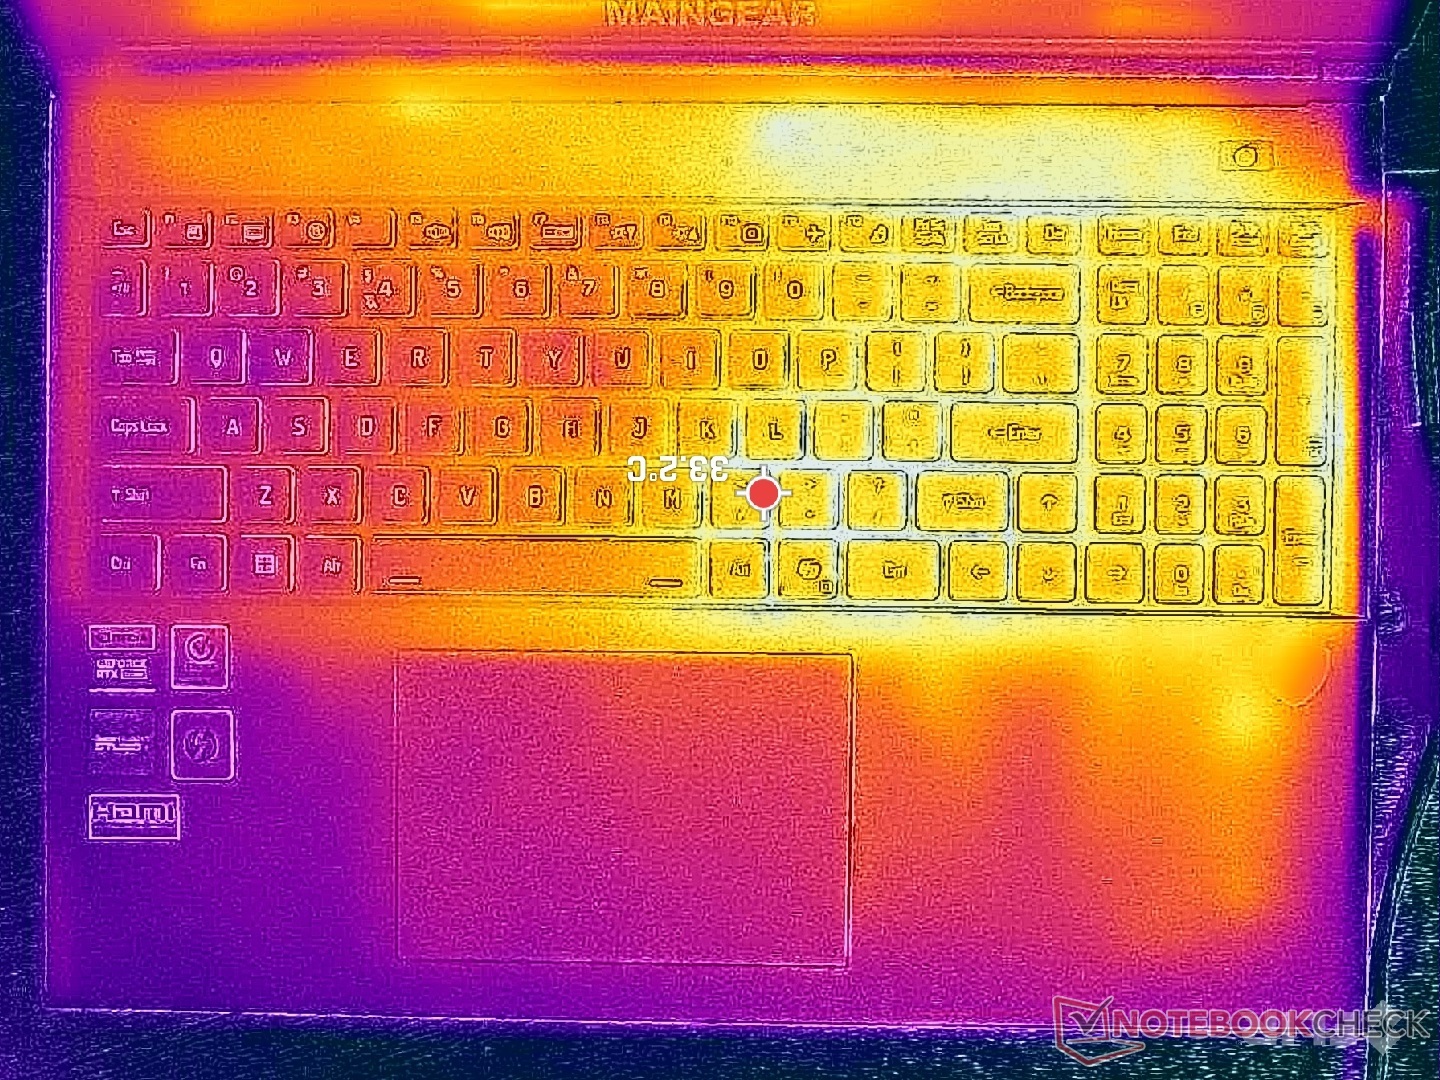
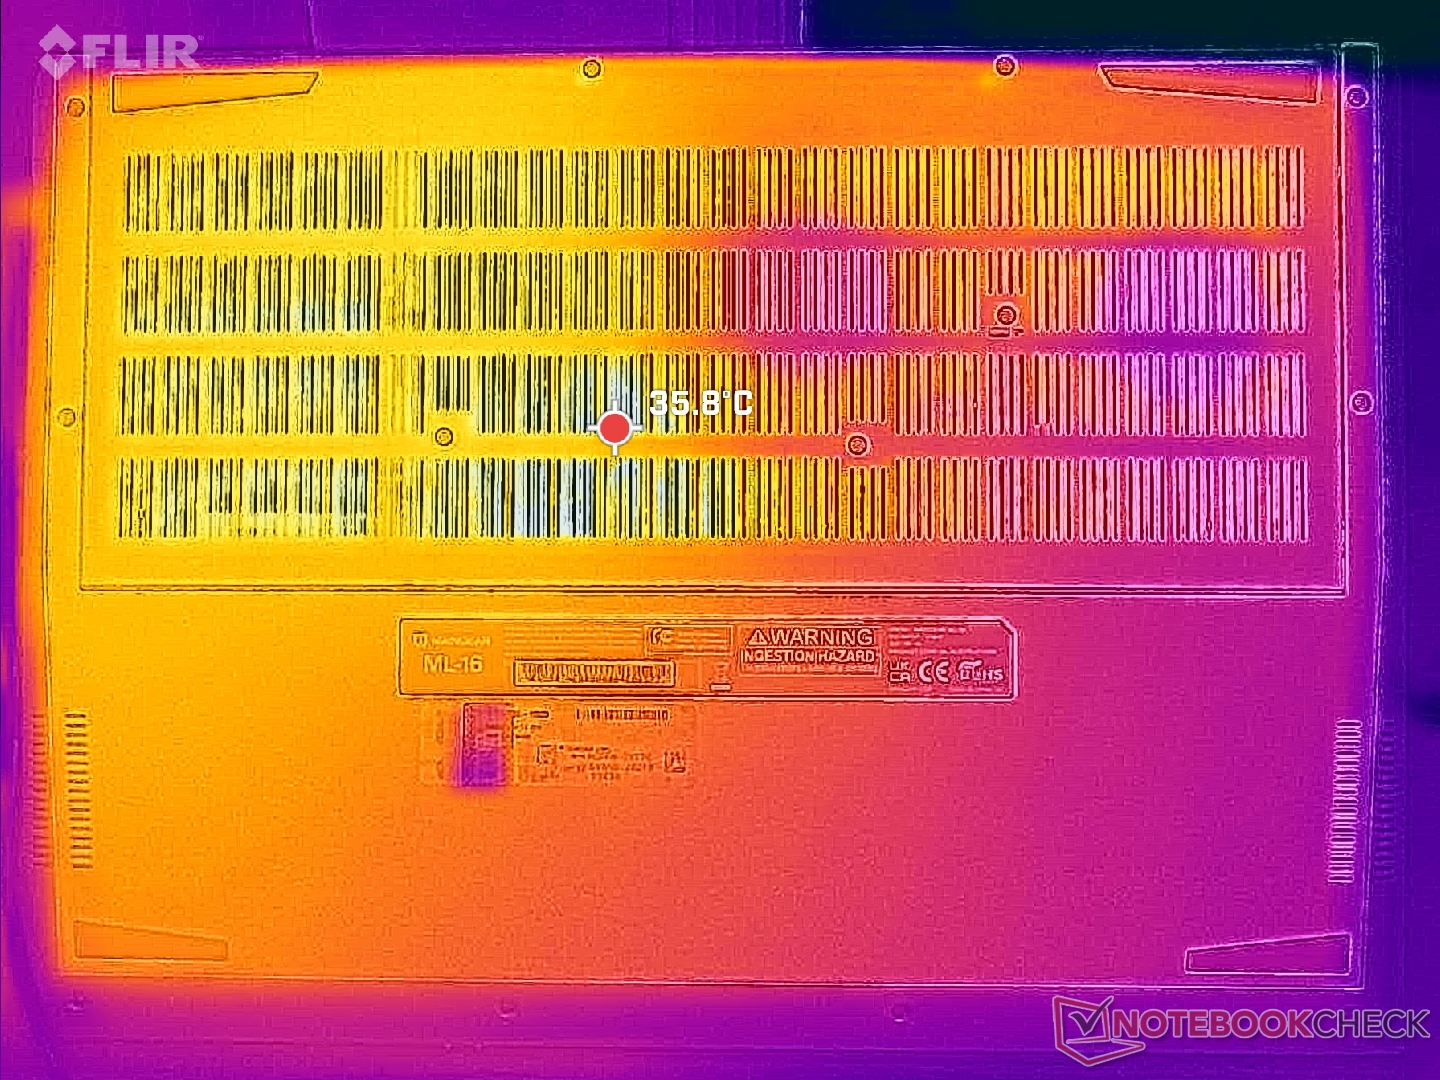
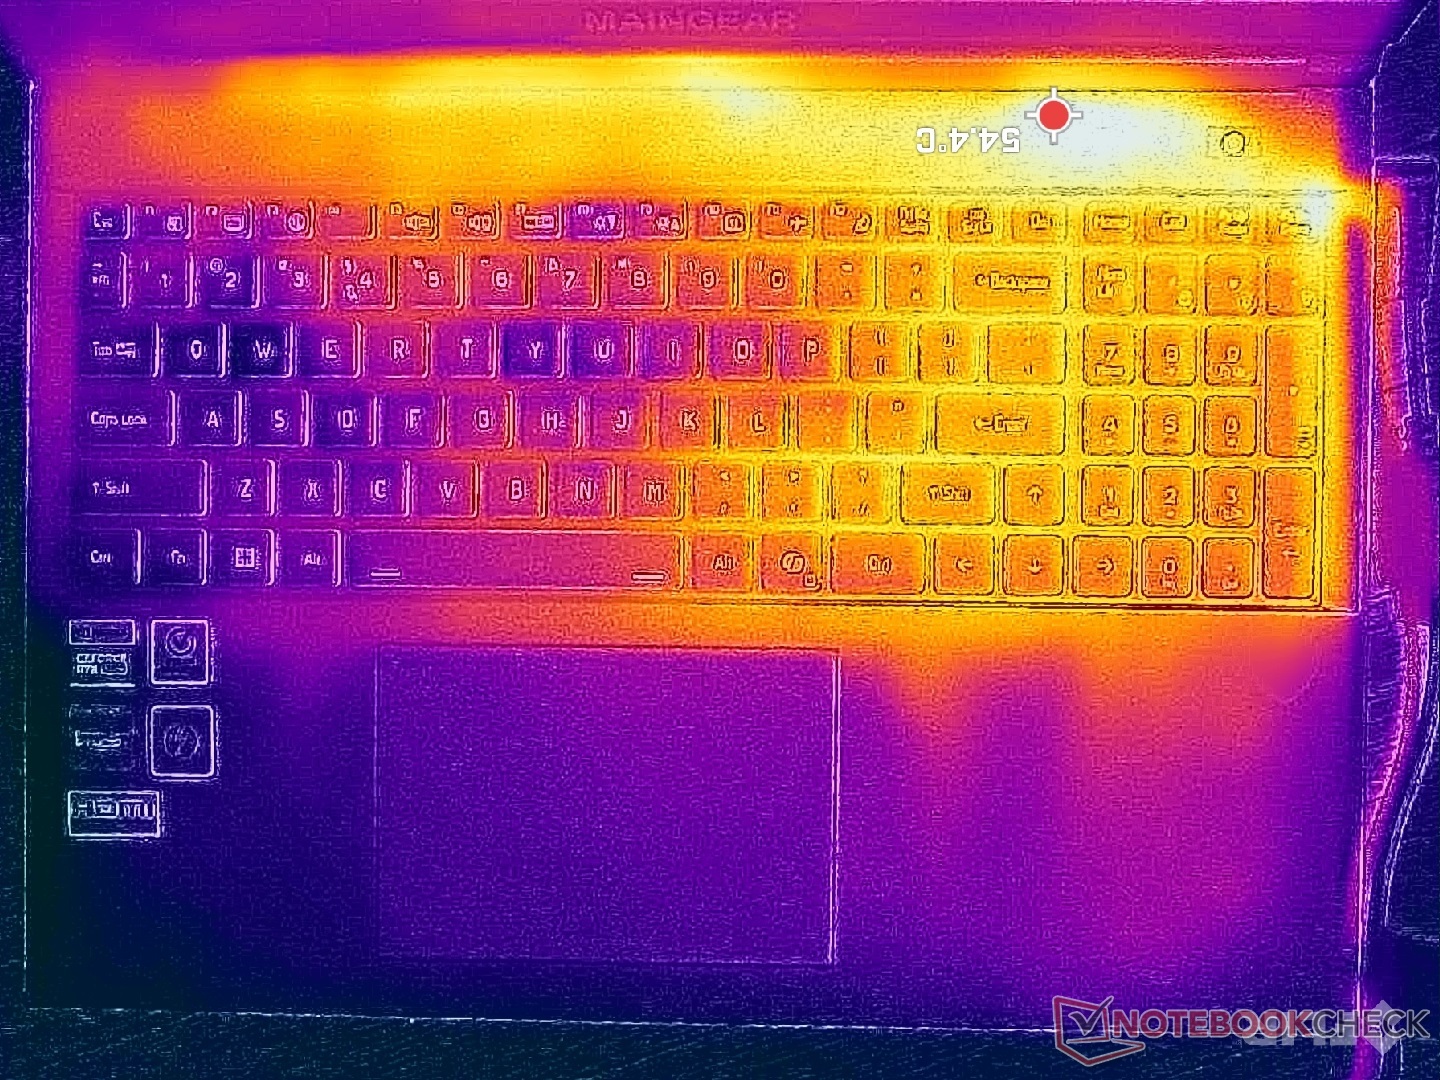
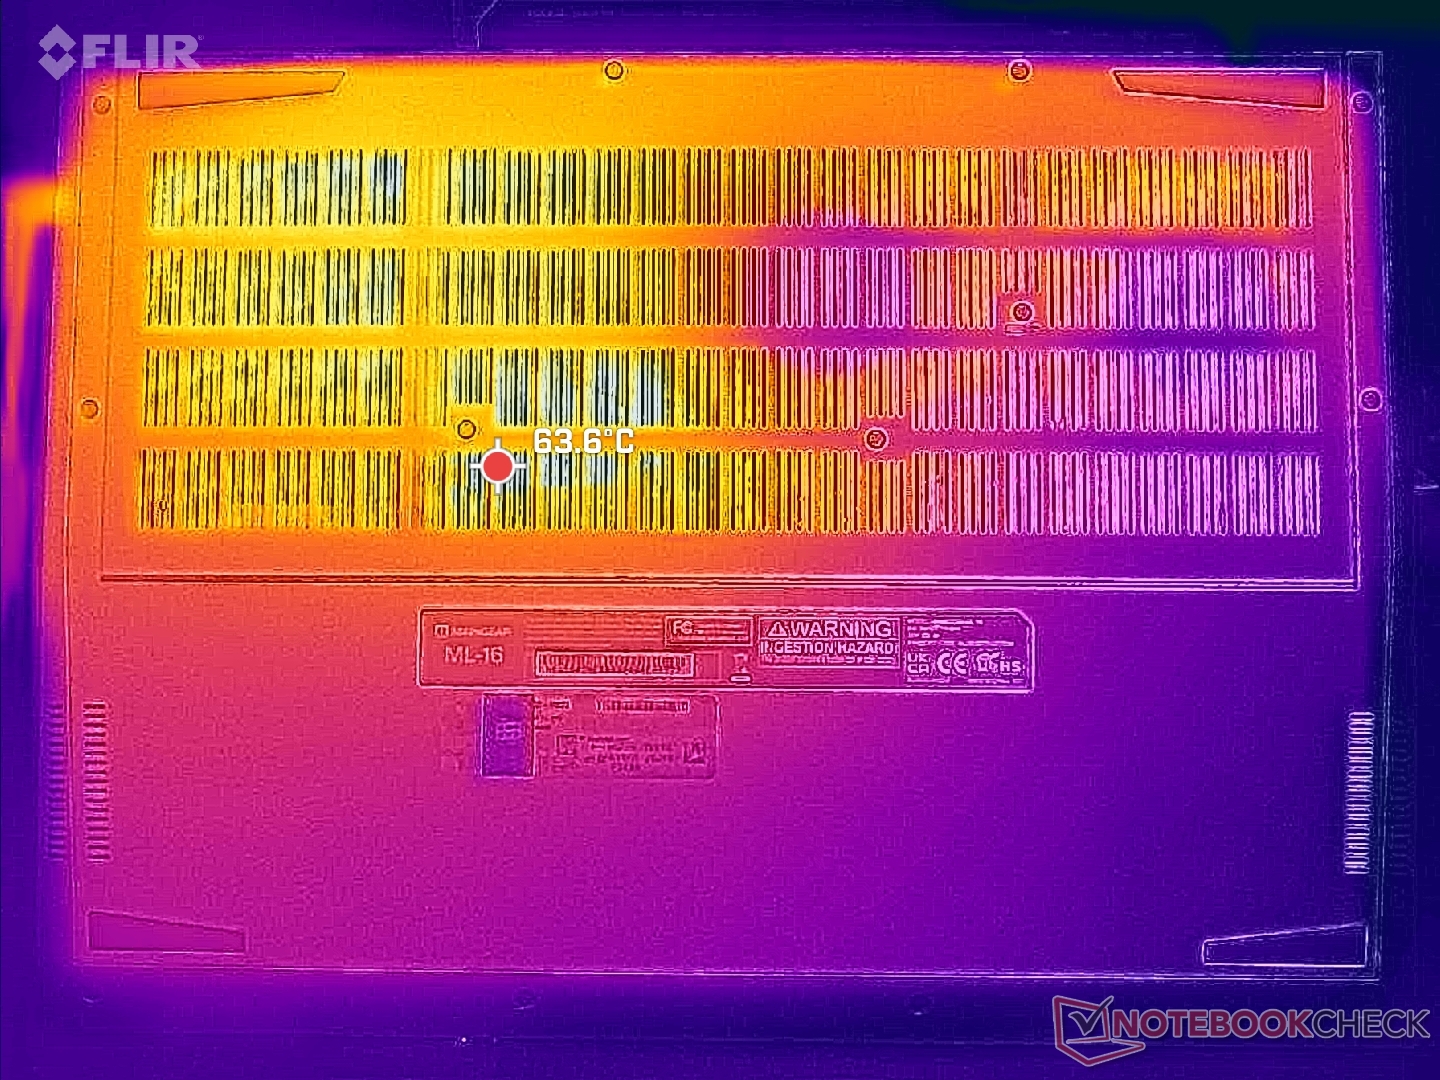
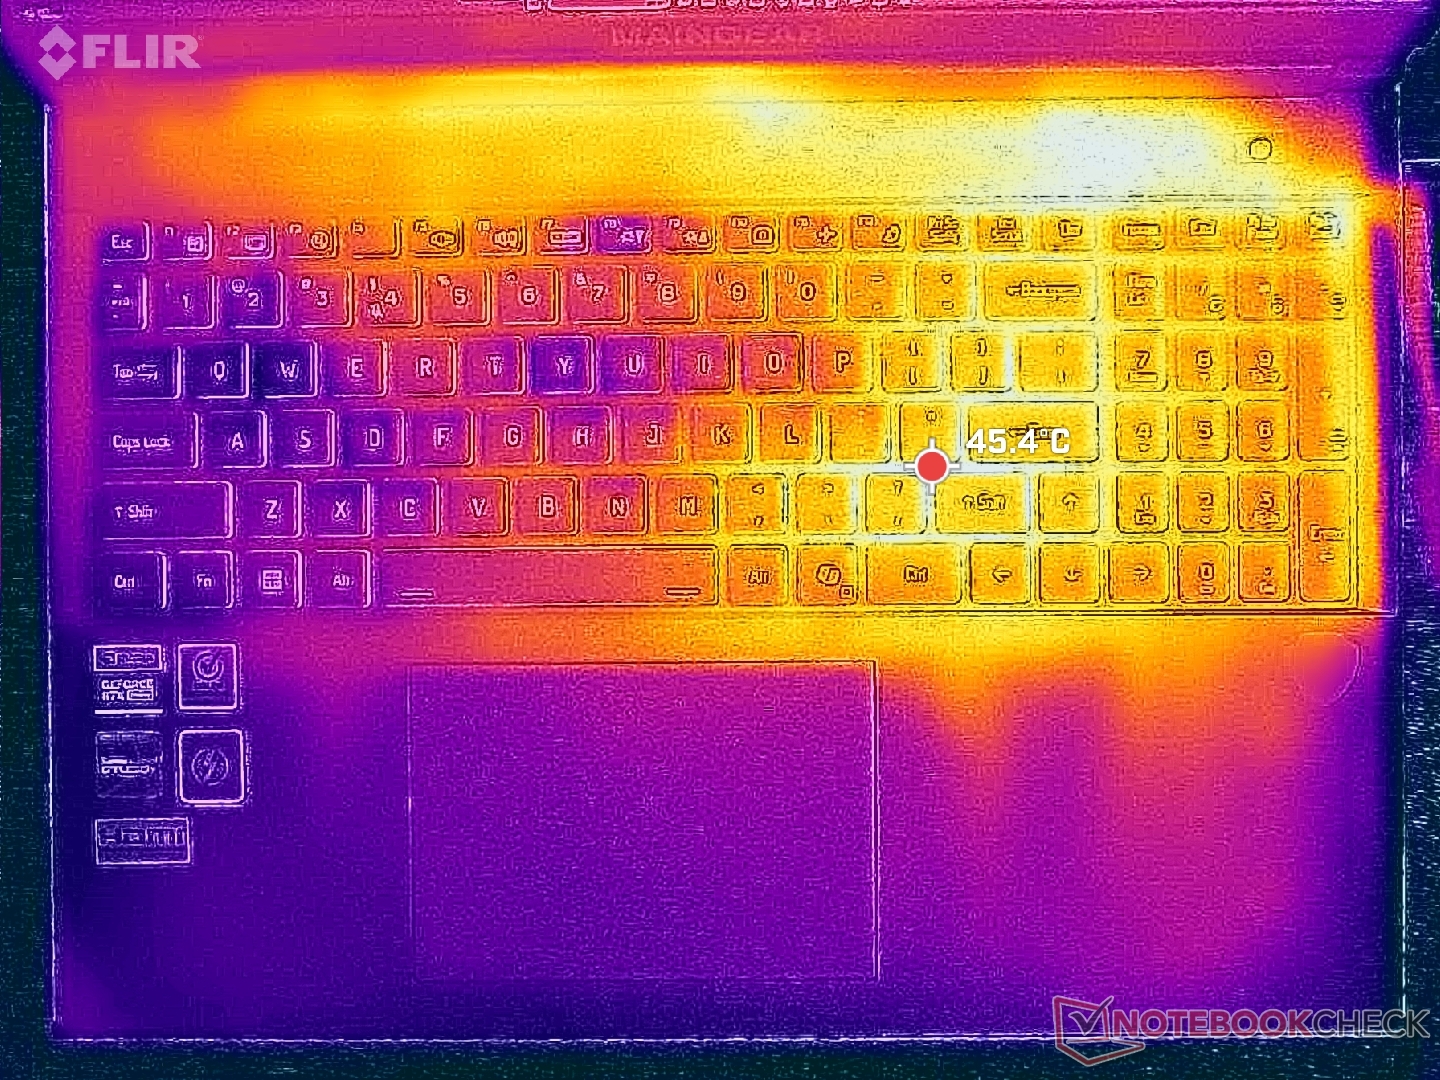
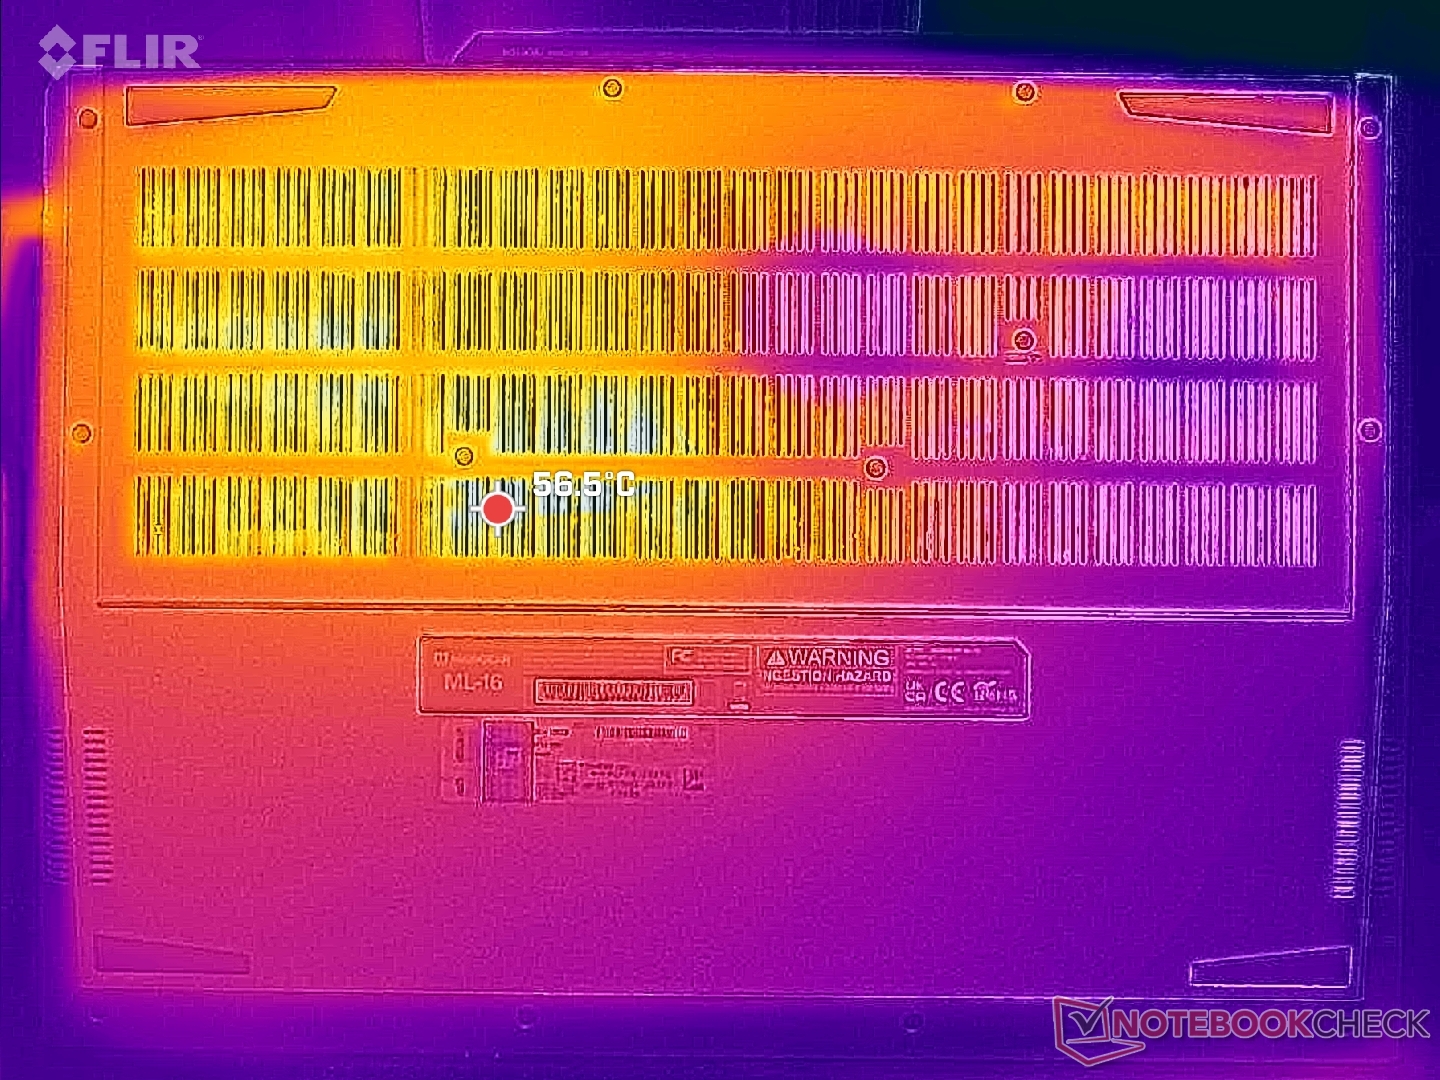
Bardzo wysokie temperatury pracy, jak wspomniano powyżej, prowadzą do wyższych niż przeciętne temperatur powierzchni. Gorące punkty podczas grania mogą osiągnąć ponad 54 C i 56 C odpowiednio na górze i na dole, w porównaniu do zaledwie 40 C na Blade 16 lub 47 C na Legion Pro 5 16IRX9.
Co więcej, asymetryczne rozwiązanie chłodzenia oznacza, że prawa połowa obudowy lub klawiatury będzie znacznie cieplejsza niż lewa. Jest to przeciwieństwo do większości innych laptopów do gier, gdzie symetryczne rozwiązania chłodzenia są powszechne. Nie jest to duży problem, ponieważ większość gier wykorzystuje tylko klawisze WASD na lewej połowie klawiatury, ale można spodziewać się spoconej dłoni, jeśli gra wymaga wejścia z numpada.
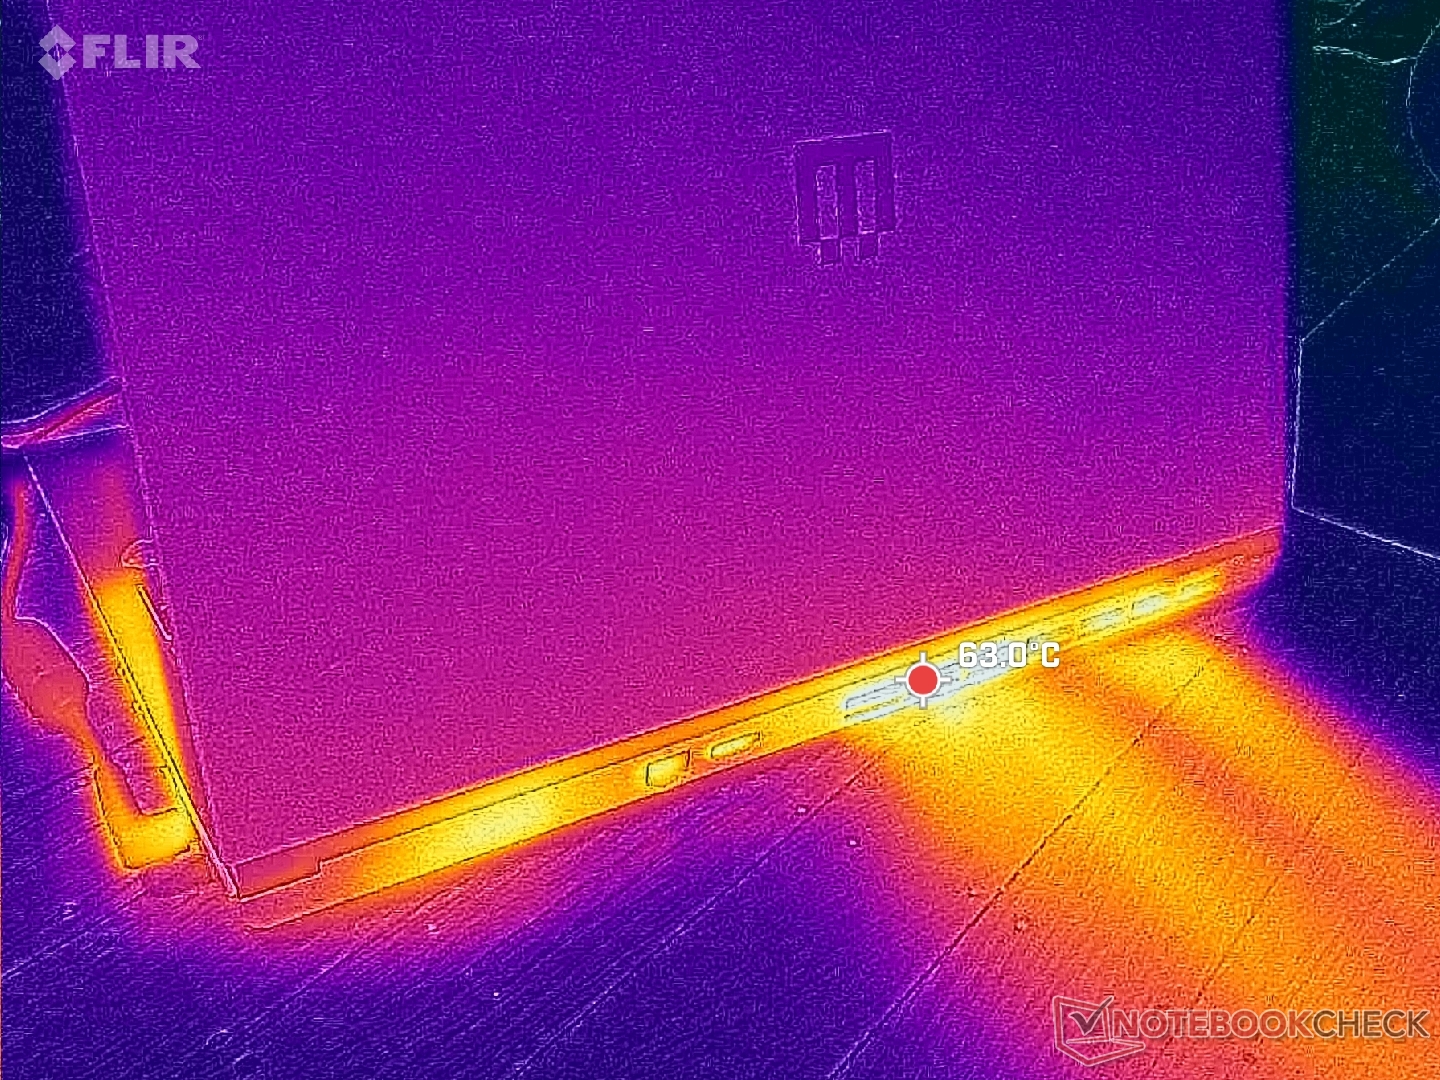
(-) Maksymalna temperatura w górnej części wynosi 45.2 °C / 113 F, w porównaniu do średniej 40.4 °C / 105 F , począwszy od 21.2 do 68.8 °C dla klasy Gaming.
(-) Dno nagrzewa się maksymalnie do 48.8 °C / 120 F, w porównaniu do średniej 43.2 °C / 110 F
(+) W stanie bezczynności średnia temperatura górnej części wynosi 31.9 °C / 89 F, w porównaniu ze średnią temperaturą urządzenia wynoszącą 33.9 °C / ### class_avg_f### F.
(-) 3: The average temperature for the upper side is 40 °C / 104 F, compared to the average of 33.9 °C / 93 F for the class Gaming.
(+) Podparcia dłoni i touchpad osiągają maksymalną temperaturę skóry (34.6 °C / 94.3 F) i dlatego nie są gorące.
(-) Średnia temperatura obszaru podparcia dłoni w podobnych urządzeniach wynosiła 28.9 °C / 84 F (-5.7 °C / -10.3 F).
| Maingear ML-16 MK2 Intel Core Ultra 7 155H, NVIDIA GeForce RTX 4070 Laptop GPU | Asus ROG Zephyrus G16 GA605WV AMD Ryzen AI 9 HX 370, NVIDIA GeForce RTX 4060 Laptop GPU | HP Victus 16 (2024) Intel Core i7-14700HX, NVIDIA GeForce RTX 4060 Laptop GPU | Alienware x16 R2 P120F Intel Core Ultra 9 185H, NVIDIA GeForce RTX 4080 Laptop GPU | Lenovo Legion Pro 5 16IRX9 Intel Core i9-14900HX, NVIDIA GeForce RTX 4070 Laptop GPU | Razer Blade 16 2024, RTX 4090 Intel Core i9-14900HX, NVIDIA GeForce RTX 4090 Laptop GPU | |
|---|---|---|---|---|---|---|
| Heat | 8% | 12% | -4% | 0% | 12% | |
| Maximum Upper Side * | 45.2 | 48.2 -7% | 50 -11% | 51 -13% | 43.8 3% | 45 -0% |
| Maximum Bottom * | 48.8 | 51.3 -5% | 50 -2% | 50.8 -4% | 55.4 -14% | 45 8% |
| Idle Upper Side * | 34.8 | 28 20% | 25 28% | 36.6 -5% | 32.8 6% | 29 17% |
| Idle Bottom * | 38.2 | 28.8 25% | 26 32% | 35.2 8% | 36 6% | 30 21% |
* ... im mniej tym lepiej
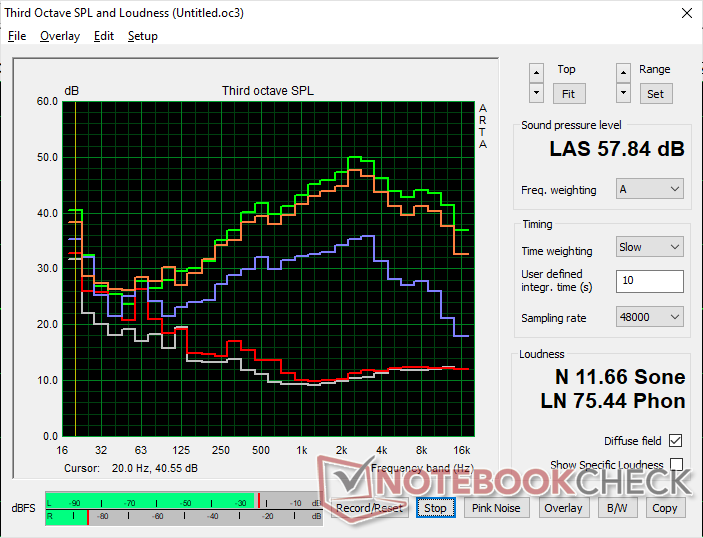
Głośniki
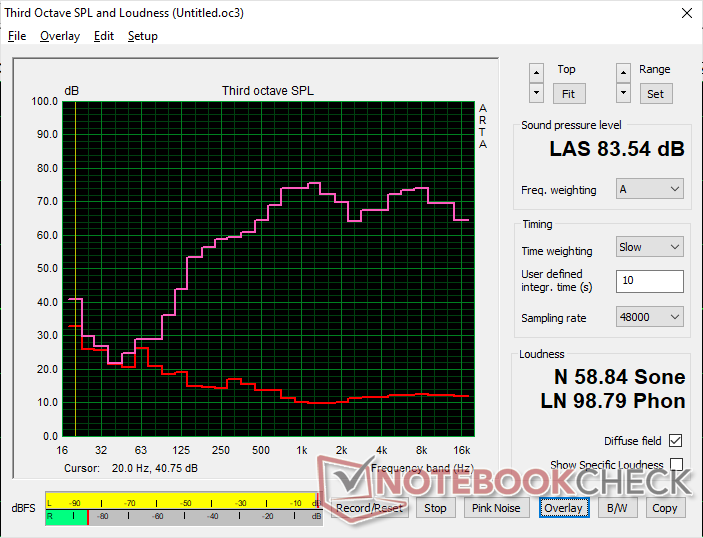
Maingear ML-16 MK2 analiza dźwięku
(+) | głośniki mogą odtwarzać stosunkowo głośno (83.5 dB)
Bas 100 - 315 Hz
(-) | prawie brak basu - średnio 16.1% niższa od mediany
(±) | liniowość basu jest średnia (9.2% delta do poprzedniej częstotliwości)
Średnie 400 - 2000 Hz
(+) | zbalansowane środki średnie - tylko 4.9% od mediany
(+) | średnie są liniowe (4.9% delta do poprzedniej częstotliwości)
Wysokie 2–16 kHz
(+) | zrównoważone maksima - tylko 3.3% od mediany
(+) | wzloty są liniowe (5.1% delta do poprzedniej częstotliwości)
Ogólnie 100 - 16.000 Hz
(+) | ogólny dźwięk jest liniowy (13.7% różnicy w stosunku do mediany)
W porównaniu do tej samej klasy
» 20% wszystkich testowanych urządzeń w tej klasie było lepszych, 6% podobnych, 74% gorszych
» Najlepszy miał deltę 6%, średnia wynosiła ###średnia###%, najgorsza wynosiła 132%
W porównaniu do wszystkich testowanych urządzeń
» 13% wszystkich testowanych urządzeń było lepszych, 4% podobnych, 83% gorszych
» Najlepszy miał deltę 4%, średnia wynosiła ###średnia###%, najgorsza wynosiła 134%
Apple MacBook Pro 16 2021 M1 Pro analiza dźwięku
(+) | głośniki mogą odtwarzać stosunkowo głośno (84.7 dB)
Bas 100 - 315 Hz
(+) | dobry bas - tylko 3.8% od mediany
(+) | bas jest liniowy (5.2% delta do poprzedniej częstotliwości)
Średnie 400 - 2000 Hz
(+) | zbalansowane środki średnie - tylko 1.3% od mediany
(+) | średnie są liniowe (2.1% delta do poprzedniej częstotliwości)
Wysokie 2–16 kHz
(+) | zrównoważone maksima - tylko 1.9% od mediany
(+) | wzloty są liniowe (2.7% delta do poprzedniej częstotliwości)
Ogólnie 100 - 16.000 Hz
(+) | ogólny dźwięk jest liniowy (4.6% różnicy w stosunku do mediany)
W porównaniu do tej samej klasy
» 0% wszystkich testowanych urządzeń w tej klasie było lepszych, 0% podobnych, 100% gorszych
» Najlepszy miał deltę 5%, średnia wynosiła ###średnia###%, najgorsza wynosiła 45%
W porównaniu do wszystkich testowanych urządzeń
» 0% wszystkich testowanych urządzeń było lepszych, 0% podobnych, 100% gorszych
» Najlepszy miał deltę 4%, średnia wynosiła ###średnia###%, najgorsza wynosiła 134%
Zarządzanie energią
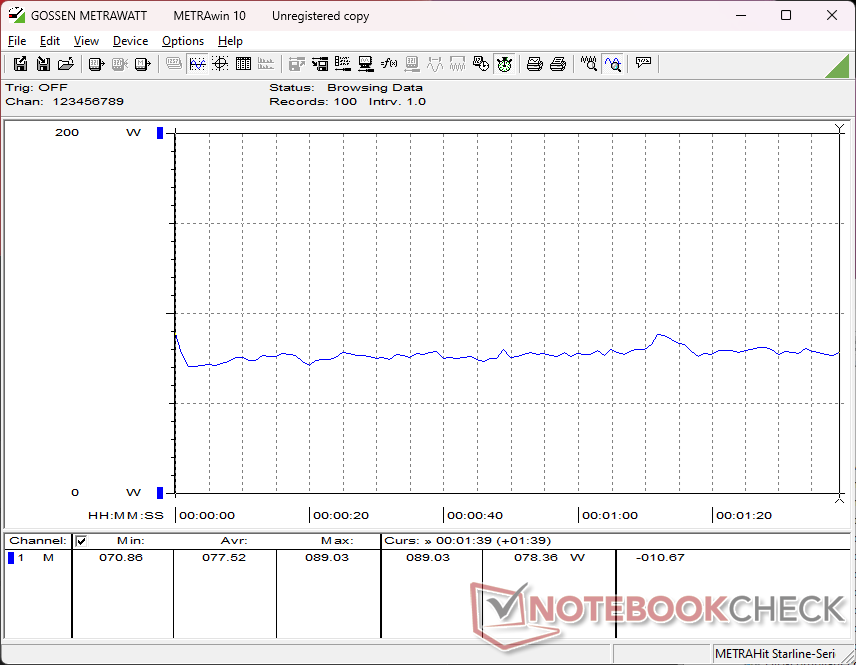
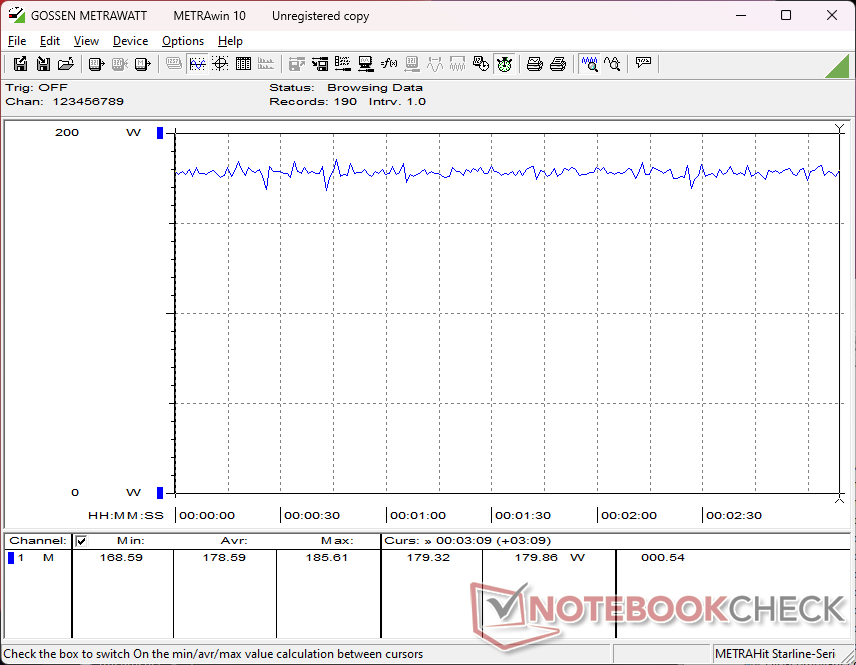
Zużycie energii
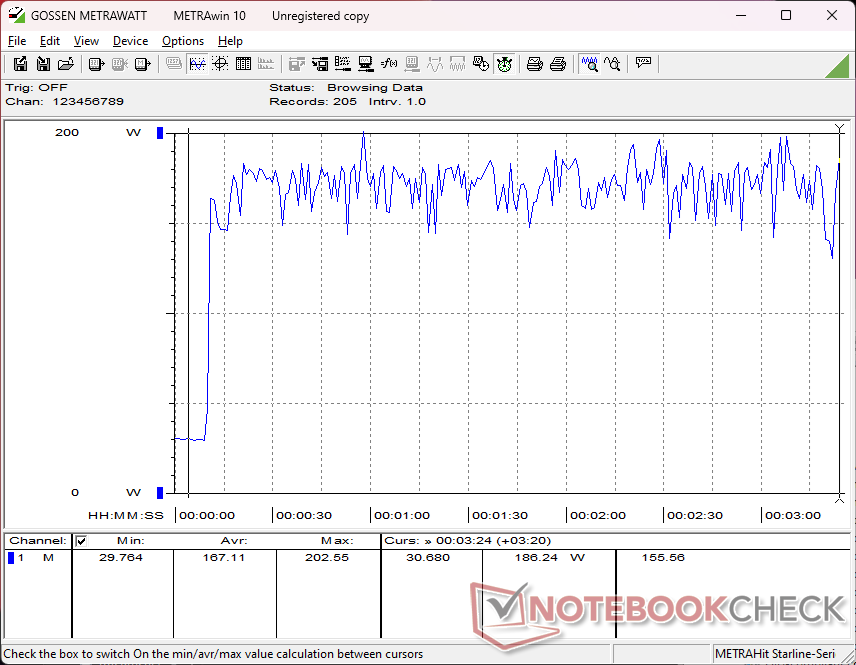
Zużycie energii na biegu jałowym waha się od 7 W do 27 W w zależności od ustawień GPU i poziomu jasności, co jest szerszym zakresem w porównaniu do konkurentów. Wyjaśnia to również stosunkowo krótki czas pracy na baterii w następnej sekcji poniżej. Samo włączenie trybu dGPU i maksymalnej jasności wyświetlacza powoduje, że zużycie energii wzrasta z 7 W do 23 W, więc zaleca się pracę w trybie MSHybrid, jeśli żywotność baterii jest ważna.
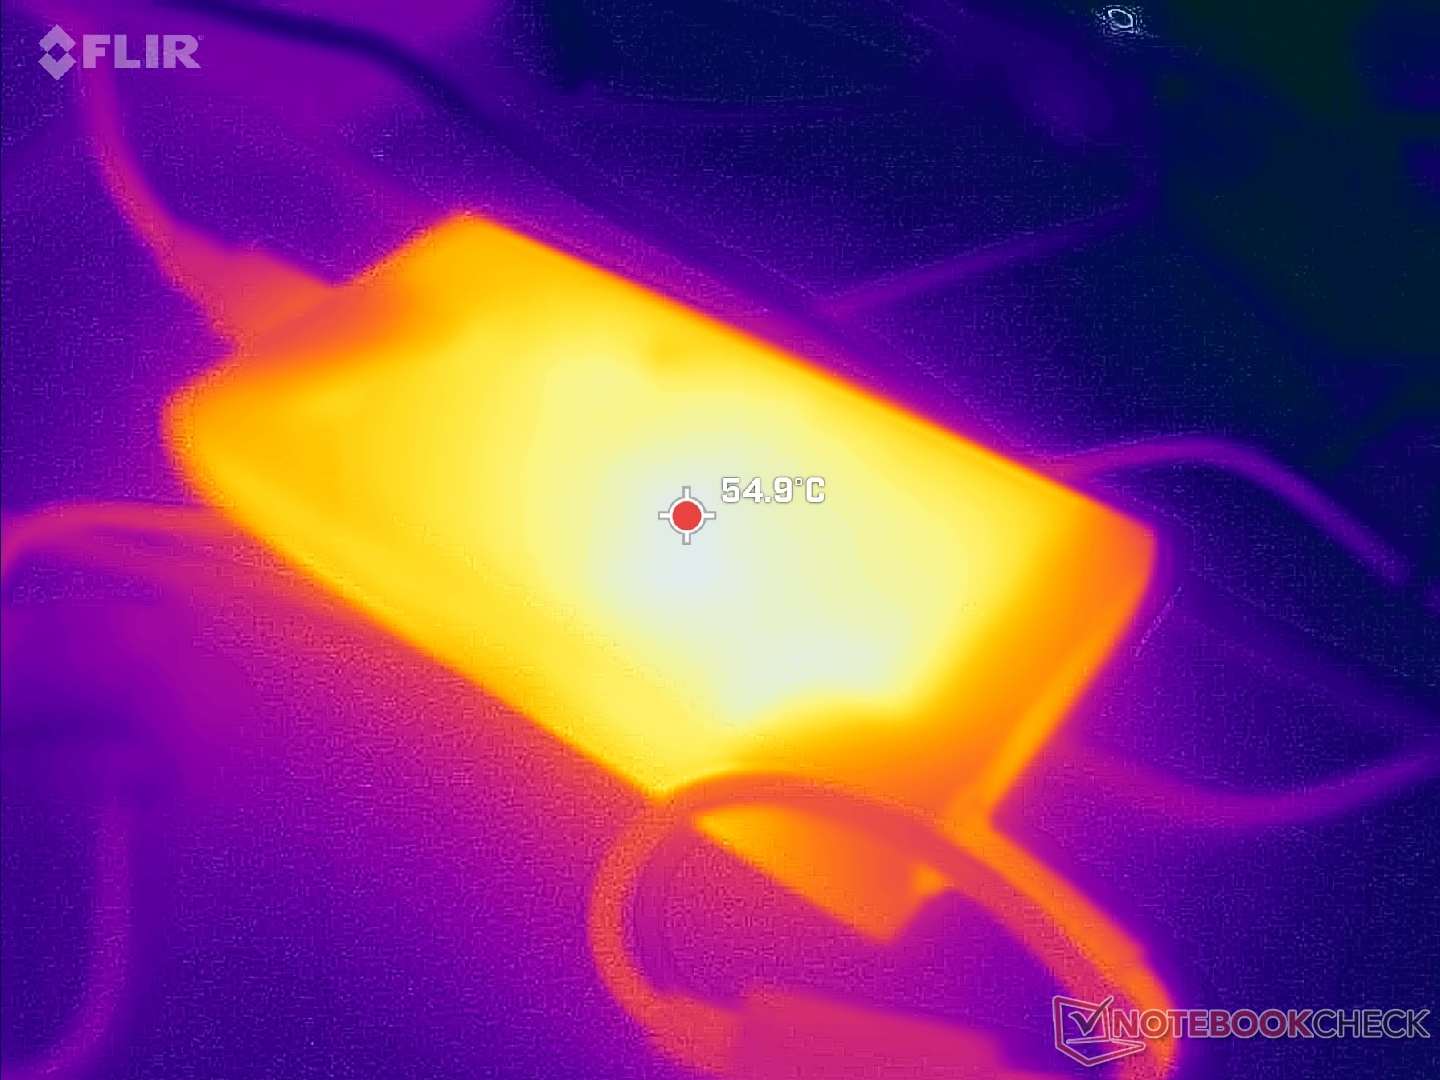
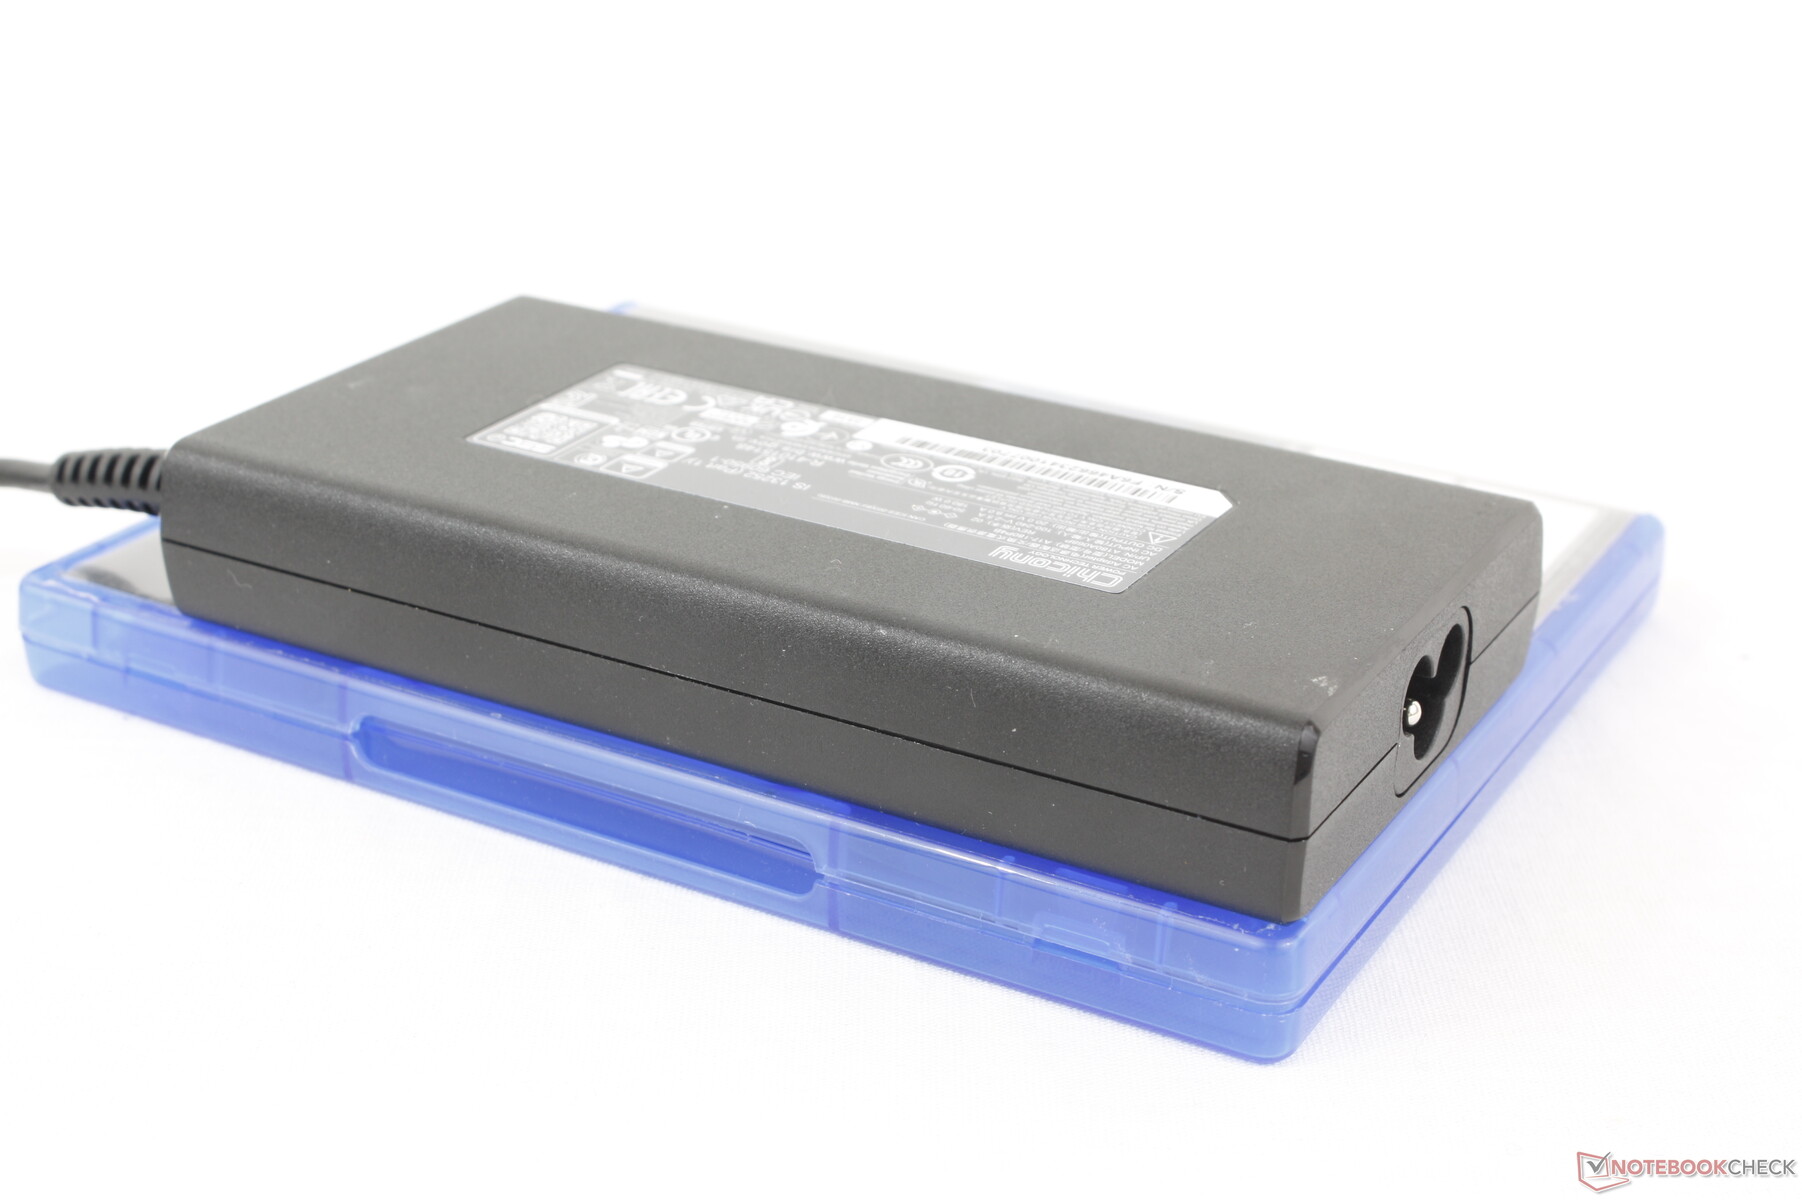
Gry wymagają średnio około 179 W ze średniej wielkości (~14,4 x 7,5 x 2,3 cm) zasilacza sieciowego o mocy 180 W. Oznacza to, że szybkość ładowania spowolni do zera w przypadku jednoczesnego uruchamiania gier, a także sugeruje, że wydajność mogłaby być szybsza, gdyby model był dostarczany z większym zasilaczem 230 W. W rzeczywistości jesteśmy w stanie zarejestrować maksymalny pobór 203 W, gdy procesor i karta graficzna są w pełni wykorzystane, aby udowodnić, że system może wymagać więcej niż może bezpiecznie zapewnić zasilacz sieciowy. Jest to podobne do tego, co zaobserwowaliśmy na Lenovo Yoga Pro 9i 16 G9 gdzie stwierdziliśmy, że jego zasilacz sieciowy o mocy 170 W jest zbyt mały dla procesora Core Ultra H i karty graficznej RTX 4070.

| wyłączony / stan wstrzymania | |
| luz | |
| obciążenie |
|
Legenda:
min: | |
| Maingear ML-16 MK2 Ultra 7 155H, NVIDIA GeForce RTX 4070 Laptop GPU, , IPS, 2560x1600, 16" | Asus ROG Zephyrus G16 GA605WV Ryzen AI 9 HX 370, NVIDIA GeForce RTX 4060 Laptop GPU, Micron 2400 MTFDKBA1T0QFM, OLED, 2560x1600, 16" | HP Victus 16 (2024) i7-14700HX, NVIDIA GeForce RTX 4060 Laptop GPU, Kioxia XG8 KXG80ZNV512G, IPS, 1920x1080, 16.1" | Alienware x16 R2 P120F Ultra 9 185H, NVIDIA GeForce RTX 4080 Laptop GPU, WDC PC SN810 1TB, IPS, 2560x1600, 16" | Lenovo Legion Pro 5 16IRX9 i9-14900HX, NVIDIA GeForce RTX 4070 Laptop GPU, Samsung PM9A1 MZVL21T0HCLR, IPS, 2560x1600, 16" | Razer Blade 16 2024, RTX 4090 i9-14900HX, NVIDIA GeForce RTX 4090 Laptop GPU, Samsung PM9A1 MZVL22T0HBLB, OLED, 2560x1600, 16" | |
|---|---|---|---|---|---|---|
| Power Consumption | 24% | -9% | -20% | -29% | -39% | |
| Idle Minimum * | 7.7 | 6.9 10% | 9 -17% | 9.9 -29% | 12.5 -62% | 16.9 -119% |
| Idle Average * | 22.9 | 12.6 45% | 15 34% | 14.5 37% | 24.6 -7% | 17.8 22% |
| Idle Maximum * | 26.7 | 13 51% | 23 14% | 33.5 -25% | 24.8 7% | 19.6 27% |
| Load Average * | 77.5 | 84.1 -9% | 123 -59% | 97.5 -26% | 109.6 -41% | 128 -65% |
| Cyberpunk 2077 ultra external monitor * | 178.9 | 124.5 30% | ||||
| Cyberpunk 2077 ultra * | 178.6 | 127.2 29% | ||||
| Load Maximum * | 202.6 | 177.6 12% | 241 -19% | 315.2 -56% | 284.9 -41% | 328 -62% |
| Witcher 3 ultra * | 143.7 | 230 | 218 | 243 |
* ... im mniej tym lepiej
Power Consumption Cyberpunk / Stress Test
Power Consumption external Monitor
Żywotność baterii
Pojemność baterii 80 Wh jest przeciętna dla 16-calowego ekranu. Czasy pracy są jednak poniżej średniej dla laptopa do gier. Udało nam się zarejestrować tylko nieco ponad 3,5 godziny przeglądania sieci WLAN w świecie rzeczywistym, nawet przy ustawieniu profilu zasilania Zrównoważonego z aktywnym MSHybrid, w porównaniu do ponad dwukrotnie dłuższego czasu w przypadku Asus ROG Zephyrus G16 lub HP Victus 16.
Ładowanie od stanu pustego do pełnej pojemności jest stosunkowo szybkie i trwa od 1 do 1,5 godziny. System można również ładować za pomocą zasilaczy sieciowych USB-C innych firm, aczkolwiek w wolniejszym tempie. Proszę pamiętać, że tylko jeden z dwóch portów USB-C obsługuje ładowanie.
| Maingear ML-16 MK2 Ultra 7 155H, NVIDIA GeForce RTX 4070 Laptop GPU, 80 Wh | Asus ROG Zephyrus G16 GA605WV Ryzen AI 9 HX 370, NVIDIA GeForce RTX 4060 Laptop GPU, 90 Wh | HP Victus 16 (2024) i7-14700HX, NVIDIA GeForce RTX 4060 Laptop GPU, 83 Wh | Alienware x16 R2 P120F Ultra 9 185H, NVIDIA GeForce RTX 4080 Laptop GPU, 90 Wh | Lenovo Legion Pro 5 16IRX9 i9-14900HX, NVIDIA GeForce RTX 4070 Laptop GPU, 80 Wh | Razer Blade 16 2024, RTX 4090 i9-14900HX, NVIDIA GeForce RTX 4090 Laptop GPU, 95.2 Wh | |
|---|---|---|---|---|---|---|
| Czasy pracy | 62% | 134% | -11% | -13% | 16% | |
| Reader / Idle | 651 | 403 -38% | ||||
| WiFi v1.3 | 218 | 478 119% | 511 134% | 193 -11% | 290 33% | 329 51% |
| Load | 98 | 103 5% | 65 -34% | 79 -19% | ||
| H.264 | 824 | 456 |
Za
Przeciw
Werdykt - zaskakująco lekki, ale trochę za gorący

Maingear ML-16 MK2 ma kilka zalet w porównaniu do znanych konkurentów. Najważniejsze z nich to niewielka waga i stosunkowo jasny wyświetlacz, co pomaga użytkownikom, którzy nie zawsze grają w domu. Tymczasem zintegrowany numpad może okazać się przydatny w niektórych typach gier i pracy z arkuszami kalkulacyjnymi, a łatwość serwisowania jest zawsze doceniana przez entuzjastów.
Niestety, model ten cierpi na dłuższą listę wad. Po pierwsze, jego układ chłodzenia jest stosunkowo niewielki i nie tak wydajny jak w konkurencyjnych 16-calowych laptopach do gier. Temperatury rdzenia, temperatury powierzchni i hałas wentylatora są zatem cieplejsze i głośniejsze niż alternatywy, takie jak cięższy Razer Blade 16 lub Lenovo Legion Pro. Sztywność obudowy jest również słabsza niż w przypadku wspomnianych konkurentów, co przekłada się na gorsze pierwsze wrażenia. Wady te można częściowo przypisać mniejszej wadze, ponieważ w rezultacie dokonano cięć w obudowie i rozwiązaniu chłodzącym. Innymi słowy, będą Państwo musieli dokonać pewnych kluczowych poświęceń, aby uzyskać lżejszą i bardziej przenośną wagę.
Maingear ML-16 MK2 jest lżejszy i jaśniejszy niż się spodziewaliśmy. Brakuje mu jednak kilku zaawansowanych funkcji, a temperatury i hałas wentylatora mogłyby być lepsze.
Dalsze zaawansowane funkcje, takie jak Optimus 2.0, HDR, OLED, oświetlenie RGB na klawisz, chłodzenie komorą parową i interfejs ciekłego metalu są niedostępne w ML-16 MK2. Takie pominięcia mogą być akceptowalne w przedziale 1500 USD, ale spodziewaliśmy się nieco więcej, biorąc pod uwagę cenę wywoławczą 2000 USD za naszą konfigurację RTX 4070.
Cena i dostępność
Maingear wysyła teraz mL-16 Mark 2 w cenie 1800 USD z kartą graficzną GeForce RTX 4060 lub 2000 USD z RTX 4070.
Uwaga: Niedawno zaktualizowaliśmy nasz system oceny i wyniki wersji 8 nie są porównywalne z wynikami wersji 7. Więcej informacji znajdą Państwo tutaj .
Maingear ML-16 MK2
- 17/09/2024 v8
Allen Ngo
 Total Sustainability Score:
 Przezroczystość
Wyboru urządzeń do recenzji dokonuje nasza redakcja. Próbka testowa została udostępniona autorowi jako pożyczka od producenta lub sprzedawcy detalicznego na potrzeby tej recenzji. Pożyczkodawca nie miał wpływu na tę recenzję, producent nie otrzymał też kopii tej recenzji przed publikacją. Nie było obowiązku publikowania tej recenzji. Nigdy nie przyjmujemy rekompensaty ani płatności w zamian za nasze recenzje. Jako niezależna firma medialna, Notebookcheck nie podlega władzy producentów, sprzedawców detalicznych ani wydawców.
Tak testuje Notebookcheck
Każdego roku Notebookcheck niezależnie sprawdza setki laptopów i smartfonów, stosując standardowe procedury, aby zapewnić porównywalność wszystkich wyników. Od około 20 lat stale rozwijamy nasze metody badawcze, ustanawiając przy tym standardy branżowe. W naszych laboratoriach testowych doświadczeni technicy i redaktorzy korzystają z wysokiej jakości sprzętu pomiarowego. Testy te obejmują wieloetapowy proces walidacji. Nasz kompleksowy system ocen opiera się na setkach uzasadnionych pomiarów i benchmarków, co pozwala zachować obiektywizm.Price comparison

