

Recenzja Dell XPS 13 9345 Snapdragon X Elite: Podcięcie Intel Core Ultra 7

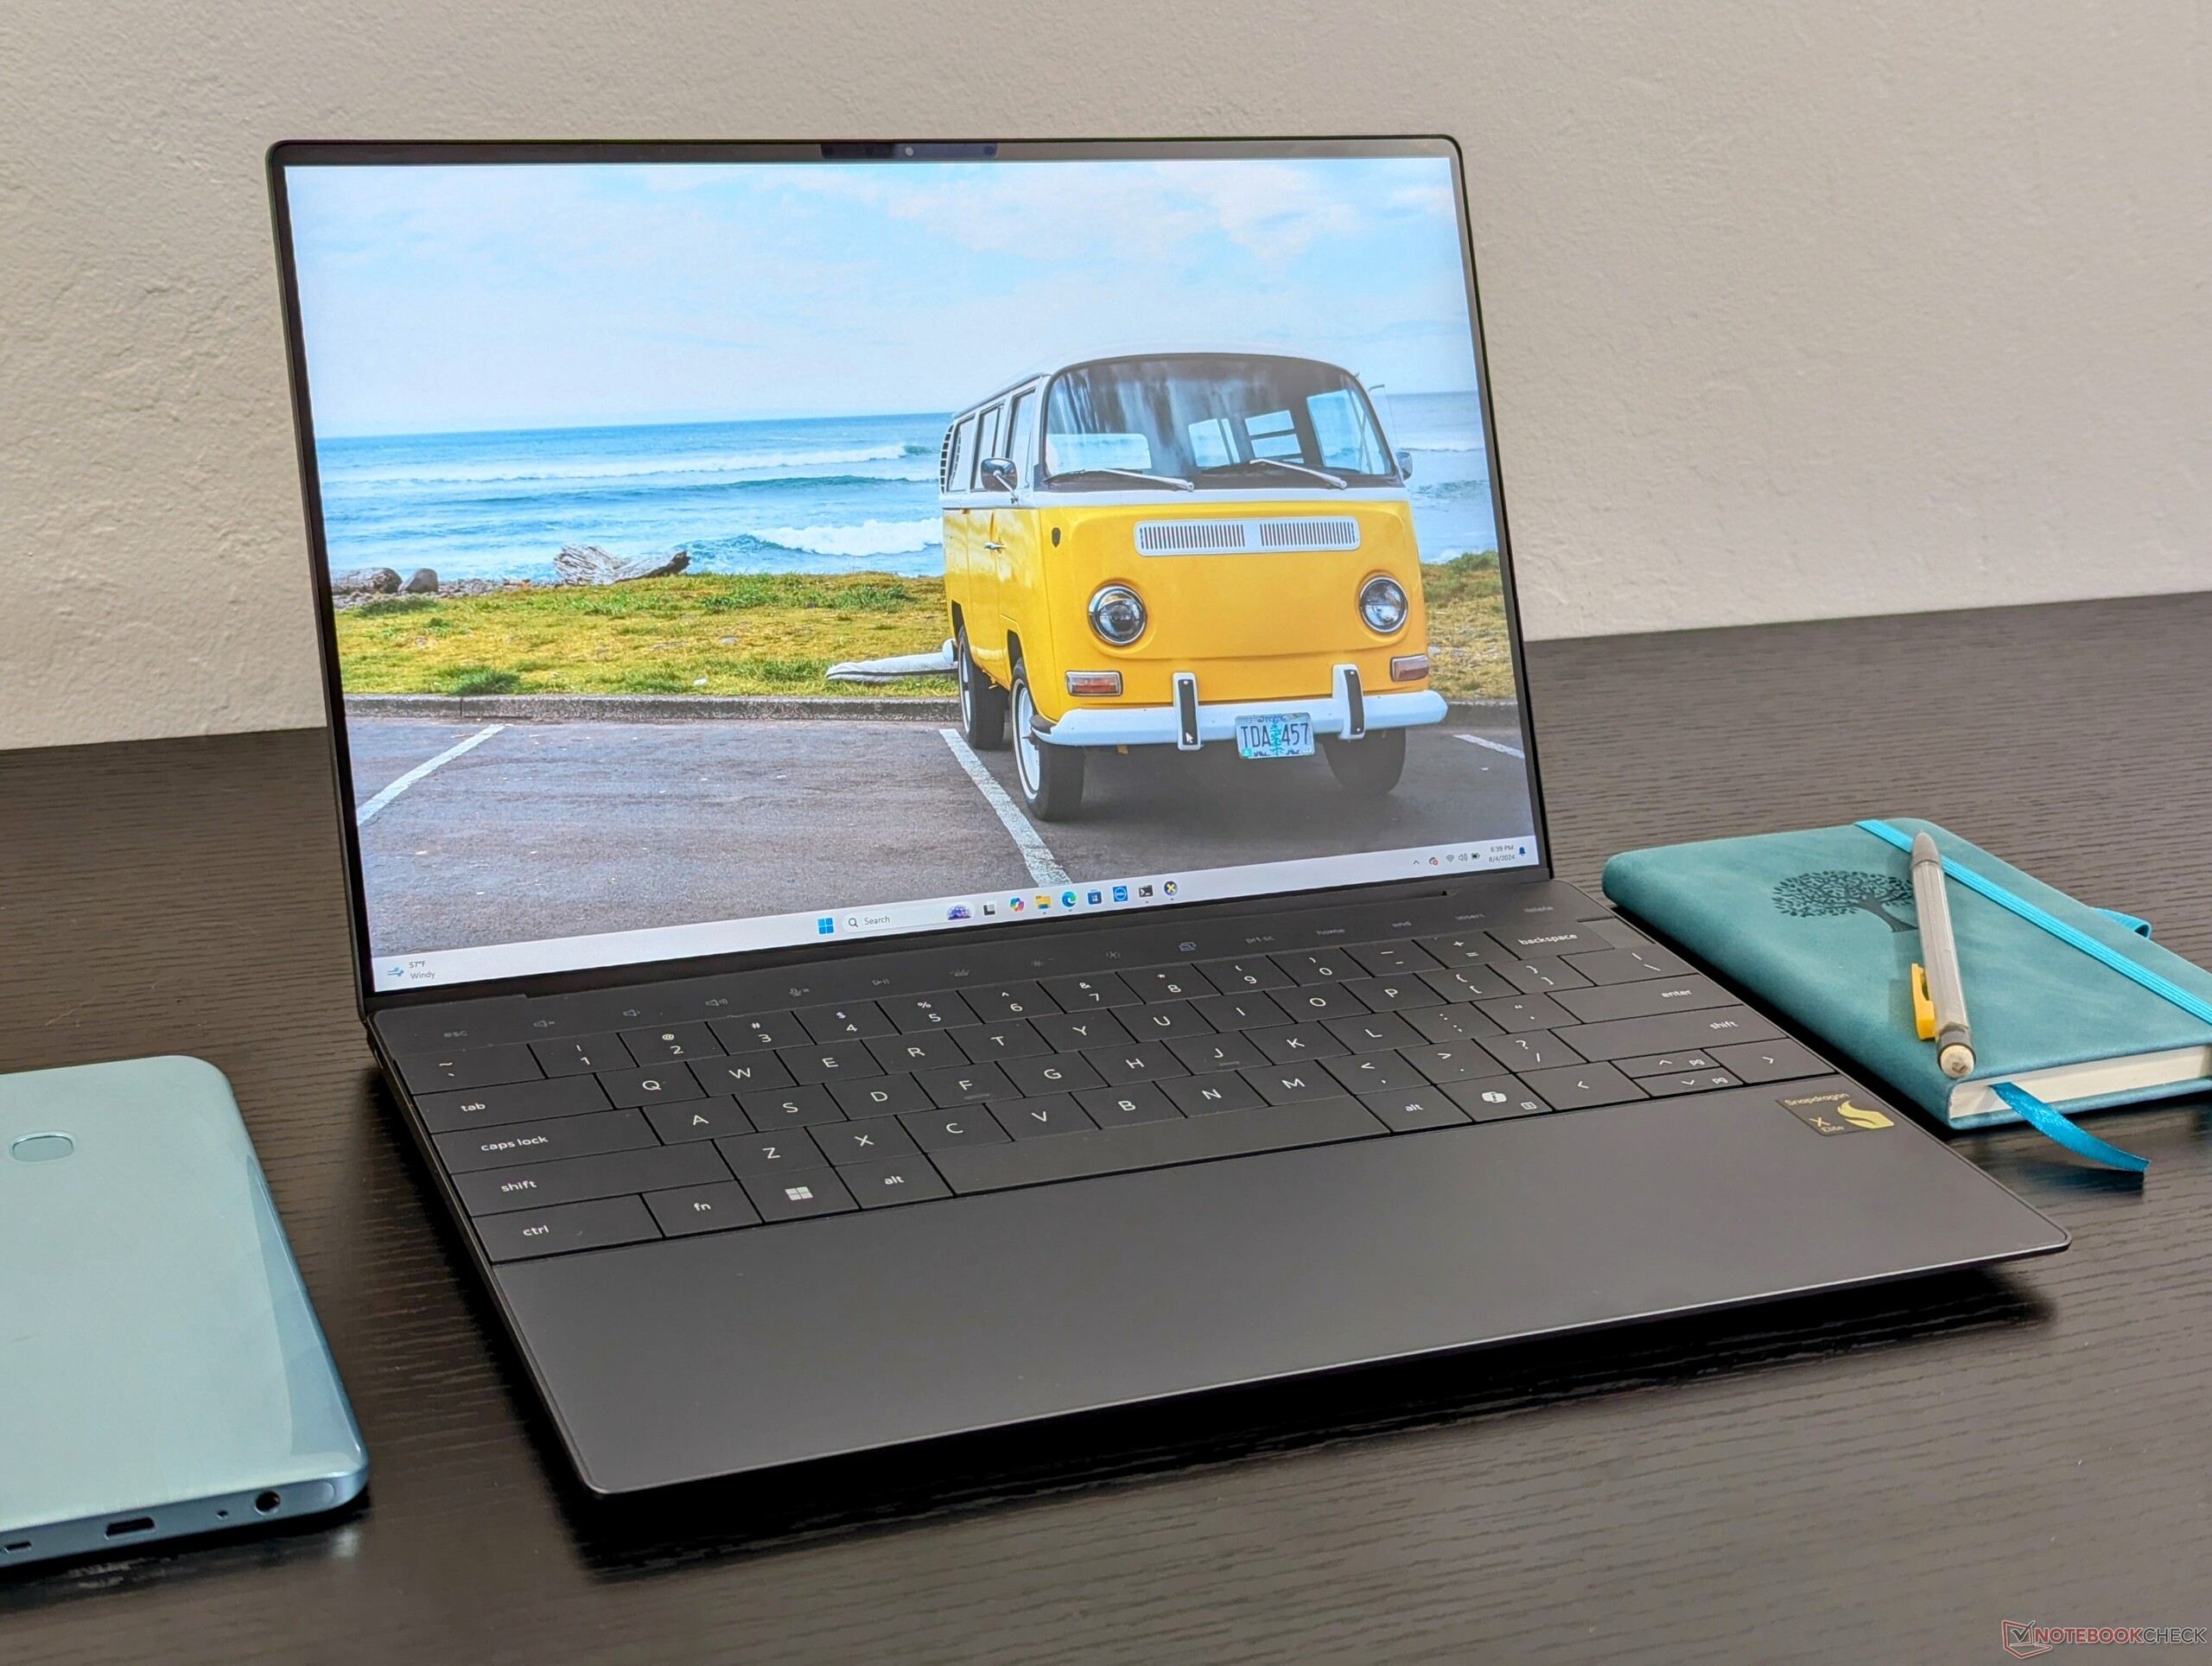
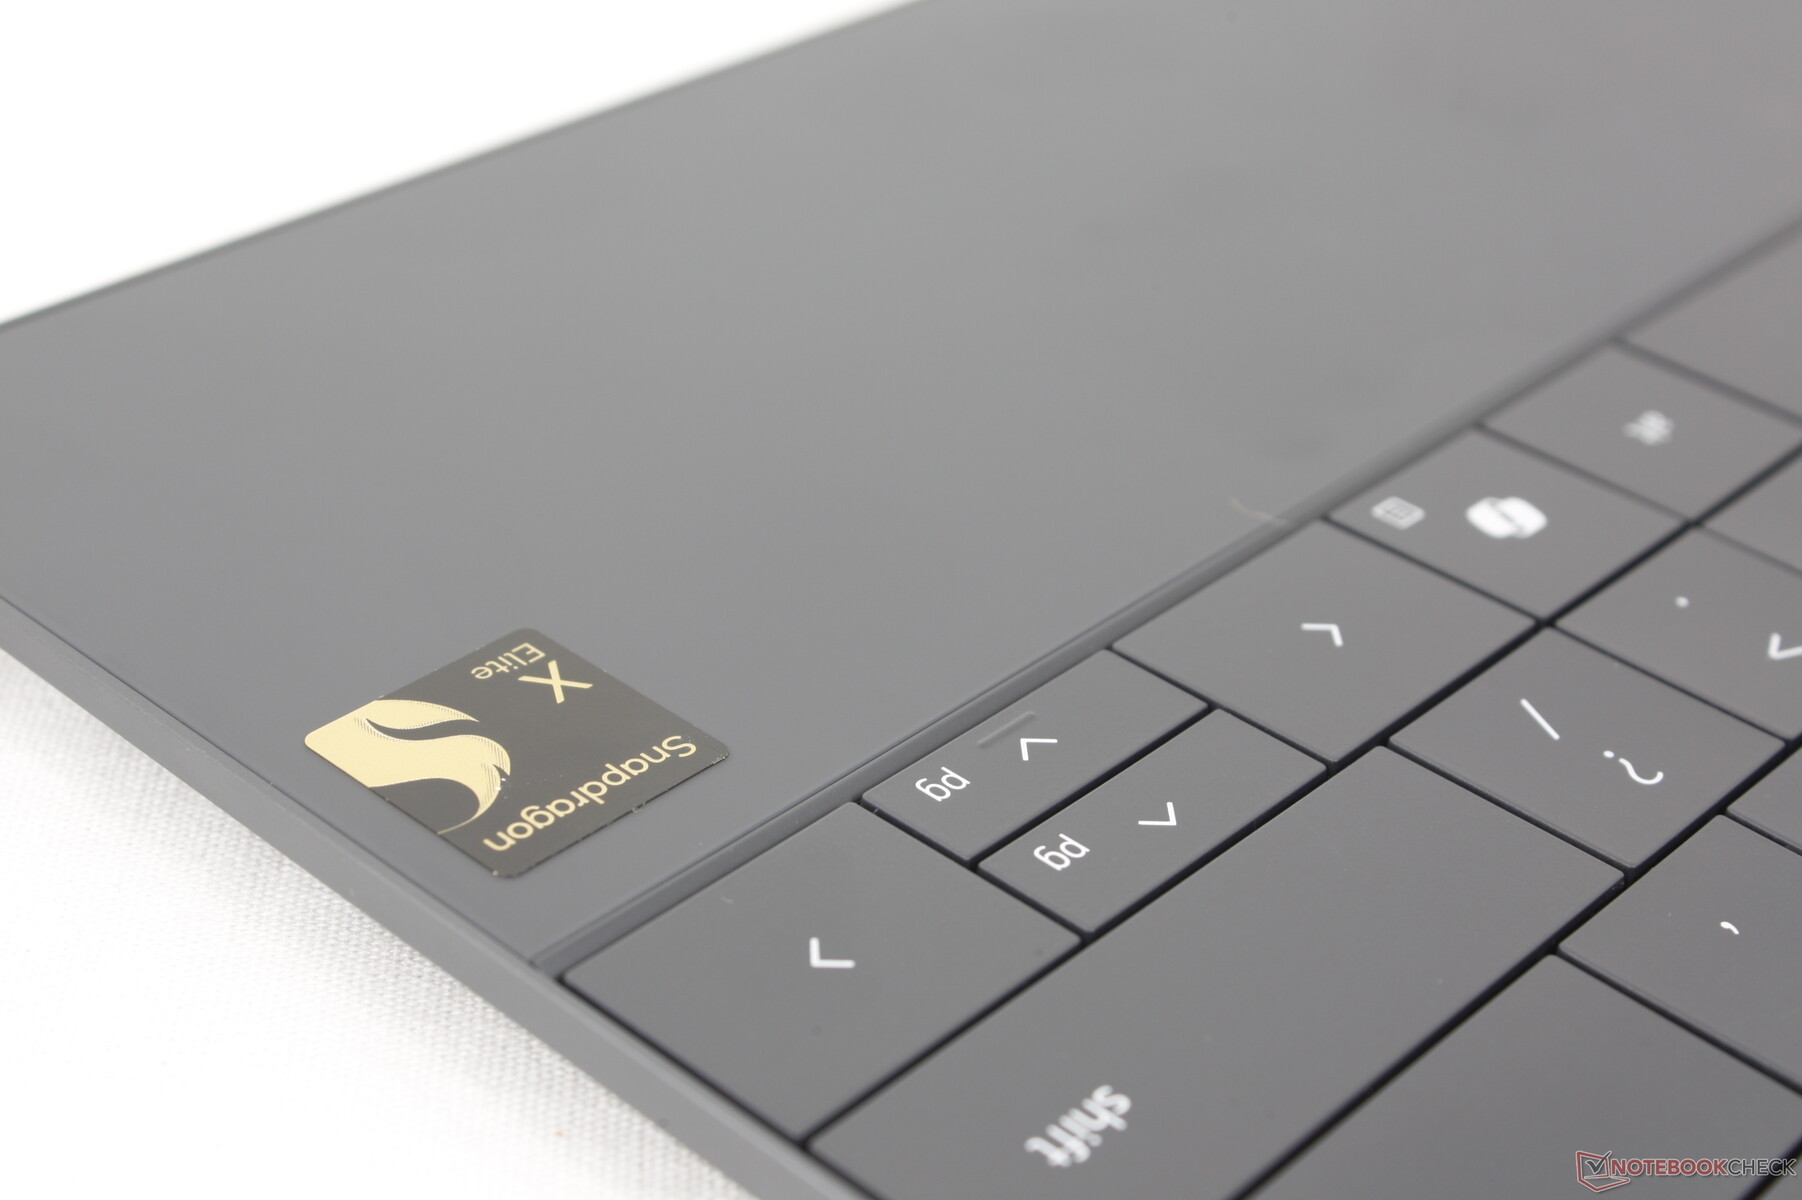
Czy jest lepszy sposób na pochwalenie się procesorem niż zadebiutowanie go w jednym z najpopularniejszych laptopów konsumenckich firmy Dell? Obudowa XPS 13 Plus 9320/9340 została zmieniona z najnowszym procesorem Snapdragon X Elite, aby znaleźć się wśród niewielkiej garstki laptopów z systemem Windows opartych na Qualcomm, które zostaną wydane w tym roku. Nazwany XPS 13 9345, model Snapdragon jest poza tym wizualnie identyczny z istniejącym XPS 13 Plus 9320 lub 9340 z tradycyjnymi procesorami Intel.
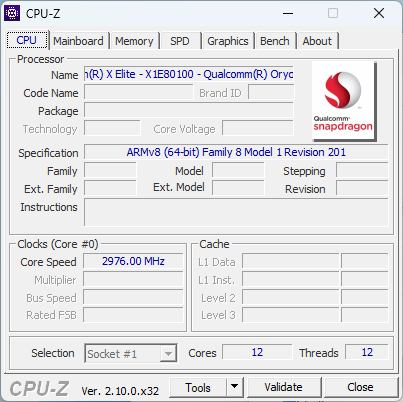
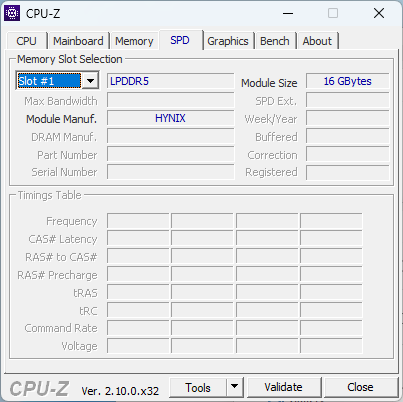
Nasza recenzowana konfiguracja została wyposażona w procesor Snapdragon X1 Elite X1E-80-100, 16 GB pamięci RAM LPDDR5X-8448 i wyświetlacz IPS 1200p 120 Hz za około 1300 USD. Wyższej klasy panele OLED są dostępne, a niektóre regiony mogą zawierać drugą opcję procesora Snapdragon X1 Plus X1P, ale zintegrowany procesor graficzny pozostaje taki sam na całym pokładzie.
Alternatywy dla XPS 13 9345 obejmują Microsoft Surface Pro lub Samsung Galaxy Book4 Edge 16 oba napędzane tym samym procesorem Snapdragon X1 Elite X1E-80-100. Oczywiście bezpośrednio konkuruje on również z bardziej konwencjonalnymi 13- i 14-calowymi subnotebookami biurowymi, takimi jak Lenovo ThinkBook 13x G4, Asus ZenBook S13czy Dell XPS 13 9340.
Więcej recenzji Dell:
Potencjalni konkurenci w porównaniu
Ocena | Wersja | Data | Model | Waga | Wysokość | Rozmiar | Rezolucja | Cena |
|---|---|---|---|---|---|---|---|---|
| 84.5 % | v8 | 08/2024 | Dell XPS 13 9345 SD X Elite X1E-80-100, Adreno X1-85 3.8 TFLOPS | 1.2 kg | 15.3 mm | 13.40" | 1920x1200 | |
| 86.5 % v7 (old) | v7 (old) | 05/2024 | Dell XPS 13 9340 Core Ultra 7 Ultra 7 155H, Arc 8-Core | 1.2 kg | 15.3 mm | 13.40" | 1920x1200 | |
| 86.2 % | v8 | 07/2024 | Microsoft Surface Laptop 7 13.8 Copilot+ SD X Elite X1E-80-100, Adreno X1-85 3.8 TFLOPS | 1.3 kg | 17.5 mm | 13.80" | 2304x1536 | |
| 90.1 % v7 (old) | v7 (old) | 05/2024 | Lenovo ThinkBook 13x G4 21KR0008GE Ultra 5 125H, Arc 7-Core | 1.2 kg | 12.9 mm | 13.50" | 2880x1920 | |
| 82.3 % | v8 | 07/2024 | HP EliteBook Ultra G1q 14 SD X Elite X1E-78-100, Adreno X1-85 3.8 TFLOPS | 1.3 kg | 11.2 mm | 14.00" | 2240x1400 | |
| 85.4 % v7 (old) | v7 (old) | 05/2023 | Asus ZenBook S13 OLED UX5304 i7-1355U, Iris Xe G7 96EUs | 1 kg | 11.8 mm | 13.30" | 2880x1800 |
Wskazówka: Nasz system ocen został niedawno zaktualizowany, a wyniki wersji 8 nie są porównywalne z wynikami wersji 7. Dodatkowe informacje znajdą Państwo hier verfügbar.
Uwaga: Niedawno zaktualizowaliśmy nasz system oceniania i wyniki wersji 8 nie są porównywalne z wynikami wersji 7. Więcej informacji znajdą Państwo tutaj .
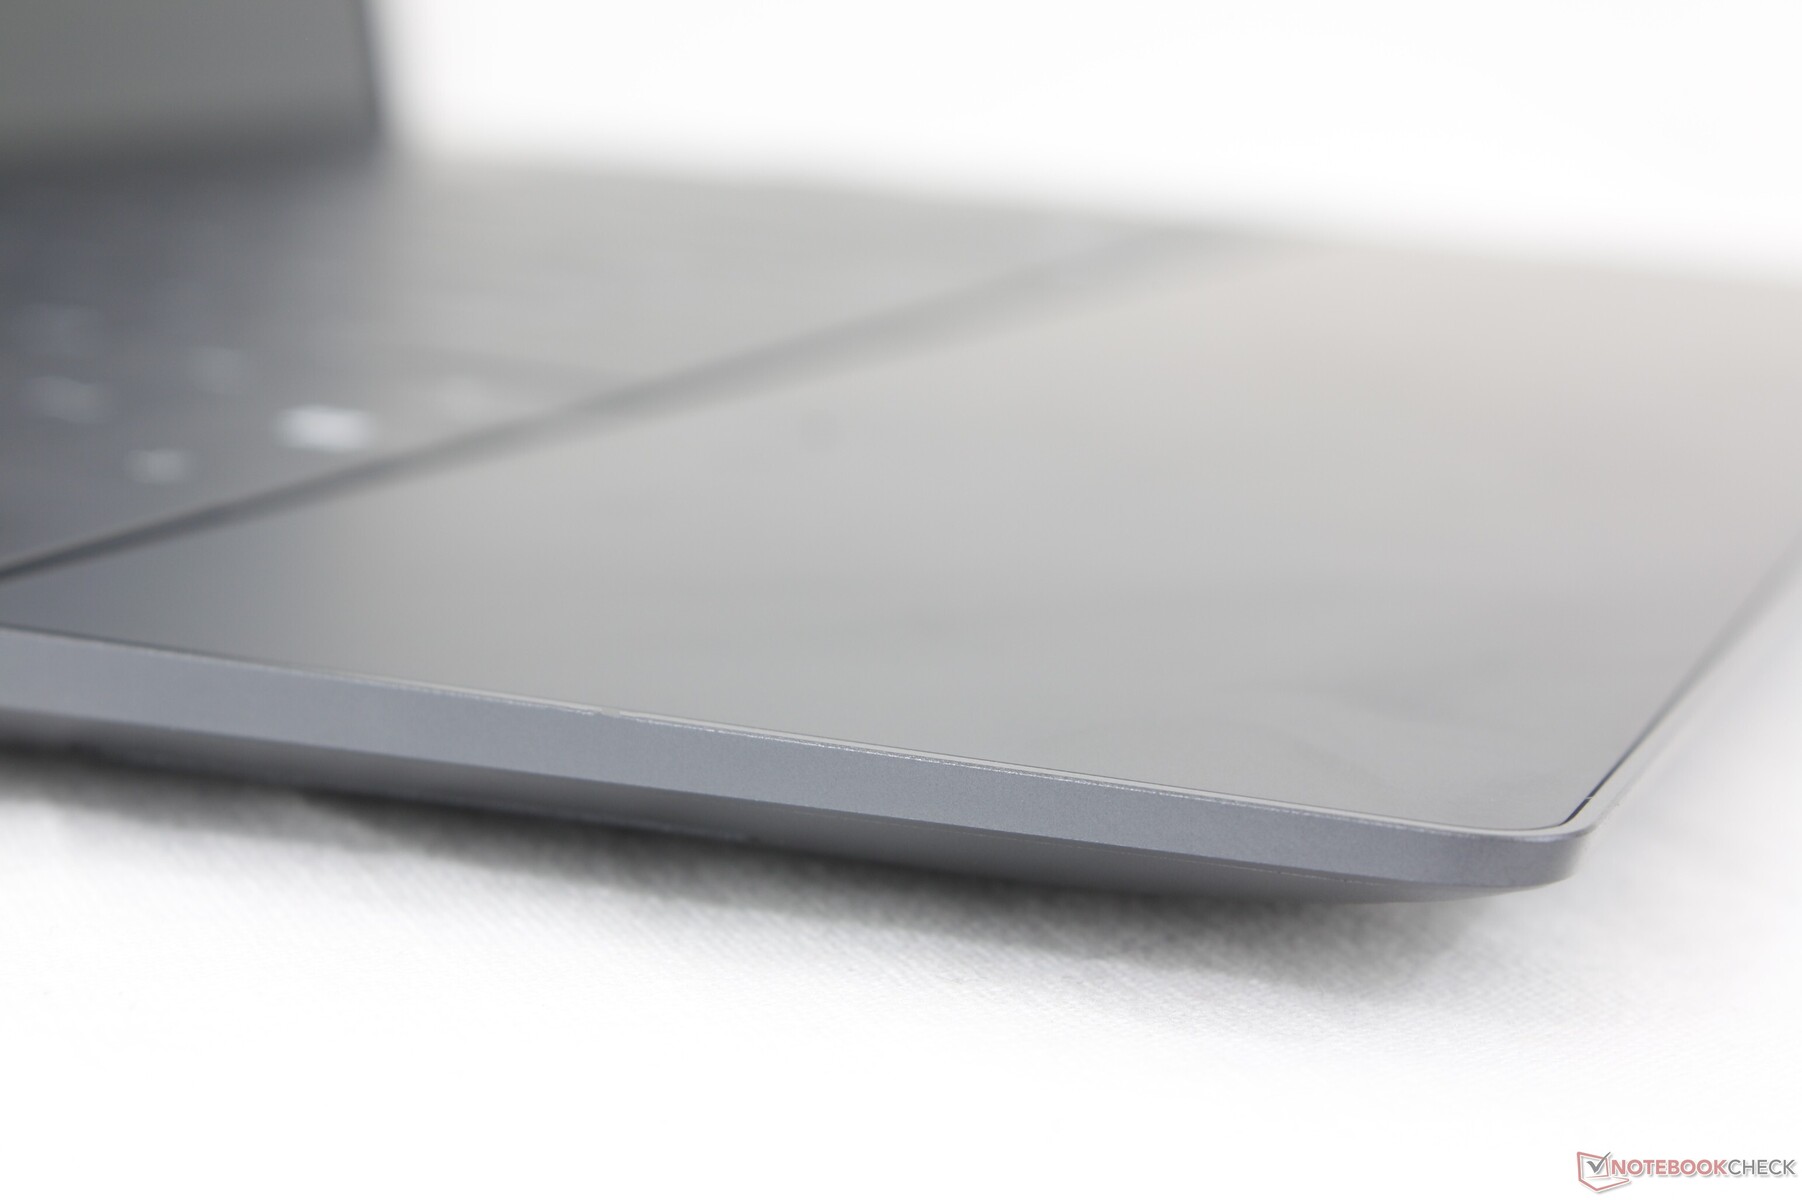
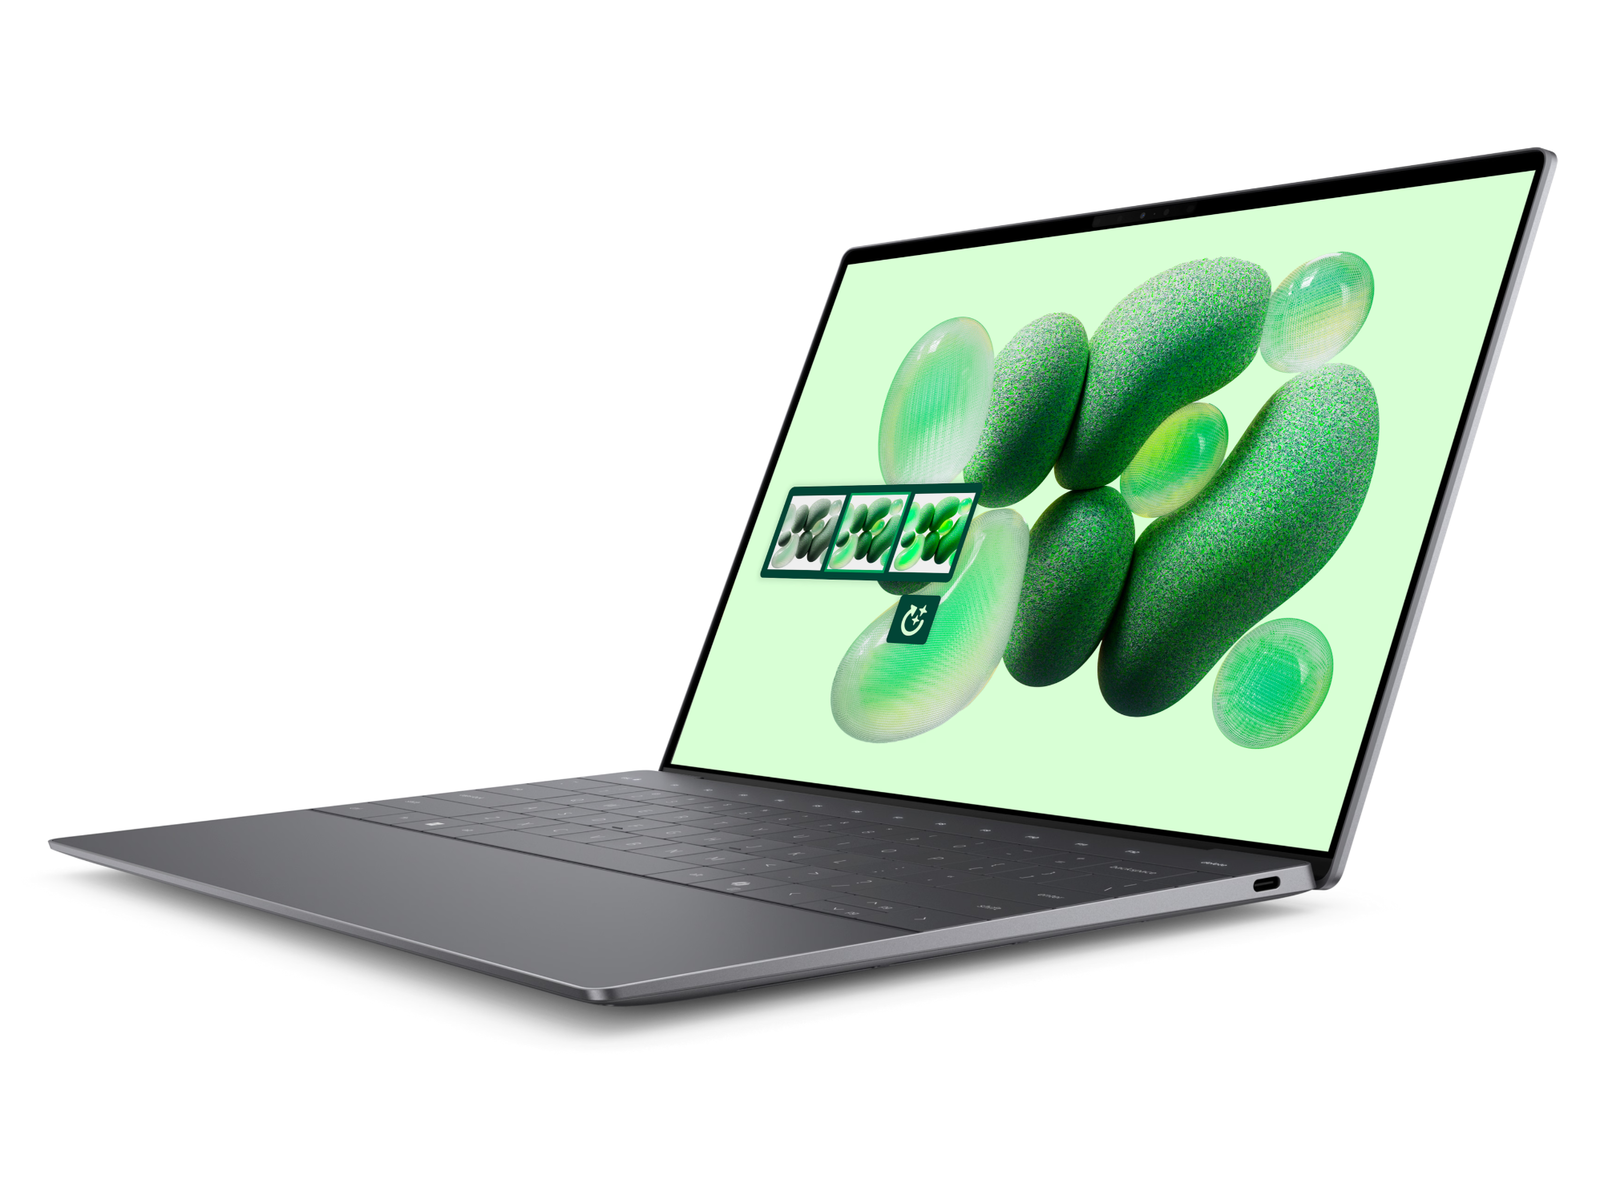
Obudowa - znajomy wygląd i działanie
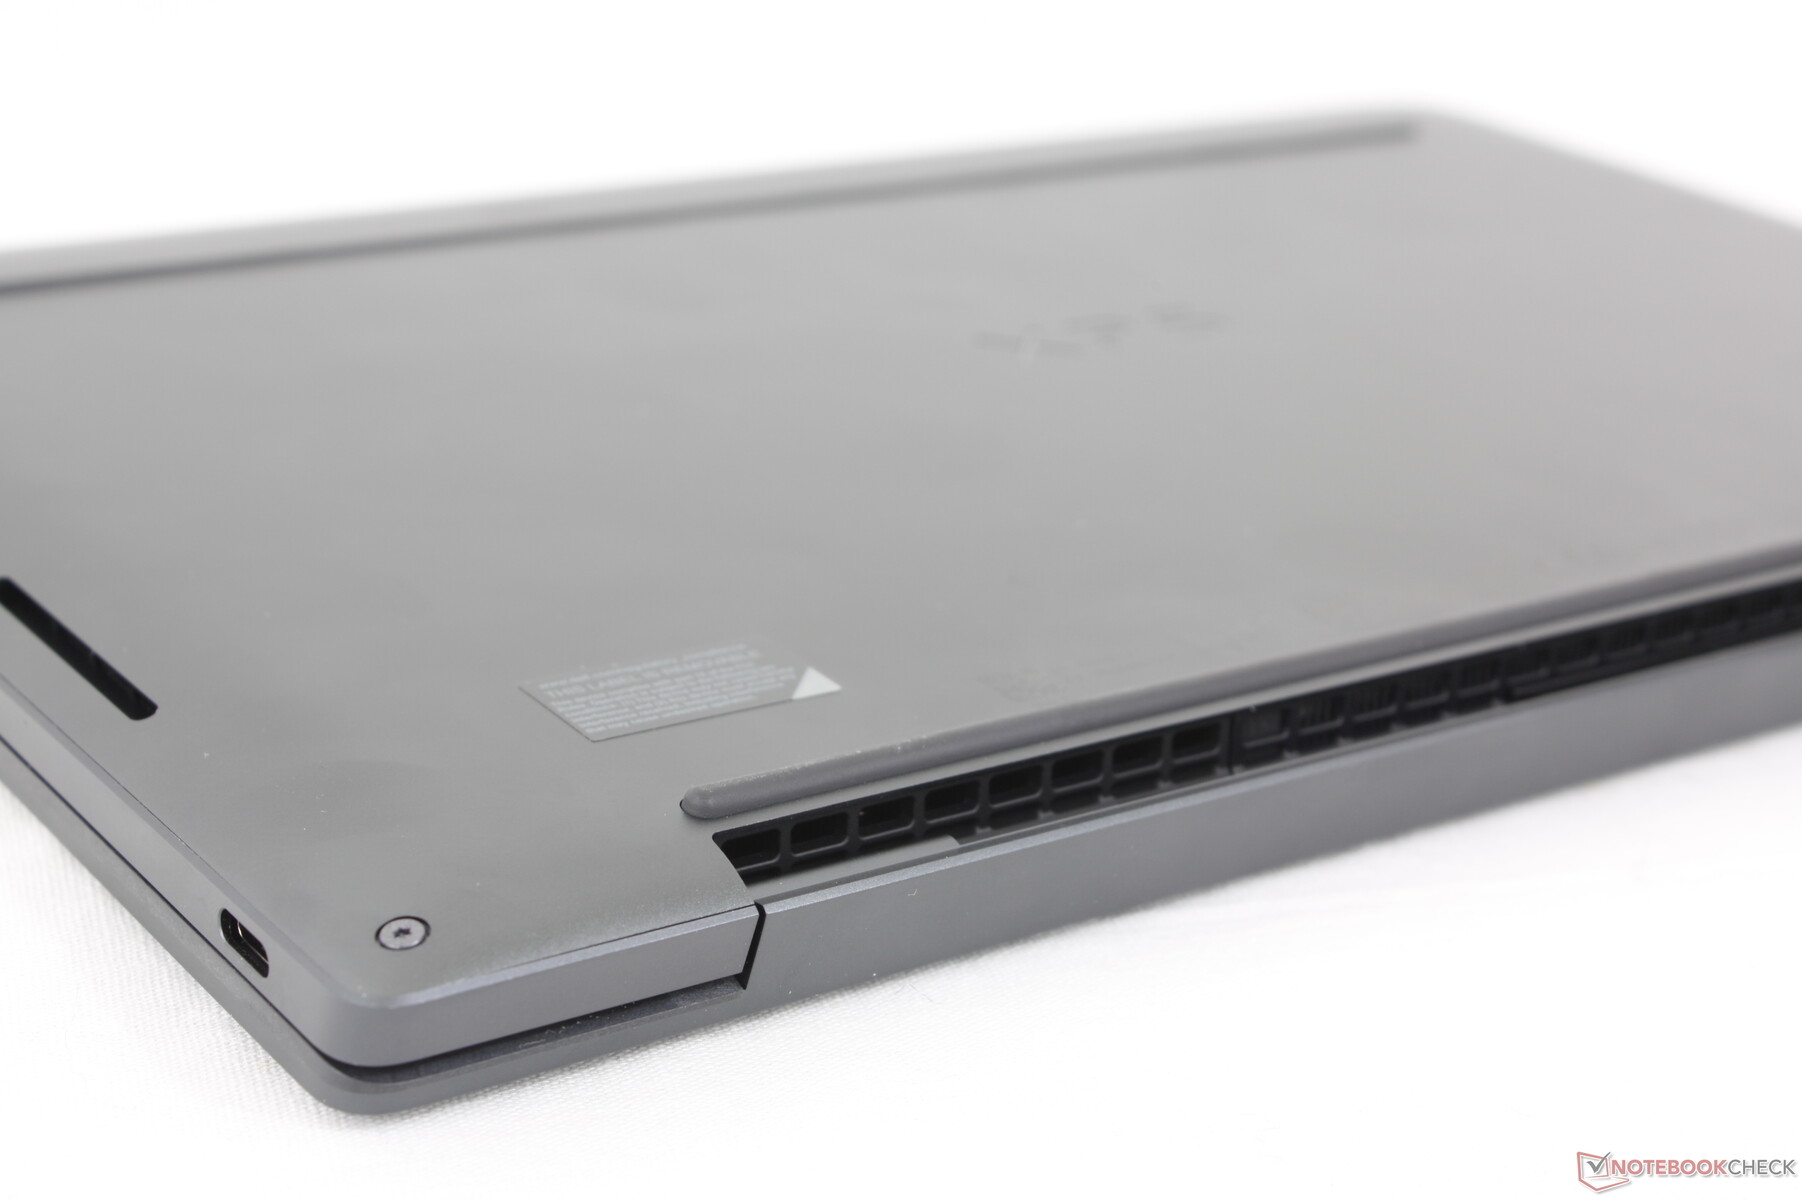
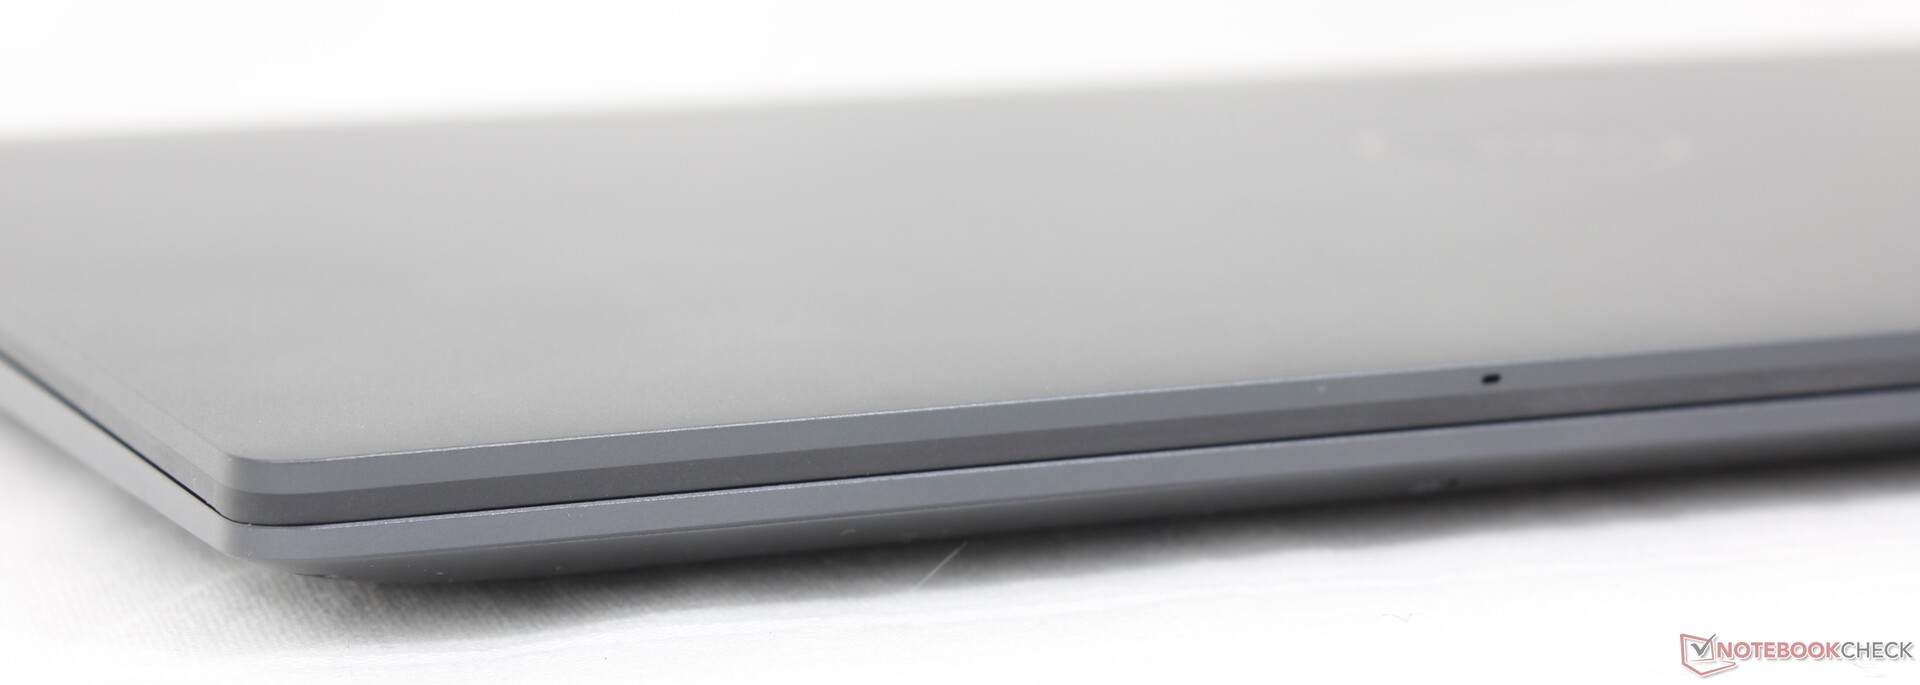
Nie ma żadnych zewnętrznych różnic oddzielających model Qualcomm od modelu Intela, a zatem nasze uwagi dotyczące modelu Intel dotyczą również tego modelu. Niektóre nowe opcje kolorystyczne byłyby miłe, ale obowiązują te same opcje Platinum i Graphite. Nieznacznie faworyzujemy opcję Platinum, ponieważ jej jasny biały kolor lepiej zasłania odciski palców niż ciemniejsza opcja Graphite naszej jednostki testowej Qualcomm, szczególnie wzdłuż podpórek pod dłonie i zewnętrznej pokrywy.
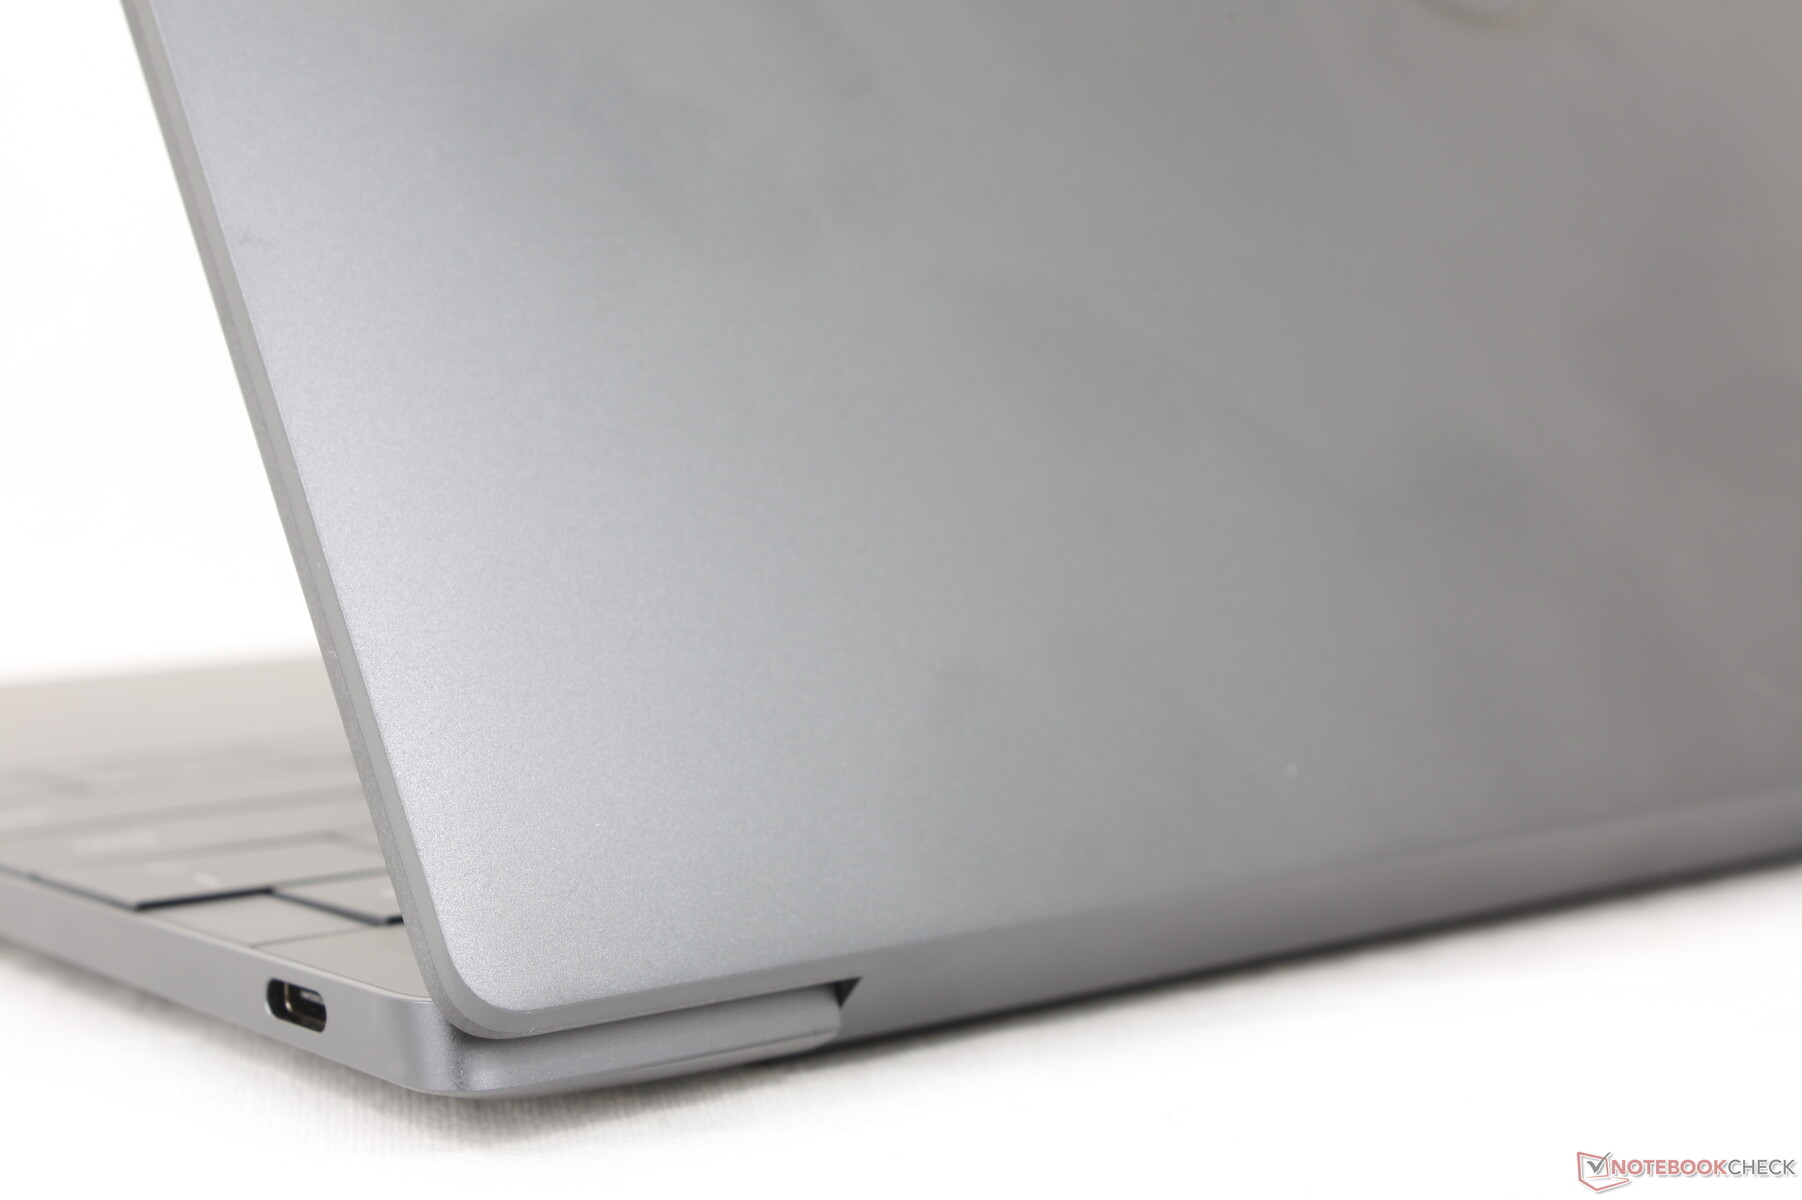
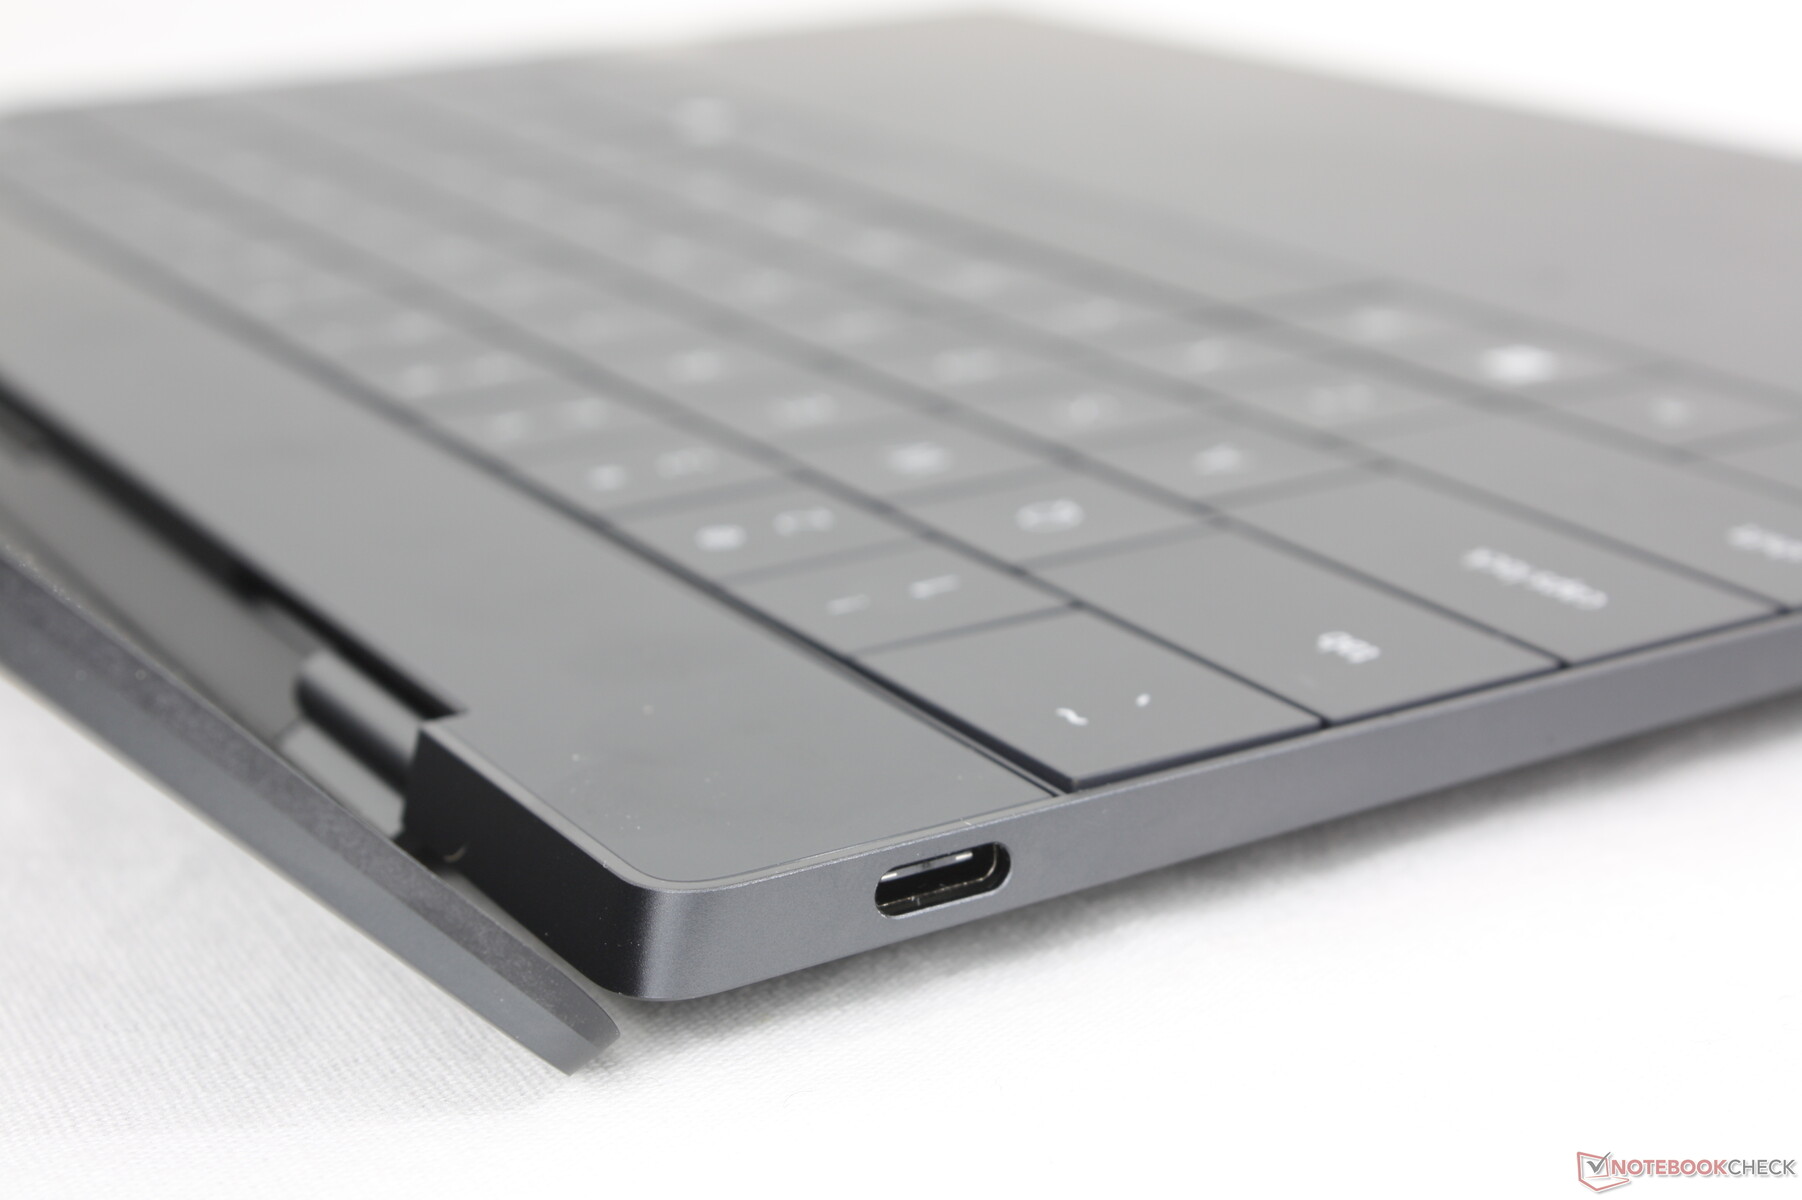
Łączność
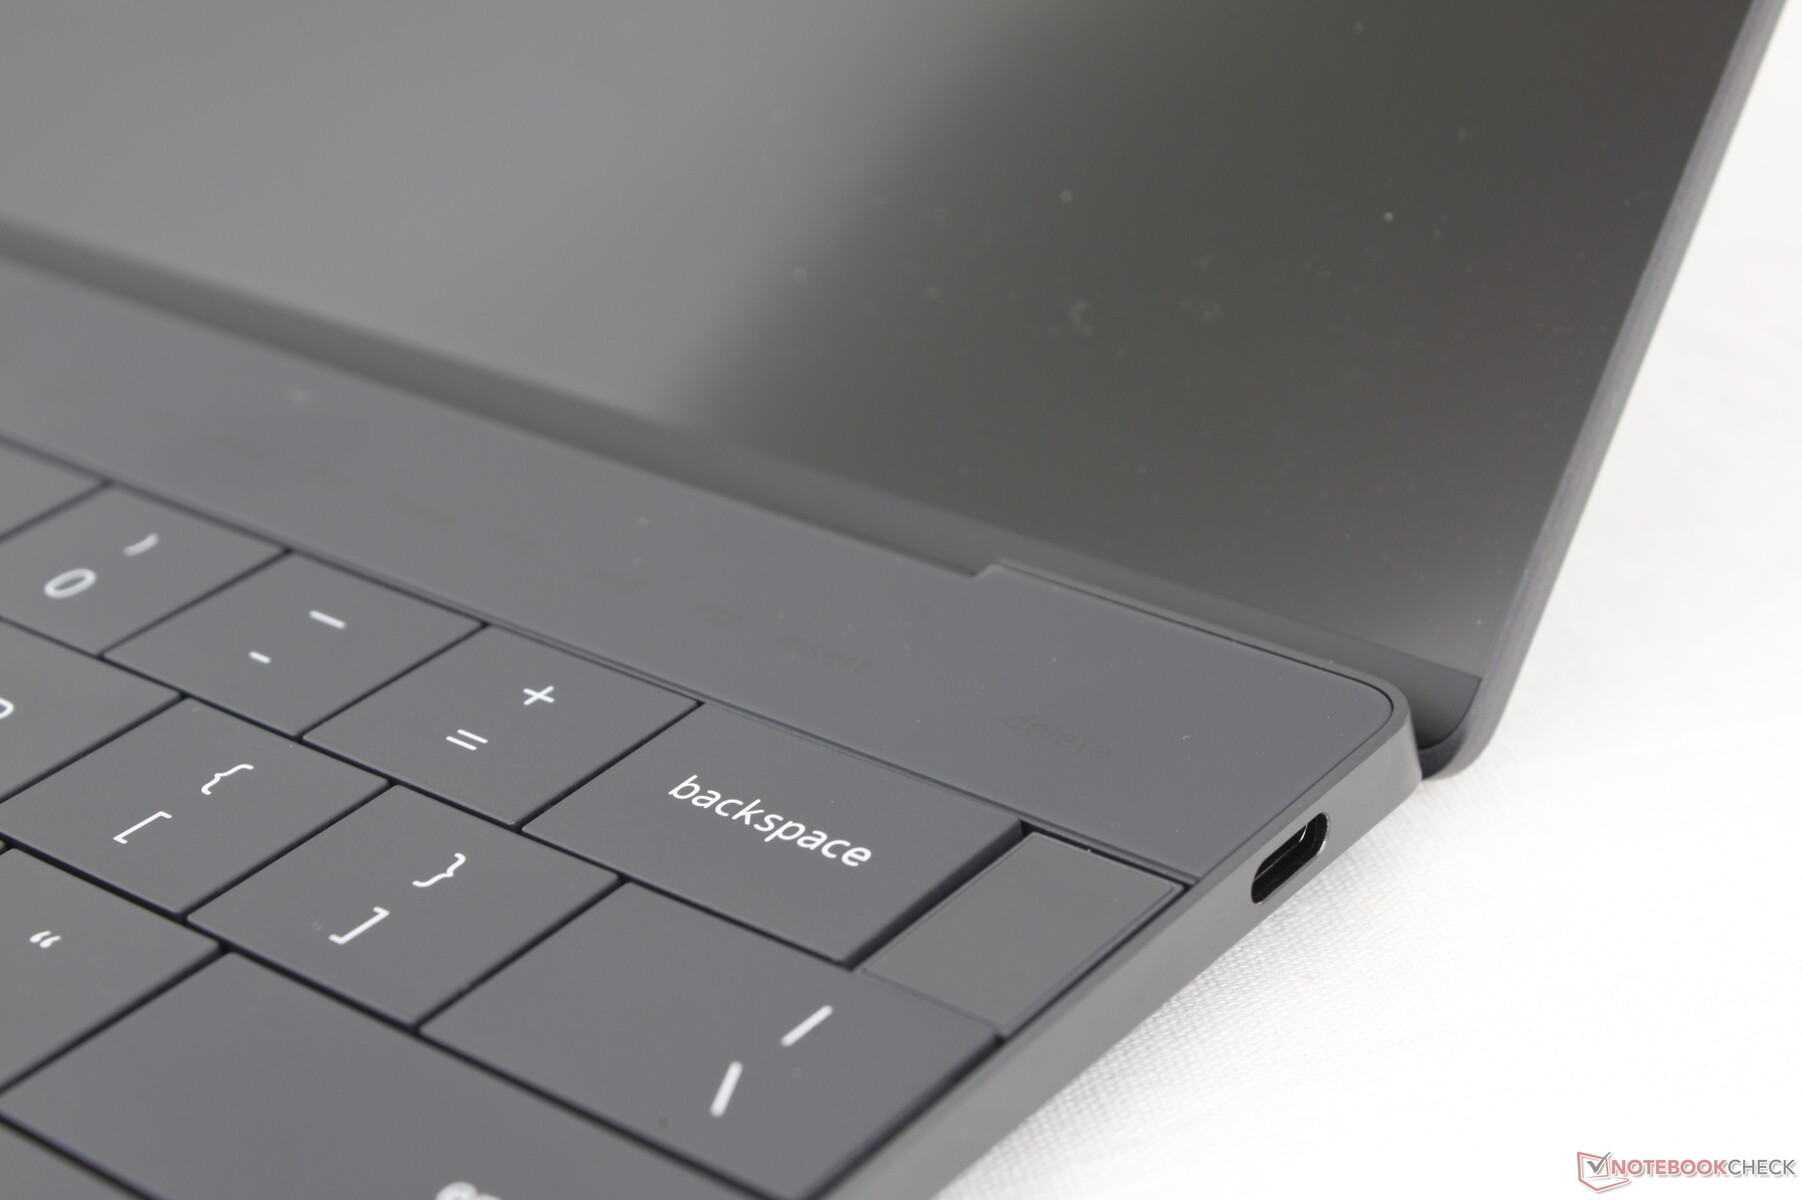
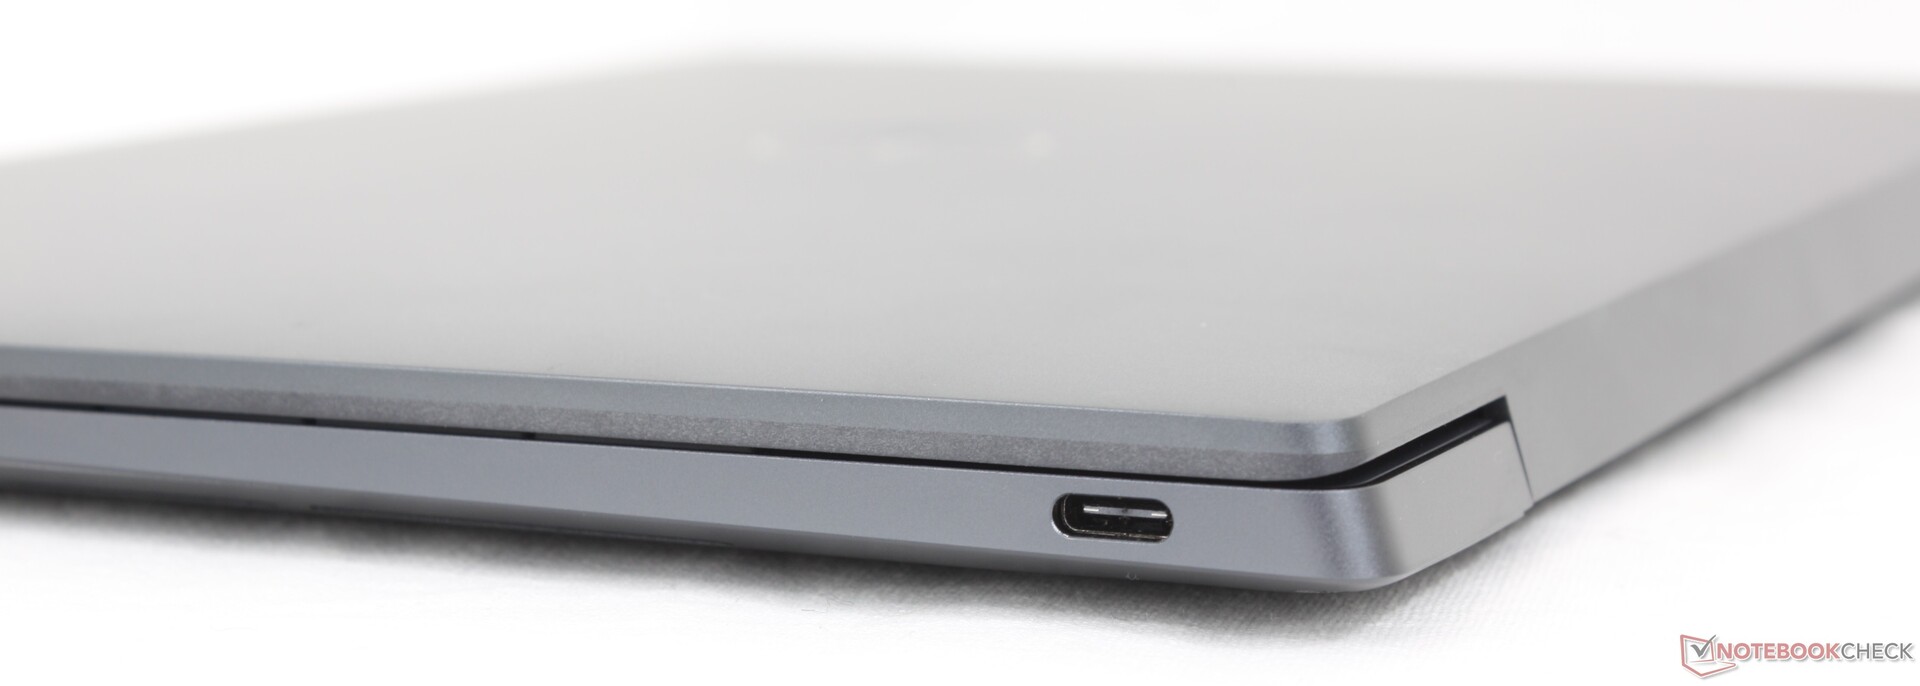
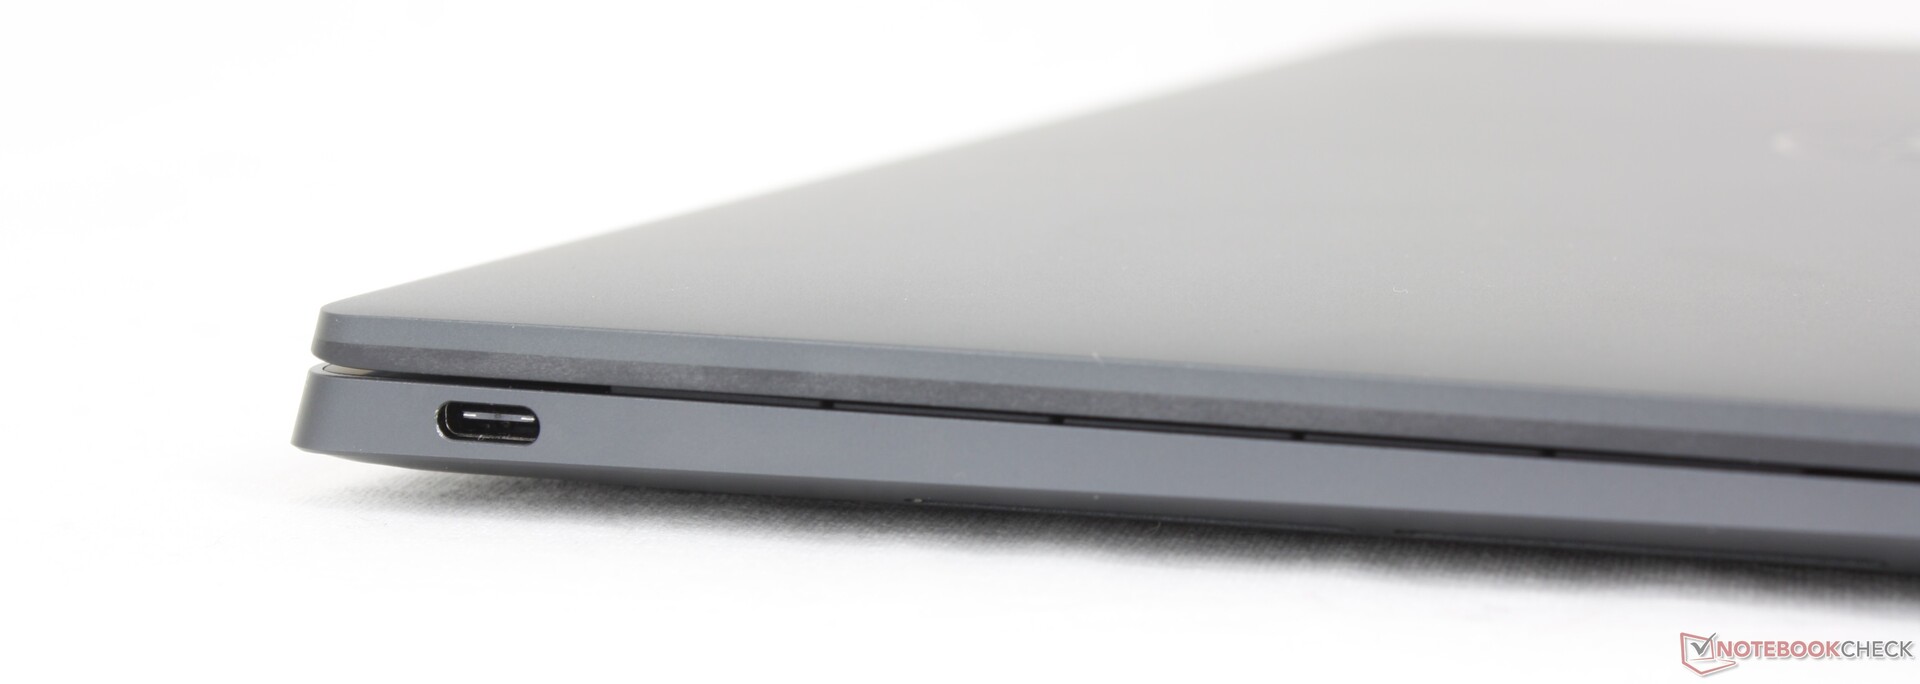
Dostępne są dwa porty USB-C 4.0, podobnie jak w wersji Intel XPS 13. Jednak porty tutaj nie obsługują Thunderbolt, więc kompatybilność eGPU nie jest gwarantowana. Podczas próby podłączenia naszego Aorus RTX 2080 Ti Gaming Boxlaptop Qualcomm nie byłby w stanie rozpoznać eGPU, podczas gdy komputer PC z obsługą Thunderbolt rozpoznałby go automatycznie za pomocą Menedżera urządzeń. Qualcomm powiedział, że wszelkie wsparcie i odpowiednie sterowniki będą zależeć od poszczególnych producentów eGPU, co nie jest obiecujące dla obecnych właścicieli eGPU.
Komunikacja
Dell wymienił BE200 z Intel XPS 13 na FastConnect 7800 w Qualcomm XPS 13. Moduł obsługuje łączność Wi-Fi 7, która wciąż jest rzadkością w większości gospodarstw domowych. Wydajność jest jednak stabilna po sparowaniu z naszym routerem testowym Wi-Fi 6E AXE11000.
Kamera internetowa
Model ten jest standardowo wyposażony w tę samą kamerę internetową 2 MP, którą można znaleźć w XPS 13 9340 zamiast kamery internetowej 1 MP w oryginalnym XPS 13 9320. Wbudowano również podczerwień do obsługi rozpoznawania twarzy Windows Hello. Nadal jednak nie ma osłony kamery ani wyłącznika awaryjnego.


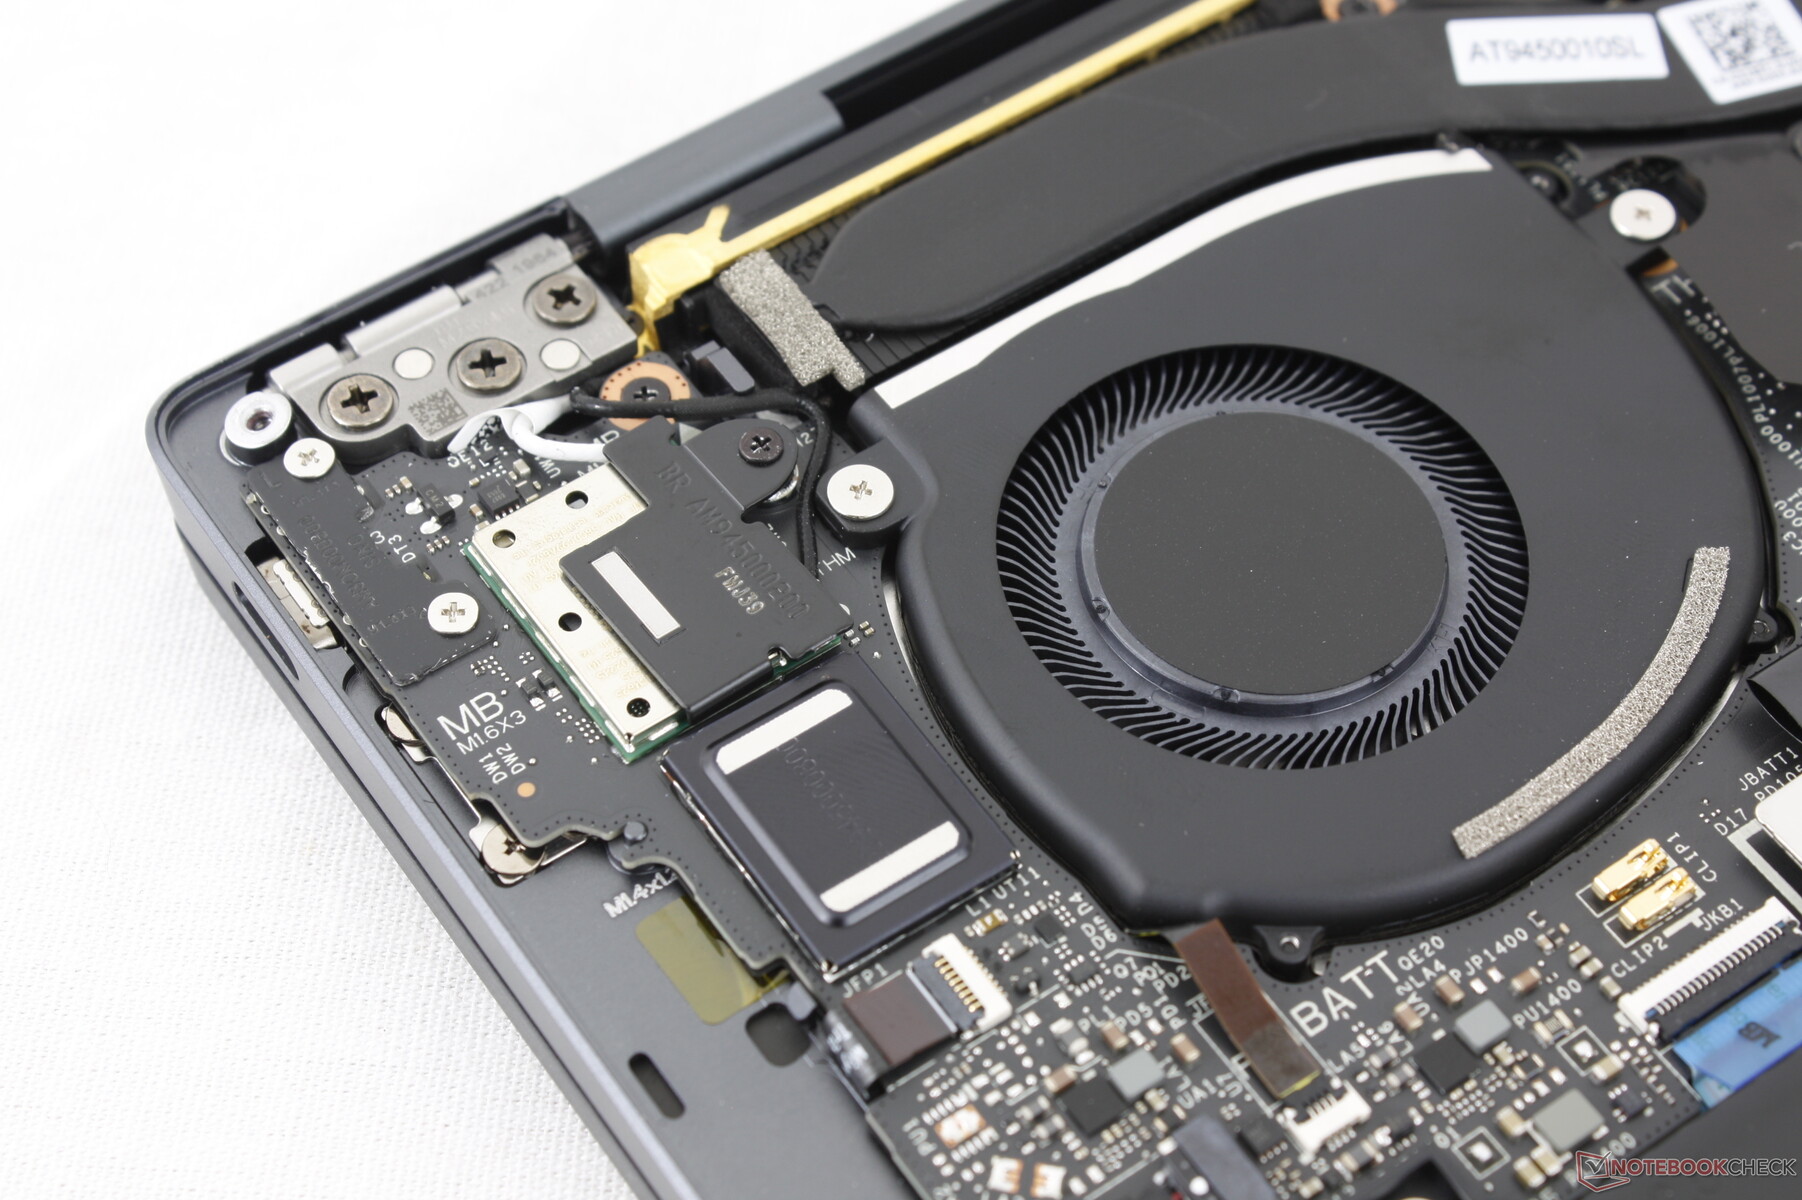
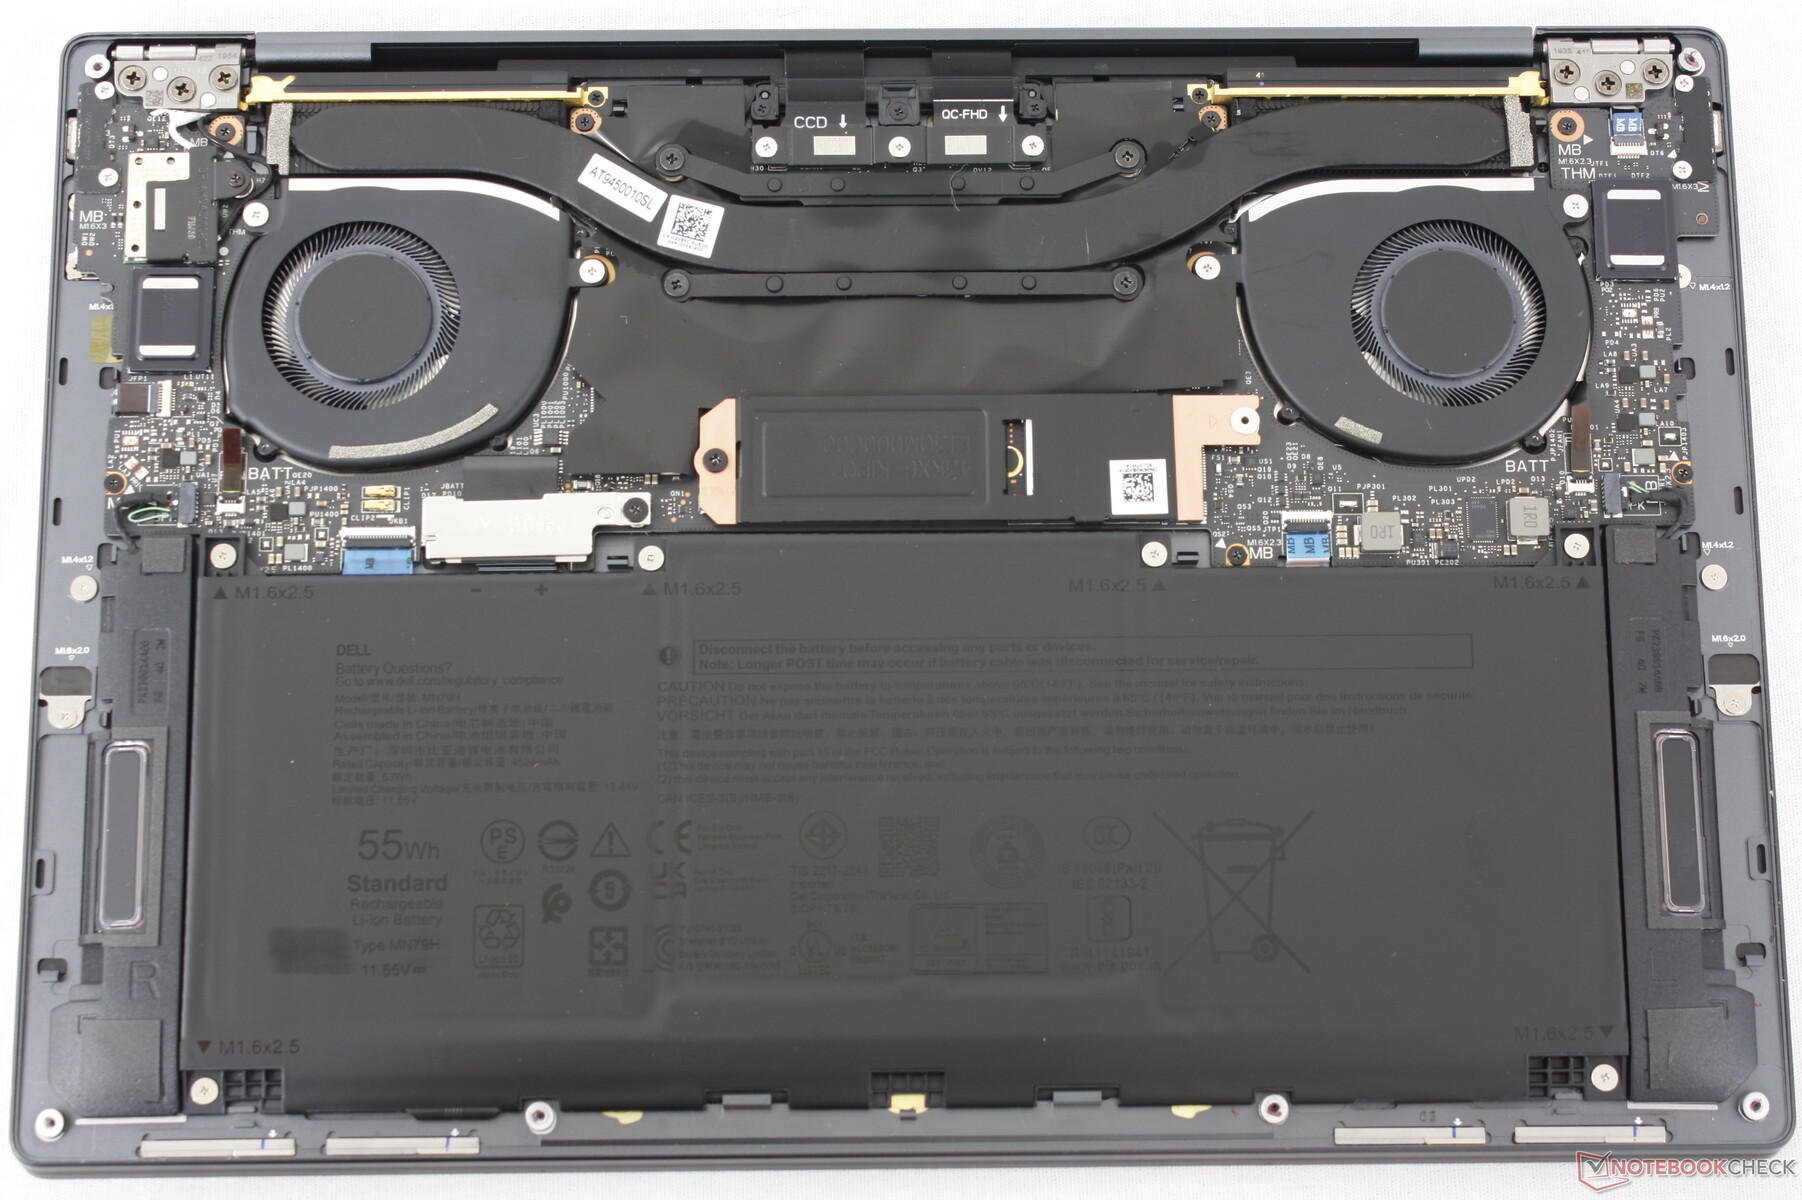
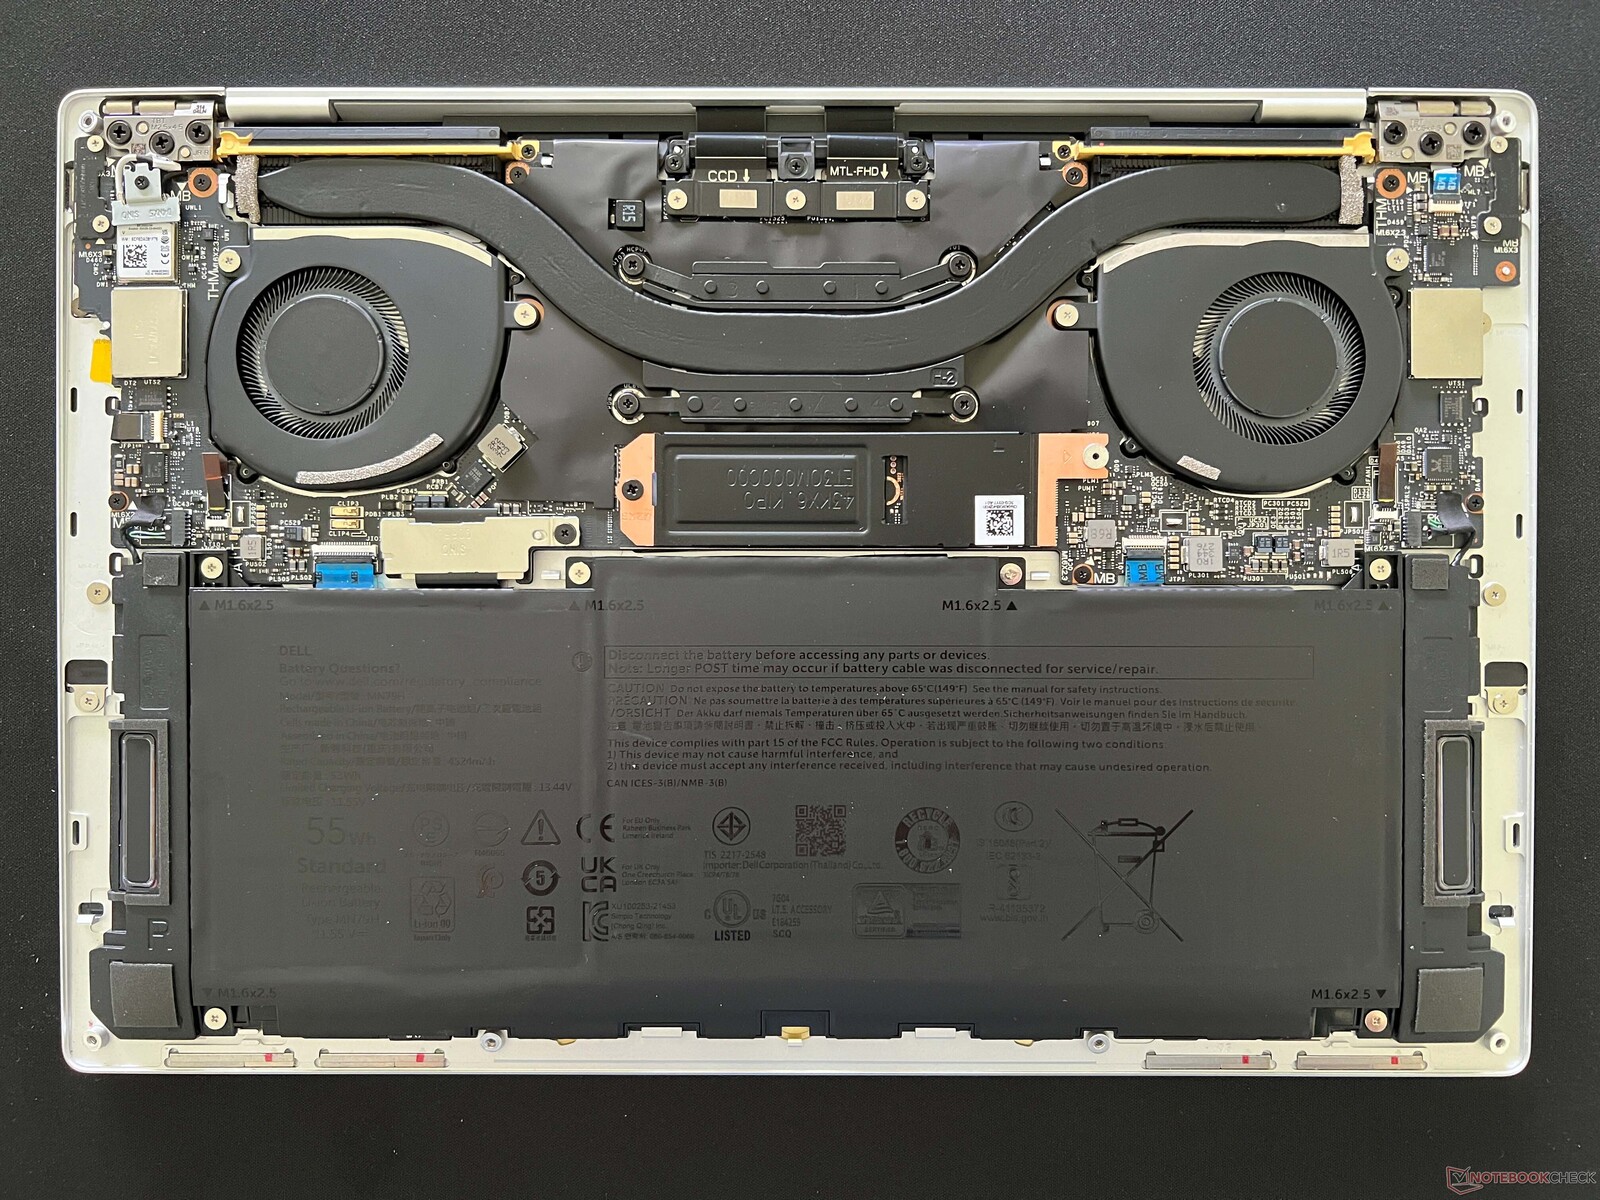
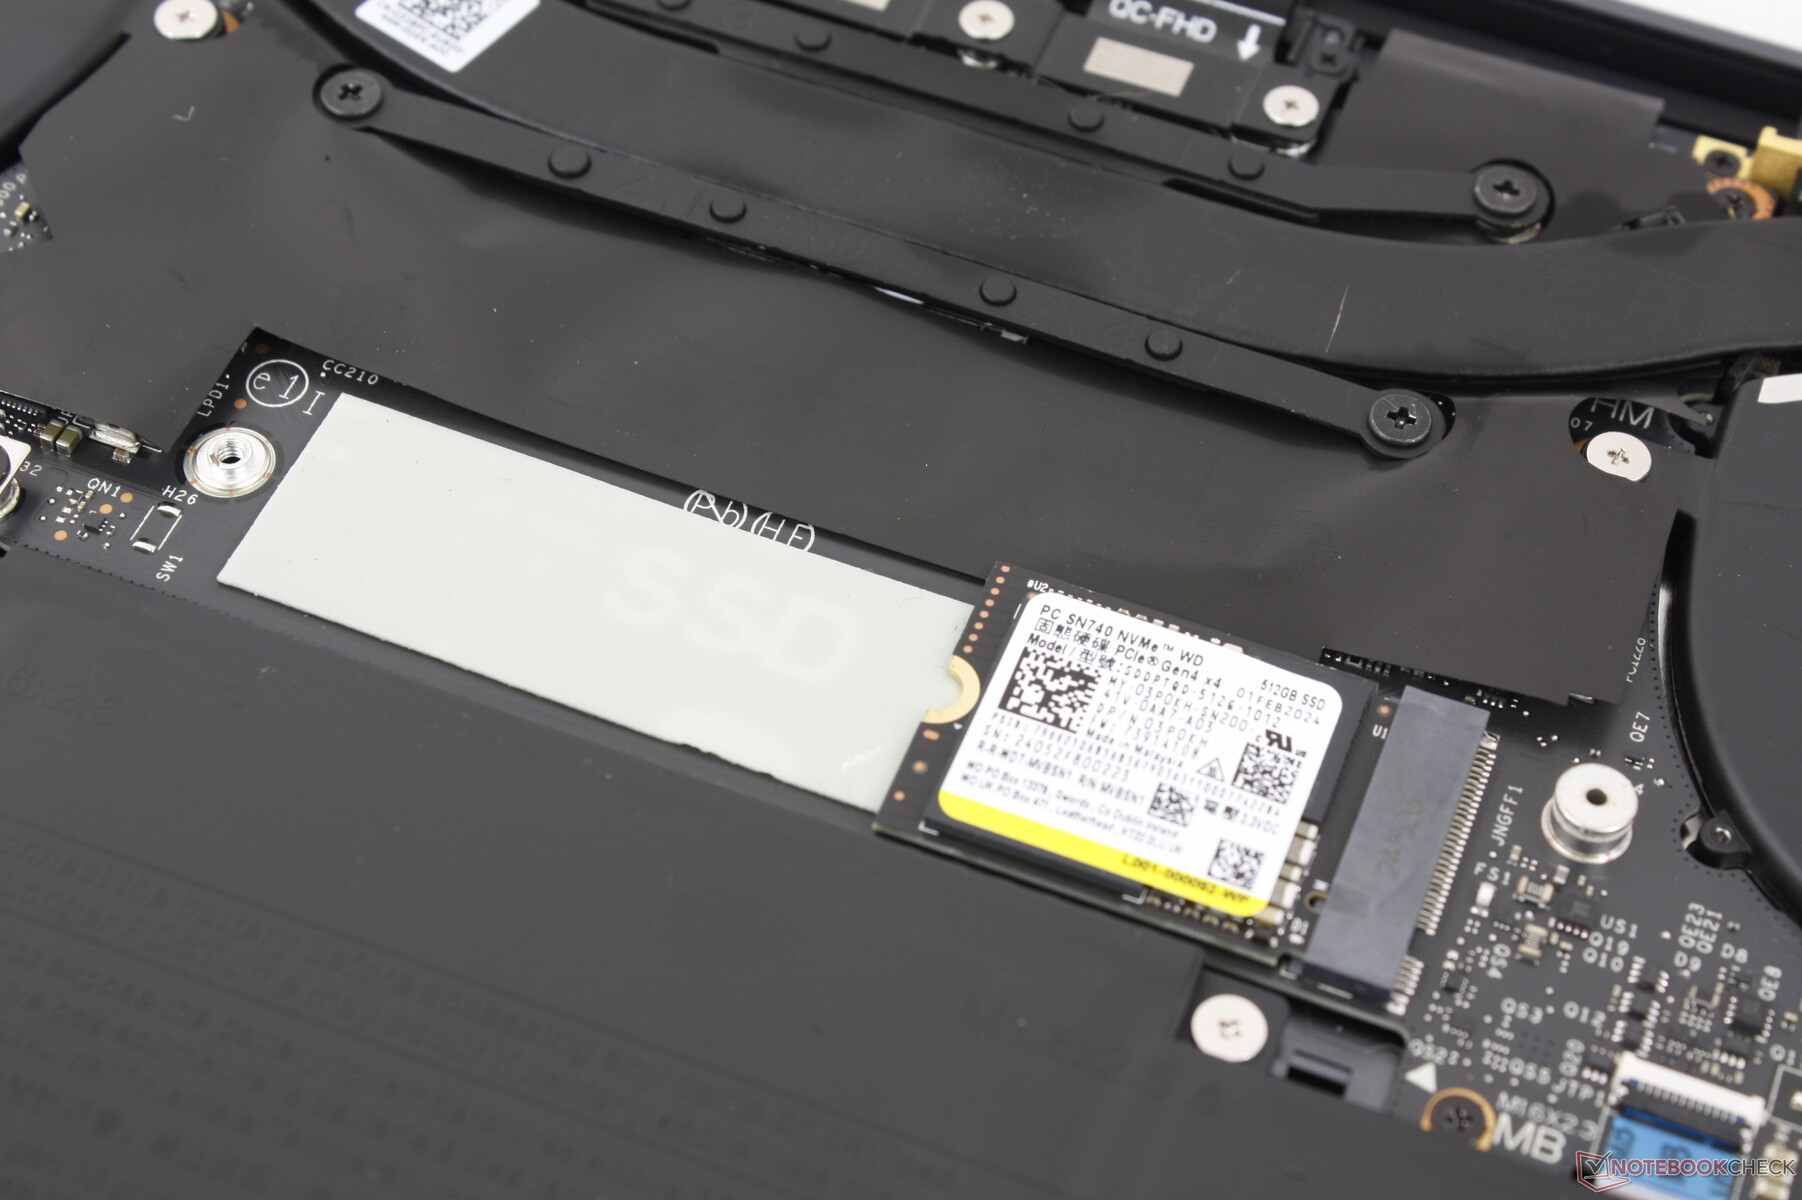
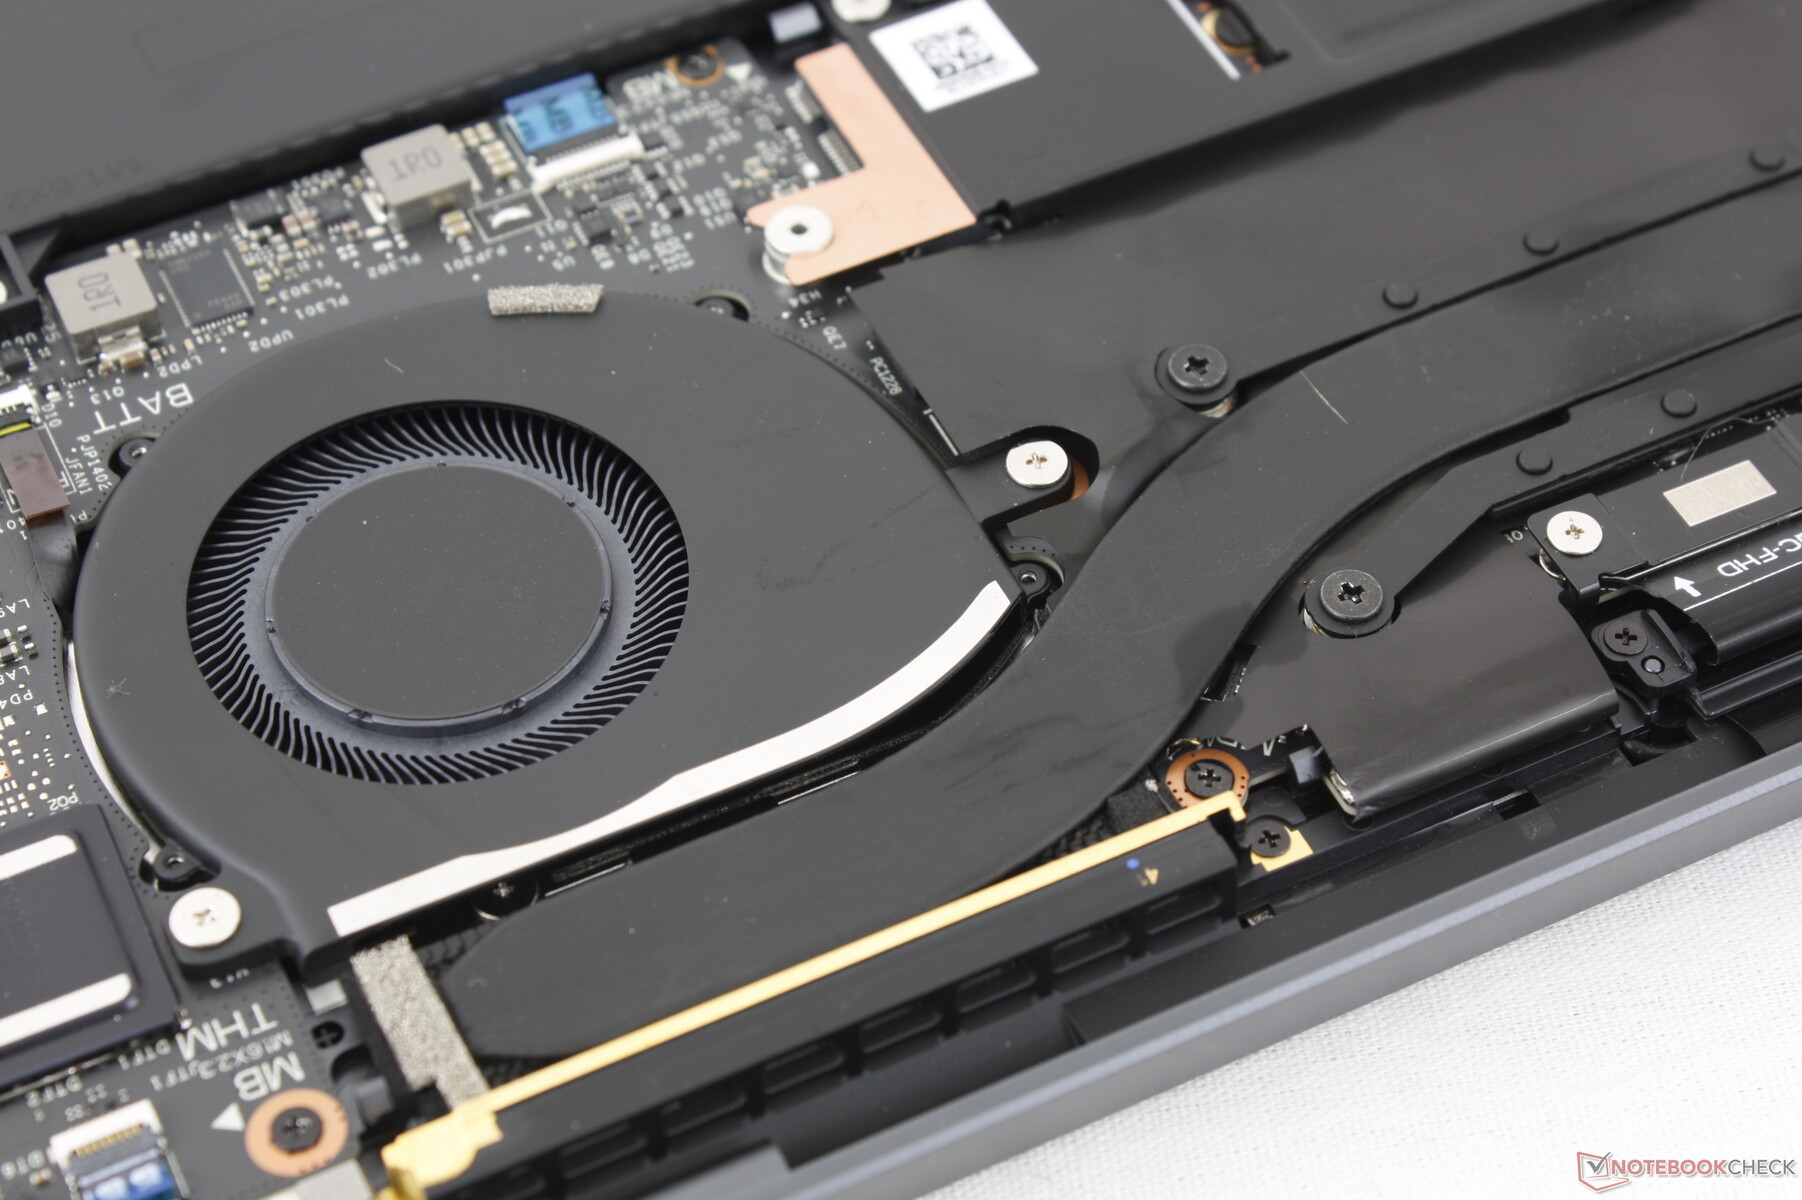
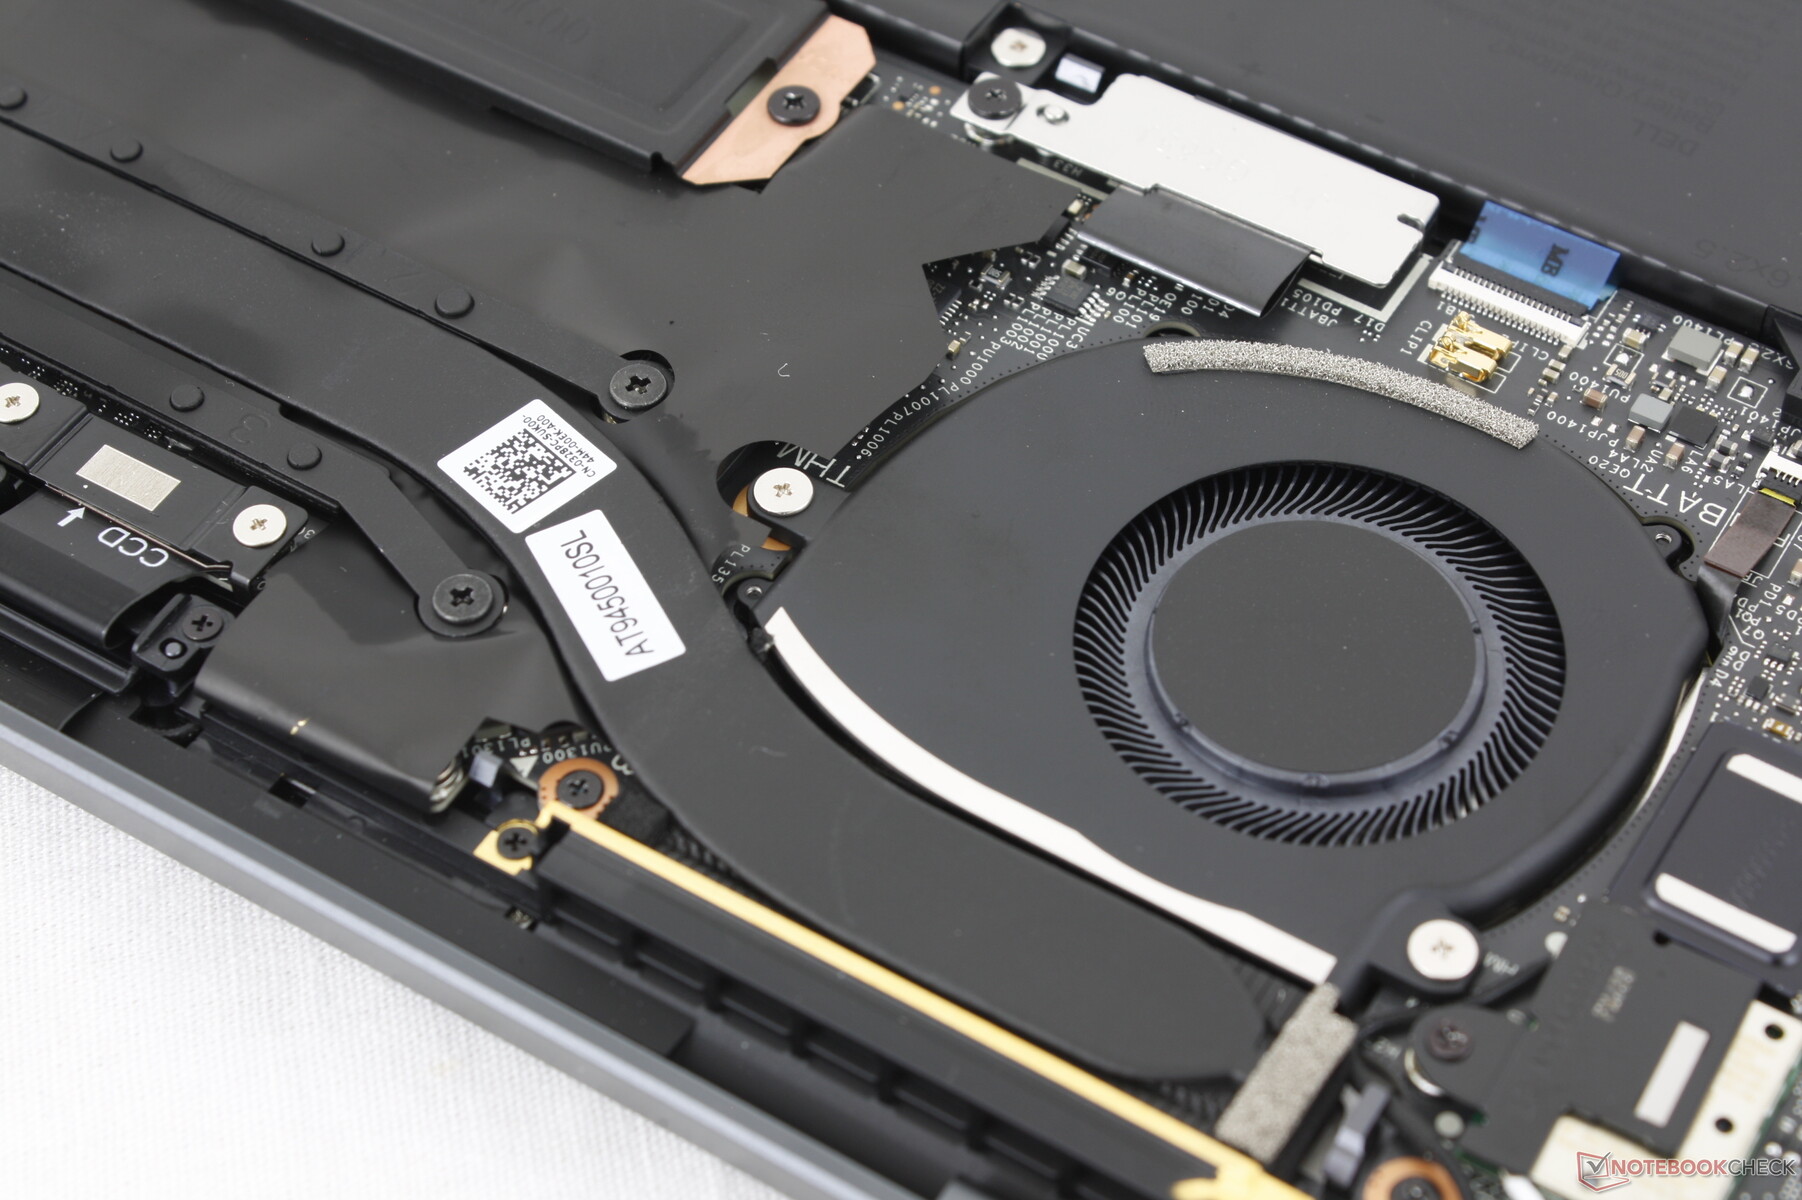
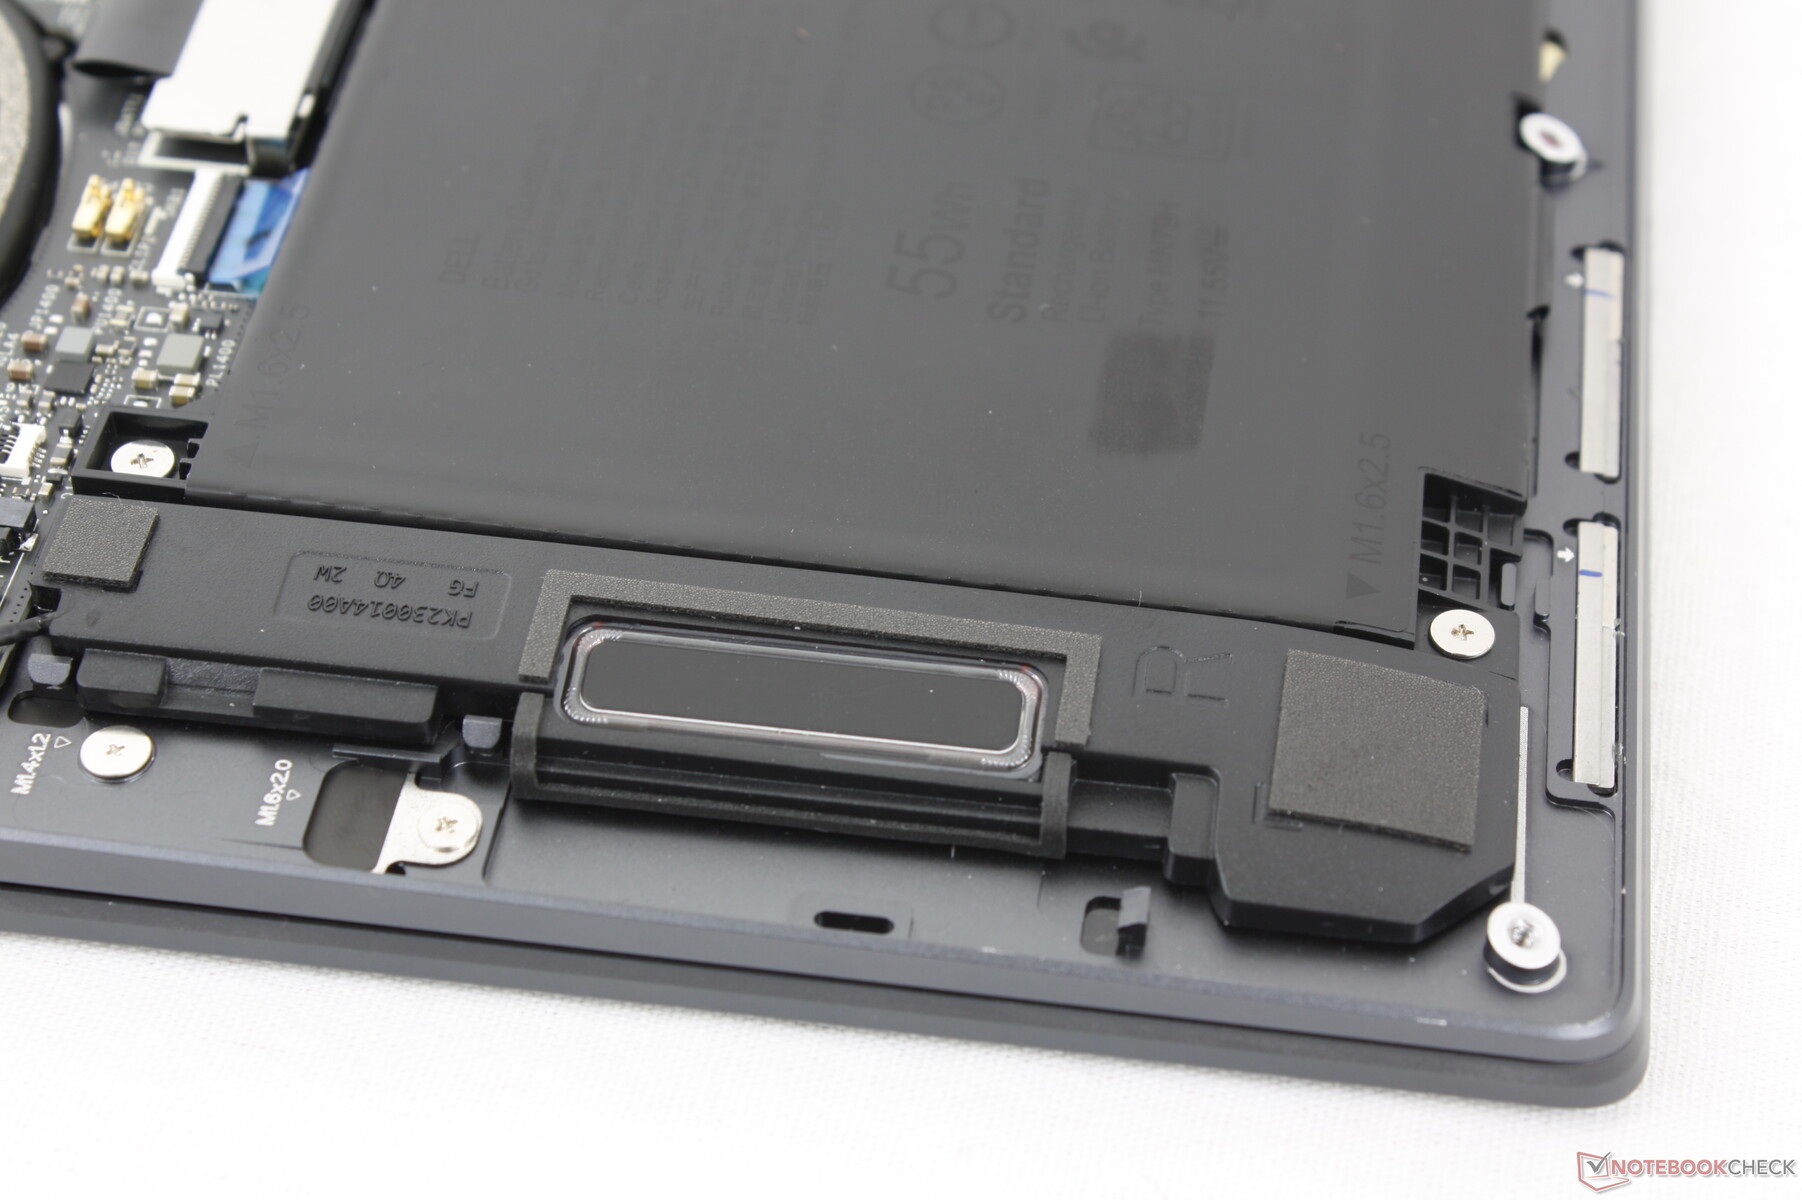
Konserwacja
Do demontażu dolnego panelu wystarczy śrubokręt Torx. Poza tym nie ma nic do ulepszenia poza pojedynczym dyskiem SSD M.2, ponieważ zarówno pamięć RAM, jak i WLAN są przylutowane.
Zrównoważony rozwój
Opakowanie składa się w 75 procentach z materiałów pochodzących z recyklingu i w 25 procentach z materiałów odnawialnych, dzięki czemu w pełni nadaje się do recyklingu. Natomiast sam laptop został wyprodukowany w co najmniej 20 procentach z aluminium i szkła pochodzących z recyklingu.
Akcesoria i gwarancja
W pudełku nie ma żadnych dodatków poza zasilaczem sieciowym i dokumentacją, podczas gdy modele XPS z procesorami Intela często zawierają adapter USB-C na USB-A za darmo.
W przypadku zakupu w Stanach Zjednoczonych obowiązuje zwykła roczna ograniczona gwarancja producenta.
Urządzenia wejściowe - czystszy wygląd kosztem użyteczności
Klawiatura
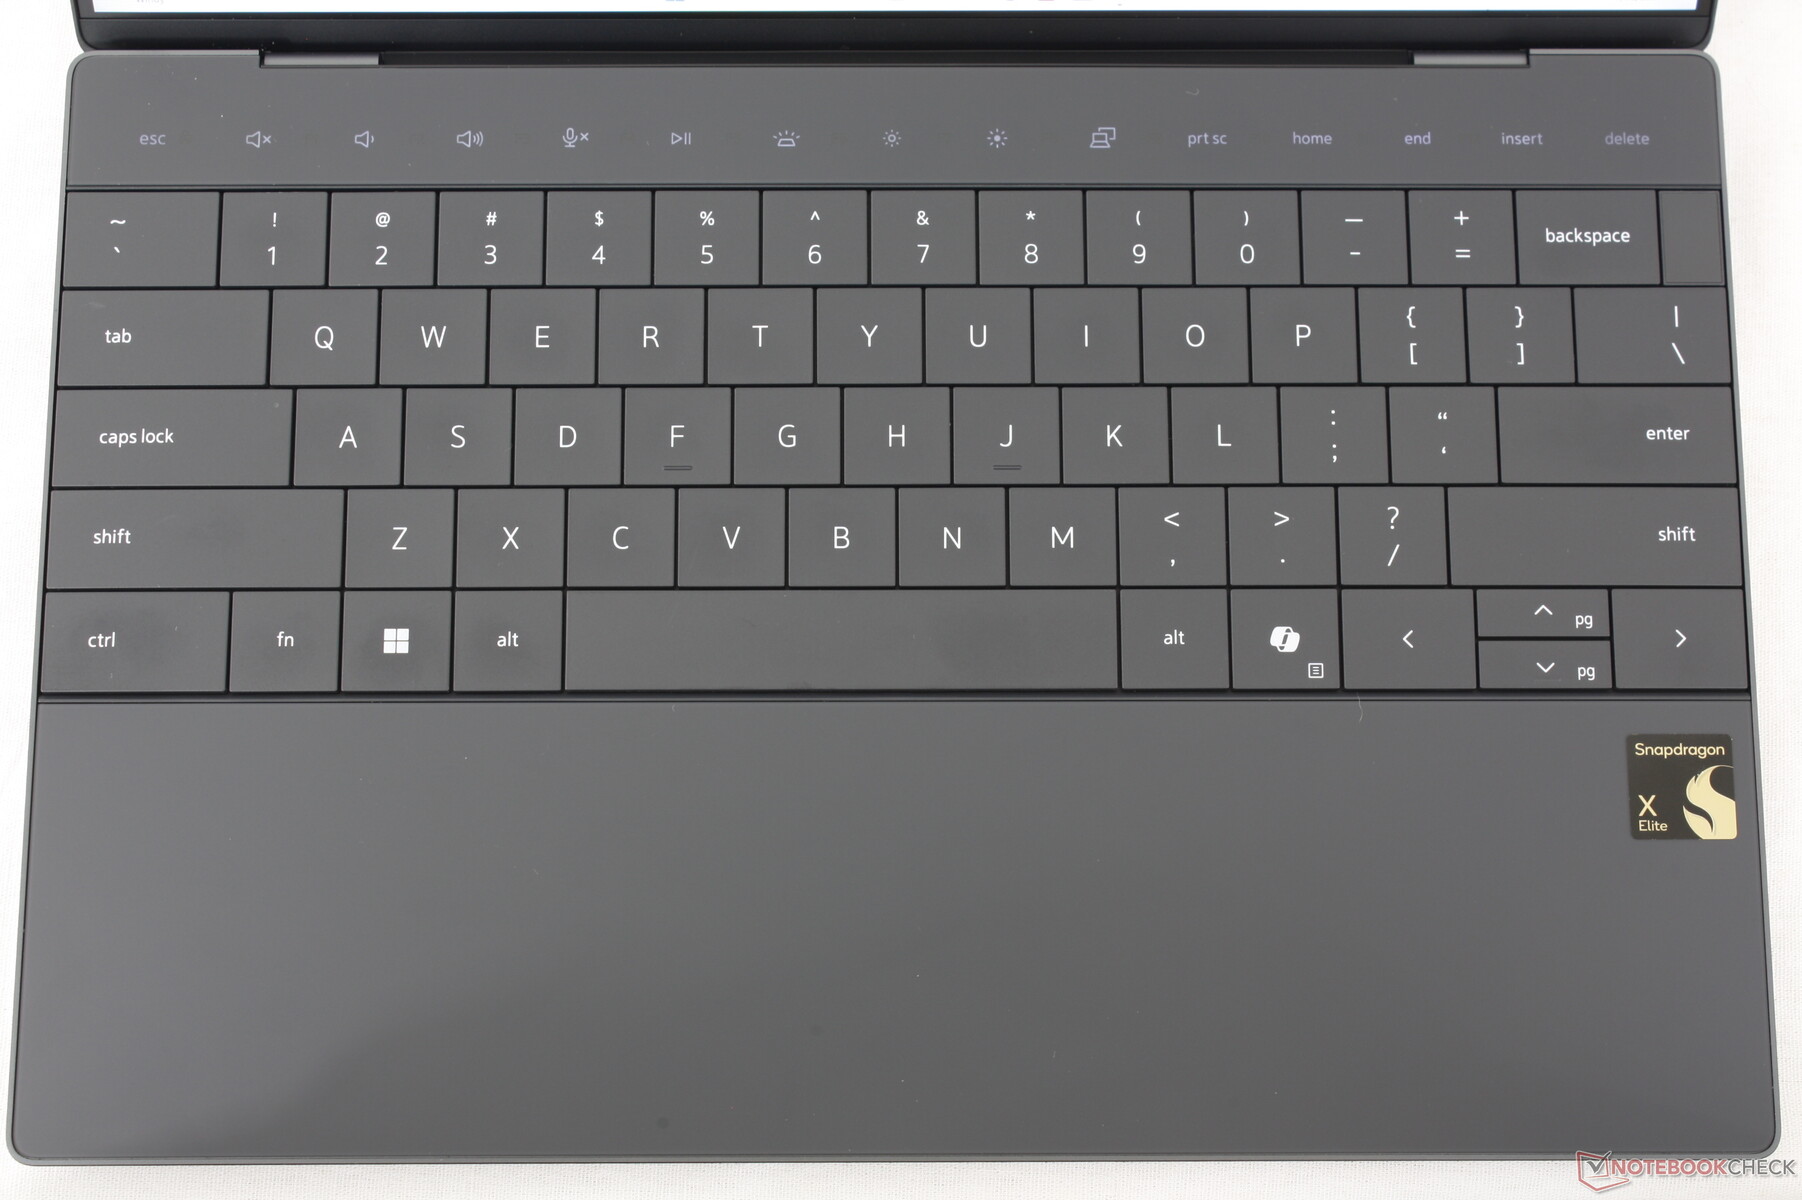
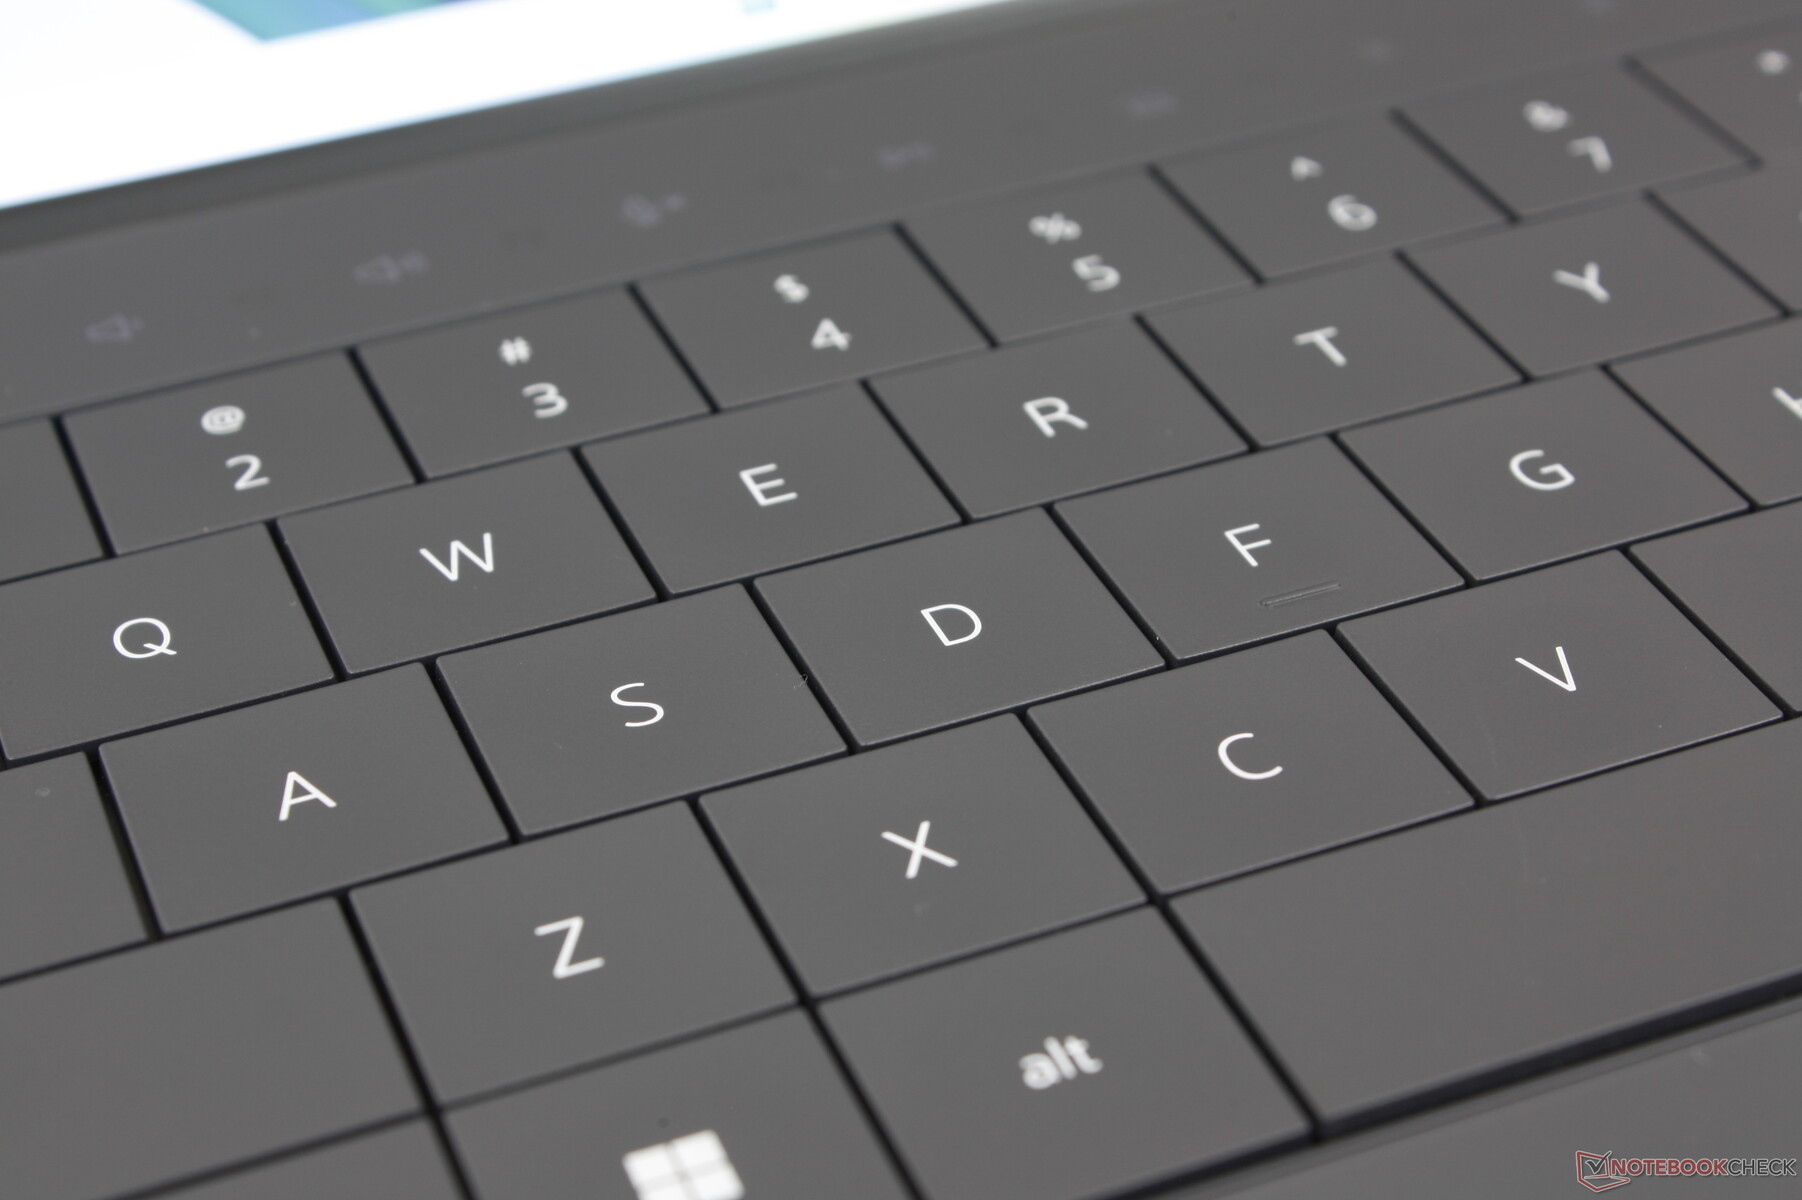
Klawiatura typu zero-lattice wymaga przyzwyczajenia w porównaniu do tradycyjnych klawiatur w większości innych subnotebooków. Skok klawiszy jest jeszcze płytszy niż zwykle i wynosi zaledwie 1,0 mm, a sprzężenie zwrotne jest stosunkowo miękkie, co zapewnia bardziej gąbczaste wrażenia podczas pisania. Różnica między XPS 13 9345 a twardszymi klawiszami w HP Spectre x360 14 jest ogromna HP Spectre x360 14.
Klawisze funkcyjne z obsługą dotykową są również mieszane. Lenovo wdrożyło coś bardzo podobnego w swojej serii ThinkPad kilka lat temu, po czym szybko je porzuciło, więc nieco zaskakujące jest ich ponowne pojawienie się u konkurencyjnego producenta. Głównym problemem jest to, że klawisze są wrażliwe nawet na najmniejsze dotknięcia, co może prowadzić do przypadkowych wejść.
Panel dotykowy
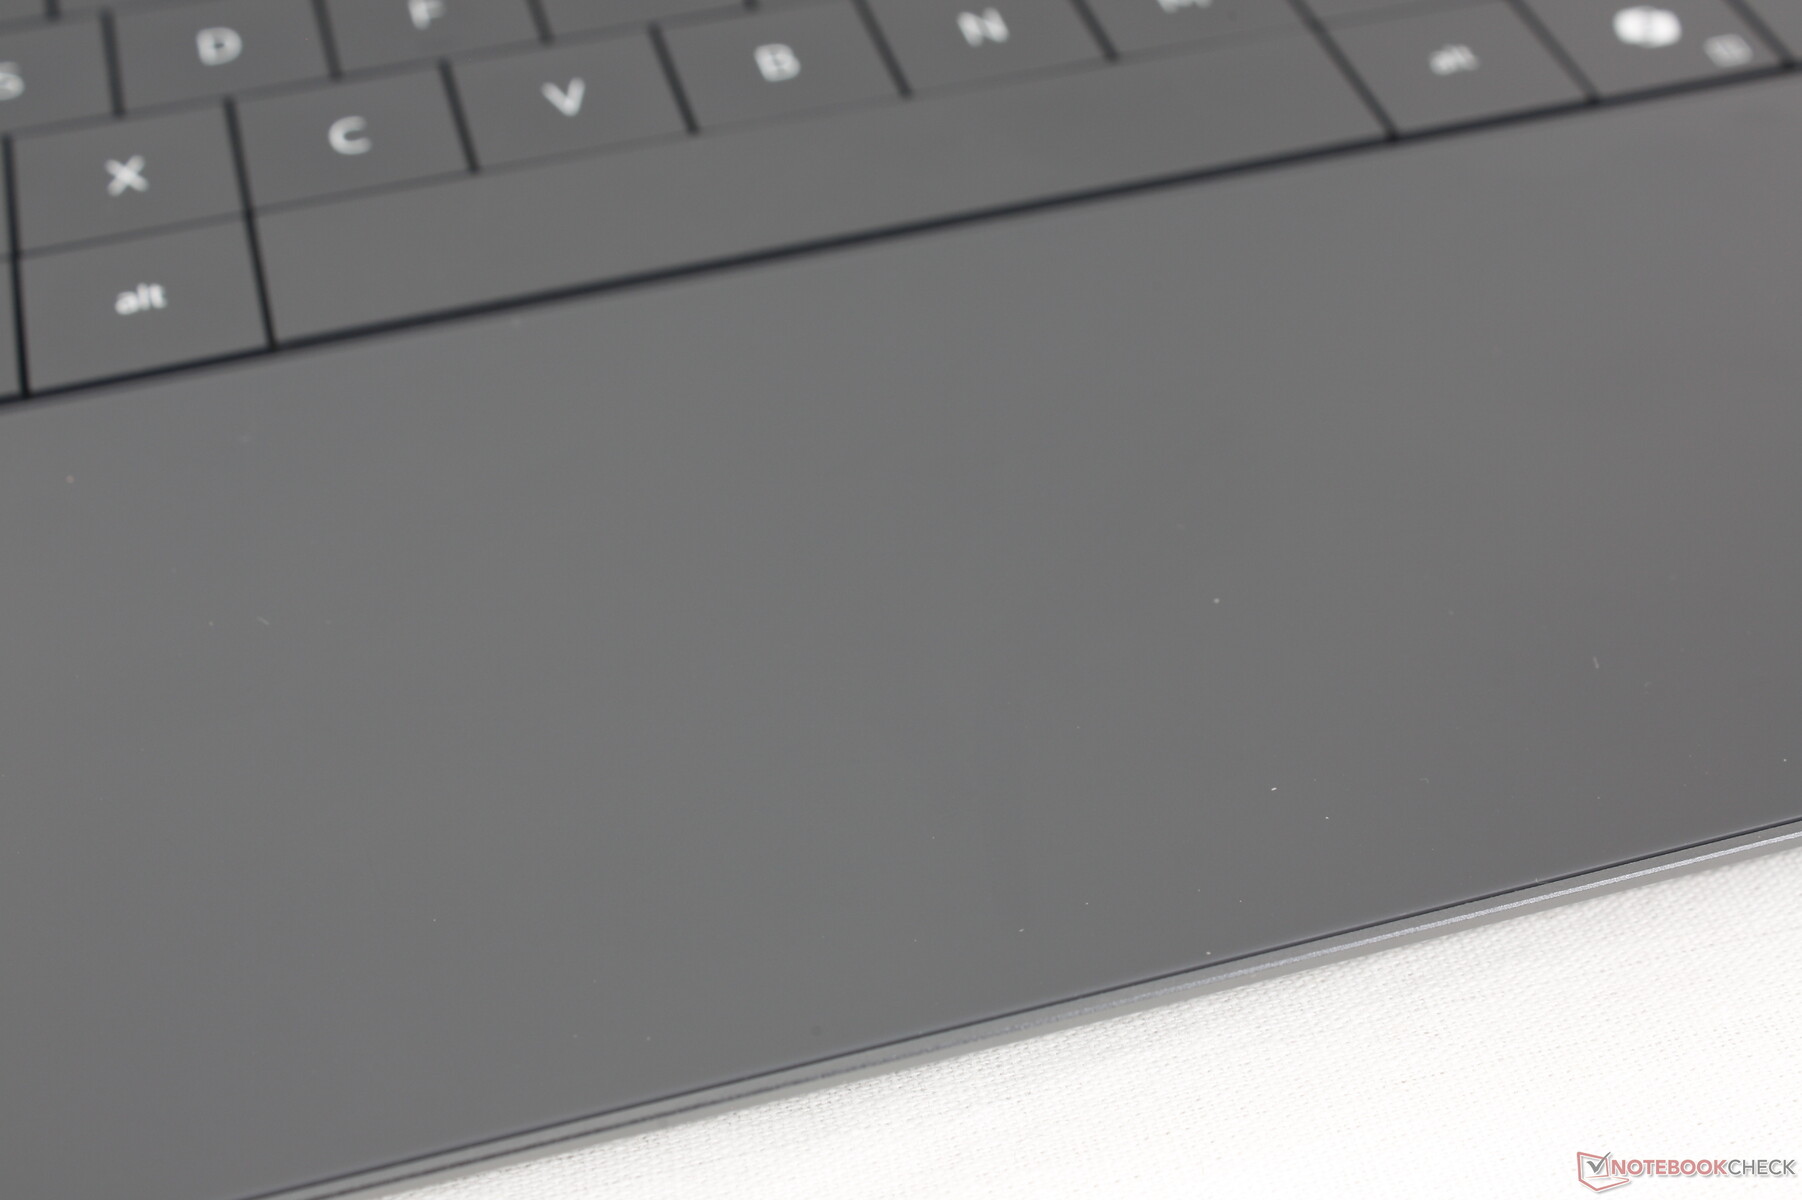
Niewidoczny clickpad XPS stał się niesławny ze względu na swoją nieprzyjazność dla użytkownika i trend ten utrzymuje się w modelu Snapdragon. Podczas gdy powierzchnia użytkowa jest dość przestronna jak na 13-calową obudowę o wymiarach około 11,5 x 7,5 cm, klikanie jest niesatysfakcjonujące ze względu na słabe sprzężenie zwrotne. Co gorsza, siła wymagana do wprowadzenia kliknięcia jest znacznie niższa niż w większości innych laptopów, co prowadzi do wielu przypadkowych kliknięć i przeciągnięć, gdy użytkownik po prostu próbuje przesunąć kursor. Mieliśmy nadzieję na pewną poprawę w tym zakresie po dwóch latach z tą konstrukcją, ale niestety tak nie jest.

Wyświetlacz
Dostępne są trzy opcje wyświetlania. Nasza recenzja obejmuje pogrubioną opcję.
- 1920 x 1200, IPS, 120 Hz, bezdotykowy, matowy
- 2560 x 1600, IPS, 120 Hz, dotykowy, błyszczący
- 2880 x 1800, OLED, 60 Hz, dotykowy, błyszczący
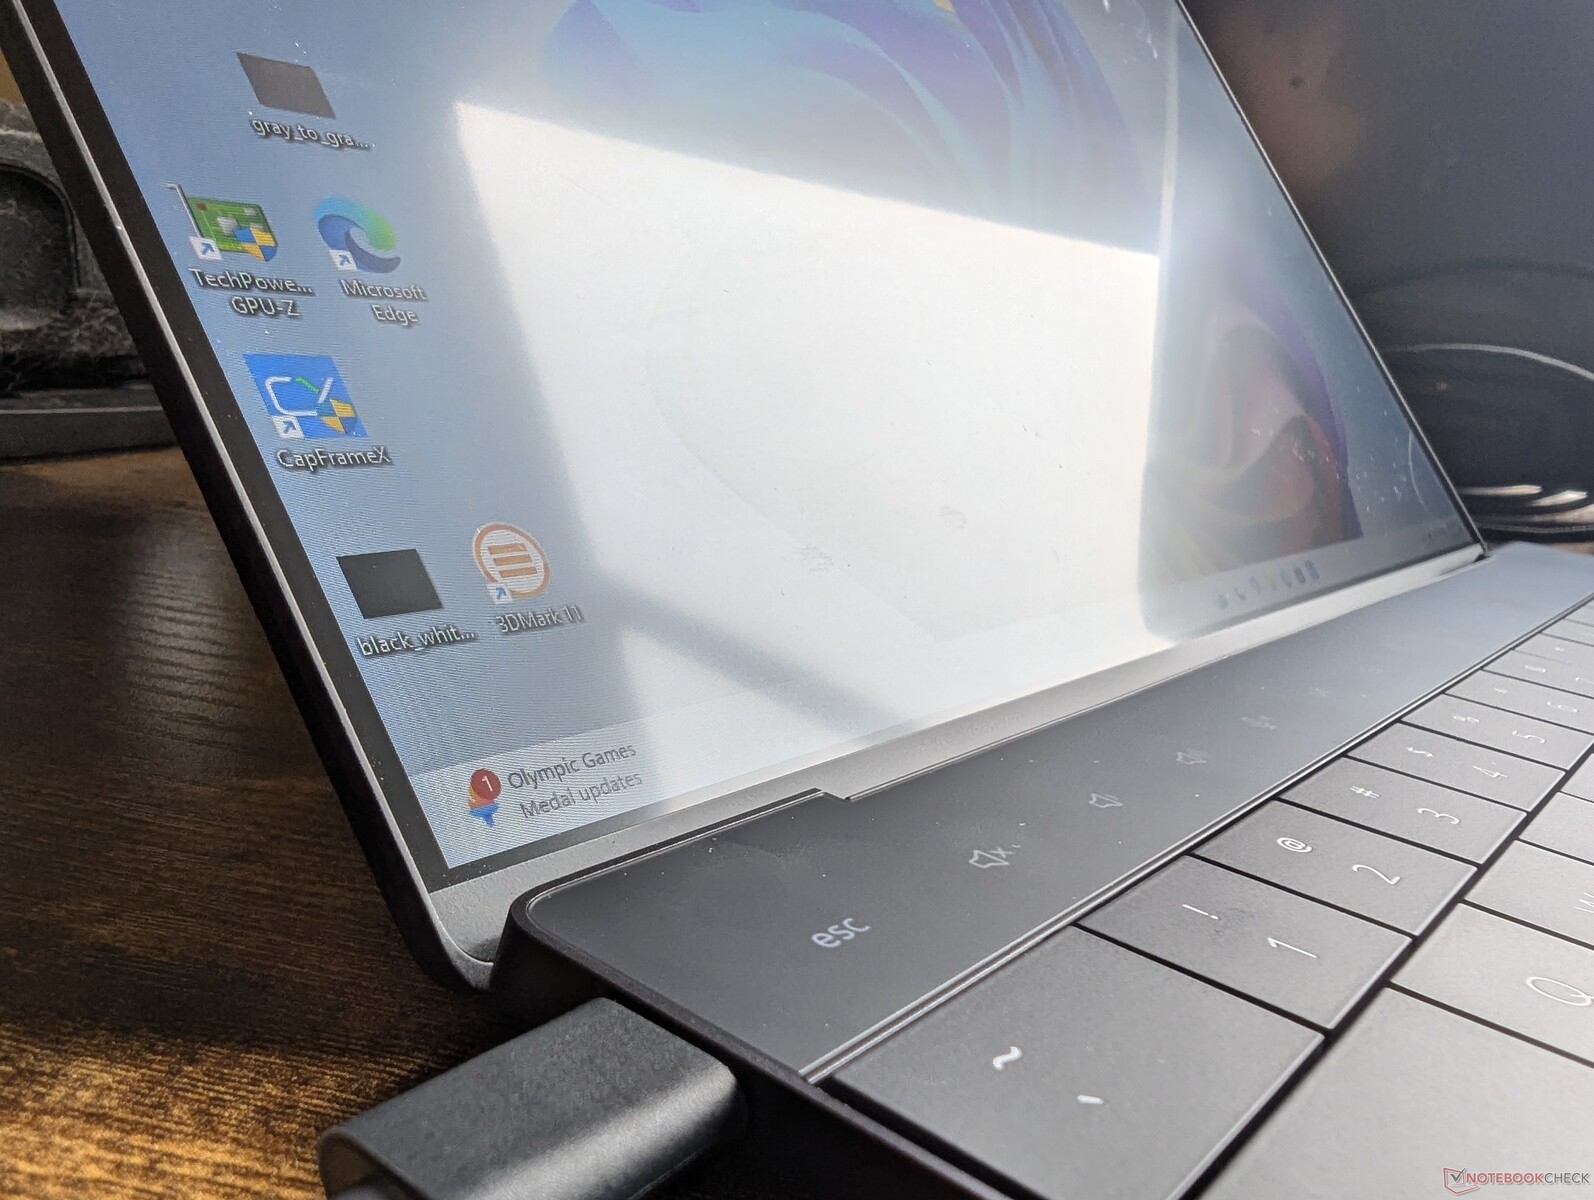
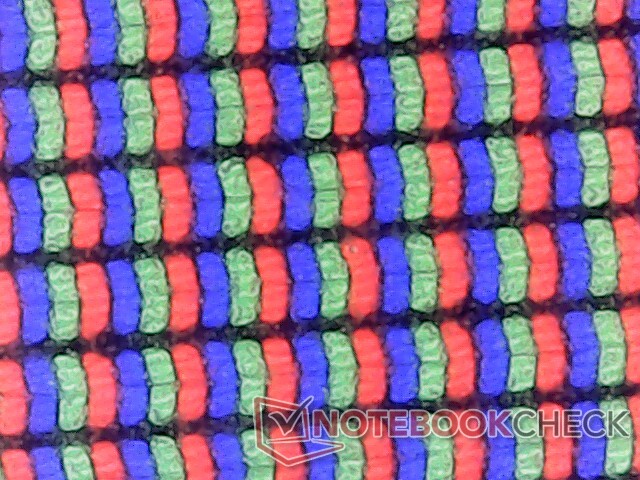
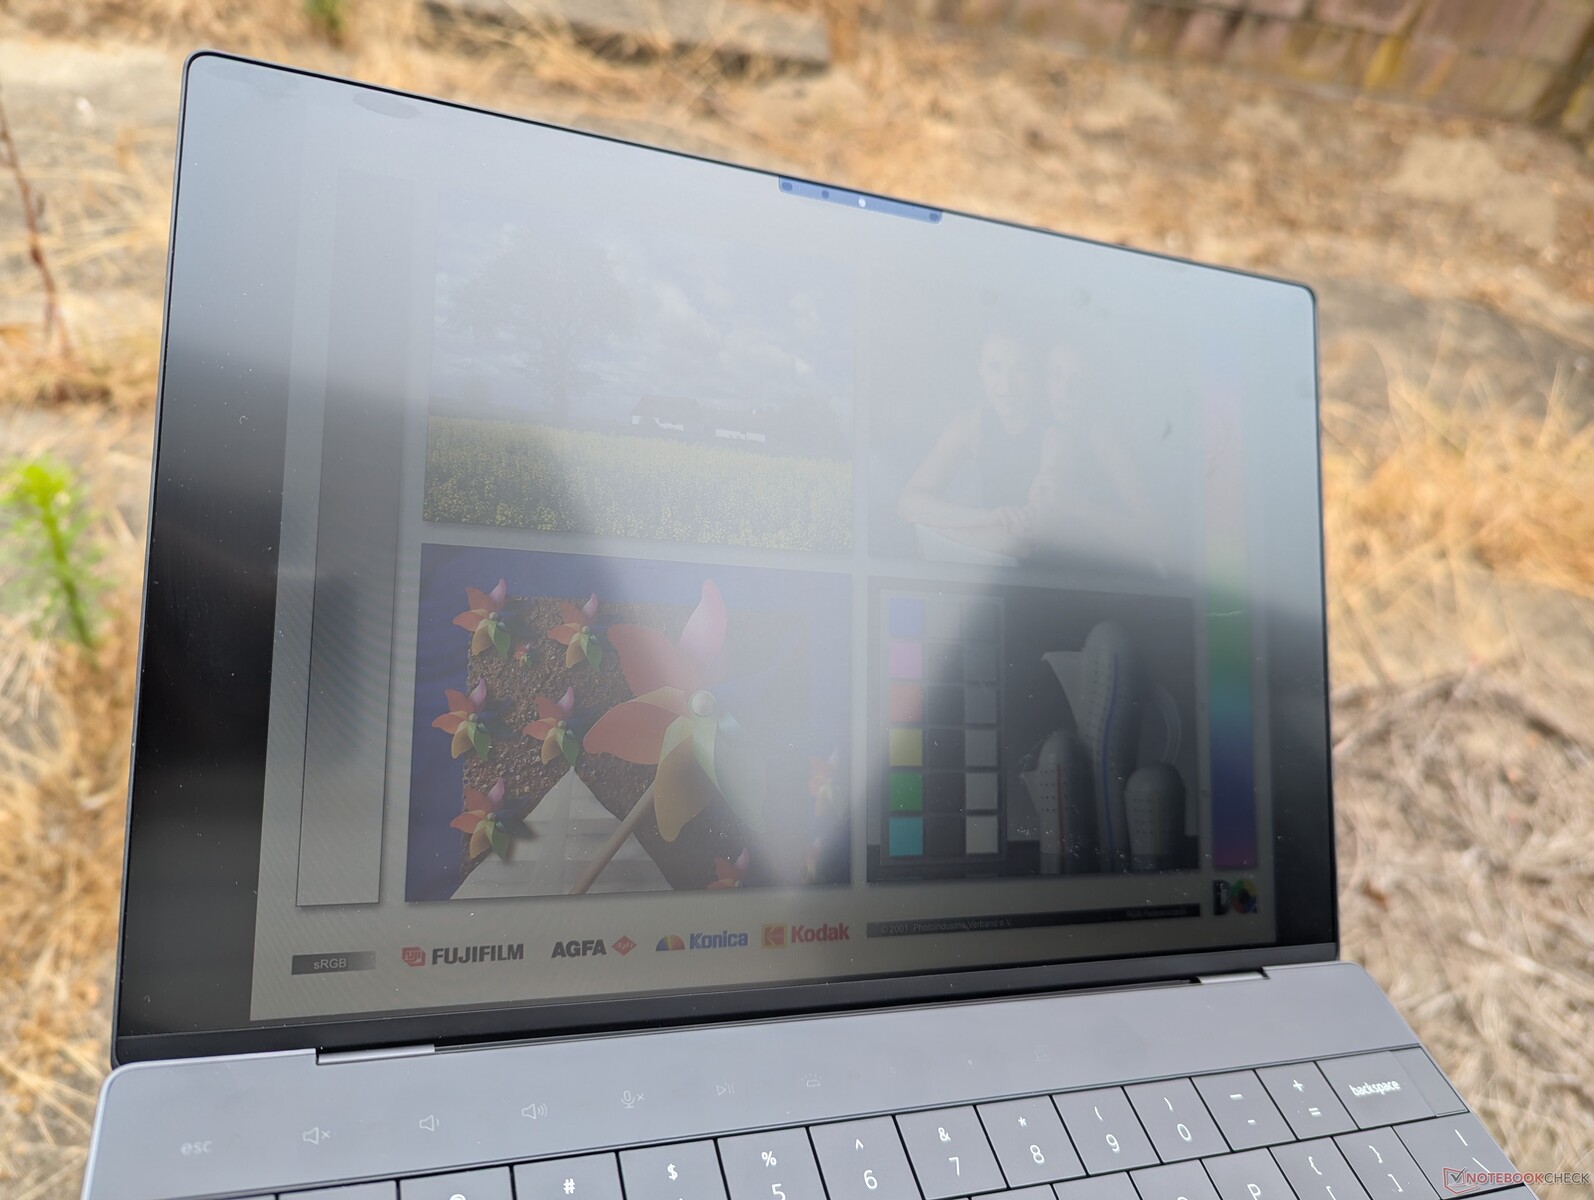
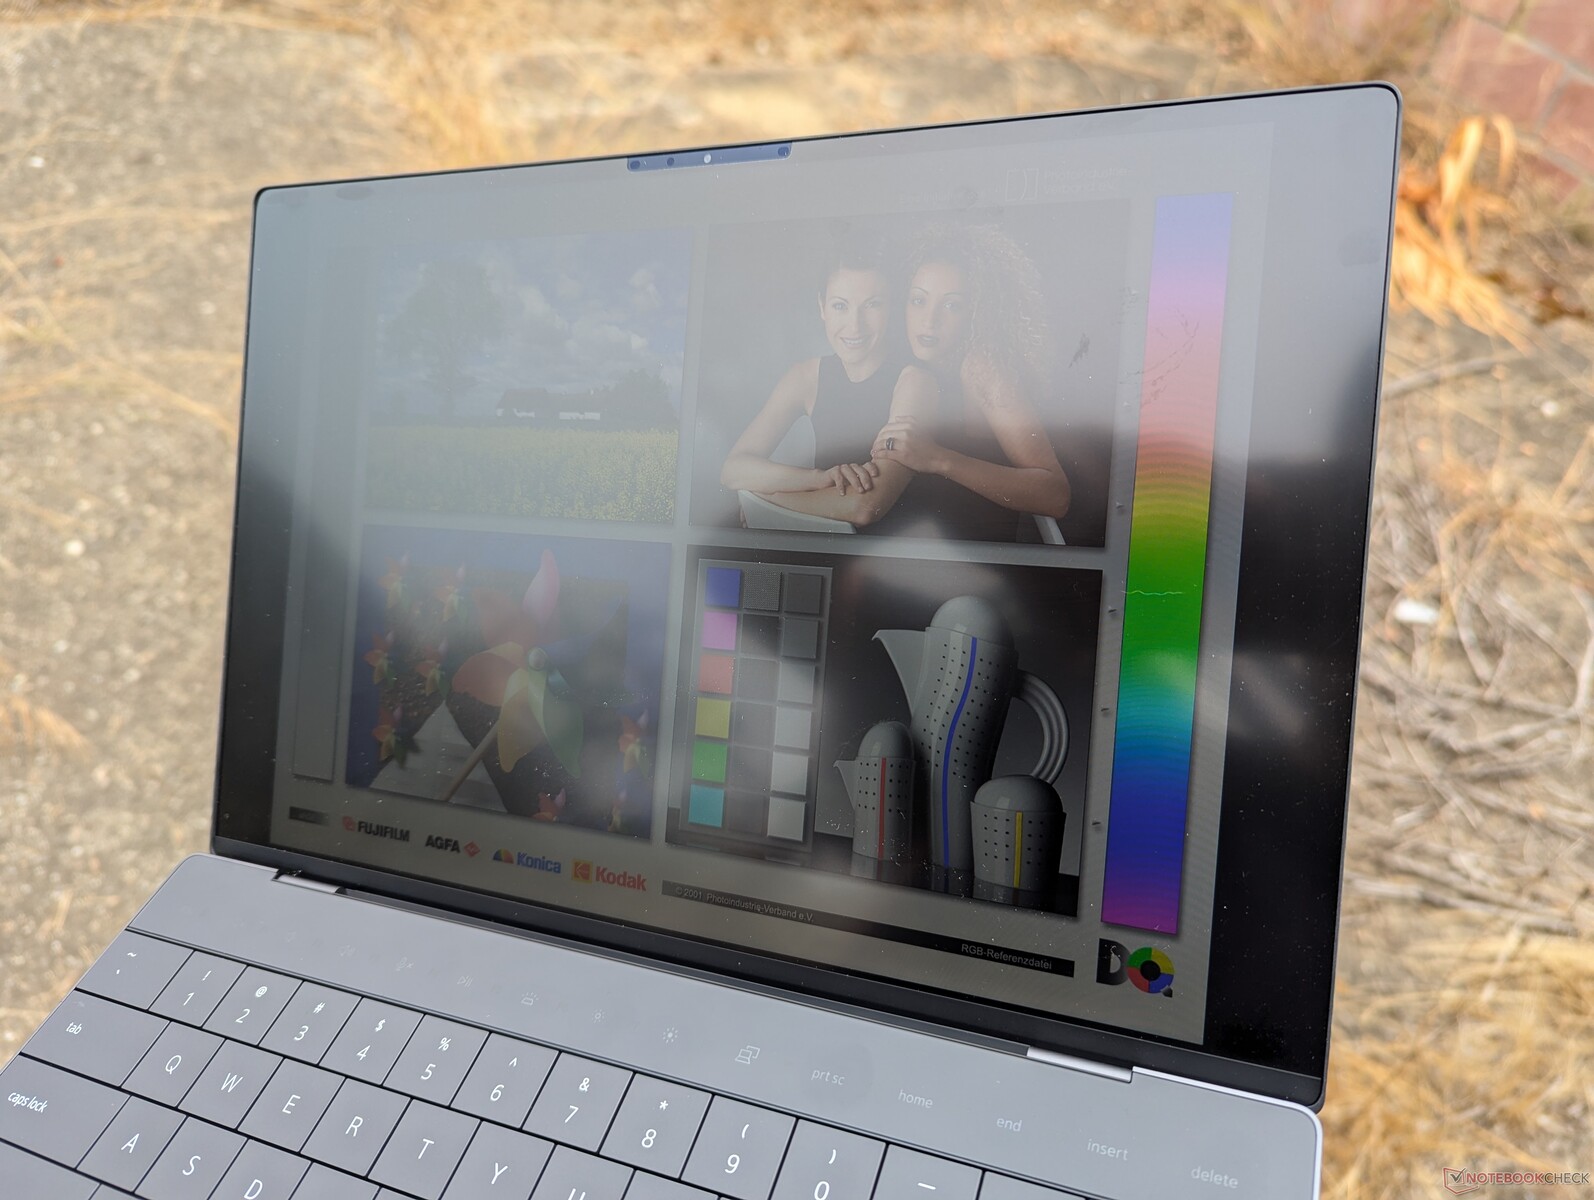
Wszystko wskazuje na to, że nasz panel 120 Hz jest dokładnie tym samym panelem, który jest używany w XPS 13 z procesorem Intel. Wszystko, począwszy od obsługi VRR do 30 Hz, odpowiedniego czasu reakcji i maksymalnej jasności 500 nitów, to podobne cechy, które można znaleźć w naszej ostatniej jednostce testowej Core Ultra 7 XPS 13. Najbardziej godny uwagi jest wysoki współczynnik kontrastu wynoszący prawie 2000:1 w porównaniu do 1000:1 w większości paneli IPS spotykanych w innych laptopach. Wyświetlacze w modelach XPS zawsze były jednymi z najlepszych w swojej klasie, więc nawet najtańsza opcja IPS nadal wygląda fantastycznie.
Pokrycie kolorów jest ograniczone do >95% sRGB w przypadku konfiguracji z opcją podstawową, podczas gdy kolory DCI-P3 są zarezerwowane dla droższych paneli IPS 1600p i OLED 1800p. Użytkownicy mogą chcieć wyłączyć funkcję Adaptive Color, aby zapobiec drobnym zmianom kolorów podczas edycji zdjęć.
Coś, co warto wspomnieć o tym panelu, to jego stosunkowo wysoki minimalny poziom jasności wynoszący 49 nitów, co zauważyliśmy również w naszym modelu Core i7. Dla porównania, wyświetlacze w większości innych laptopów zazwyczaj osiągają 15 nitów lub mniej przy minimalnym ustawieniu jasności. Wyższy poziom jasności w Dellu może powodować zmęczenie oczu podczas oglądania w ciemnym otoczeniu. Ten potencjalny problem nie występuje w konfiguracji OLED, która może osiągnąć znacznie niższe poziomy jasności.
| |||||||||||||||||||||||||
rozświetlenie: 86 %
na akumulatorze: 518.3 cd/m²
kontrast: 1993:1 (czerń: 0.26 cd/m²)
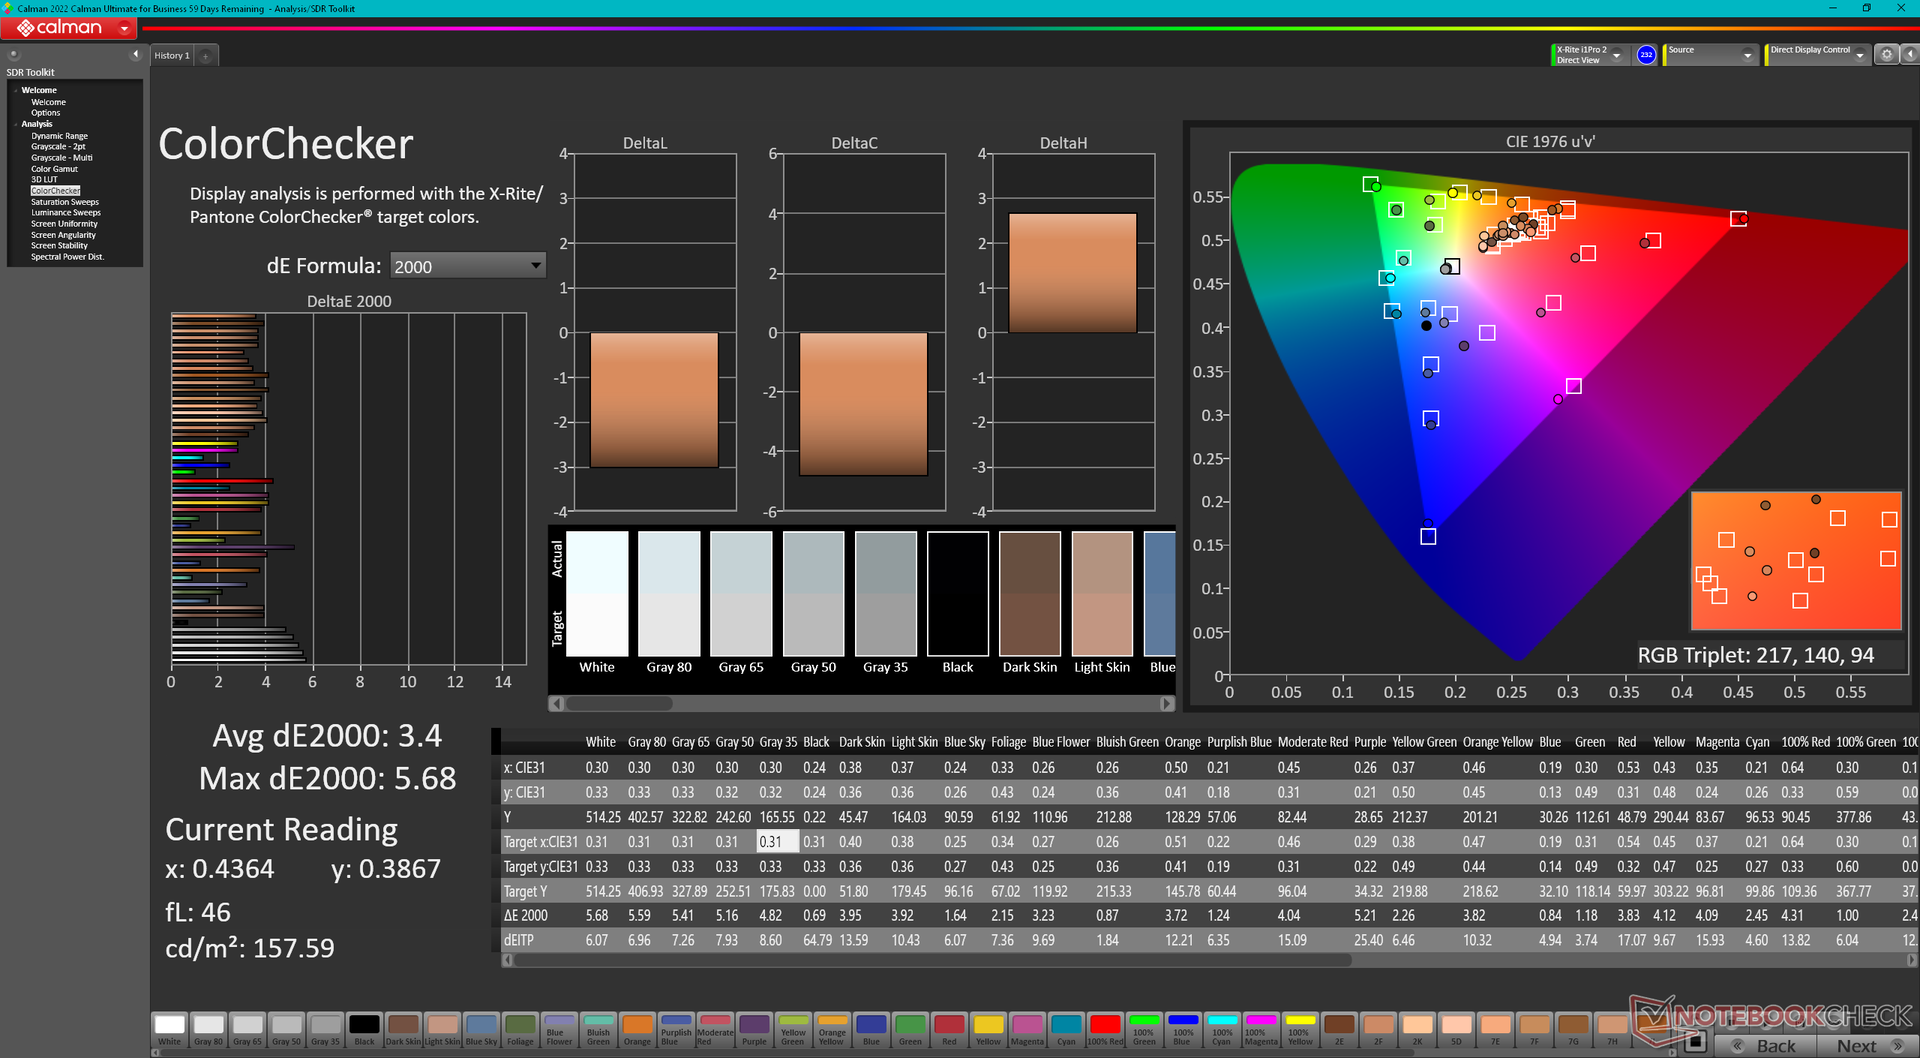
ΔE Color 3.4 | 0.5-29.43 Ø4.87
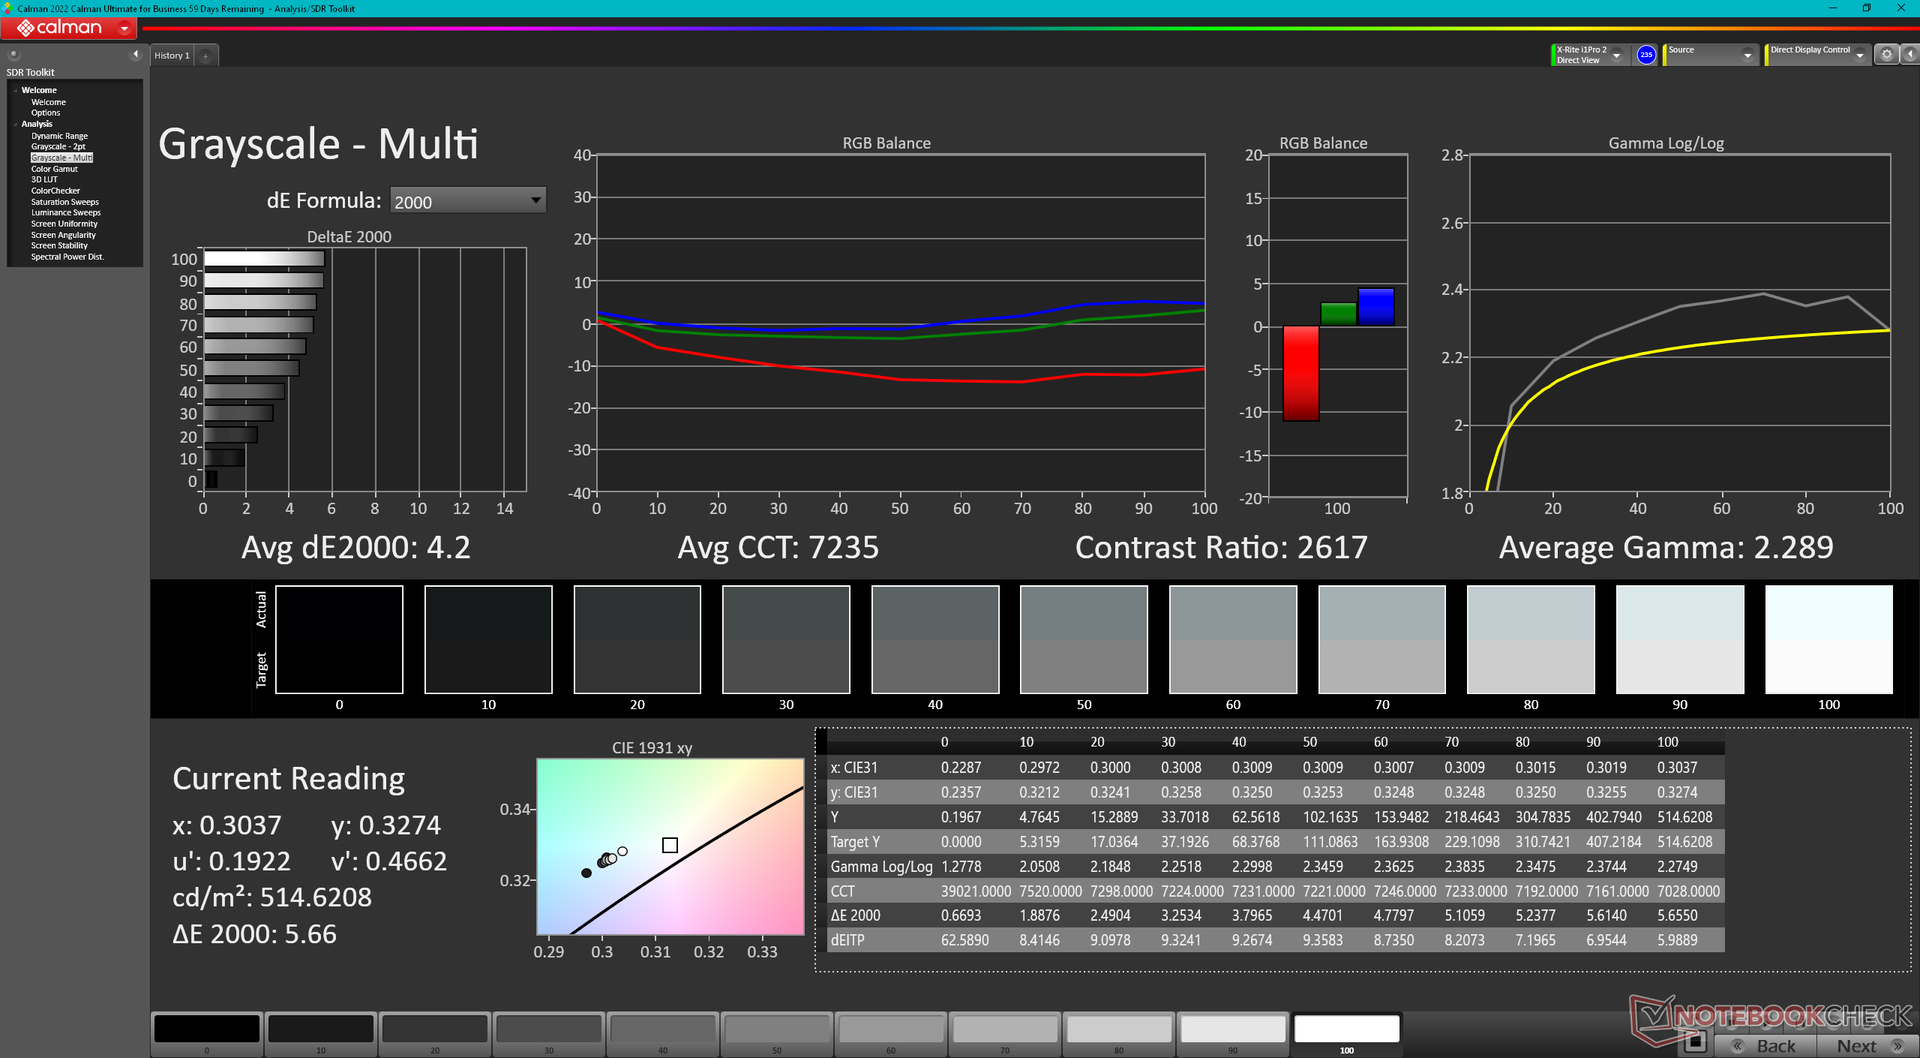
ΔE Greyscale 4.2 | 0.5-98 Ø5.1
71.7% AdobeRGB 1998 (Argyll 2.2.0 3D)
97.8% sRGB (Argyll 2.2.0 3D)
69.4% Display P3 (Argyll 2.2.0 3D)
Gamma: 2.29
| Dell XPS 13 9345 IPS, 1920x1200, 13.4", 120 Hz | Dell XPS 13 9340 Core Ultra 7 SHP1593, IPS, 1920x1200, 13.4", 120 Hz | Microsoft Surface Laptop 7 13.8 Copilot+ LQ138P1JX61, IPS, 2304x1536, 13.8", 120 Hz | Lenovo ThinkBook 13x G4 21KR0008GE LEN135WQ+, IPS, 2880x1920, 13.5", 120 Hz | HP EliteBook Ultra G1q 14 IPS, 2240x1400, 14", 60 Hz | Asus ZenBook S13 OLED UX5304 SDC417B, OLED, 2880x1800, 13.3", 60 Hz | |
|---|---|---|---|---|---|---|
| Display | 0% | 21% | -4% | 27% | ||
| Display P3 Coverage | 69.4 | 69.4 0% | 97.8 41% | 65.5 -6% | 99.7 44% | |
| sRGB Coverage | 97.8 | 97.8 0% | 98.2 0% | 97.3 -1% | 100 2% | |
| AdobeRGB 1998 Coverage | 71.7 | 71.7 0% | 87.3 22% | 67.7 -6% | 96.9 35% | |
| Response Times | -25% | 5% | 32% | 27% | 94% | |
| Response Time Grey 50% / Grey 80% * | 35.2 ? | 43.2 ? -23% | 38.9 ? -11% | 27.3 ? 22% | 22.8 ? 35% | 2 ? 94% |
| Response Time Black / White * | 21.8 ? | 27.6 ? -27% | 17.4 ? 20% | 12.8 ? 41% | 17.9 ? 18% | 1.6 ? 93% |
| PWM Frequency | 240 ? | |||||
| Screen | -6% | 16% | 10% | -58% | 27% | |
| Brightness middle | 518.3 | 429 -17% | 606 17% | 539 4% | 341.4 -34% | 361 -30% |
| Brightness | 487 | 407 -16% | 592 22% | 513 5% | 315 -35% | 365 -25% |
| Brightness Distribution | 86 | 90 5% | 94 9% | 89 3% | 87 1% | 98 14% |
| Black Level * | 0.26 | 0.28 -8% | 0.43 -65% | 0.38 -46% | 0.39 -50% | |
| Contrast | 1993 | 1532 -23% | 1409 -29% | 1418 -29% | 875 -56% | |
| Colorchecker dE 2000 * | 3.4 | 2.6 24% | 1.3 62% | 1.4 59% | 5.63 -66% | 1.2 65% |
| Colorchecker dE 2000 max. * | 5.68 | 6.6 -16% | 2.1 63% | 3.5 38% | 11.94 -110% | 1.9 67% |
| Greyscale dE 2000 * | 4.2 | 4 5% | 2.1 50% | 2.2 48% | 8.8 -110% | 1.2 71% |
| Gamma | 2.29 96% | 2.23 99% | 2.16 102% | 2.19 100% | 2.14 103% | 2.27 97% |
| CCT | 7235 90% | 7332 89% | 6842 95% | 6710 97% | 6034 108% | 6486 100% |
| Colorchecker dE 2000 calibrated * | 1.4 | 0.7 | ||||
| Całkowita średnia (program / ustawienia) | -10% /
-7% | 14% /
15% | 13% /
10% | -16% /
-41% | 49% /
39% |
* ... im mniej tym lepiej
Nasz kolorymetr X-Rite wykazał, że wyświetlacz celuje w sRGB z przyzwoitymi średnimi wartościami deltaE skali szarości i kolorów wynoszącymi odpowiednio 4,2 i 3,4. Temperatura barwowa jest jednak nieco zbyt niska i wynosi 7235, co zaburza dokładność kolorów przy niższych poziomach nasycenia. Szkoda, że Dell nie kalibruje panelu fabrycznie, ponieważ większość oprogramowania kalibracyjnego nie jest jeszcze kompatybilna z ARM, w tym i1Profiler.

Wyświetl czasy reakcji
| ↔ Czas reakcji od czerni do bieli | ||
|---|---|---|
| 21.8 ms ... wzrost ↗ i spadek ↘ łącznie | ↗ 10.5 ms wzrost | 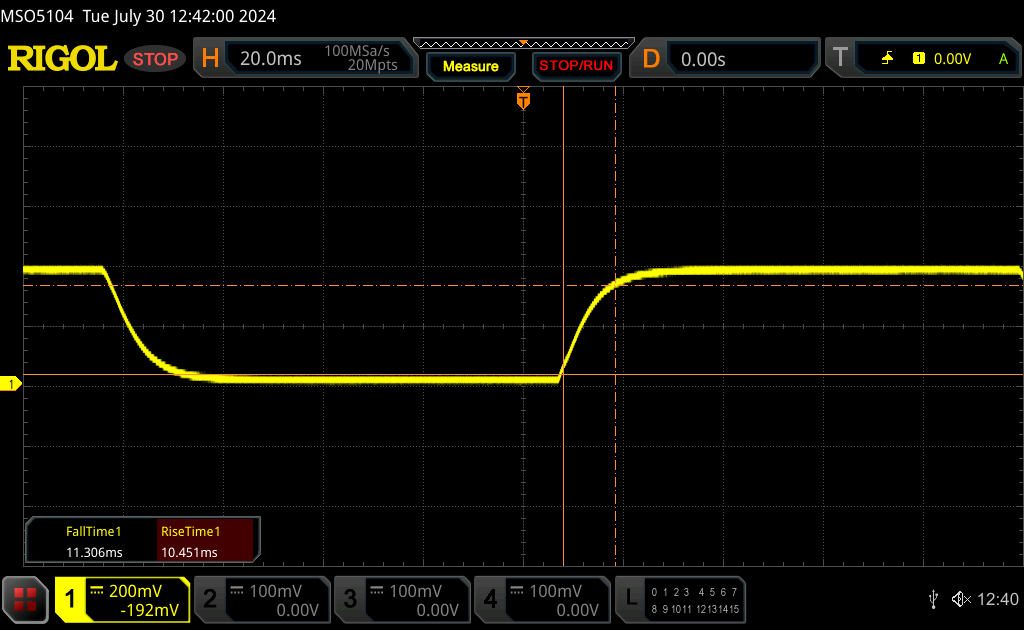 |
| ↘ 11.3 ms upadek | ||
| W naszych testach ekran wykazuje dobry współczynnik reakcji, ale może być zbyt wolny dla graczy rywalizujących ze sobą. Dla porównania, wszystkie testowane urządzenia wahają się od 0.1 (minimum) do 240 (maksimum) ms. » 45 % wszystkich urządzeń jest lepszych. Oznacza to, że zmierzony czas reakcji jest zbliżony do średniej wszystkich testowanych urządzeń (20.8 ms). | ||
| ↔ Czas reakcji 50% szarości do 80% szarości | ||
| 35.2 ms ... wzrost ↗ i spadek ↘ łącznie | ↗ 15.2 ms wzrost | 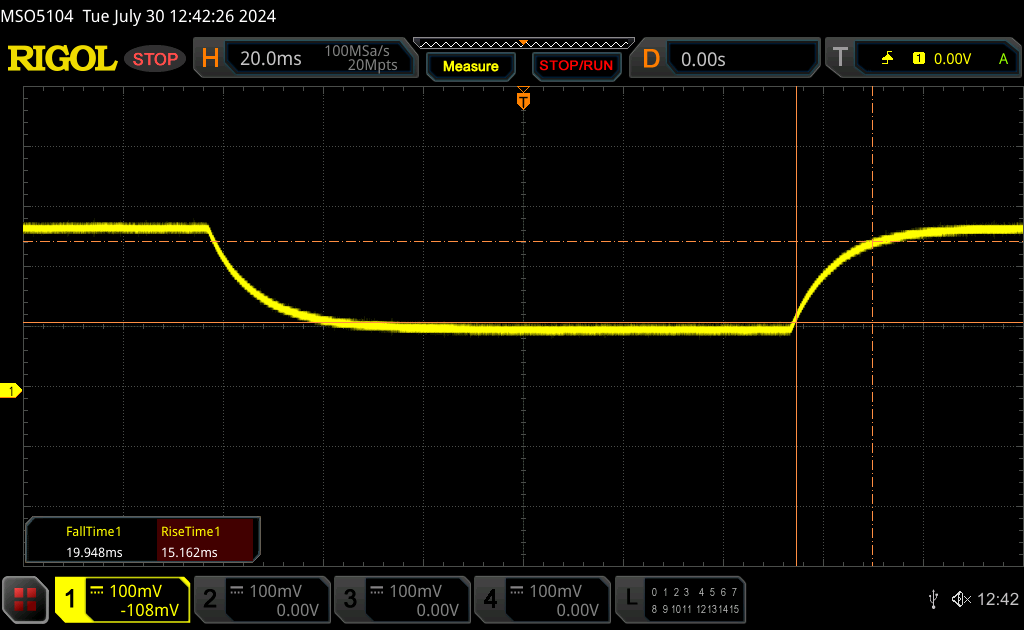 |
| ↘ 20 ms upadek | ||
| W naszych testach ekran wykazuje powolne tempo reakcji, co będzie niezadowalające dla graczy. Dla porównania, wszystkie testowane urządzenia wahają się od 0.165 (minimum) do 636 (maksimum) ms. » 46 % wszystkich urządzeń jest lepszych. Oznacza to, że zmierzony czas reakcji jest zbliżony do średniej wszystkich testowanych urządzeń (32.5 ms). | ||
Migotanie ekranu / PWM (modulacja szerokości impulsu)
| Migotanie ekranu/nie wykryto PWM | 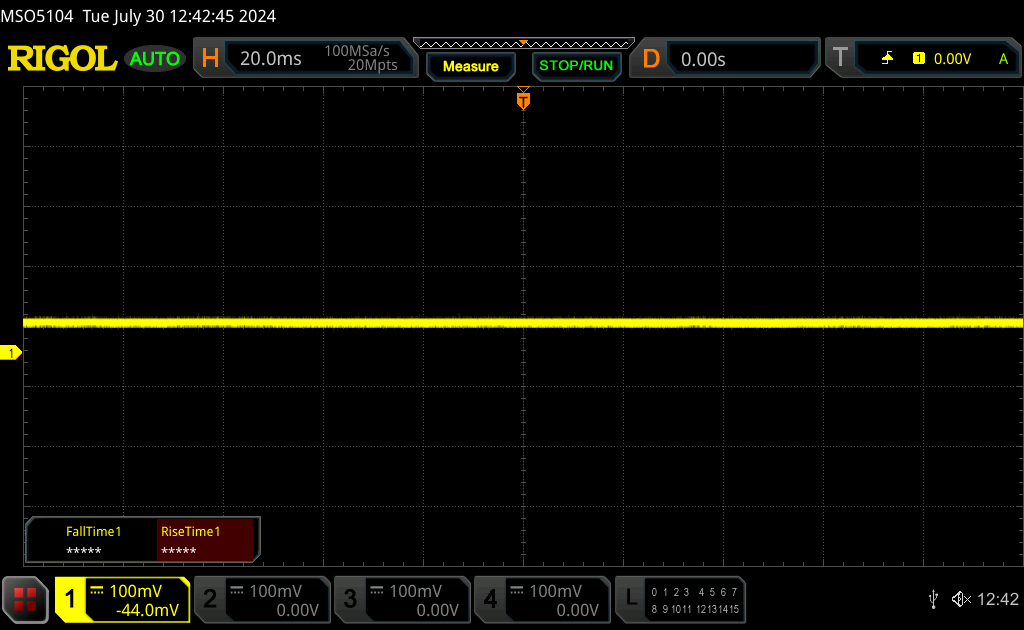 | ||
Dla porównania: 53 % wszystkich testowanych urządzeń nie używa PWM do przyciemniania wyświetlacza. Jeśli wykryto PWM, zmierzono średnio 8516 (minimum: 5 - maksimum: 343500) Hz. | |||


Wydajność
Warunki testowania
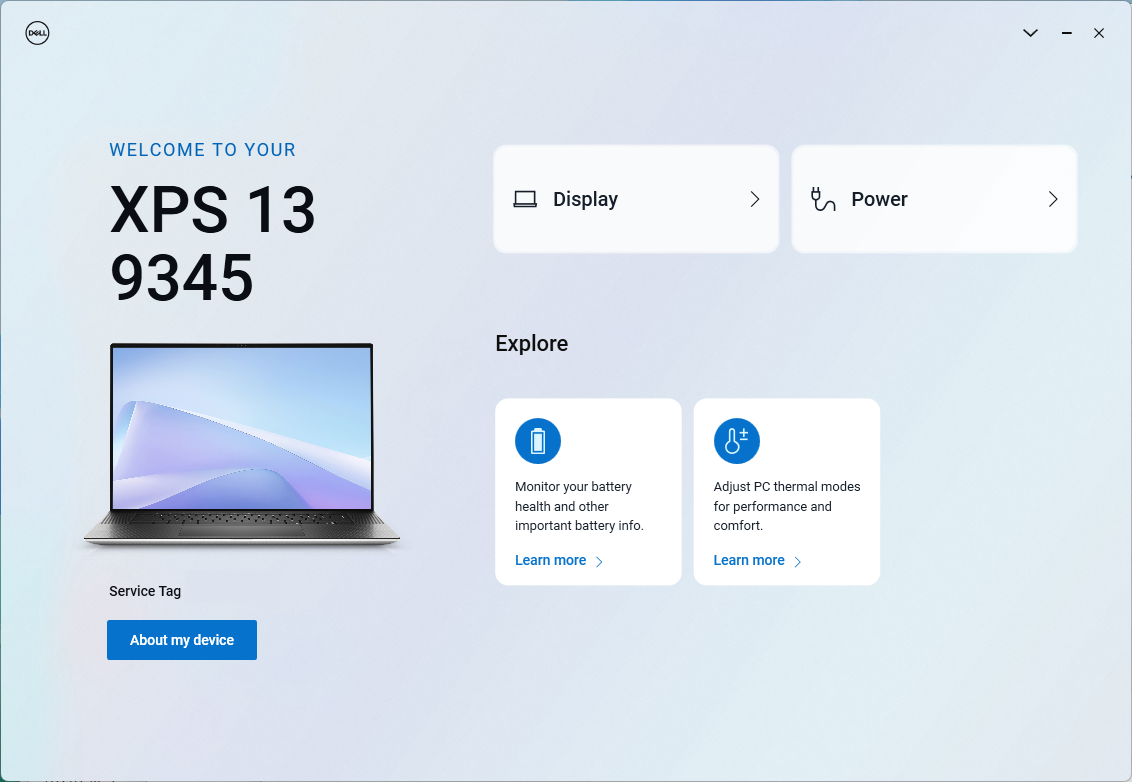
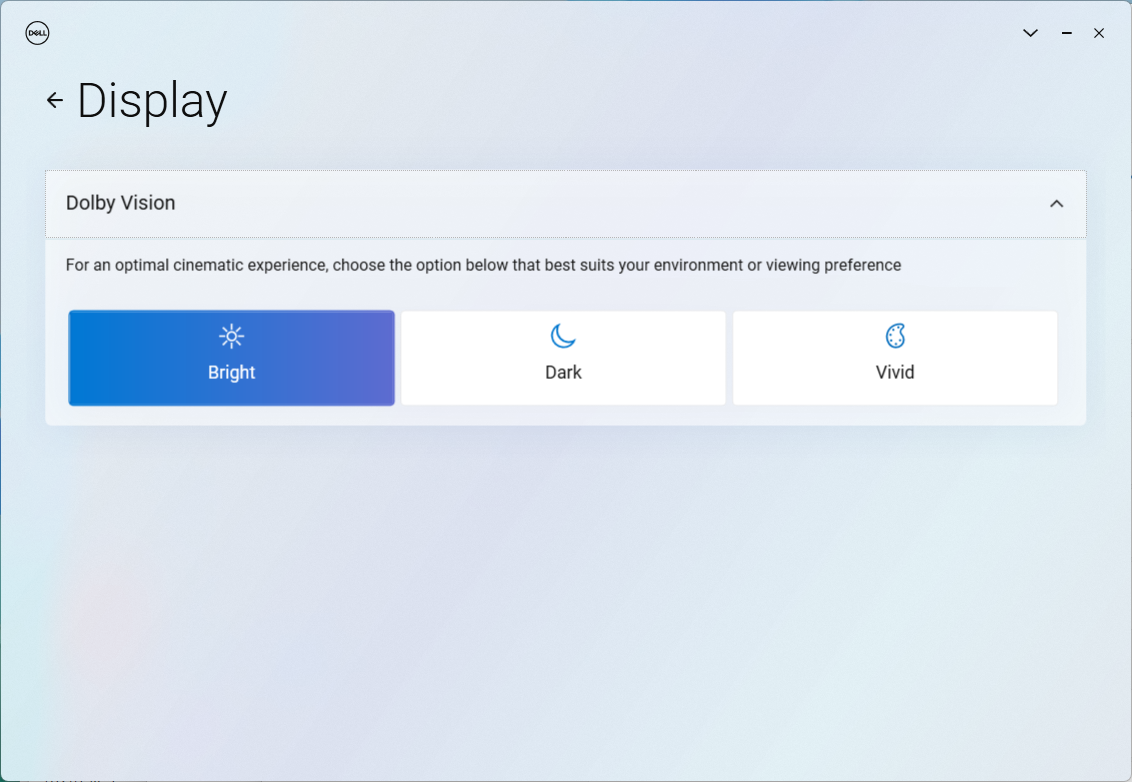
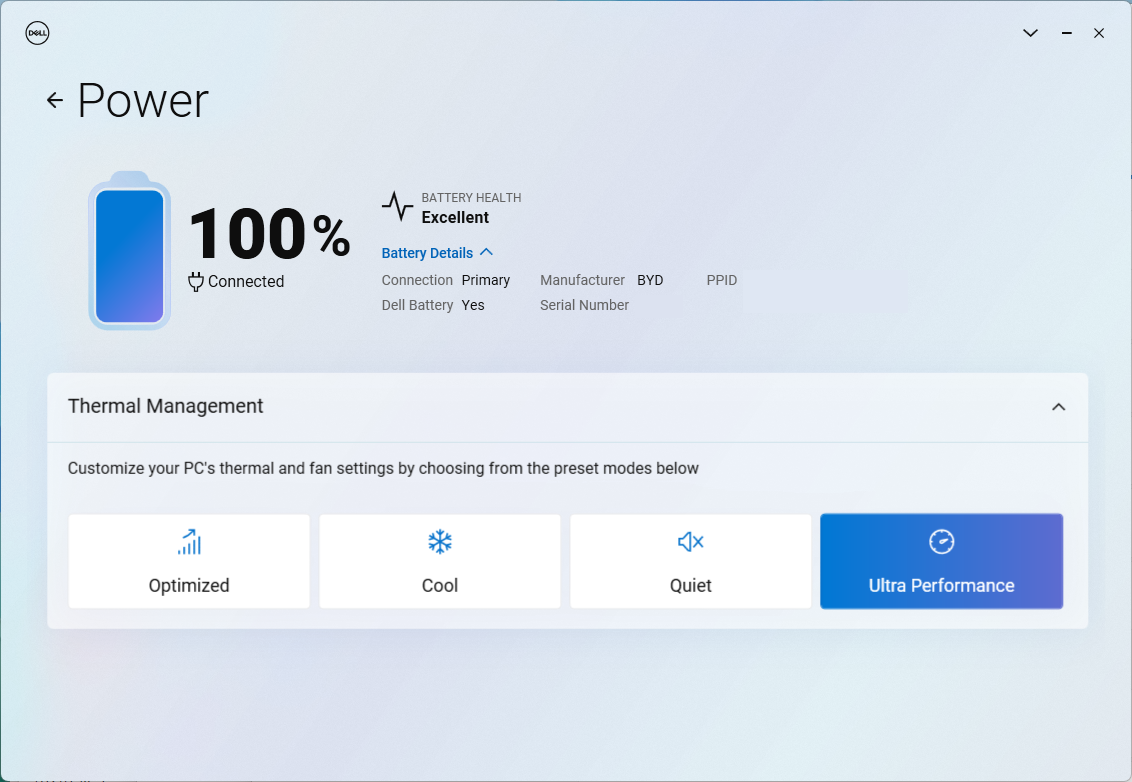
Przed uruchomieniem poniższych testów porównawczych ustawiliśmy system Windows i MyDell na tryb wydajności. MyDell został przeprojektowany w modelu Snapdragon, aby był prostszy w użyciu w porównaniu do tego samego oprogramowania w XPS 13 z procesorem Intel. Niektóre funkcje wcześniej dostępne w oprogramowaniu, takie jak wykrywanie obecności, zostały przeniesione do menu zasilania i baterii systemu Windows.
Procesor
Wydajność zależy w dużej mierze od tego, czy aplikacja jest natywna, czy emulowana. Przykładowo, procesor wyróżnia się w testach CineBench 2024 i GeekBench 6, ponieważ oba zostały zoptymalizowane pod kątem środowiska ARM. Nasz Snapdragon X Elite X1E-80-100 osiągnąłby lepsze wyniki niż Core Ultra 7 155H zarówno w operacjach wielowątkowych, jak i jednowątkowych w takich warunkach. W przeciwnym razie emulowane testy porównawcze cofają nasz procesor Snapdragon do poziomów wydajności, które są bardziej porównywalne ze starszym Core i5-1240P lub Core i7-1260P. Innymi słowy, procesor Qualcomm może być konkurencyjny w stosunku do Core Ultra 7 155H, jak lubi twierdzić producent, ale warunki i aplikacje muszą być odpowiednie, aby te korzyści się ujawniły.
Spójność wydajności może być również trudna do zmierzenia między procesorami Snapdragon. Dla naszego przykładu, nasz Snapdragon X Elite X1E-80-100 wygodnie przewyższyłby Snapdragon X Elite X1E-78-100 w EliteBook Ultra G1q 14 w CineBench 2024, ale odwrotna sytuacja ma miejsce w CineBench R23 i R15.
Cinebench R15 Multi Loop
Cinebench 2024: CPU Multi Core | CPU Single Core
Cinebench R23: Multi Core | Single Core
Cinebench R20: CPU (Multi Core) | CPU (Single Core)
Cinebench R15: CPU Multi 64Bit | CPU Single 64Bit
Blender: v2.79 BMW27 CPU
7-Zip 18.03: 7z b 4 | 7z b 4 -mmt1
Geekbench 6.4: Multi-Core | Single-Core
HWBOT x265 Benchmark v2.2: 4k Preset
LibreOffice : 20 Documents To PDF
R Benchmark 2.5: Overall mean
| CPU Performance Rating | |
| Dell XPS 14 2024 OLED | |
| Dell XPS 13 9340 Core Ultra 7 | |
| Dell XPS 13 Plus 9320 Core i7-1360P -4! | |
| Dell XPS 13 Plus 9320 i7-1280P OLED -4! | |
| Dell XPS 13 Plus 9320 4K -4! | |
| Microsoft Surface Laptop 7 13.8 Copilot+ | |
| Dell XPS 13 9345 | |
| Przeciętny Qualcomm Snapdragon X Elite X1E-80-100 | |
| HP EliteBook Ultra G1q 14 | |
| Medion SPRCHRGD 14 S1 Elite | |
| Dell XPS 13 Plus 9320 i5-1240p -4! | |
| Lenovo ThinkPad T14s Gen 6 21N10007GE | |
| Dell XPS 13 9315 2-in-1 Core i5-1230U -4! | |
| Dell XPS 13 9315, i5-1230U -8! | |
| Dell XPS 13 9310 Core i7 4K -4! | |
| Dell XPS 13 9310 OLED -4! | |
| Dell XPS 13 9310 2-in-1 -5! | |
| Dell XPS 13 9305 Core i5 FHD -6! | |
| Cinebench 2024 / CPU Multi Core | |
| Dell XPS 13 9345 | |
| Microsoft Surface Laptop 7 13.8 Copilot+ | |
| Przeciętny Qualcomm Snapdragon X Elite X1E-80-100 (621 - 927, n=7) | |
| Medion SPRCHRGD 14 S1 Elite | |
| HP EliteBook Ultra G1q 14 | |
| Lenovo ThinkPad T14s Gen 6 21N10007GE | |
| Dell XPS 13 9340 Core Ultra 7 | |
| Dell XPS 14 2024 OLED | |
| Cinebench 2024 / CPU Single Core | |
| Microsoft Surface Laptop 7 13.8 Copilot+ | |
| Przeciętny Qualcomm Snapdragon X Elite X1E-80-100 (122 - 123, n=7) | |
| Dell XPS 13 9345 | |
| Lenovo ThinkPad T14s Gen 6 21N10007GE | |
| Medion SPRCHRGD 14 S1 Elite | |
| HP EliteBook Ultra G1q 14 | |
| Dell XPS 14 2024 OLED | |
| Dell XPS 13 9340 Core Ultra 7 | |
| Cinebench R23 / Multi Core | |
| Dell XPS 14 2024 OLED | |
| Dell XPS 13 9340 Core Ultra 7 | |
| Dell XPS 13 Plus 9320 i7-1280P OLED | |
| Dell XPS 13 Plus 9320 Core i7-1360P | |
| HP EliteBook Ultra G1q 14 | |
| Microsoft Surface Laptop 7 13.8 Copilot+ | |
| Lenovo ThinkPad T14s Gen 6 21N10007GE | |
| Dell XPS 13 Plus 9320 4K | |
| Przeciętny Qualcomm Snapdragon X Elite X1E-80-100 (6772 - 10792, n=7) | |
| Dell XPS 13 Plus 9320 i5-1240p | |
| Dell XPS 13 9345 | |
| Medion SPRCHRGD 14 S1 Elite | |
| Dell XPS 13 9315 2-in-1 Core i5-1230U | |
| Dell XPS 13 9305 Core i5 FHD | |
| Dell XPS 13 9310 Core i7 4K | |
| Dell XPS 13 9310 OLED | |
| Dell XPS 13 9310 2-in-1 | |
| Dell XPS 13 9315, i5-1230U | |
| Cinebench R23 / Single Core | |
| Dell XPS 13 Plus 9320 Core i7-1360P | |
| Dell XPS 14 2024 OLED | |
| Dell XPS 13 9340 Core Ultra 7 | |
| Dell XPS 13 Plus 9320 4K | |
| Dell XPS 13 Plus 9320 i5-1240p | |
| Dell XPS 13 Plus 9320 i7-1280P OLED | |
| Dell XPS 13 9315 2-in-1 Core i5-1230U | |
| Dell XPS 13 9310 OLED | |
| Dell XPS 13 9310 Core i7 4K | |
| Dell XPS 13 9310 2-in-1 | |
| Microsoft Surface Laptop 7 13.8 Copilot+ | |
| Dell XPS 13 9315, i5-1230U | |
| Dell XPS 13 9305 Core i5 FHD | |
| Przeciętny Qualcomm Snapdragon X Elite X1E-80-100 (1273 - 1321, n=7) | |
| Dell XPS 13 9345 | |
| Medion SPRCHRGD 14 S1 Elite | |
| Lenovo ThinkPad T14s Gen 6 21N10007GE | |
| HP EliteBook Ultra G1q 14 | |
| Cinebench R20 / CPU (Multi Core) | |
| Dell XPS 14 2024 OLED | |
| Dell XPS 13 9340 Core Ultra 7 | |
| Dell XPS 13 Plus 9320 i7-1280P OLED | |
| Dell XPS 13 Plus 9320 Core i7-1360P | |
| HP EliteBook Ultra G1q 14 | |
| Dell XPS 13 Plus 9320 4K | |
| Microsoft Surface Laptop 7 13.8 Copilot+ | |
| Przeciętny Qualcomm Snapdragon X Elite X1E-80-100 (2539 - 4107, n=7) | |
| Lenovo ThinkPad T14s Gen 6 21N10007GE | |
| Dell XPS 13 Plus 9320 i5-1240p | |
| Dell XPS 13 9345 | |
| Medion SPRCHRGD 14 S1 Elite | |
| Dell XPS 13 9315 2-in-1 Core i5-1230U | |
| Dell XPS 13 9310 Core i7 4K | |
| Dell XPS 13 9310 OLED | |
| Dell XPS 13 9305 Core i5 FHD | |
| Dell XPS 13 9315, i5-1230U | |
| Dell XPS 13 9310 2-in-1 | |
| Cinebench R20 / CPU (Single Core) | |
| Dell XPS 13 Plus 9320 Core i7-1360P | |
| Dell XPS 14 2024 OLED | |
| Dell XPS 13 9340 Core Ultra 7 | |
| Dell XPS 13 Plus 9320 4K | |
| Dell XPS 13 Plus 9320 i7-1280P OLED | |
| Dell XPS 13 Plus 9320 i5-1240p | |
| Dell XPS 13 9315 2-in-1 Core i5-1230U | |
| Dell XPS 13 9310 Core i7 4K | |
| Dell XPS 13 9310 OLED | |
| Dell XPS 13 9305 Core i5 FHD | |
| Microsoft Surface Laptop 7 13.8 Copilot+ | |
| Przeciętny Qualcomm Snapdragon X Elite X1E-80-100 (470 - 495, n=7) | |
| Dell XPS 13 9310 2-in-1 | |
| Dell XPS 13 9345 | |
| Dell XPS 13 9315, i5-1230U | |
| Medion SPRCHRGD 14 S1 Elite | |
| Lenovo ThinkPad T14s Gen 6 21N10007GE | |
| HP EliteBook Ultra G1q 14 | |
| Cinebench R15 / CPU Multi 64Bit | |
| Dell XPS 14 2024 OLED | |
| Medion SPRCHRGD 14 S1 Elite | |
| Dell XPS 13 9340 Core Ultra 7 | |
| Lenovo ThinkPad T14s Gen 6 21N10007GE | |
| HP EliteBook Ultra G1q 14 | |
| Microsoft Surface Laptop 7 13.8 Copilot+ | |
| Dell XPS 13 Plus 9320 Core i7-1360P | |
| Przeciętny Qualcomm Snapdragon X Elite X1E-80-100 (1476 - 2249, n=7) | |
| Dell XPS 13 Plus 9320 i7-1280P OLED | |
| Dell XPS 13 Plus 9320 4K | |
| Dell XPS 13 Plus 9320 4K | |
| Dell XPS 13 9345 | |
| Dell XPS 13 Plus 9320 i5-1240p | |
| Dell XPS 13 9315 2-in-1 Core i5-1230U | |
| Dell XPS 13 9310 Core i7 4K | |
| Dell XPS 13 9310 OLED | |
| Dell XPS 13 9310 2-in-1 | |
| Dell XPS 13 9305 Core i5 FHD | |
| Dell XPS 13 9315, i5-1230U | |
| Cinebench R15 / CPU Single 64Bit | |
| Dell XPS 13 Plus 9320 Core i7-1360P | |
| Dell XPS 14 2024 OLED | |
| Dell XPS 13 9340 Core Ultra 7 | |
| Microsoft Surface Laptop 7 13.8 Copilot+ | |
| Dell XPS 13 Plus 9320 4K | |
| Przeciętny Qualcomm Snapdragon X Elite X1E-80-100 (230 - 248, n=7) | |
| Dell XPS 13 9345 | |
| Dell XPS 13 Plus 9320 i7-1280P OLED | |
| Dell XPS 13 Plus 9320 i5-1240p | |
| Dell XPS 13 9310 OLED | |
| Dell XPS 13 9315 2-in-1 Core i5-1230U | |
| Dell XPS 13 9310 Core i7 4K | |
| Lenovo ThinkPad T14s Gen 6 21N10007GE | |
| HP EliteBook Ultra G1q 14 | |
| Medion SPRCHRGD 14 S1 Elite | |
| Dell XPS 13 9315, i5-1230U | |
| Dell XPS 13 9310 2-in-1 | |
| Blender / v2.79 BMW27 CPU | |
| Dell XPS 13 9310 Core i7 4K | |
| Dell XPS 13 9310 2-in-1 | |
| Dell XPS 13 9310 OLED | |
| Dell XPS 13 9305 Core i5 FHD | |
| Dell XPS 13 9315 2-in-1 Core i5-1230U | |
| Lenovo ThinkPad T14s Gen 6 21N10007GE | |
| Medion SPRCHRGD 14 S1 Elite | |
| Przeciętny Qualcomm Snapdragon X Elite X1E-80-100 (331 - 510, n=7) | |
| Dell XPS 13 Plus 9320 i5-1240p | |
| HP EliteBook Ultra G1q 14 | |
| Dell XPS 13 9345 | |
| Microsoft Surface Laptop 7 13.8 Copilot+ | |
| Dell XPS 13 Plus 9320 4K | |
| Dell XPS 13 Plus 9320 Core i7-1360P | |
| Dell XPS 13 Plus 9320 i7-1280P OLED | |
| Dell XPS 14 2024 OLED | |
| Dell XPS 13 9340 Core Ultra 7 | |
| 7-Zip 18.03 / 7z b 4 | |
| Dell XPS 13 9340 Core Ultra 7 | |
| Dell XPS 14 2024 OLED | |
| Dell XPS 13 Plus 9320 i7-1280P OLED | |
| Dell XPS 13 Plus 9320 Core i7-1360P | |
| HP EliteBook Ultra G1q 14 | |
| Microsoft Surface Laptop 7 13.8 Copilot+ | |
| Medion SPRCHRGD 14 S1 Elite | |
| Dell XPS 13 Plus 9320 4K | |
| Przeciętny Qualcomm Snapdragon X Elite X1E-80-100 (34299 - 46146, n=7) | |
| Dell XPS 13 9345 | |
| Dell XPS 13 Plus 9320 i5-1240p | |
| Lenovo ThinkPad T14s Gen 6 21N10007GE | |
| Dell XPS 13 9315 2-in-1 Core i5-1230U | |
| Dell XPS 13 9310 2-in-1 | |
| Dell XPS 13 9305 Core i5 FHD | |
| Dell XPS 13 9310 Core i7 4K | |
| Dell XPS 13 9315, i5-1230U | |
| Dell XPS 13 9310 OLED | |
| 7-Zip 18.03 / 7z b 4 -mmt1 | |
| Dell XPS 13 Plus 9320 Core i7-1360P | |
| Dell XPS 13 9340 Core Ultra 7 | |
| Dell XPS 14 2024 OLED | |
| Microsoft Surface Laptop 7 13.8 Copilot+ | |
| Dell XPS 13 Plus 9320 4K | |
| Dell XPS 13 9345 | |
| Przeciętny Qualcomm Snapdragon X Elite X1E-80-100 (5242 - 5359, n=7) | |
| Dell XPS 13 9310 2-in-1 | |
| Dell XPS 13 9310 Core i7 4K | |
| Dell XPS 13 Plus 9320 i7-1280P OLED | |
| Dell XPS 13 9315 2-in-1 Core i5-1230U | |
| Dell XPS 13 Plus 9320 i5-1240p | |
| Medion SPRCHRGD 14 S1 Elite | |
| Dell XPS 13 9305 Core i5 FHD | |
| Lenovo ThinkPad T14s Gen 6 21N10007GE | |
| HP EliteBook Ultra G1q 14 | |
| Dell XPS 13 9315, i5-1230U | |
| Dell XPS 13 9310 OLED | |
| Geekbench 6.4 / Multi-Core | |
| Lenovo ThinkPad T14s Gen 6 21N10007GE | |
| Dell XPS 13 9345 | |
| Medion SPRCHRGD 14 S1 Elite | |
| Microsoft Surface Laptop 7 13.8 Copilot+ | |
| Dell XPS 14 2024 OLED | |
| HP EliteBook Ultra G1q 14 | |
| Przeciętny Qualcomm Snapdragon X Elite X1E-80-100 (7596 - 14998, n=9) | |
| Dell XPS 13 9340 Core Ultra 7 | |
| Geekbench 6.4 / Single-Core | |
| Dell XPS 13 9345 | |
| Microsoft Surface Laptop 7 13.8 Copilot+ | |
| Przeciętny Qualcomm Snapdragon X Elite X1E-80-100 (1896 - 2845, n=9) | |
| Lenovo ThinkPad T14s Gen 6 21N10007GE | |
| Medion SPRCHRGD 14 S1 Elite | |
| Dell XPS 14 2024 OLED | |
| Dell XPS 13 9340 Core Ultra 7 | |
| HP EliteBook Ultra G1q 14 | |
| HWBOT x265 Benchmark v2.2 / 4k Preset | |
| Dell XPS 14 2024 OLED | |
| Dell XPS 13 9340 Core Ultra 7 | |
| Dell XPS 13 Plus 9320 i7-1280P OLED | |
| Dell XPS 13 Plus 9320 Core i7-1360P | |
| Dell XPS 13 Plus 9320 4K | |
| Dell XPS 13 Plus 9320 i5-1240p | |
| Dell XPS 13 9315 2-in-1 Core i5-1230U | |
| Microsoft Surface Laptop 7 13.8 Copilot+ | |
| Dell XPS 13 9345 | |
| Przeciętny Qualcomm Snapdragon X Elite X1E-80-100 (4.74 - 7.53, n=7) | |
| HP EliteBook Ultra G1q 14 | |
| Medion SPRCHRGD 14 S1 Elite | |
| Lenovo ThinkPad T14s Gen 6 21N10007GE | |
| Dell XPS 13 9310 OLED | |
| Dell XPS 13 9310 2-in-1 | |
| Dell XPS 13 9310 Core i7 4K | |
| LibreOffice / 20 Documents To PDF | |
| Microsoft Surface Laptop 7 13.8 Copilot+ | |
| Dell XPS 13 Plus 9320 i5-1240p | |
| HP EliteBook Ultra G1q 14 | |
| Przeciętny Qualcomm Snapdragon X Elite X1E-80-100 (50.9 - 98.5, n=7) | |
| Dell XPS 13 9305 Core i5 FHD | |
| Lenovo ThinkPad T14s Gen 6 21N10007GE | |
| Medion SPRCHRGD 14 S1 Elite | |
| Dell XPS 13 9345 | |
| Dell XPS 13 9315 2-in-1 Core i5-1230U | |
| Dell XPS 14 2024 OLED | |
| Dell XPS 13 Plus 9320 i7-1280P OLED | |
| Dell XPS 13 9340 Core Ultra 7 | |
| Dell XPS 13 9310 Core i7 4K | |
| Dell XPS 13 Plus 9320 Core i7-1360P | |
| Dell XPS 13 Plus 9320 4K | |
| Dell XPS 13 9310 OLED | |
| R Benchmark 2.5 / Overall mean | |
| HP EliteBook Ultra G1q 14 | |
| Medion SPRCHRGD 14 S1 Elite | |
| Lenovo ThinkPad T14s Gen 6 21N10007GE | |
| Dell XPS 13 9345 | |
| Przeciętny Qualcomm Snapdragon X Elite X1E-80-100 (0.63 - 0.67, n=7) | |
| Dell XPS 13 9305 Core i5 FHD | |
| Microsoft Surface Laptop 7 13.8 Copilot+ | |
| Dell XPS 13 9310 2-in-1 | |
| Dell XPS 13 9310 Core i7 4K | |
| Dell XPS 13 9310 OLED | |
| Dell XPS 13 9315 2-in-1 Core i5-1230U | |
| Dell XPS 13 Plus 9320 i5-1240p | |
| Dell XPS 13 Plus 9320 i7-1280P OLED | |
| Dell XPS 13 Plus 9320 4K | |
| Dell XPS 13 9340 Core Ultra 7 | |
| Dell XPS 14 2024 OLED | |
| Dell XPS 13 Plus 9320 Core i7-1360P | |
Cinebench 2024: CPU Multi Core | CPU Single Core
Cinebench R23: Multi Core | Single Core
Cinebench R20: CPU (Multi Core) | CPU (Single Core)
Cinebench R15: CPU Multi 64Bit | CPU Single 64Bit
Blender: v2.79 BMW27 CPU
7-Zip 18.03: 7z b 4 | 7z b 4 -mmt1
Geekbench 6.4: Multi-Core | Single-Core
HWBOT x265 Benchmark v2.2: 4k Preset
LibreOffice : 20 Documents To PDF
R Benchmark 2.5: Overall mean
* ... im mniej tym lepiej
AIDA64: FP32 Ray-Trace | FPU Julia | CPU SHA3 | CPU Queen | FPU SinJulia | FPU Mandel | CPU AES | CPU ZLib | FP64 Ray-Trace | CPU PhotoWorxx
| Performance Rating | |
| Dell XPS 13 9340 Core Ultra 7 | |
| Lenovo ThinkBook 13x G4 21KR0008GE | |
| Microsoft Surface Laptop 7 13.8 Copilot+ | |
| Dell XPS 13 9345 | |
| HP EliteBook Ultra G1q 14 | |
| Przeciętny Qualcomm Snapdragon X Elite X1E-80-100 | |
| Asus ZenBook S13 OLED UX5304 | |
| AIDA64 / FP32 Ray-Trace | |
| Dell XPS 13 9340 Core Ultra 7 | |
| Lenovo ThinkBook 13x G4 21KR0008GE | |
| HP EliteBook Ultra G1q 14 | |
| Microsoft Surface Laptop 7 13.8 Copilot+ | |
| Dell XPS 13 9345 | |
| Przeciętny Qualcomm Snapdragon X Elite X1E-80-100 (2184 - 7469, n=7) | |
| Asus ZenBook S13 OLED UX5304 | |
| AIDA64 / FPU Julia | |
| Dell XPS 13 9340 Core Ultra 7 | |
| Lenovo ThinkBook 13x G4 21KR0008GE | |
| Asus ZenBook S13 OLED UX5304 | |
| Microsoft Surface Laptop 7 13.8 Copilot+ | |
| Dell XPS 13 9345 | |
| HP EliteBook Ultra G1q 14 | |
| Przeciętny Qualcomm Snapdragon X Elite X1E-80-100 (5687 - 26391, n=7) | |
| AIDA64 / CPU SHA3 | |
| HP EliteBook Ultra G1q 14 | |
| Microsoft Surface Laptop 7 13.8 Copilot+ | |
| Dell XPS 13 9340 Core Ultra 7 | |
| Dell XPS 13 9345 | |
| Przeciętny Qualcomm Snapdragon X Elite X1E-80-100 (2607 - 3122, n=7) | |
| Lenovo ThinkBook 13x G4 21KR0008GE | |
| Asus ZenBook S13 OLED UX5304 | |
| AIDA64 / CPU Queen | |
| Lenovo ThinkBook 13x G4 21KR0008GE | |
| Dell XPS 13 9340 Core Ultra 7 | |
| Microsoft Surface Laptop 7 13.8 Copilot+ | |
| Przeciętny Qualcomm Snapdragon X Elite X1E-80-100 (67219 - 69762, n=7) | |
| Dell XPS 13 9345 | |
| HP EliteBook Ultra G1q 14 | |
| Asus ZenBook S13 OLED UX5304 | |
| AIDA64 / FPU SinJulia | |
| Dell XPS 13 9340 Core Ultra 7 | |
| Lenovo ThinkBook 13x G4 21KR0008GE | |
| Asus ZenBook S13 OLED UX5304 | |
| Microsoft Surface Laptop 7 13.8 Copilot+ | |
| Dell XPS 13 9345 | |
| Przeciętny Qualcomm Snapdragon X Elite X1E-80-100 (1521 - 2357, n=7) | |
| HP EliteBook Ultra G1q 14 | |
| AIDA64 / FPU Mandel | |
| Dell XPS 13 9340 Core Ultra 7 | |
| Lenovo ThinkBook 13x G4 21KR0008GE | |
| Asus ZenBook S13 OLED UX5304 | |
| HP EliteBook Ultra G1q 14 | |
| Microsoft Surface Laptop 7 13.8 Copilot+ | |
| Przeciętny Qualcomm Snapdragon X Elite X1E-80-100 (10117 - 15669, n=7) | |
| Dell XPS 13 9345 | |
| AIDA64 / CPU AES | |
| HP EliteBook Ultra G1q 14 | |
| Dell XPS 13 9340 Core Ultra 7 | |
| Microsoft Surface Laptop 7 13.8 Copilot+ | |
| Przeciętny Qualcomm Snapdragon X Elite X1E-80-100 (39956 - 71089, n=7) | |
| Dell XPS 13 9345 | |
| Lenovo ThinkBook 13x G4 21KR0008GE | |
| Asus ZenBook S13 OLED UX5304 | |
| AIDA64 / CPU ZLib | |
| Dell XPS 13 9340 Core Ultra 7 | |
| HP EliteBook Ultra G1q 14 | |
| Microsoft Surface Laptop 7 13.8 Copilot+ | |
| Dell XPS 13 9345 | |
| Przeciętny Qualcomm Snapdragon X Elite X1E-80-100 (398 - 802, n=7) | |
| Lenovo ThinkBook 13x G4 21KR0008GE | |
| Asus ZenBook S13 OLED UX5304 | |
| AIDA64 / FP64 Ray-Trace | |
| Dell XPS 13 9340 Core Ultra 7 | |
| Lenovo ThinkBook 13x G4 21KR0008GE | |
| Microsoft Surface Laptop 7 13.8 Copilot+ | |
| Dell XPS 13 9345 | |
| Przeciętny Qualcomm Snapdragon X Elite X1E-80-100 (2581 - 4044, n=7) | |
| Asus ZenBook S13 OLED UX5304 | |
| HP EliteBook Ultra G1q 14 | |
| AIDA64 / CPU PhotoWorxx | |
| Dell XPS 13 9340 Core Ultra 7 | |
| Lenovo ThinkBook 13x G4 21KR0008GE | |
| Asus ZenBook S13 OLED UX5304 | |
| Microsoft Surface Laptop 7 13.8 Copilot+ | |
| Dell XPS 13 9345 | |
| Przeciętny Qualcomm Snapdragon X Elite X1E-80-100 (28474 - 38707, n=7) | |
| HP EliteBook Ultra G1q 14 | |
Wydajność systemu
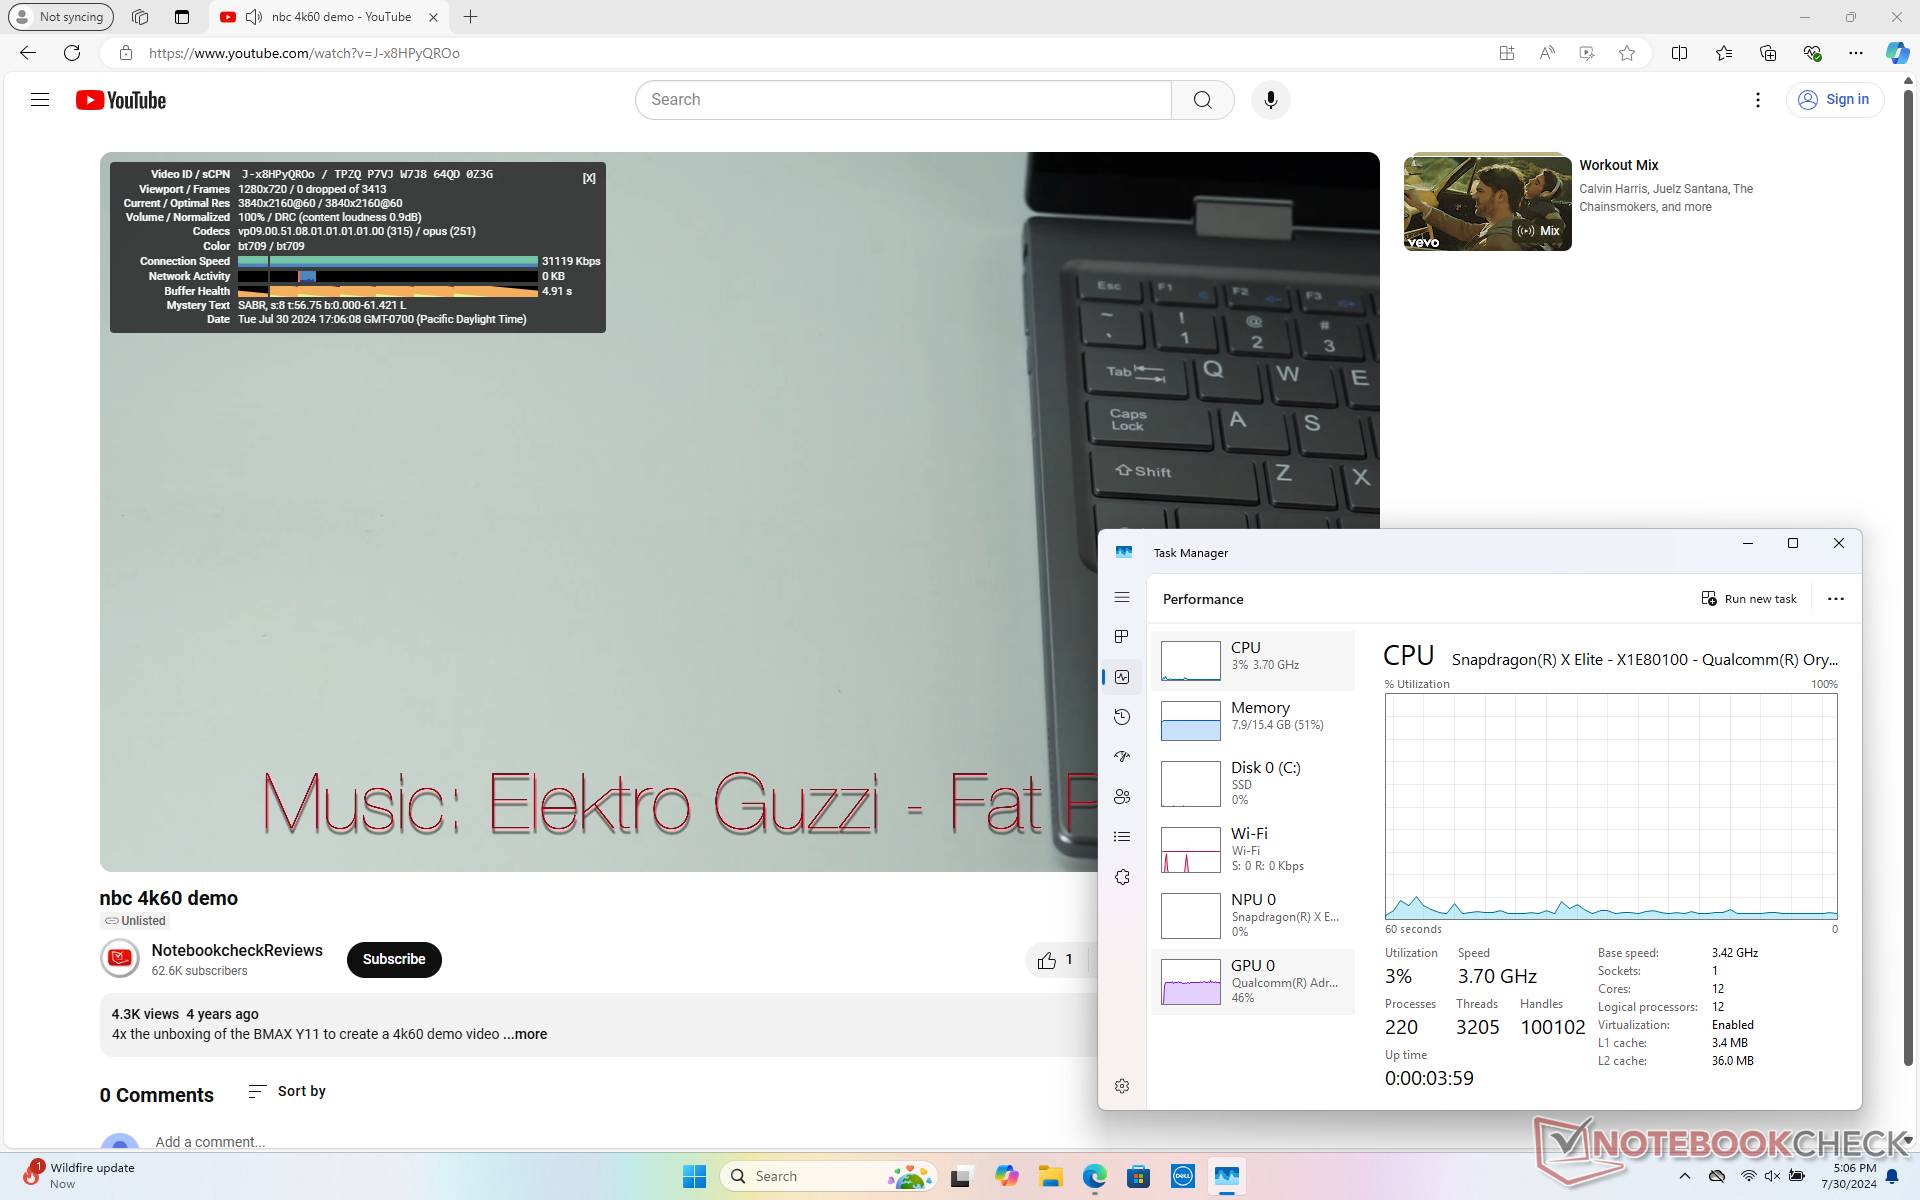
WebXPRT i Kraken, które działają natywnie w przeglądarce Edge zoptymalizowanej pod kątem ARM, plasują nasz Qualcomm XPS przed Intel XPS z przyzwoitymi marginesami.
WebXPRT 3: Overall
WebXPRT 4: Overall
Mozilla Kraken 1.1: Total
| CrossMark / Overall | |
| Dell XPS 13 9340 Core Ultra 7 | |
| Asus ZenBook S13 OLED UX5304 | |
| Lenovo ThinkBook 13x G4 21KR0008GE | |
| Microsoft Surface Laptop 7 13.8 Copilot+ | |
| Przeciętny Qualcomm Snapdragon X Elite X1E-80-100, Qualcomm SD X Adreno X1-85 3.8 TFLOPS (1356 - 1443, n=7) | |
| Dell XPS 13 9345 | |
| HP EliteBook Ultra G1q 14 | |
| CrossMark / Productivity | |
| Dell XPS 13 9340 Core Ultra 7 | |
| Asus ZenBook S13 OLED UX5304 | |
| Lenovo ThinkBook 13x G4 21KR0008GE | |
| Microsoft Surface Laptop 7 13.8 Copilot+ | |
| Przeciętny Qualcomm Snapdragon X Elite X1E-80-100, Qualcomm SD X Adreno X1-85 3.8 TFLOPS (1271 - 1375, n=7) | |
| Dell XPS 13 9345 | |
| HP EliteBook Ultra G1q 14 | |
| CrossMark / Creativity | |
| Dell XPS 13 9340 Core Ultra 7 | |
| Lenovo ThinkBook 13x G4 21KR0008GE | |
| Asus ZenBook S13 OLED UX5304 | |
| Microsoft Surface Laptop 7 13.8 Copilot+ | |
| Przeciętny Qualcomm Snapdragon X Elite X1E-80-100, Qualcomm SD X Adreno X1-85 3.8 TFLOPS (1402 - 1537, n=7) | |
| Dell XPS 13 9345 | |
| HP EliteBook Ultra G1q 14 | |
| CrossMark / Responsiveness | |
| Dell XPS 13 9340 Core Ultra 7 | |
| Asus ZenBook S13 OLED UX5304 | |
| Microsoft Surface Laptop 7 13.8 Copilot+ | |
| Przeciętny Qualcomm Snapdragon X Elite X1E-80-100, Qualcomm SD X Adreno X1-85 3.8 TFLOPS (1237 - 1401, n=7) | |
| Lenovo ThinkBook 13x G4 21KR0008GE | |
| Dell XPS 13 9345 | |
| HP EliteBook Ultra G1q 14 | |
| WebXPRT 3 / Overall | |
| Przeciętny Qualcomm Snapdragon X Elite X1E-80-100, Qualcomm SD X Adreno X1-85 3.8 TFLOPS (430 - 455, n=7) | |
| Microsoft Surface Laptop 7 13.8 Copilot+ | |
| Dell XPS 13 9345 | |
| HP EliteBook Ultra G1q 14 | |
| Asus ZenBook S13 OLED UX5304 | |
| Dell XPS 13 9340 Core Ultra 7 | |
| Lenovo ThinkBook 13x G4 21KR0008GE | |
| WebXPRT 4 / Overall | |
| Dell XPS 13 9345 | |
| Przeciętny Qualcomm Snapdragon X Elite X1E-80-100, Qualcomm SD X Adreno X1-85 3.8 TFLOPS (295 - 324, n=7) | |
| Microsoft Surface Laptop 7 13.8 Copilot+ | |
| HP EliteBook Ultra G1q 14 | |
| Dell XPS 13 9340 Core Ultra 7 | |
| Asus ZenBook S13 OLED UX5304 | |
| Lenovo ThinkBook 13x G4 21KR0008GE | |
| Mozilla Kraken 1.1 / Total | |
| Lenovo ThinkBook 13x G4 21KR0008GE | |
| Dell XPS 13 9340 Core Ultra 7 | |
| Asus ZenBook S13 OLED UX5304 | |
| HP EliteBook Ultra G1q 14 | |
| Dell XPS 13 9345 | |
| Przeciętny Qualcomm Snapdragon X Elite X1E-80-100, Qualcomm SD X Adreno X1-85 3.8 TFLOPS (391 - 422, n=7) | |
| Microsoft Surface Laptop 7 13.8 Copilot+ | |
* ... im mniej tym lepiej
| AIDA64 / Memory Copy | |
| Dell XPS 13 9340 Core Ultra 7 | |
| Lenovo ThinkBook 13x G4 21KR0008GE | |
| Dell XPS 13 9345 | |
| Microsoft Surface Laptop 7 13.8 Copilot+ | |
| Asus ZenBook S13 OLED UX5304 | |
| Przeciętny Qualcomm Snapdragon X Elite X1E-80-100 (44795 - 63495, n=7) | |
| HP EliteBook Ultra G1q 14 | |
| AIDA64 / Memory Read | |
| Dell XPS 13 9345 | |
| Microsoft Surface Laptop 7 13.8 Copilot+ | |
| Przeciętny Qualcomm Snapdragon X Elite X1E-80-100 (58855 - 125604, n=7) | |
| Dell XPS 13 9340 Core Ultra 7 | |
| Lenovo ThinkBook 13x G4 21KR0008GE | |
| HP EliteBook Ultra G1q 14 | |
| Asus ZenBook S13 OLED UX5304 | |
| AIDA64 / Memory Write | |
| Dell XPS 13 9340 Core Ultra 7 | |
| Asus ZenBook S13 OLED UX5304 | |
| Lenovo ThinkBook 13x G4 21KR0008GE | |
| Dell XPS 13 9345 | |
| Microsoft Surface Laptop 7 13.8 Copilot+ | |
| Przeciętny Qualcomm Snapdragon X Elite X1E-80-100 (37270 - 45265, n=7) | |
| HP EliteBook Ultra G1q 14 | |
| AIDA64 / Memory Latency | |
| Lenovo ThinkBook 13x G4 21KR0008GE | |
| Dell XPS 13 9340 Core Ultra 7 | |
| Asus ZenBook S13 OLED UX5304 | |
| Przeciętny Qualcomm Snapdragon X Elite X1E-80-100 (7.4 - 8.8, n=5) | |
| HP EliteBook Ultra G1q 14 | |
| Dell XPS 13 9345 | |
| Microsoft Surface Laptop 7 13.8 Copilot+ | |
* ... im mniej tym lepiej
Urządzenia pamięci masowej
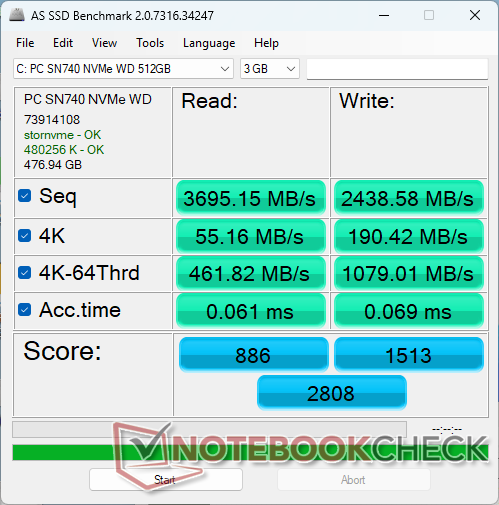
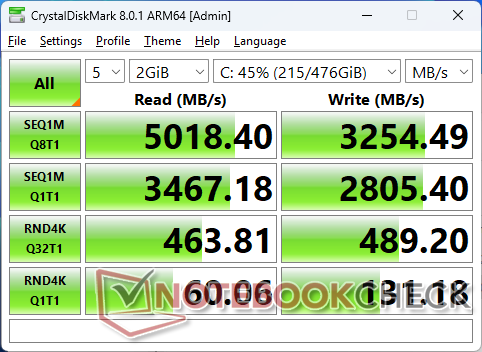
Dell pozyskuje swoje dyski SSD od wielu różnych producentów, więc trudno jest wiedzieć, jaki dysk otrzymają Państwo przed zakupem. Na przykład, mieliśmy dyski od Micron, Samsung, WD, Toshiba i SK Hynix w ponad 10 różnych wewnętrznych jednostkach XPS 13. Nasza konkretna jednostka Qualcomm jest dostarczana z dyskiem WD SN740 średniej klasy, oferującym stabilne prędkości transferu do 5000 MB/s. Pomimo niewielkiej długości 42 mm nie zaobserwowaliśmy dławienia, co jest prawdopodobnie częściowo spowodowane dołączonym rozpraszaczem ciepła SSD.

* ... im mniej tym lepiej
Disk Throttling: DiskSpd Read Loop, Queue Depth 8
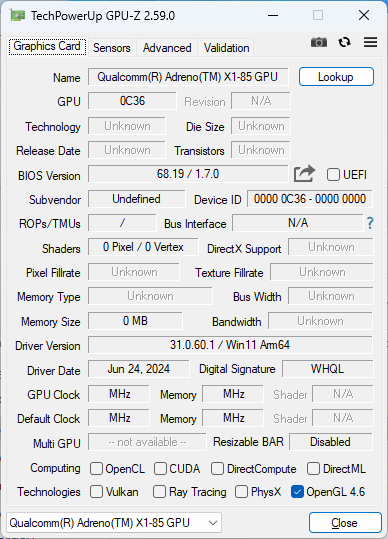
Wydajność GPU
Wydajność graficzna według emulowanego 3DMark jest na równi z Iris Xe 96 EUs ale daleko za Arc 8 lub Radeon 680M/780M nawet o 20 do 40 procent. Wyniki są jednak stale lepsze niż w przypadku HP EliteBook Ultra G1q 14 nawet jeśli delty są średnio niewielkie.
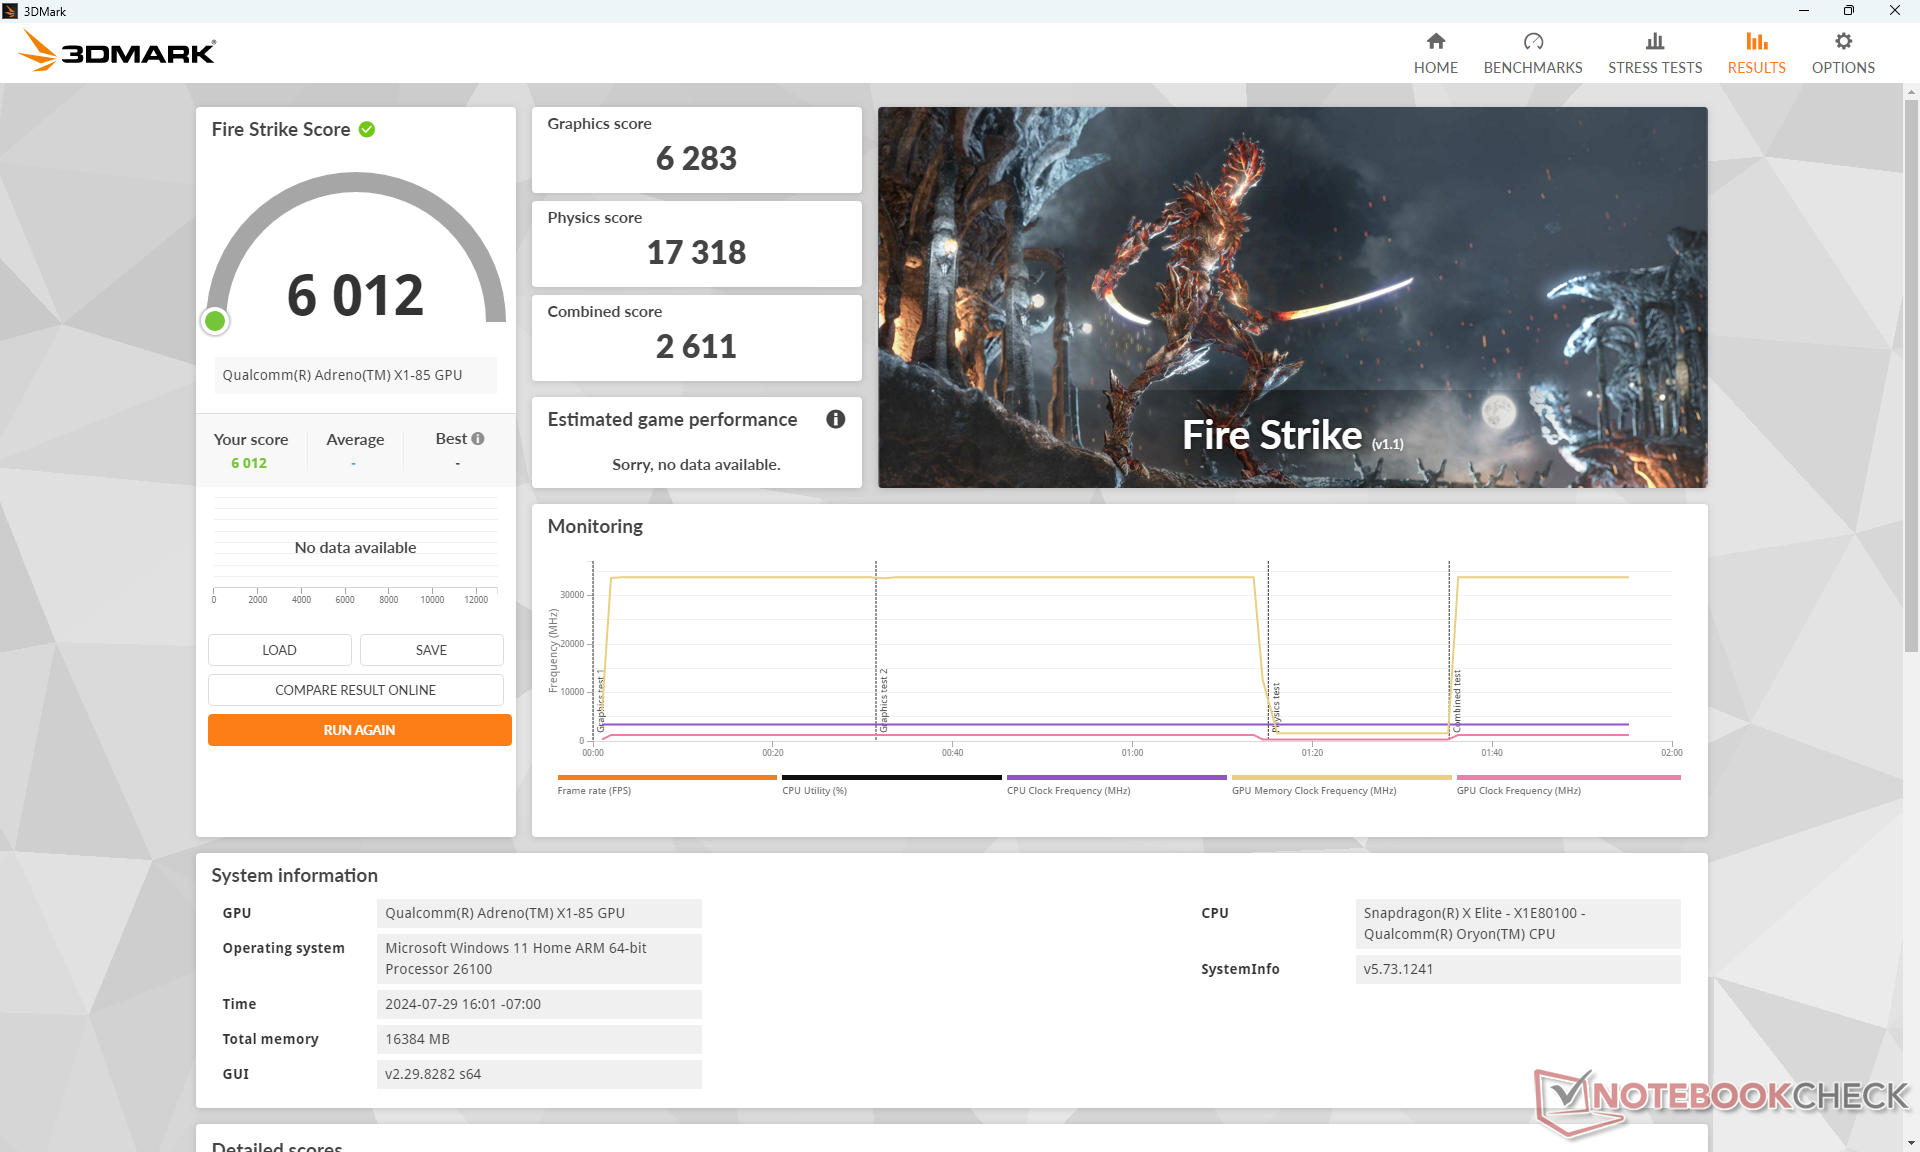
| Profil zasilania | Wynik grafiki | Wynik fizyki | Łączny wynik |
| Tryb wydajności | 6283 | 17318 | 2611 |
| Tryb zrównoważony | 6209 | 18348 | 2643 |
| Zasilanie bateryjne | 6287 | 18156 | 2687 |
Nie ma znaczącego spadku wydajności podczas przełączania między trybami Wydajności, Zrównoważonym lub zasilania bateryjnego, czego przykładem jest nasza tabela wyników Fire Strike powyżej.
| 3DMark Performance Rating - Percent | |
| Dell XPS 14 2024 OLED -1! | |
| Dell XPS 13 9340 Core Ultra 7 -1! | |
| Dell XPS 13 9345 | |
| Przeciętny Qualcomm SD X Adreno X1-85 3.8 TFLOPS | |
| Dell XPS 13 Plus 9320 i7-1280P OLED | |
| Dell XPS 13 9310 2-in-1 | |
| HP EliteBook Ultra G1q 14 | |
| Dell XPS 13 Plus 9320 4K | |
| Dell XPS 13 9310 Core i7 4K | |
| Dell XPS 13 Plus 9320 Core i7-1360P -1! | |
| Medion SPRCHRGD 14 S1 Elite -1! | |
| Dell XPS 13 9310 OLED | |
| Microsoft Surface Laptop 7 13.8 Copilot+ -1! | |
| Lenovo ThinkPad T14s Gen 6 21N10007GE -2! | |
| Dell XPS 13 9305 Core i5 FHD -1! | |
| Dell XPS 13 Plus 9320 i5-1240p | |
| Dell XPS 13 9315, i5-1230U | |
| Dell XPS 13 9315 2-in-1 Core i5-1230U | |
| 3DMark 11 - 1280x720 Performance GPU | |
| Dell XPS 14 2024 OLED | |
| Dell XPS 13 9340 Core Ultra 7 | |
| Dell XPS 13 Plus 9320 i7-1280P OLED | |
| Dell XPS 13 Plus 9320 4K | |
| Dell XPS 13 Plus 9320 Core i7-1360P | |
| Dell XPS 13 9310 OLED | |
| Dell XPS 13 9310 2-in-1 | |
| Medion SPRCHRGD 14 S1 Elite | |
| Dell XPS 13 9345 | |
| Microsoft Surface Laptop 7 13.8 Copilot+ | |
| Dell XPS 13 9305 Core i5 FHD | |
| Przeciętny Qualcomm SD X Adreno X1-85 3.8 TFLOPS (3163 - 6515, n=13) | |
| Dell XPS 13 9310 Core i7 4K | |
| Dell XPS 13 Plus 9320 i5-1240p | |
| HP EliteBook Ultra G1q 14 | |
| Dell XPS 13 9315, i5-1230U | |
| Dell XPS 13 9315 2-in-1 Core i5-1230U | |
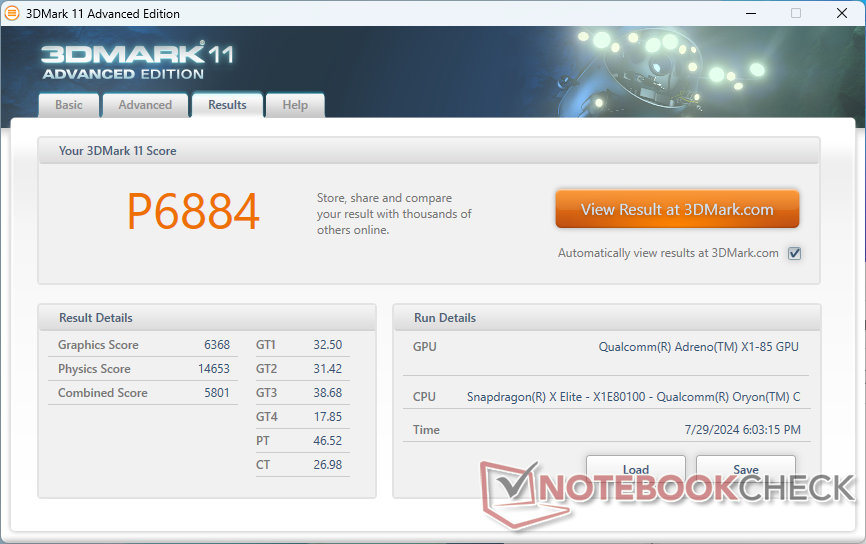
| 3DMark 11 Performance | 6884 pkt. | |
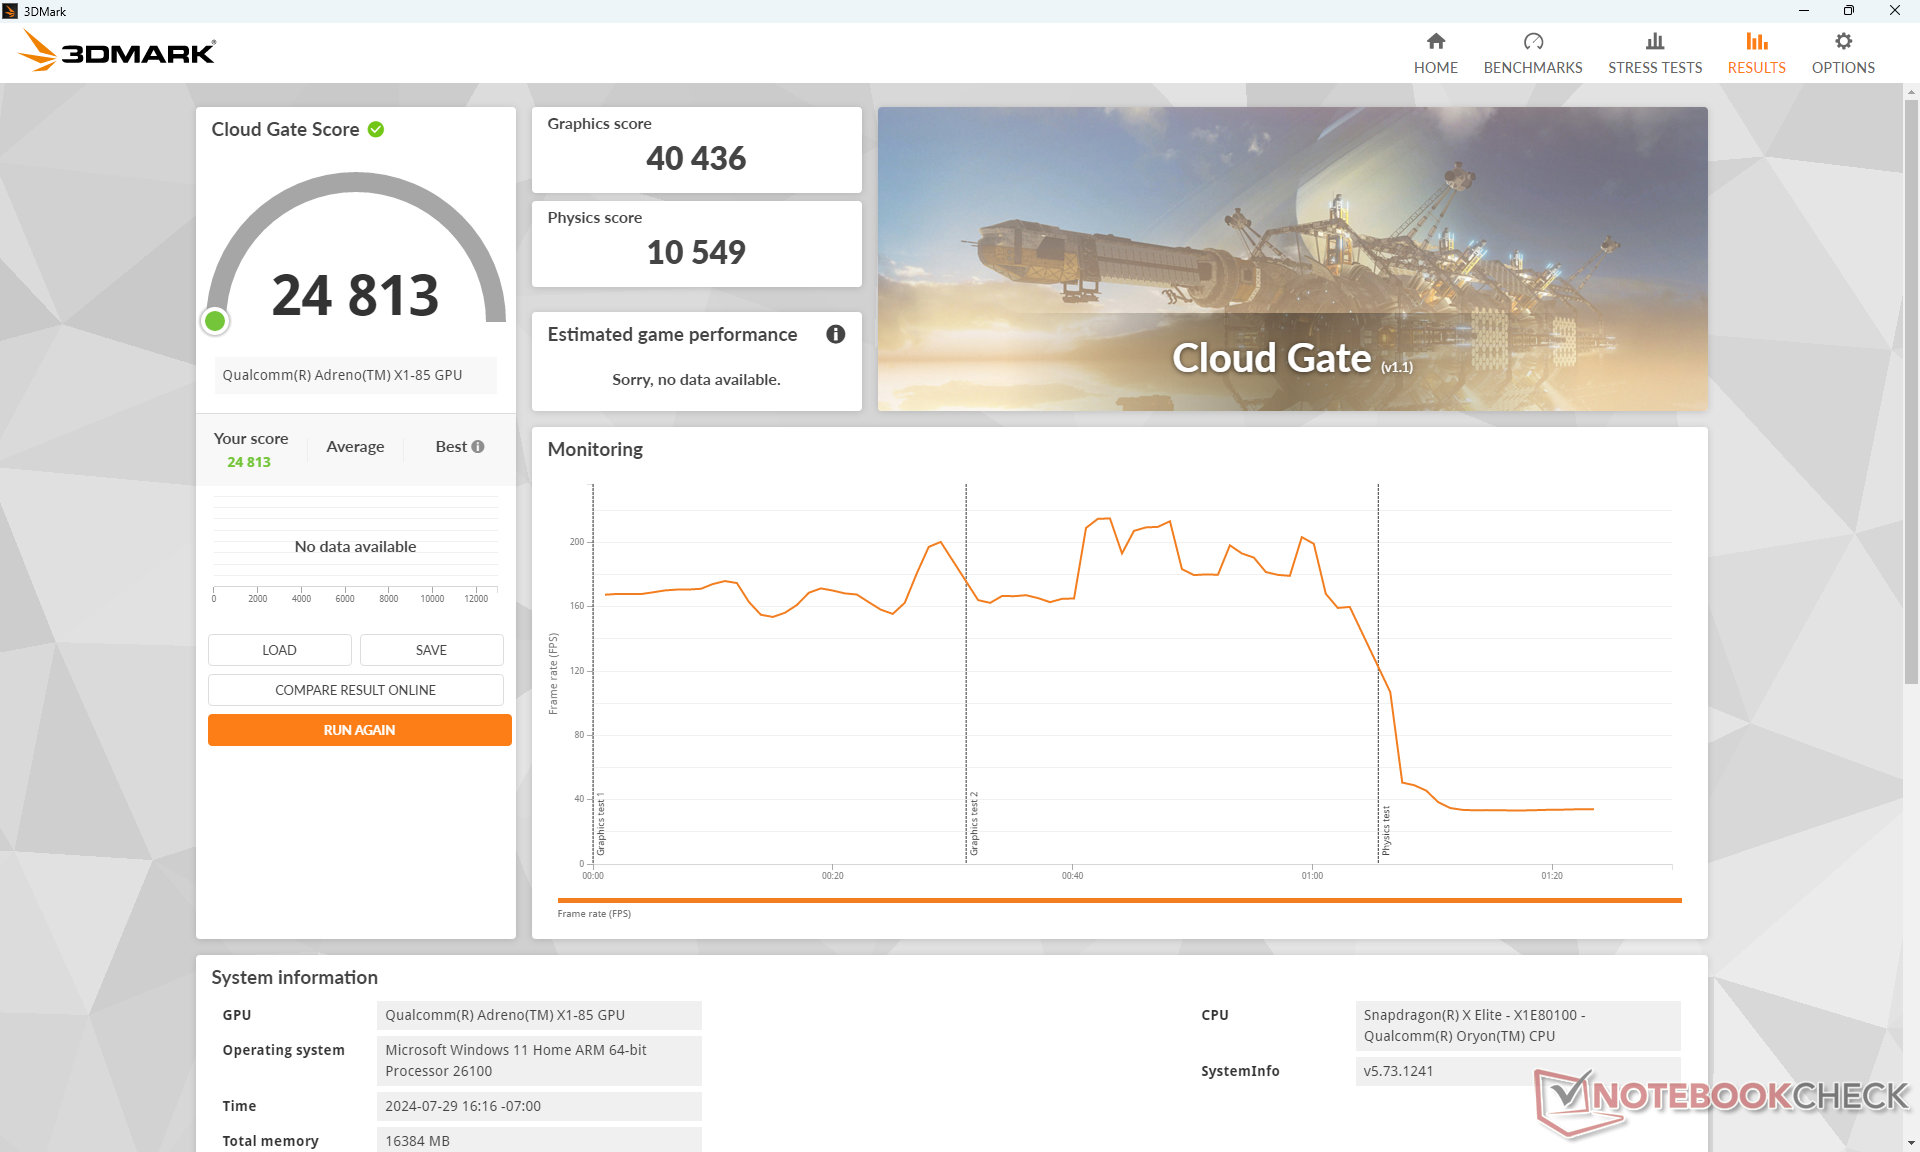
| 3DMark Cloud Gate Standard Score | 24813 pkt. | |
| 3DMark Fire Strike Score | 6012 pkt. | |
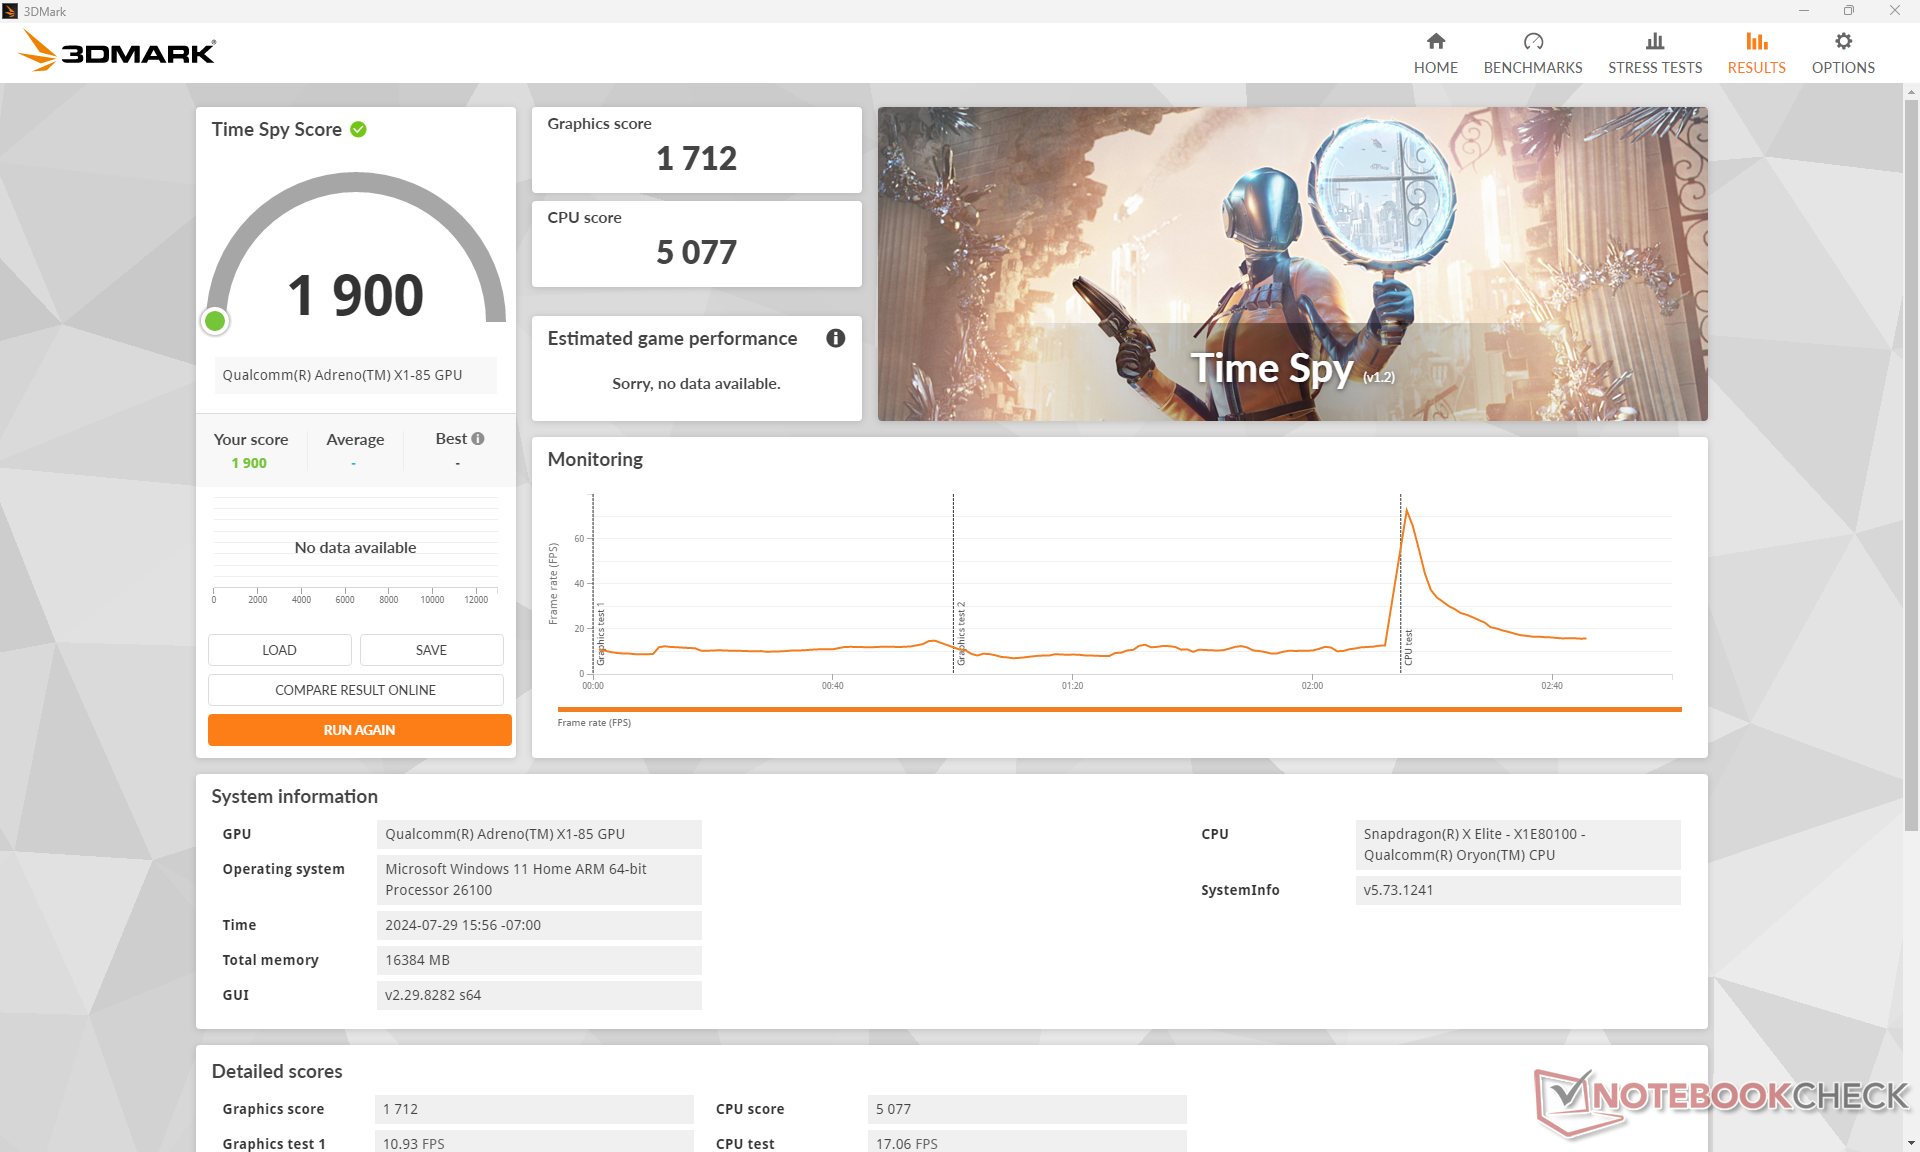
| 3DMark Time Spy Score | 1900 pkt. | |
Pomoc | ||
| Blender | |
| v3.3 Classroom OPTIX/RTX | |
| Dell XPS 14 2024 OLED | |
| v3.3 Classroom CUDA | |
| Dell XPS 14 2024 OLED | |
| v3.3 Classroom CPU | |
| Dell XPS 13 9315 2-in-1 Core i5-1230U | |
| HP EliteBook Ultra G1q 14 | |
| Przeciętny Qualcomm SD X Adreno X1-85 3.8 TFLOPS (545 - 899, n=12) | |
| Medion SPRCHRGD 14 S1 Elite | |
| Microsoft Surface Laptop 7 13.8 Copilot+ | |
| Dell XPS 13 9345 | |
| Dell XPS 13 Plus 9320 4K | |
| Dell XPS 13 Plus 9320 i7-1280P OLED | |
| Dell XPS 13 Plus 9320 Core i7-1360P | |
| Dell XPS 13 9340 Core Ultra 7 | |
| Dell XPS 14 2024 OLED | |
* ... im mniej tym lepiej
Wydajność w grach
Nasze nieco wyższe wyniki 3DMark w porównaniu do EliteBook Ultra G1q 14 przekładają się na nieco szybszą wydajność w testowanych tytułach poniżej. Co ciekawe, niektóre tytuły działały na naszym urządzeniu Dell, ale nie na naszym urządzeniu HP i odwrotnie. Na przykład, Far Cry 5 działał na naszym Dellu, ale nie na HP, a Baldur's Gate 3 działał na naszym HP, ale nie na Dellu, bez względu na tryb DirectX. Rozbieżność ta może być spowodowana różnicami w sterownikach między tymi dwoma modelami, ale pokazuje to również, że należy wykonać więcej pracy w odniesieniu do sterownika graficznego.
| Performance Rating - Percent | |
| Lenovo ThinkBook 13x G4 21KR0008GE -2! | |
| Dell XPS 13 9340 Core Ultra 7 -2! | |
| Dell XPS 13 9345 | |
| Microsoft Surface Laptop 7 13.8 Copilot+ -2! | |
| HP EliteBook Ultra G1q 14 -1! | |
| Asus ZenBook S13 OLED UX5304 -1! | |
| The Witcher 3 - 1920x1080 Ultra Graphics & Postprocessing (HBAO+) | |
| Lenovo ThinkBook 13x G4 21KR0008GE | |
| Dell XPS 13 9340 Core Ultra 7 | |
| Dell XPS 13 9345 | |
| HP EliteBook Ultra G1q 14 | |
| Asus ZenBook S13 OLED UX5304 | |
| GTA V - 1920x1080 Highest Settings possible AA:4xMSAA + FX AF:16x | |
| Microsoft Surface Laptop 7 13.8 Copilot+ | |
| Dell XPS 13 9345 | |
| Lenovo ThinkBook 13x G4 21KR0008GE | |
| Dell XPS 13 9340 Core Ultra 7 | |
| Asus ZenBook S13 OLED UX5304 | |
| Final Fantasy XV Benchmark - 1920x1080 High Quality | |
| Dell XPS 13 9340 Core Ultra 7 | |
| Lenovo ThinkBook 13x G4 21KR0008GE | |
| Microsoft Surface Laptop 7 13.8 Copilot+ | |
| Dell XPS 13 9345 | |
| Asus ZenBook S13 OLED UX5304 | |
| HP EliteBook Ultra G1q 14 | |
| Strange Brigade - 1920x1080 ultra AA:ultra AF:16 | |
| Lenovo ThinkBook 13x G4 21KR0008GE | |
| Dell XPS 13 9340 Core Ultra 7 | |
| Microsoft Surface Laptop 7 13.8 Copilot+ | |
| Dell XPS 13 9345 | |
| HP EliteBook Ultra G1q 14 | |
| Asus ZenBook S13 OLED UX5304 | |
| Dota 2 Reborn - 1920x1080 ultra (3/3) best looking | |
| Dell XPS 13 9340 Core Ultra 7 | |
| Lenovo ThinkBook 13x G4 21KR0008GE | |
| Microsoft Surface Laptop 7 13.8 Copilot+ | |
| Asus ZenBook S13 OLED UX5304 | |
| Dell XPS 13 9345 | |
| HP EliteBook Ultra G1q 14 | |
| Tiny Tina's Wonderlands - 1920x1080 Badass Preset (DX12) | |
| Dell XPS 13 9345 | |
| HP EliteBook Ultra G1q 14 | |
| F1 22 - 1920x1080 High Preset AA:T AF:16x | |
| Dell XPS 13 9345 | |
| Microsoft Surface Laptop 7 13.8 Copilot+ | |
| HP EliteBook Ultra G1q 14 | |
| Asus ZenBook S13 OLED UX5304 | |
| X-Plane 11.11 - 1280x720 low (fps_test=1) | |
| Dell XPS 14 2024 OLED | |
| Dell XPS 13 Plus 9320 4K | |
| Dell XPS 13 Plus 9320 i7-1280P OLED | |
| Dell XPS 13 9340 Core Ultra 7 | |
| Dell XPS 13 9305 Core i5 FHD | |
| Dell XPS 13 Plus 9320 Core i7-1360P | |
| Dell XPS 13 9345 | |
| Microsoft Surface Laptop 7 13.8 Copilot+ | |
| Lenovo ThinkPad T14s Gen 6 21N10007GE | |
| HP EliteBook Ultra G1q 14 | |
| Przeciętny Qualcomm SD X Adreno X1-85 3.8 TFLOPS (29.5 - 39, n=14) | |
| Dell XPS 13 9315 2-in-1 Core i5-1230U | |
| Medion SPRCHRGD 14 S1 Elite | |
| Dell XPS 13 Plus 9320 i5-1240p | |
| Dell XPS 13 9310 Core i7 4K | |
| Dell XPS 13 9310 OLED | |
| Dell XPS 13 9310 2-in-1 | |
| Tiny Tina's Wonderlands | |
| 1280x720 Lowest Preset (DX12) | |
| Dell XPS 13 9345 | |
| Przeciętny Qualcomm SD X Adreno X1-85 3.8 TFLOPS (67.6 - 73.9, n=3) | |
| HP EliteBook Ultra G1q 14 | |
| Dell XPS 13 Plus 9320 Core i7-1360P | |
| 1920x1080 Low Preset (DX12) | |
| Dell XPS 13 9345 | |
| Przeciętny Qualcomm SD X Adreno X1-85 3.8 TFLOPS (41.5 - 44.7, n=3) | |
| HP EliteBook Ultra G1q 14 | |
| Dell XPS 13 Plus 9320 Core i7-1360P | |
| 1920x1080 Medium Preset (DX12) | |
| Dell XPS 13 9345 | |
| Przeciętny Qualcomm SD X Adreno X1-85 3.8 TFLOPS (30.8 - 33.7, n=3) | |
| HP EliteBook Ultra G1q 14 | |
| Dell XPS 13 Plus 9320 Core i7-1360P | |
| 1920x1080 High Preset (DX12) | |
| Dell XPS 13 9345 | |
| Przeciętny Qualcomm SD X Adreno X1-85 3.8 TFLOPS (20.6 - 22.4, n=3) | |
| HP EliteBook Ultra G1q 14 | |
| Dell XPS 13 Plus 9320 Core i7-1360P | |
| 1920x1080 Badass Preset (DX12) | |
| Dell XPS 13 9345 | |
| Przeciętny Qualcomm SD X Adreno X1-85 3.8 TFLOPS (16.8 - 18, n=3) | |
| HP EliteBook Ultra G1q 14 | |
| Dell XPS 13 Plus 9320 Core i7-1360P | |
Cyberpunk 2077 ultra FPS Chart
| low | med. | high | ultra | |
|---|---|---|---|---|
| GTA V (2015) | 96.3 | 94.2 | 49.5 | 21.2 |
| The Witcher 3 (2015) | 104 | 74.5 | 43.7 | 19.2 |
| Dota 2 Reborn (2015) | 80 | 60.7 | 57.4 | 50.7 |
| Final Fantasy XV Benchmark (2018) | 56.1 | 25 | 15.8 | |
| X-Plane 11.11 (2018) | 38 | |||
| Far Cry 5 (2018) | 42 | 33 | 31 | 28 |
| Strange Brigade (2018) | 123.9 | 50.8 | 41.8 | 33.9 |
| Tiny Tina's Wonderlands (2022) | 44.5 | 33.6 | 22.4 | 18 |
| F1 22 (2022) | 62.9 | 55.4 | 38.5 | |
| Cyberpunk 2077 2.2 Phantom Liberty (2023) | 24.1 | 19.5 | 16.9 | 14.7 |
Emisje
Hałas systemowy - bardziej zrelaksowana aktywność wentylatora
Hałas wentylatora jest nieco cichszy niż Intel Core Ultra 7 w tym sensie, że wewnętrzne wentylatory rozkręcają się wolniej w odpowiedzi na zwiększone obciążenie. W przeciwnym razie wentylatory w obu modelach osiadłyby na podobnych maksymalnych obrotach podczas pracy z wymagającymi obciążeniami przez dłuższy czas. Dla przykładu, hałas wentylatorów osiągnął poziom 32,8 dB(A) pod koniec pierwszej 90-sekundowej sceny benchmarkowej w 3DMark 06 w porównaniu do 37,4 dB(A) w modelu Intela w podobnych warunkach. Podczas uruchamiania gier takich jak Cyberpunk 2077, oba modele osiadłyby jednak w niskim zakresie 40 dB(A). System zasilany przez Qualcomm niekoniecznie jest cichszy podczas pracy przy dużym obciążeniu, ale jest również mniej prawdopodobne, że zauważą Państwo jakąkolwiek aktywność wentylatora podczas przeglądania stron internetowych lub strumieniowania wideo.
Hałas
| luz |
| 22.9 / 22.9 / 22.9 dB |
| obciążenie |
| 32.8 / 40.6 dB |
 | ||
30 dB cichy 40 dB(A) słyszalny 50 dB(A) irytujący |
||
min: | ||
| Dell XPS 13 9345 Adreno X1-85 3.8 TFLOPS, SD X Elite X1E-80-100 | Dell XPS 13 9340 Core Ultra 7 Arc 8-Core, Ultra 7 155H, Micron 2550 512GB | Microsoft Surface Laptop 7 13.8 Copilot+ Adreno X1-85 3.8 TFLOPS, SD X Elite X1E-80-100, Samsung MZ9L4512HBLU-00BMV | Lenovo ThinkBook 13x G4 21KR0008GE Arc 7-Core, Ultra 5 125H, Samsung PM9C1a MZAL8512HDLU | HP EliteBook Ultra G1q 14 Adreno X1-85 3.8 TFLOPS, SD X Elite X1E-78-100, SK hynix PC801 HFS512GEJ9X101N BF | Asus ZenBook S13 OLED UX5304 Iris Xe G7 96EUs, i7-1355U, Samsung PM9A1 MZVL21T0HCLR | |
|---|---|---|---|---|---|---|
| Noise | -10% | 4% | -7% | 4% | -4% | |
| wyłączone / środowisko * | 22.9 | 25.1 -10% | 23.8 -4% | 24.5 -7% | 23.4 -2% | 23.3 -2% |
| Idle Minimum * | 22.9 | 25.1 -10% | 23.8 -4% | 24.5 -7% | 23.4 -2% | 23.3 -2% |
| Idle Average * | 22.9 | 25.1 -10% | 23.8 -4% | 24.5 -7% | 23.4 -2% | 23.3 -2% |
| Idle Maximum * | 22.9 | 25.1 -10% | 23.8 -4% | 27.1 -18% | 24.3 -6% | 23.3 -2% |
| Load Average * | 32.8 | 37.4 -14% | 26 21% | 33.3 -2% | 25 24% | 37.7 -15% |
| Cyberpunk 2077 ultra * | 40.6 | 31.5 22% | ||||
| Load Maximum * | 40.6 | 42.5 -5% | 40.3 1% | 40.7 -0% | 34.8 14% | 40.1 1% |
| Witcher 3 ultra * | 42.5 | 36.8 | 30.6 | 40.1 |
* ... im mniej tym lepiej
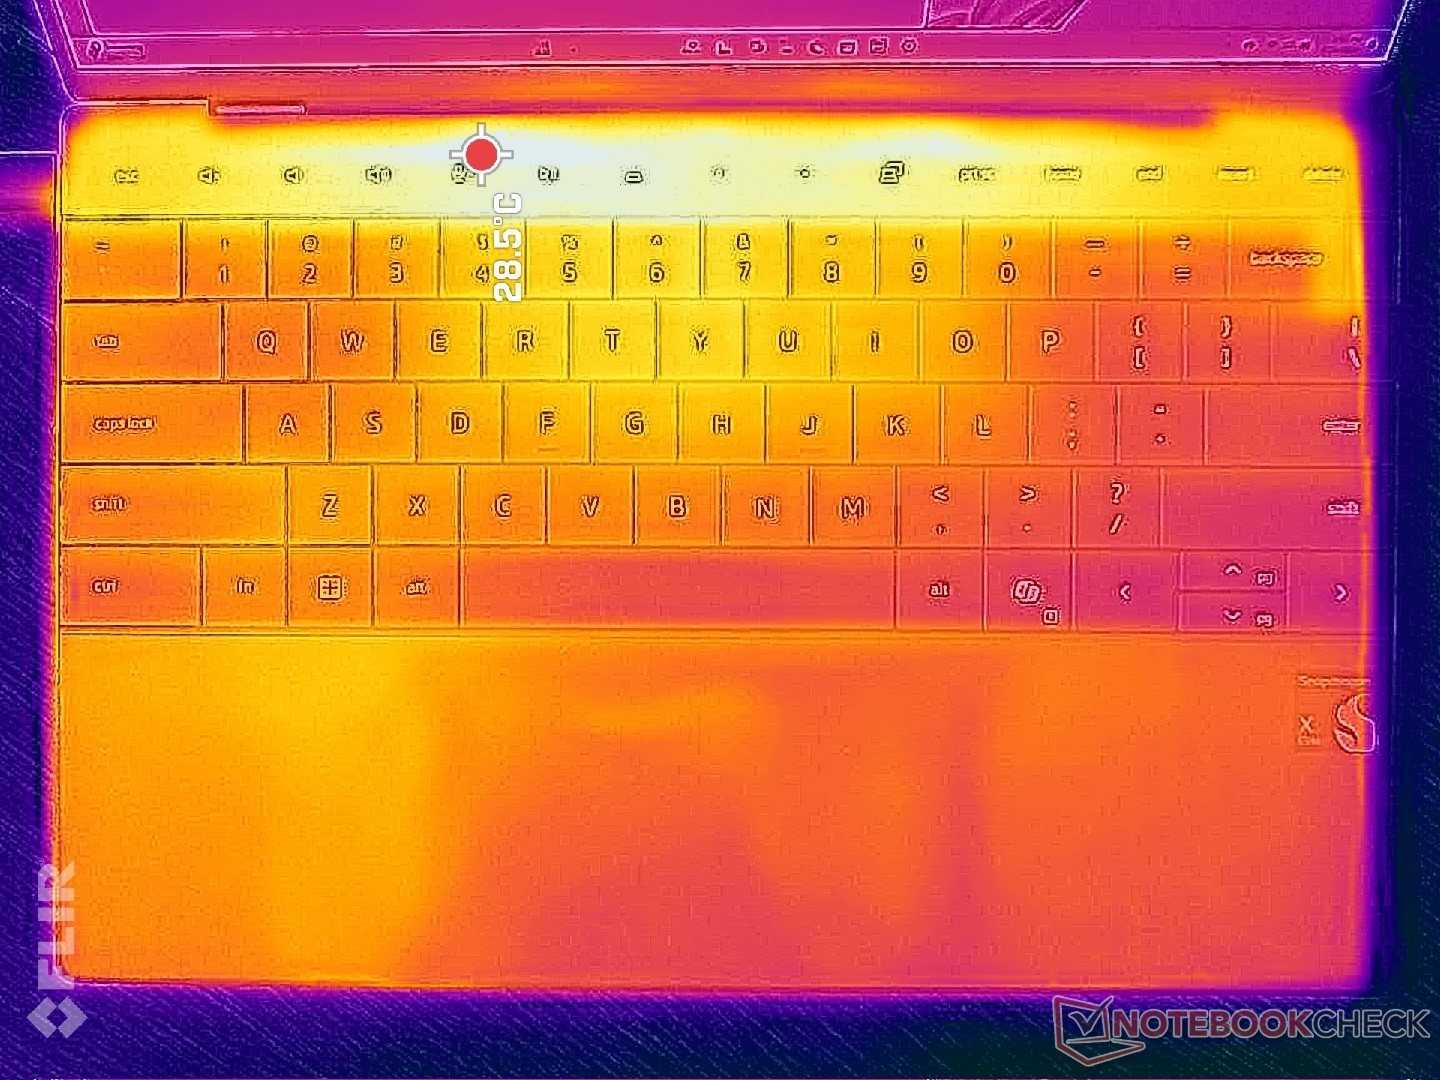
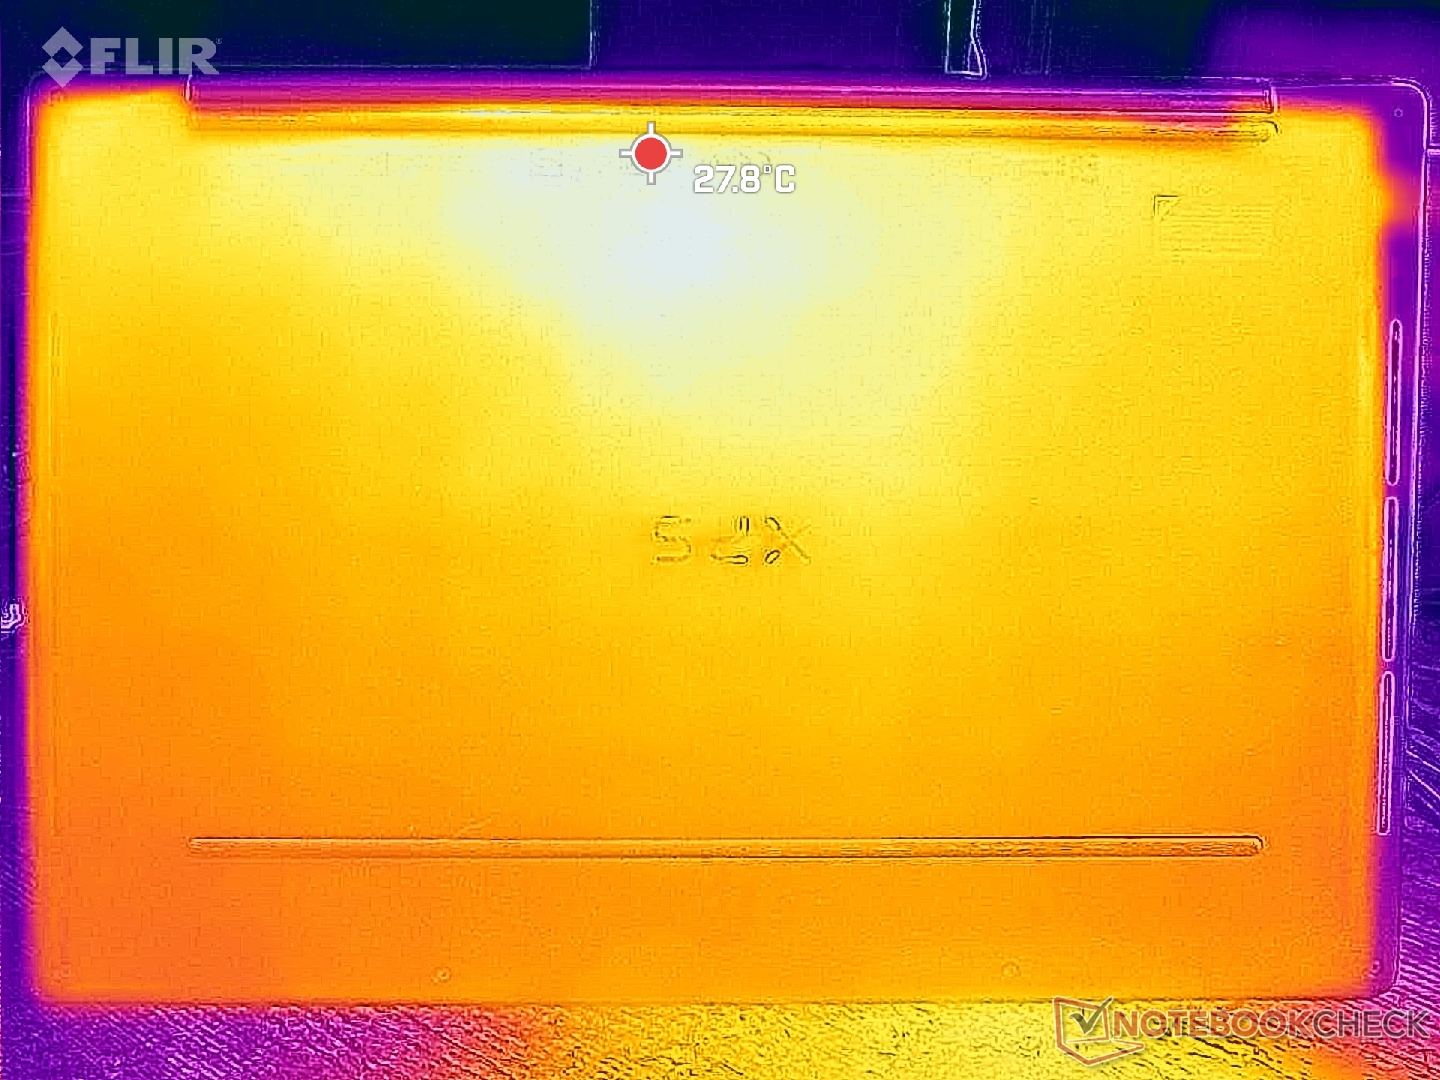
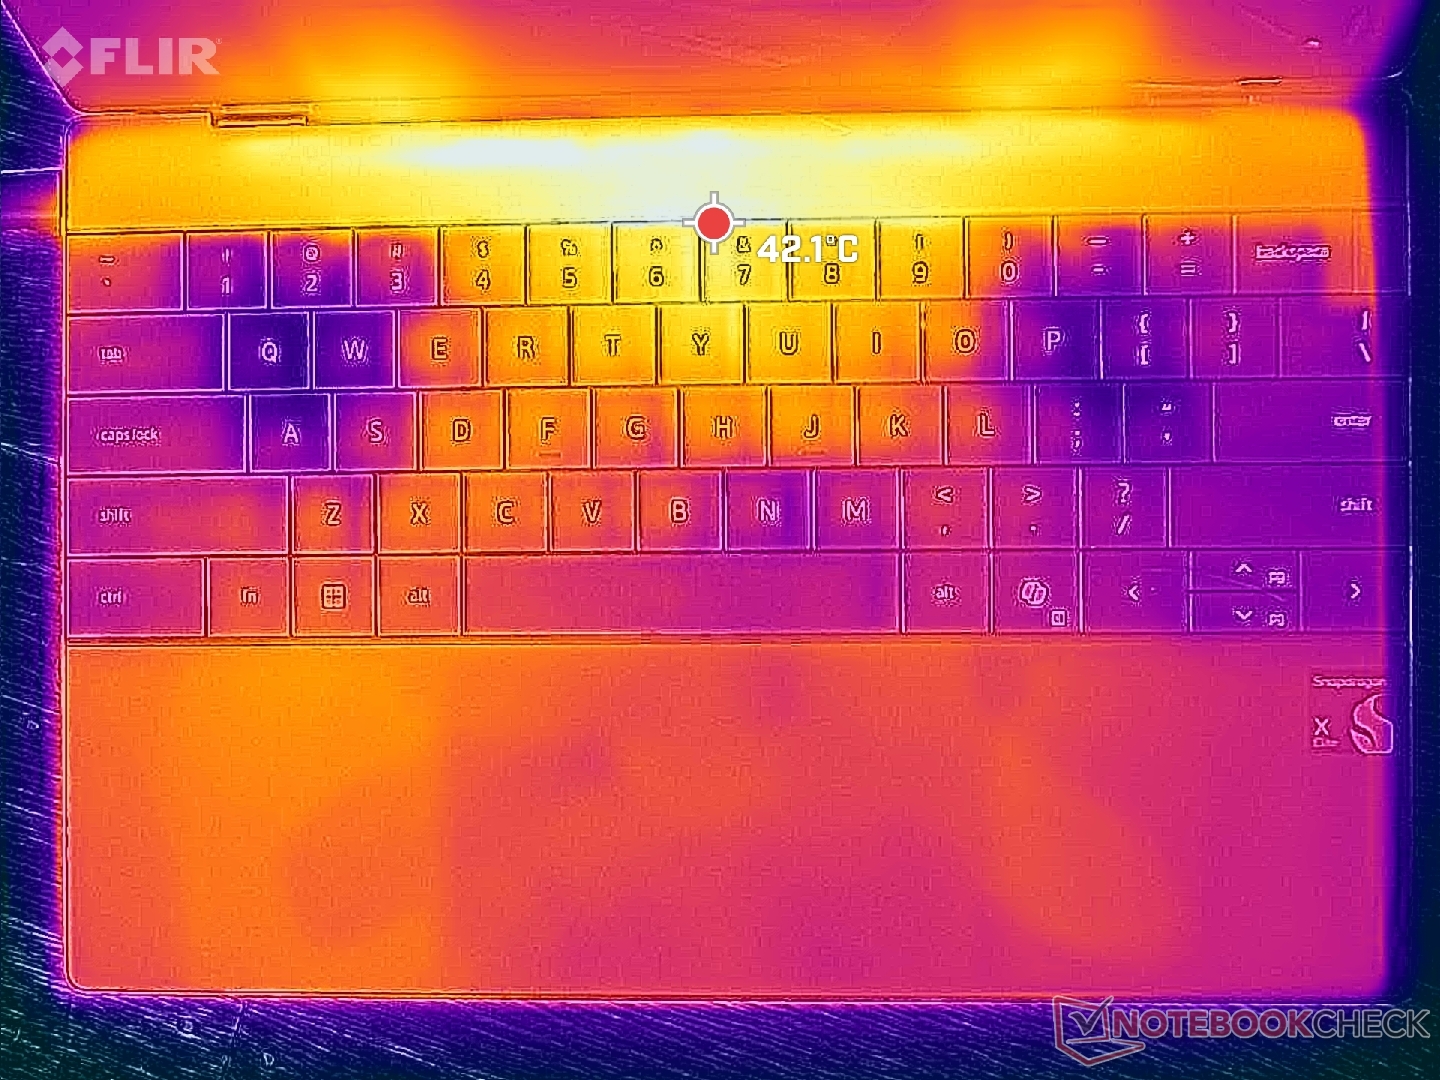
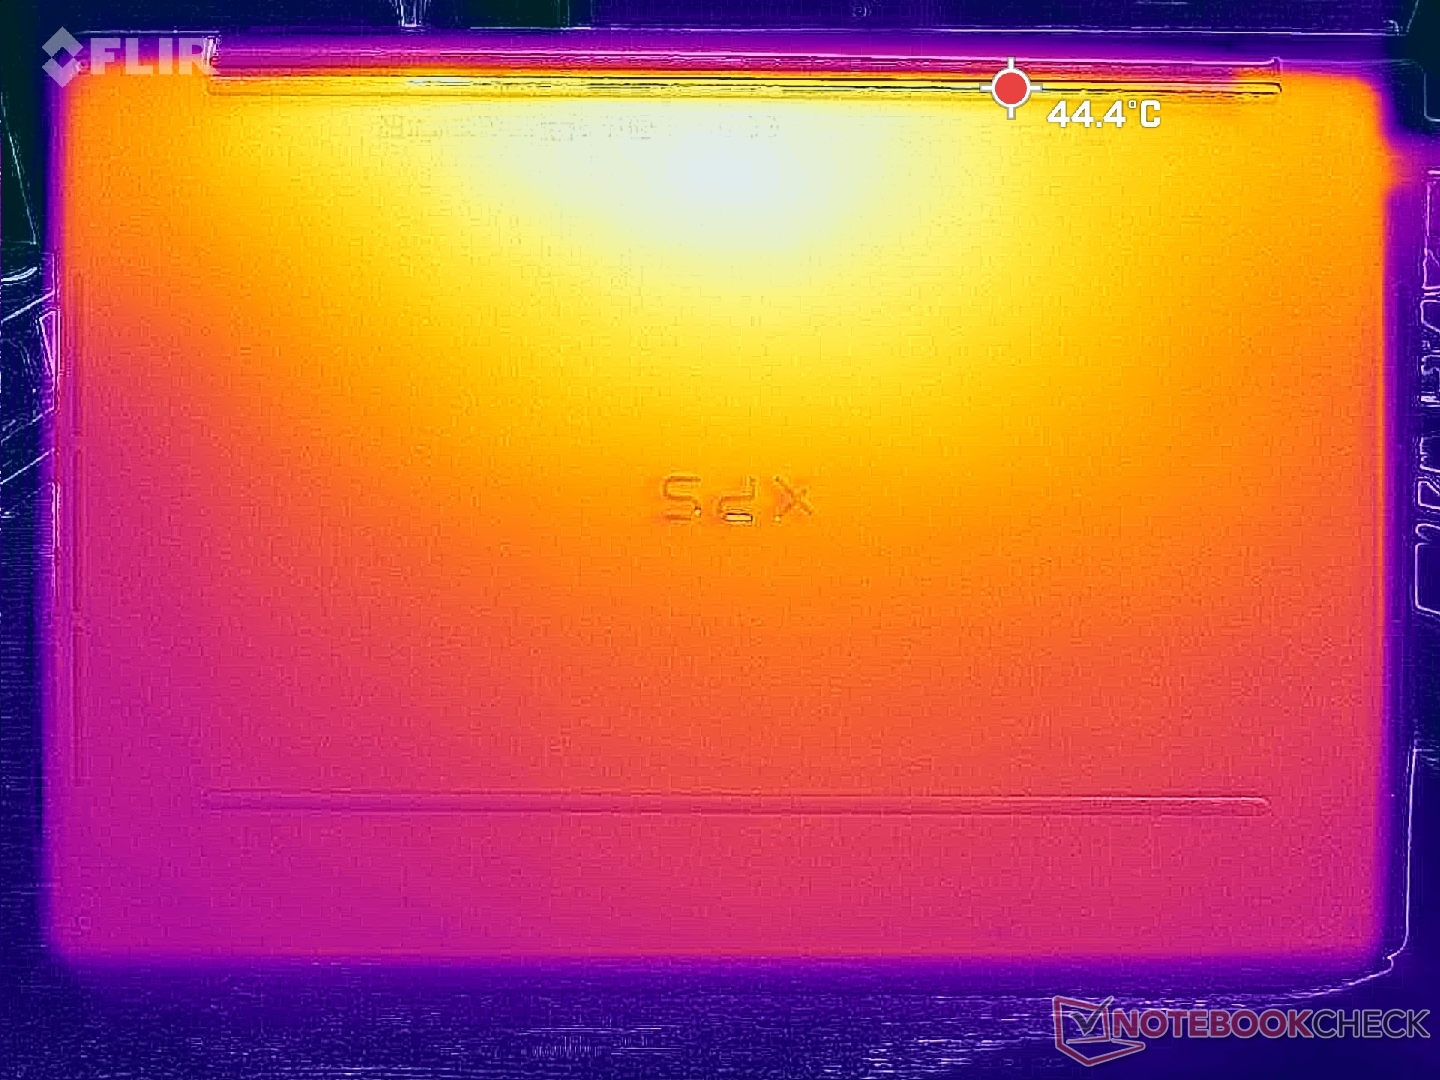
Temperatura
Temperatury powierzchniowe są bardzo zbliżone do tego, co zarejestrowaliśmy na XPS 13 9340 z procesorem Intela, aby pokazać, że model Qualcomm nie działa zauważalnie cieplej lub chłodniej pomimo wymiany procesora. Gorące punkty w kierunku środka systemu mogą osiągnąć nawet 45 C, co jest podobne do modelu Intela, gdy oba działają pod wymagającym obciążeniem przez dłuższy czas. Średnie temperatury są niższe niż te, które odnotowaliśmy na Microsoft Surface Laptop 7 13.8 ale cieplejsze niż na HP EliteBook Ultra G1q 14 każdy z podobnymi procesorami Snapdragon Elite.
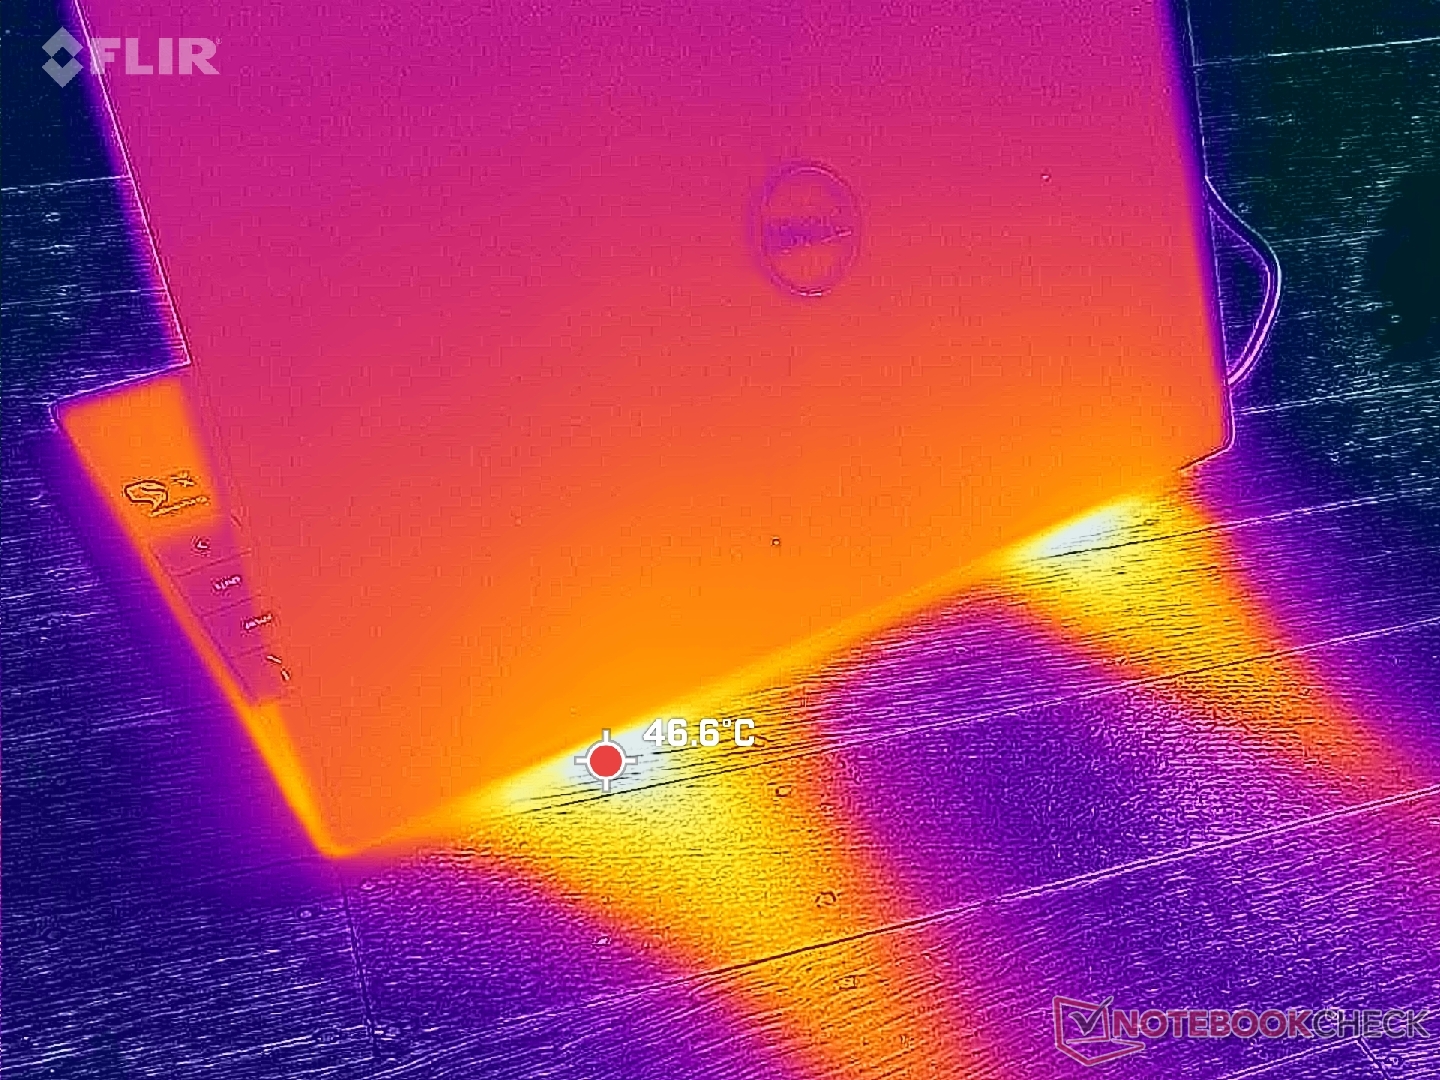
(-) Maksymalna temperatura w górnej części wynosi 45.2 °C / 113 F, w porównaniu do średniej 35.9 °C / 97 F , począwszy od 21.4 do 59 °C dla klasy Subnotebook.
(±) Dno nagrzewa się maksymalnie do 44.2 °C / 112 F, w porównaniu do średniej 39.3 °C / 103 F
(+) W stanie bezczynności średnia temperatura górnej części wynosi 29.1 °C / 84 F, w porównaniu ze średnią temperaturą urządzenia wynoszącą 30.8 °C / ### class_avg_f### F.
(+) Podparcia dłoni i touchpad osiągają maksymalną temperaturę skóry (34.4 °C / 93.9 F) i dlatego nie są gorące.
(-) Średnia temperatura obszaru podparcia dłoni w podobnych urządzeniach wynosiła 28.2 °C / 82.8 F (-6.2 °C / -11.1 F).
| Dell XPS 13 9345 Qualcomm Snapdragon X Elite X1E-80-100, Qualcomm SD X Adreno X1-85 3.8 TFLOPS | Dell XPS 13 9340 Core Ultra 7 Intel Core Ultra 7 155H, Intel Arc 8-Core iGPU | Microsoft Surface Laptop 7 13.8 Copilot+ Qualcomm Snapdragon X Elite X1E-80-100, Qualcomm SD X Adreno X1-85 3.8 TFLOPS | Lenovo ThinkBook 13x G4 21KR0008GE Intel Core Ultra 5 125H, Intel Arc 7-Core iGPU | HP EliteBook Ultra G1q 14 Qualcomm Snapdragon X Elite X1E-78-100, Qualcomm SD X Adreno X1-85 3.8 TFLOPS | Asus ZenBook S13 OLED UX5304 Intel Core i7-1355U, Intel Iris Xe Graphics G7 96EUs | |
|---|---|---|---|---|---|---|
| Heat | 12% | 9% | 9% | 4% | 6% | |
| Maximum Upper Side * | 45.2 | 41 9% | 47.1 -4% | 43.1 5% | 40.8 10% | 43.1 5% |
| Maximum Bottom * | 44.2 | 43.5 2% | 44.6 -1% | 39.2 11% | 40.4 9% | 45 -2% |
| Idle Upper Side * | 30.4 | 25.3 17% | 24.7 19% | 28.3 7% | 32.2 -6% | 27.3 10% |
| Idle Bottom * | 31.6 | 25.5 19% | 24.5 22% | 28 11% | 31.2 1% | 27.8 12% |
* ... im mniej tym lepiej
Głośniki
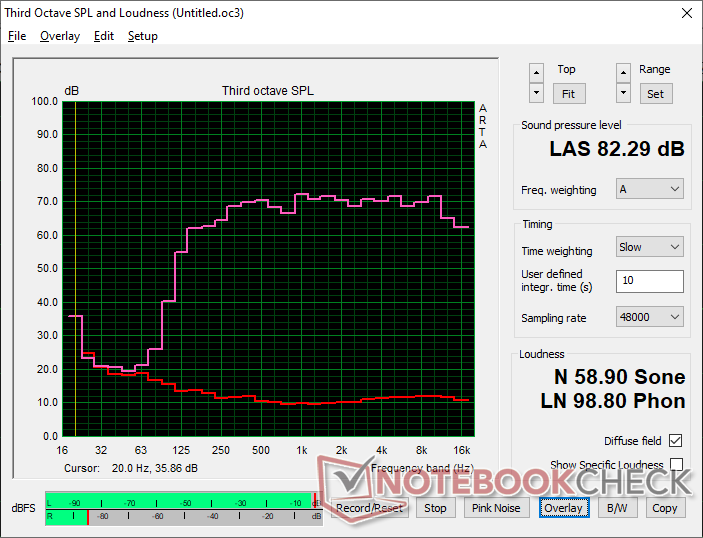
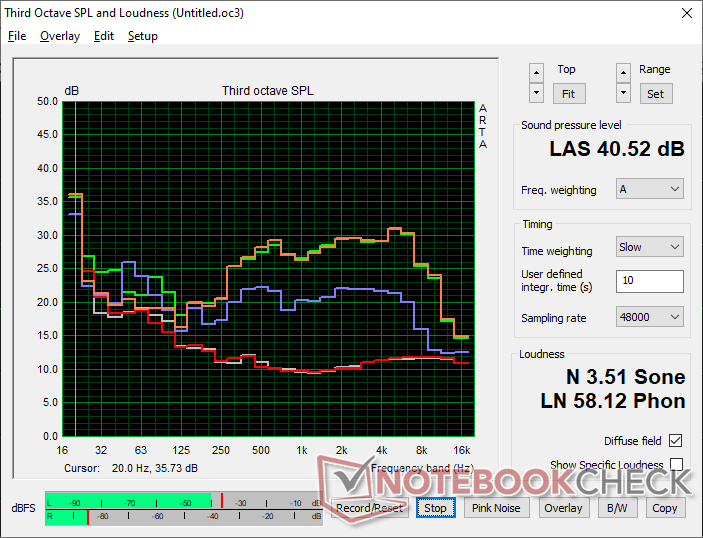
Dell XPS 13 9345 analiza dźwięku
(+) | głośniki mogą odtwarzać stosunkowo głośno (82.3 dB)
Bas 100 - 315 Hz
(±) | zredukowany bas - średnio 9.9% niższy od mediany
(±) | liniowość basu jest średnia (12.4% delta do poprzedniej częstotliwości)
Średnie 400 - 2000 Hz
(+) | zbalansowane środki średnie - tylko 1.9% od mediany
(+) | średnie są liniowe (3.2% delta do poprzedniej częstotliwości)
Wysokie 2–16 kHz
(+) | zrównoważone maksima - tylko 1.5% od mediany
(+) | wzloty są liniowe (3% delta do poprzedniej częstotliwości)
Ogólnie 100 - 16.000 Hz
(+) | ogólny dźwięk jest liniowy (8.2% różnicy w stosunku do mediany)
W porównaniu do tej samej klasy
» 2% wszystkich testowanych urządzeń w tej klasie było lepszych, 1% podobnych, 97% gorszych
» Najlepszy miał deltę 5%, średnia wynosiła ###średnia###%, najgorsza wynosiła 53%
W porównaniu do wszystkich testowanych urządzeń
» 1% wszystkich testowanych urządzeń było lepszych, 1% podobnych, 98% gorszych
» Najlepszy miał deltę 4%, średnia wynosiła ###średnia###%, najgorsza wynosiła 134%
Apple MacBook Pro 16 2021 M1 Pro analiza dźwięku
(+) | głośniki mogą odtwarzać stosunkowo głośno (84.7 dB)
Bas 100 - 315 Hz
(+) | dobry bas - tylko 3.8% od mediany
(+) | bas jest liniowy (5.2% delta do poprzedniej częstotliwości)
Średnie 400 - 2000 Hz
(+) | zbalansowane środki średnie - tylko 1.3% od mediany
(+) | średnie są liniowe (2.1% delta do poprzedniej częstotliwości)
Wysokie 2–16 kHz
(+) | zrównoważone maksima - tylko 1.9% od mediany
(+) | wzloty są liniowe (2.7% delta do poprzedniej częstotliwości)
Ogólnie 100 - 16.000 Hz
(+) | ogólny dźwięk jest liniowy (4.6% różnicy w stosunku do mediany)
W porównaniu do tej samej klasy
» 0% wszystkich testowanych urządzeń w tej klasie było lepszych, 0% podobnych, 100% gorszych
» Najlepszy miał deltę 5%, średnia wynosiła ###średnia###%, najgorsza wynosiła 45%
W porównaniu do wszystkich testowanych urządzeń
» 0% wszystkich testowanych urządzeń było lepszych, 0% podobnych, 100% gorszych
» Najlepszy miał deltę 4%, średnia wynosiła ###średnia###%, najgorsza wynosiła 134%
Zarządzanie energią
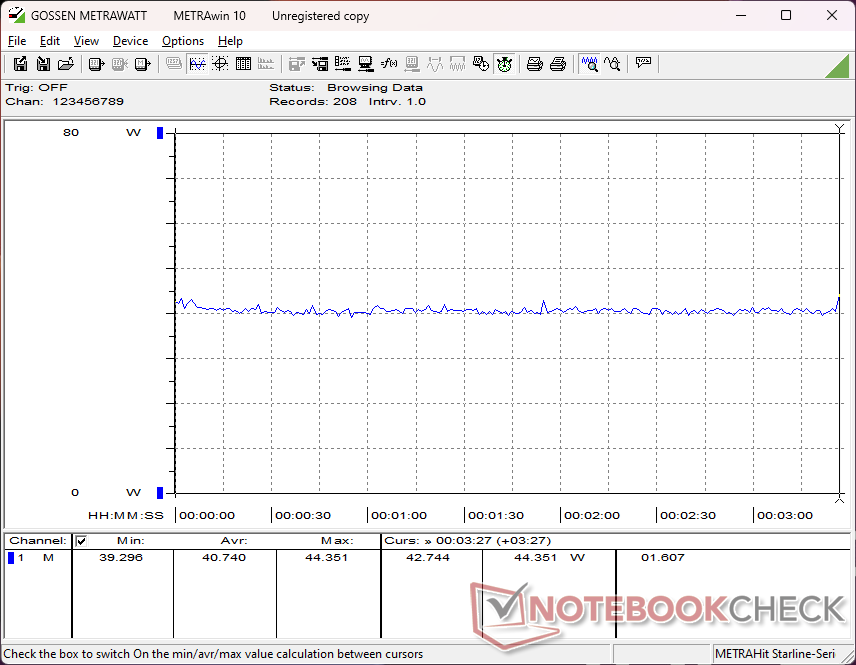
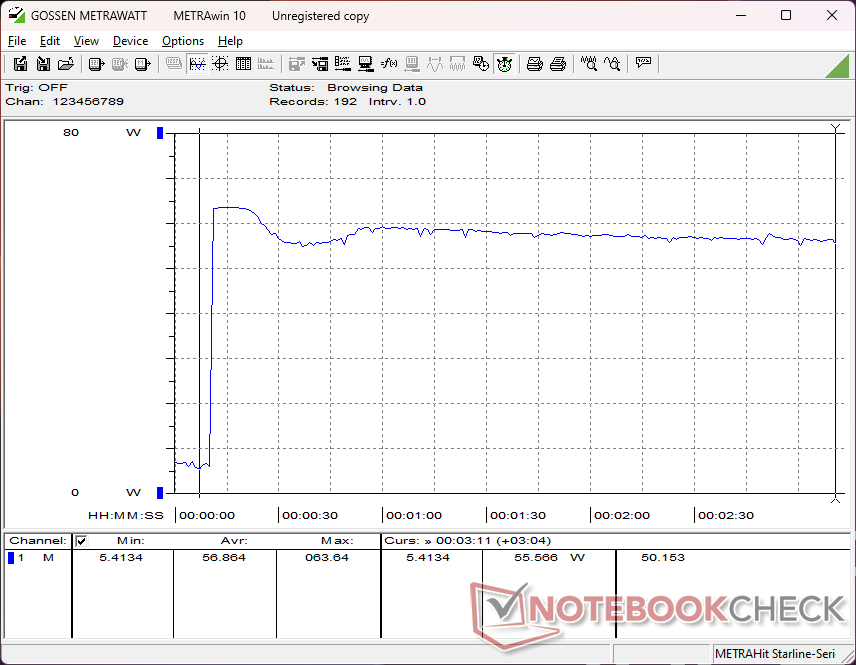
Zużycie energii
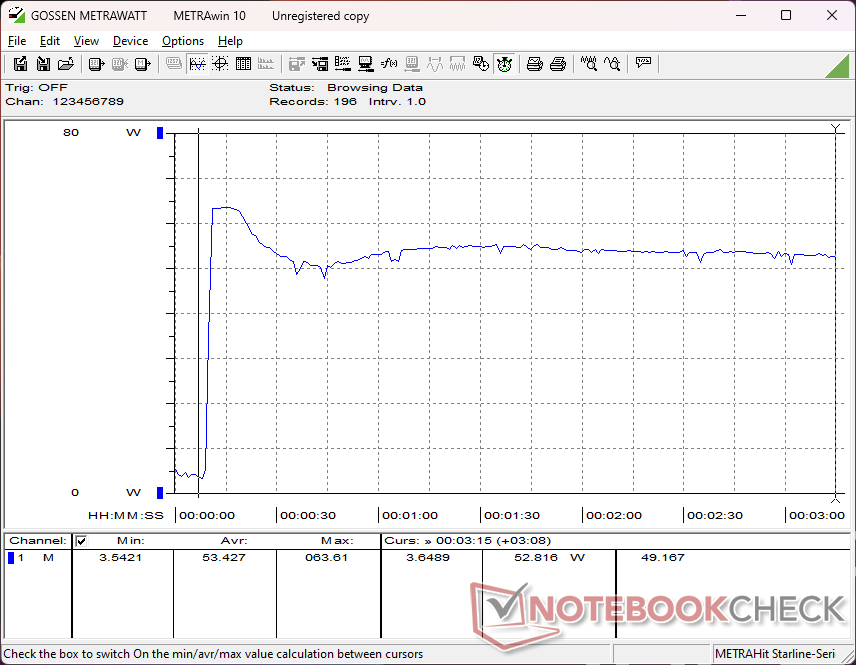
Pomiary zużycia energii pokazują kilka interesujących wyników w porównaniu do Core Ultra 7 XPS 13. Podczas pracy przy średnim lub niższym obciążeniu, nasz Snapdragon XPS 13 wymagałby konsekwentnie mniej energii niż wersja Intela, co toruje drogę do dłuższego czasu pracy na baterii, jak pokazano w następnej sekcji poniżej. Jednak podczas uruchamiania bardziej wymagających obciążeń, takich jak gry, średnie zużycie energii byłoby mniej więcej takie samo i wynosiłoby około 40 W, mimo że Core Ultra 7 generalnie oferuje szybszą wydajność graficzną.
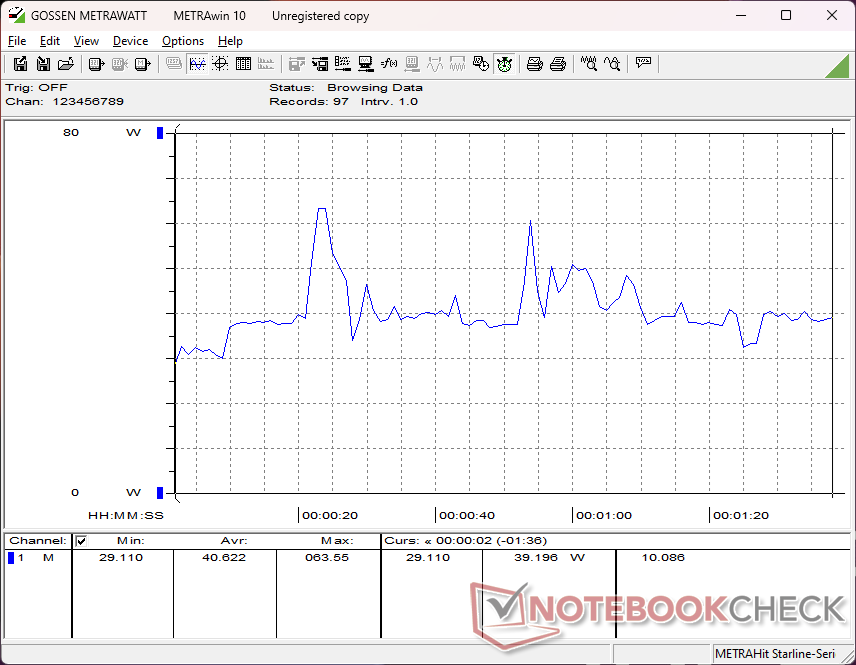
Zużycie energii podczas uruchamiania Prime95 w celu obciążenia procesora pokazuje, że model Snapdragon wymaga średnio więcej energii niż model Intela, ponieważ ten ostatni dławiłby się bardziej stromo w czasie. Z drugiej strony, zużycie energii podczas uruchamiania FurMark w celu obciążenia GPU wynosi średnio zaledwie 18 W w porównaniu do 34 W lub więcej w modelu Intela. Sugeruje to, że Qualcomm może przeznaczać mniejszą powierzchnię lub budżet krzemowy na zintegrowany układ GPU niż konkurencyjna seria Arc 8, która jest zarówno mocniejsza, jak i bardziej wymagająca.
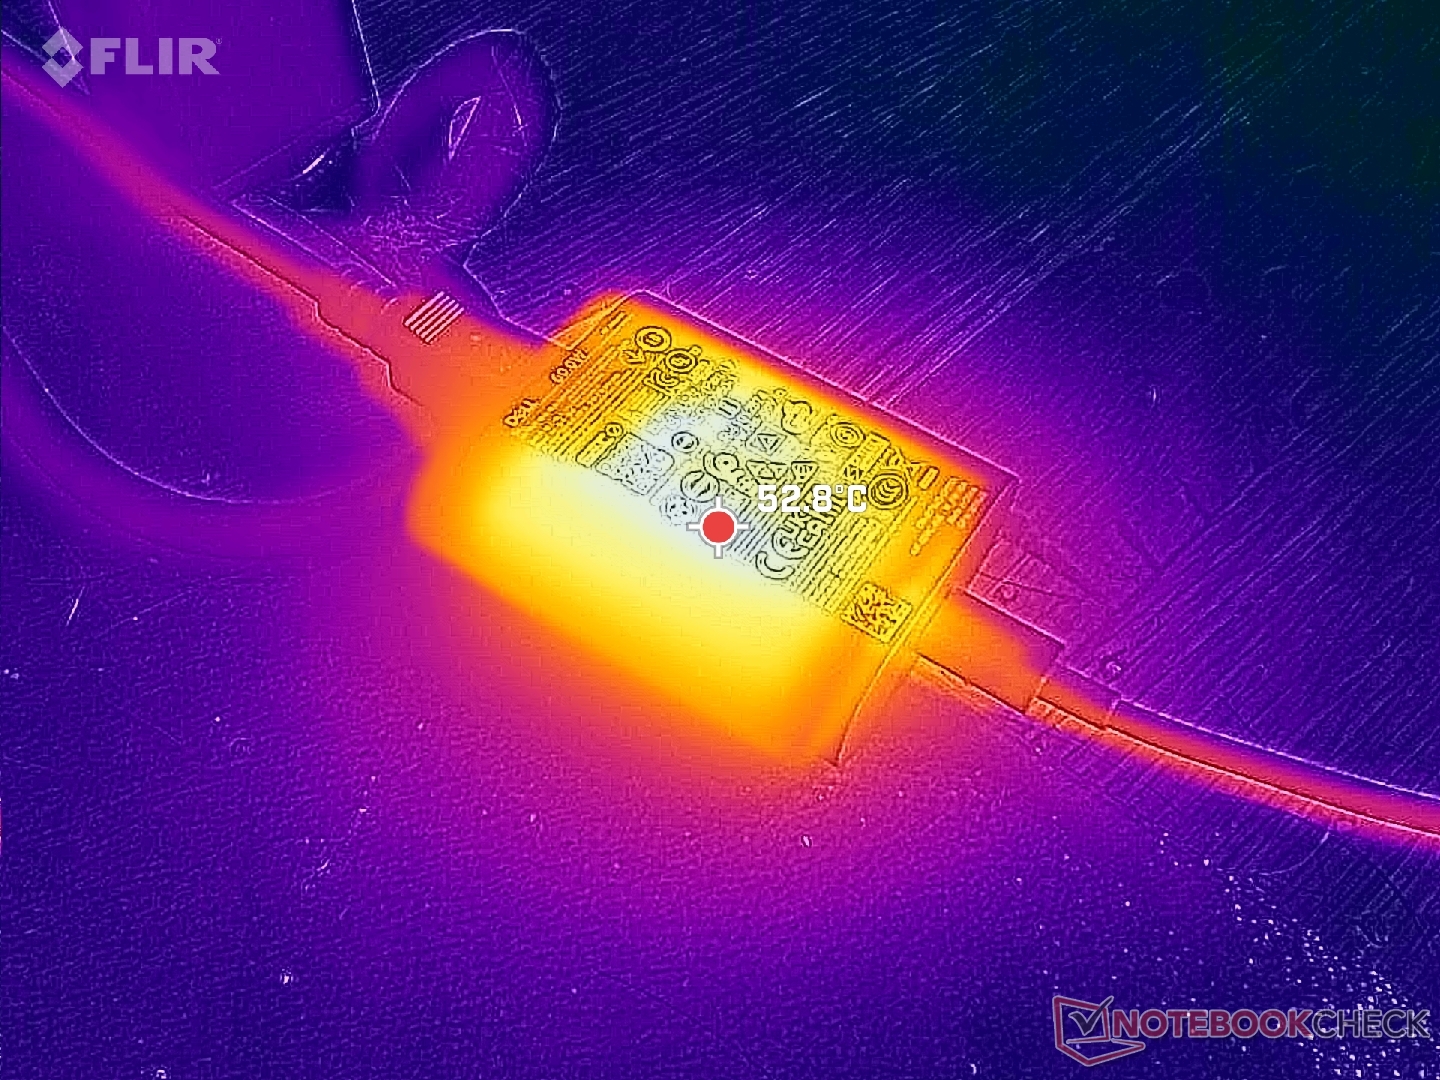
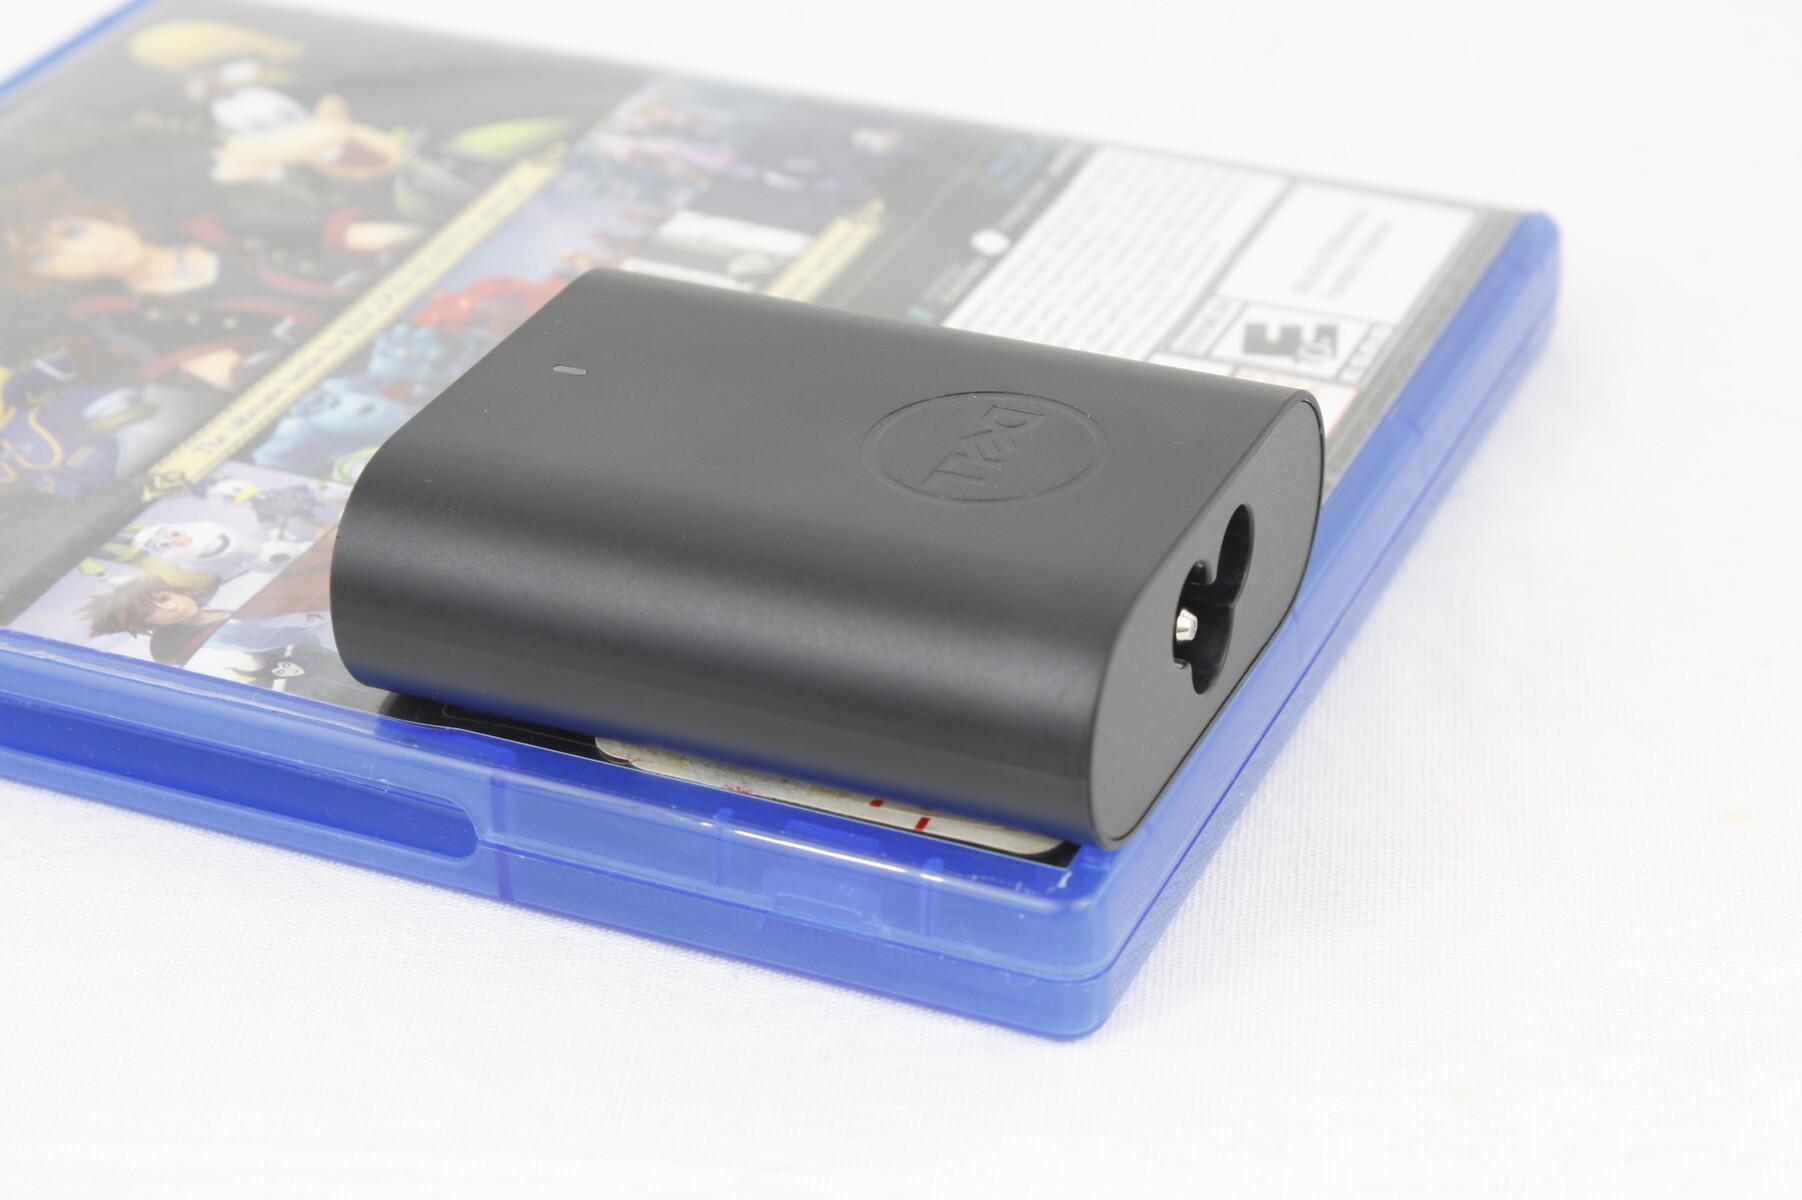
Maksymalne zużycie energii może osiągnąć 64 W z bardzo małego (~6,5 x 5,5 x 2,3 cm) zasilacza sieciowego USB-C o mocy 65 W, podobnie jak w modelu Intela.
| wyłączony / stan wstrzymania | |
| luz | |
| obciążenie |
|
Legenda:
min: | |
| Dell XPS 13 9345 SD X Elite X1E-80-100, Adreno X1-85 3.8 TFLOPS, , IPS, 1920x1200, 13.4" | Dell XPS 13 9340 Core Ultra 7 Ultra 7 155H, Arc 8-Core, Micron 2550 512GB, IPS, 1920x1200, 13.4" | Microsoft Surface Laptop 7 13.8 Copilot+ SD X Elite X1E-80-100, Adreno X1-85 3.8 TFLOPS, Samsung MZ9L4512HBLU-00BMV, IPS, 2304x1536, 13.8" | Lenovo ThinkBook 13x G4 21KR0008GE Ultra 5 125H, Arc 7-Core, Samsung PM9C1a MZAL8512HDLU, IPS, 2880x1920, 13.5" | HP EliteBook Ultra G1q 14 SD X Elite X1E-78-100, Adreno X1-85 3.8 TFLOPS, SK hynix PC801 HFS512GEJ9X101N BF, IPS, 2240x1400, 14" | Asus ZenBook S13 OLED UX5304 i7-1355U, Iris Xe G7 96EUs, Samsung PM9A1 MZVL21T0HCLR, OLED, 2880x1800, 13.3" | |
|---|---|---|---|---|---|---|
| Power Consumption | -27% | 11% | -48% | 11% | -43% | |
| Idle Minimum * | 2.8 | 3.8 -36% | 1.4 50% | 5.4 -93% | 2.5 11% | 5.8 -107% |
| Idle Average * | 4.9 | 7 -43% | 6.3 -29% | 7.8 -59% | 5.7 -16% | 8.5 -73% |
| Idle Maximum * | 5.7 | 7.3 -28% | 7.6 -33% | 8.9 -56% | 5.8 -2% | 8.8 -54% |
| Load Average * | 40.6 | 52.6 -30% | 26.9 34% | 49.4 -22% | 24.2 40% | 35.1 14% |
| Cyberpunk 2077 ultra external monitor * | 39.4 | 26.8 32% | ||||
| Cyberpunk 2077 ultra * | 40.7 | 38.5 5% | 33.5 18% | |||
| Load Maximum * | 64 | 62.7 2% | 40.7 36% | 68.8 -8% | 66.4 -4% | 59.5 7% |
| Witcher 3 ultra * | 38.3 | 44.4 | 23.1 | 27.6 |
* ... im mniej tym lepiej
Power Consumption Cyberpunk / Stress Test
Power Consumption external Monitor
Żywotność baterii
Jeśli jest jedna rzecz, w której ten system jednoznacznie się wyróżnia, to musi to być czas pracy na baterii. Jesteśmy w stanie zarejestrować rzeczywisty czas pracy podczas przeglądania sieci WLAN wynoszący prawie 26,5 godziny, czyli ponad 2 razy dłużej niż w przypadku XPS 13 9340 wyposażonego w Core Ultra 7 155H i identyczny wyświetlacz IPS 1200p. Gwarantujemy, że czas pracy będzie krótszy w przypadku konfiguracji z panelem OLED, ale nadal będzie niesamowicie długi i jeden z najdłuższych spośród wszystkich 13-calowych subnotebooków, w tym nawet serii MacBook Air.
Nasz test został przeprowadzony po zastosowaniu najnowszej aktualizacji BIOS-u od Dell, która została specjalnie zaprojektowana w celu poprawy żywotności baterii w modelu Snapdragon. Zalecamy zainstalowanie aktualizacji tutaj.
Ładowanie od stanu pustego do pełnej pojemności trwa nieco ponad 90 minut, co jest typowe dla większości laptopów.
| Dell XPS 13 9345 SD X Elite X1E-80-100, Adreno X1-85 3.8 TFLOPS, 55 Wh | Dell XPS 13 9340 Core Ultra 7 Ultra 7 155H, Arc 8-Core, 55 Wh | Microsoft Surface Laptop 7 13.8 Copilot+ SD X Elite X1E-80-100, Adreno X1-85 3.8 TFLOPS, 54 Wh | Lenovo ThinkBook 13x G4 21KR0008GE Ultra 5 125H, Arc 7-Core, 74 Wh | HP EliteBook Ultra G1q 14 SD X Elite X1E-78-100, Adreno X1-85 3.8 TFLOPS, 59 Wh | Asus ZenBook S13 OLED UX5304 i7-1355U, Iris Xe G7 96EUs, 63 Wh | |
|---|---|---|---|---|---|---|
| Czasy pracy | 40% | -3% | 24% | 4% | 50% | |
| Reader / Idle | 2785 | 1222 -56% | ||||
| WiFi v1.3 | 1585 | 769 -51% | 852 -46% | 684 -57% | 792 -50% | 678 -57% |
| Load | 57 | 131 130% | 80 40% | 116 104% | 124 118% | 146 156% |
| H.264 | 1053 | 1181 | 1229 | 829 |
Za
Przeciw
Werdykt - godna szacunku alternatywa dla Intel XPS 13
Snapdragon XPS 13 za 1300 dolarów jest nieco tańszy niż XPS 13 za 1400 dolarów Core Ultra 7 XPS 13 oferując jednocześnie znacznie dłuższy czas pracy na baterii, integrację Co-Pilot+ i identyczne funkcje sprzętowe. Rzeczywiste wrażenia użytkownika będą jednak w dużej mierze zależeć od obciążenia pracą i aplikacji. Jeśli jest używany głównie do przeglądania stron internetowych, przetwarzania tekstu, wideo i przesyłania strumieniowego, to Snapdragon XPS 13 wydaje się być bardziej wydajny, zwłaszcza gdy programy mogą działać natywnie na ARM. Z drugiej strony, bardziej wymagające zadania, takie jak edycja grafiki, kodowanie wideo, dokowanie Thunderbolt lub specyficzne aplikacje, które muszą być emulowane na ARM, najlepiej sprawdzą się na tradycyjnym Intel XPS 13. W tym celu model Intela zapewnia bardziej przewidywalny poziom wydajności we wszystkich scenariuszach użytkowania, co prawdopodobnie przeważa nad kilkoma skrajnymi przypadkami, w których model Snapdragon może wyjść na prowadzenie.
Snapdragon XPS 13 jest świetną alternatywą dla Intel XPS 13 dolar za dolara. Doświadczenia użytkownika będą się jednak znacznie różnić w zależności od rodzaju aplikacji i zadań, do których zamierzają Państwo używać systemu.
Zalety w zakresie czasu pracy na baterii i kompatybilności z Co-Pilot+ mogą nie wystarczyć, aby przekonać nabywców, gdy czas pracy na baterii w Intel XPS 13 jest już całkiem dobry i oczekuje się, że Co-Pilot+ pojawi się w przyszłych procesorach Intel i AMD. Jednak użytkownicy, którzy chcą zmaksymalizować czas pracy i doświadczyć najnowszych funkcji Microsoft AI już dziś, mogą uznać Snapdragon XPS 13 za bardziej produktywną opcję.
Cena i dostępność
Dell dostarcza obecnie XPS 13 9345 w konfiguracji za 1300 USD do 1800 USD + w przypadku konfiguracji z panelem OLED.
Wskazówka: Nasz system ocen został niedawno zaktualizowany, a wyniki wersji 8 nie są porównywalne z wynikami wersji 7. Dodatkowe informacje znajdą Państwo hier verfügbar.
Uwaga: Niedawno zaktualizowaliśmy nasz system oceniania i wyniki wersji 8 nie są porównywalne z wynikami wersji 7. Więcej informacji znajdą Państwo tutaj .
Dell XPS 13 9345
- 04/08/2024 v8
Allen Ngo
 Total Sustainability Score:
 Przezroczystość
Wyboru urządzeń do recenzji dokonuje nasza redakcja. Próbka testowa została udostępniona autorowi jako pożyczka od producenta lub sprzedawcy detalicznego na potrzeby tej recenzji. Pożyczkodawca nie miał wpływu na tę recenzję, producent nie otrzymał też kopii tej recenzji przed publikacją. Nie było obowiązku publikowania tej recenzji. Nigdy nie przyjmujemy rekompensaty ani płatności w zamian za nasze recenzje. Jako niezależna firma medialna, Notebookcheck nie podlega władzy producentów, sprzedawców detalicznych ani wydawców.
Tak testuje Notebookcheck
Każdego roku Notebookcheck niezależnie sprawdza setki laptopów i smartfonów, stosując standardowe procedury, aby zapewnić porównywalność wszystkich wyników. Od około 20 lat stale rozwijamy nasze metody badawcze, ustanawiając przy tym standardy branżowe. W naszych laboratoriach testowych doświadczeni technicy i redaktorzy korzystają z wysokiej jakości sprzętu pomiarowego. Testy te obejmują wieloetapowy proces walidacji. Nasz kompleksowy system ocen opiera się na setkach uzasadnionych pomiarów i benchmarków, co pozwala zachować obiektywizm.Price comparison

