

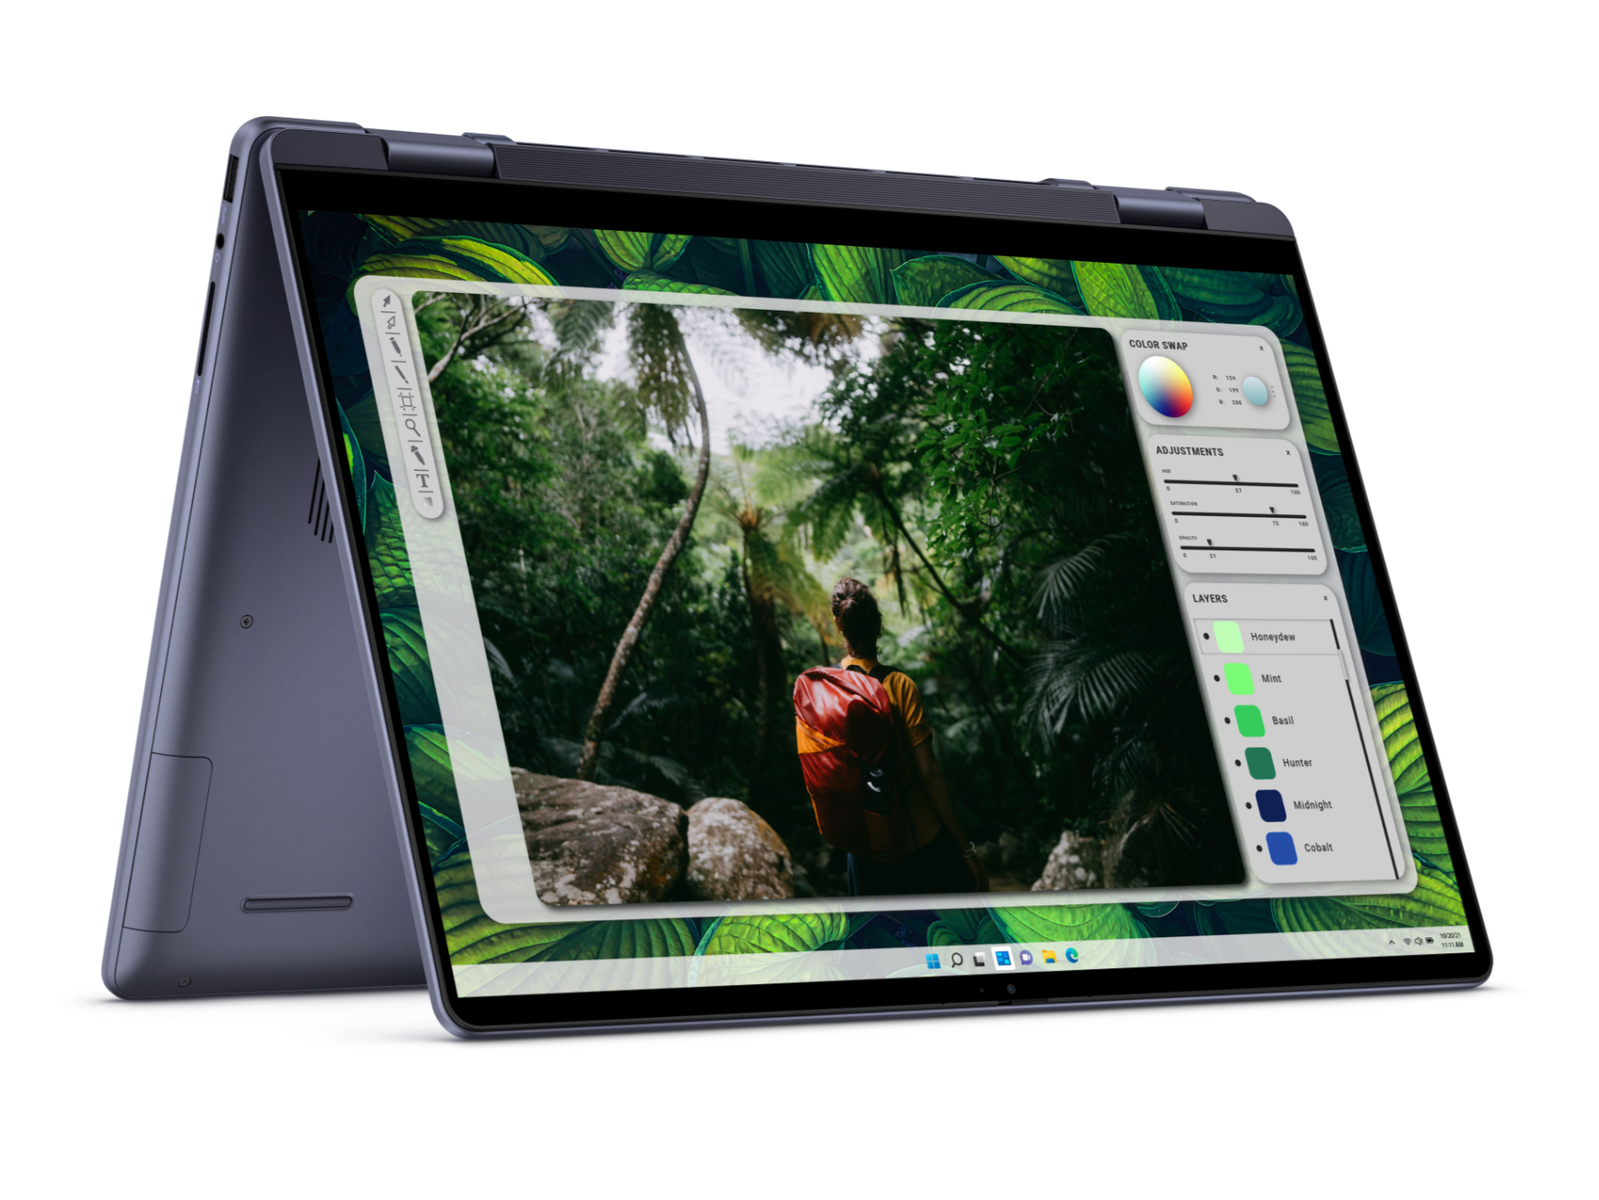
Mini-LED w 16-calowym kabriolecie: Recenzja Dell Inspiron 16 7640 2-w-1

Inspiron 16 7640 2-w-1 z 2024 roku jest następcą Inspirona 16 7630 2-w-1 z 2023 roku z zaktualizowanymi układami wewnętrznymi Intel 14. generacji i kilkoma zmianami zewnętrznymi. Tegoroczny model został wyposażony w ekran dotykowy mini-LED 90 Hz 1600p, który zastąpił ekran dotykowy OLED 2400p w Inspironie 16 7630 2-w-1. W międzyczasie ekran dotykowy IPS 60 Hz 1200p z Inspiron 16 7635 2-w-1 powrócił w wybranych jednostkach SKU z niższej półki.
Nasza jednostka testowa to wyższej klasy konfiguracja z procesorem Meteor Lake-H Core Ultra 7 155H i zintegrowaną grafiką Arc 8 za około 1000 USD. Niższa opcja z Core Ultra 5 125U jest dostępna ze starszym panelem IPS 60 Hz 1200p za 200 USD mniej, ale w obu przypadkach nie ma oddzielnych opcji GPU. Co ciekawe, Inspiron 16 7640 2 w 1 jest jednym z niewielu konwertowalnych komputerów z opcjami procesorów Core-U i Core-H, ponieważ większość oferuje tylko jeden, ale nie drugi.
W chwili pisania tego tekstu nie są dostępne żadne jednostki SKU AMD Zen 4. Jeśli pojawią się one w przyszłości, to prawdopodobnie będą występować pod nazwą modelu Inspiron 16 7645 2-w-1, który zastąpi oparty na AMD Inspiron 16 7635 2-w-1.
Konkurentami Inspirona 16 7640 2-w-1 są inne 16-calowe konwertowalne komputery ze średniej i wyższej półki, takie jak HP Envy x360 2-w-1 16 lub Lenovo Yoga 7 2-w-1 16. Dell jest jednak wyjątkowy dzięki opcji mini-LED.
Więcej recenzji Dell:
Potencjalni konkurenci w porównaniu
Ocena | Wersja | Data | Model | Waga | Wysokość | Rozmiar | Rezolucja | Cena |
|---|---|---|---|---|---|---|---|---|
| 82.1 % | v8 | 07/2024 | Dell Inspiron 16 7640 2-in-1 Ultra 7 155H, Arc 8-Core | 2.1 kg | 18.99 mm | 16.00" | 2560x1600 | |
| 83.4 % | v8 | 06/2024 | Dell Inspiron 16 Plus 7640 Ultra 7 155H, NVIDIA GeForce RTX 4060 Laptop GPU | 2.2 kg | 19.9 mm | 16.00" | 2560x1600 | |
| 87.2 % v7 (old) | v7 (old) | 05/2024 | HP Envy x360 2-in-1 16-ad0097nr R7 8840HS, Radeon 780M | 1.8 kg | 18.3 mm | 16.00" | 2880x1800 | |
| 87.9 % v7 (old) | v7 (old) | 05/2024 | Lenovo IdeaPad Pro 5 16IMH G9 Ultra 7 155H, Arc 8-Core | 1.9 kg | 17.5 mm | 16.00" | 2560x1600 | |
| 88.7 % v7 (old) | v7 (old) | 02/2024 | HP Pavilion Plus 16-ab0456tx i7-13700H, GeForce RTX 3050 6GB Laptop GPU | 1.9 kg | 19.9 mm | 16.00" | 2560x1600 | |
| 87.6 % v7 (old) | v7 (old) | 11/2023 | Asus VivoBook Pro 16 K6602VU i9-13900H, NVIDIA GeForce RTX 4050 Laptop GPU | 1.9 kg | 19 mm | 16.00" | 3200x2000 |
Wskazówka: Nasz system ocen został niedawno zaktualizowany, a wyniki wersji 8 nie są porównywalne z wynikami wersji 7. Dodatkowe informacje znajdą Państwo tutaj verfügbar.
Uwaga: Niedawno zaktualizowaliśmy nasz system oceniania i wyniki wersji 8 nie są porównywalne z wynikami wersji 7. Więcej informacji znajdą Państwo tutaj .
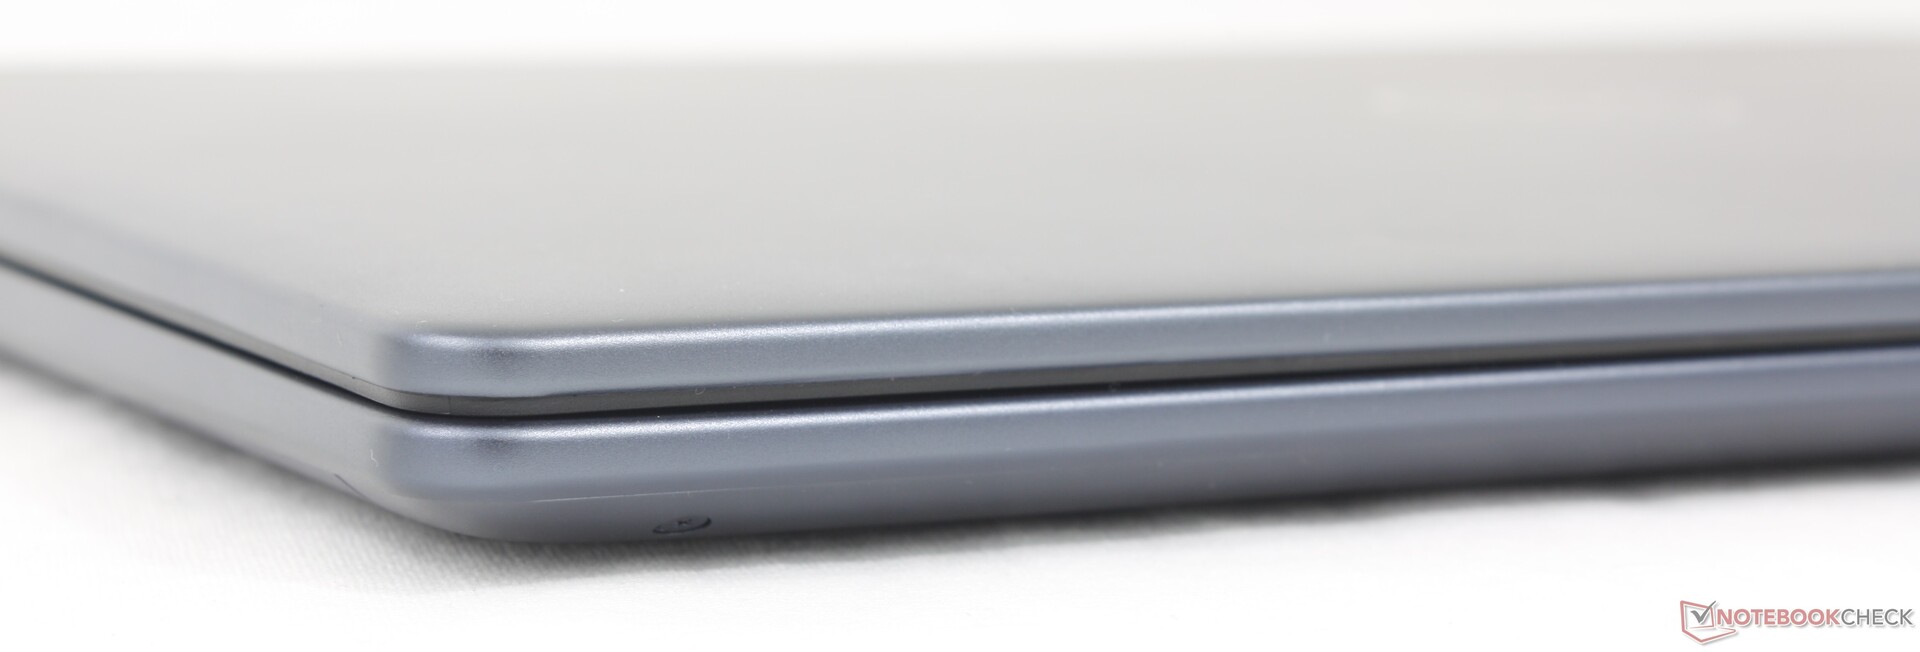
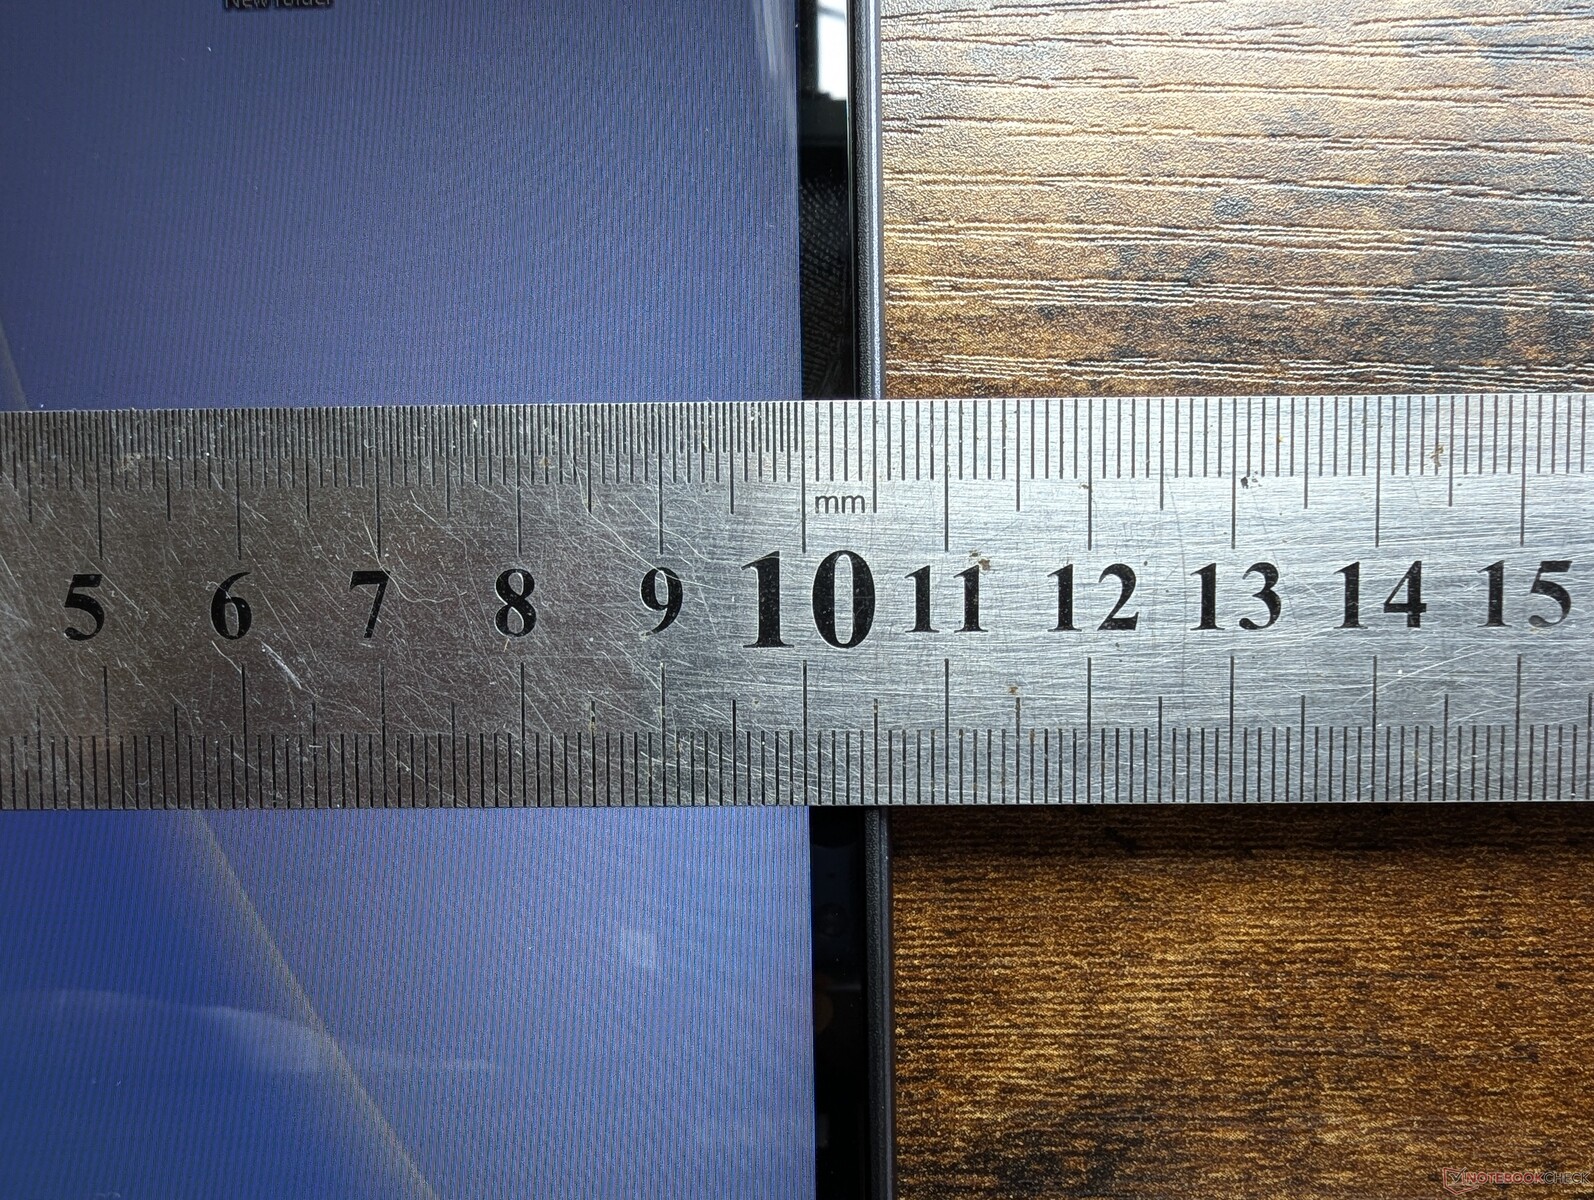
Obudowa - solidna, ale ciężka
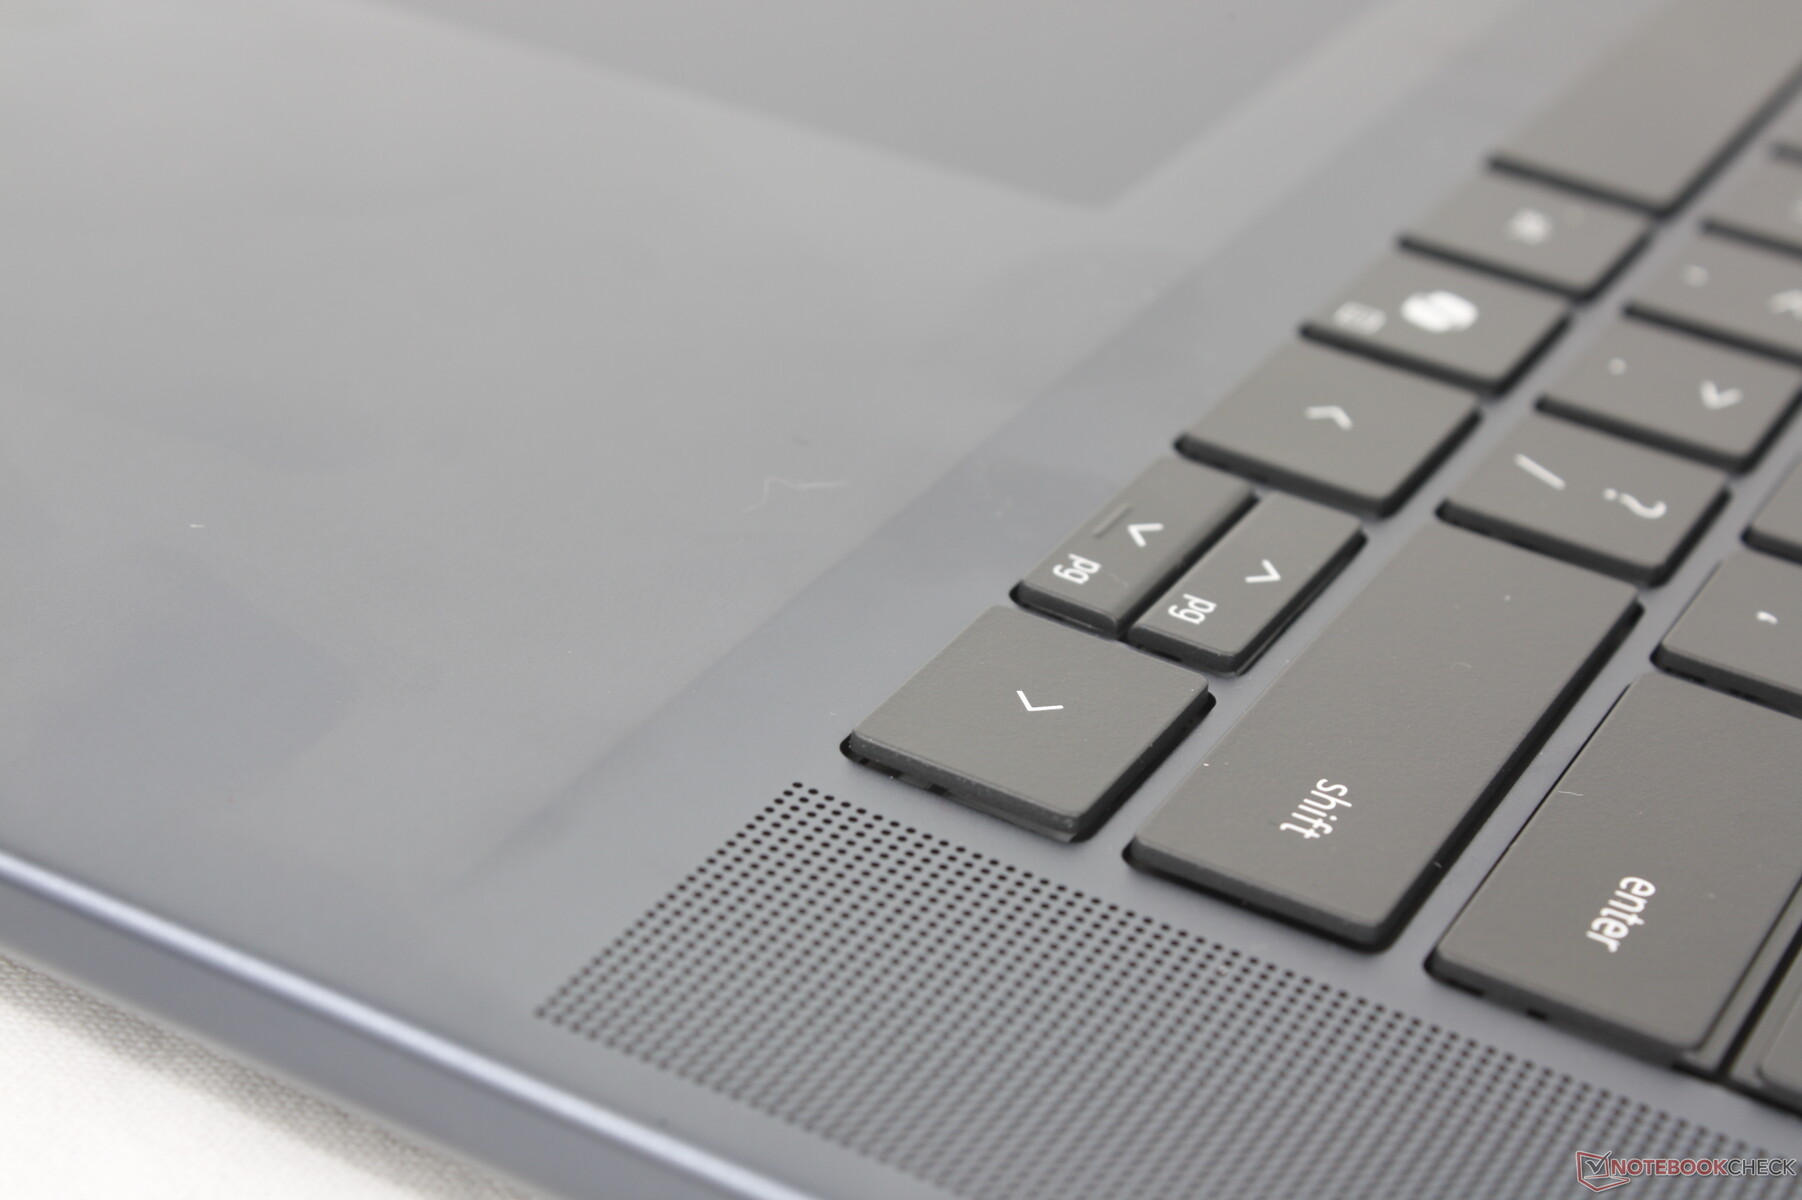
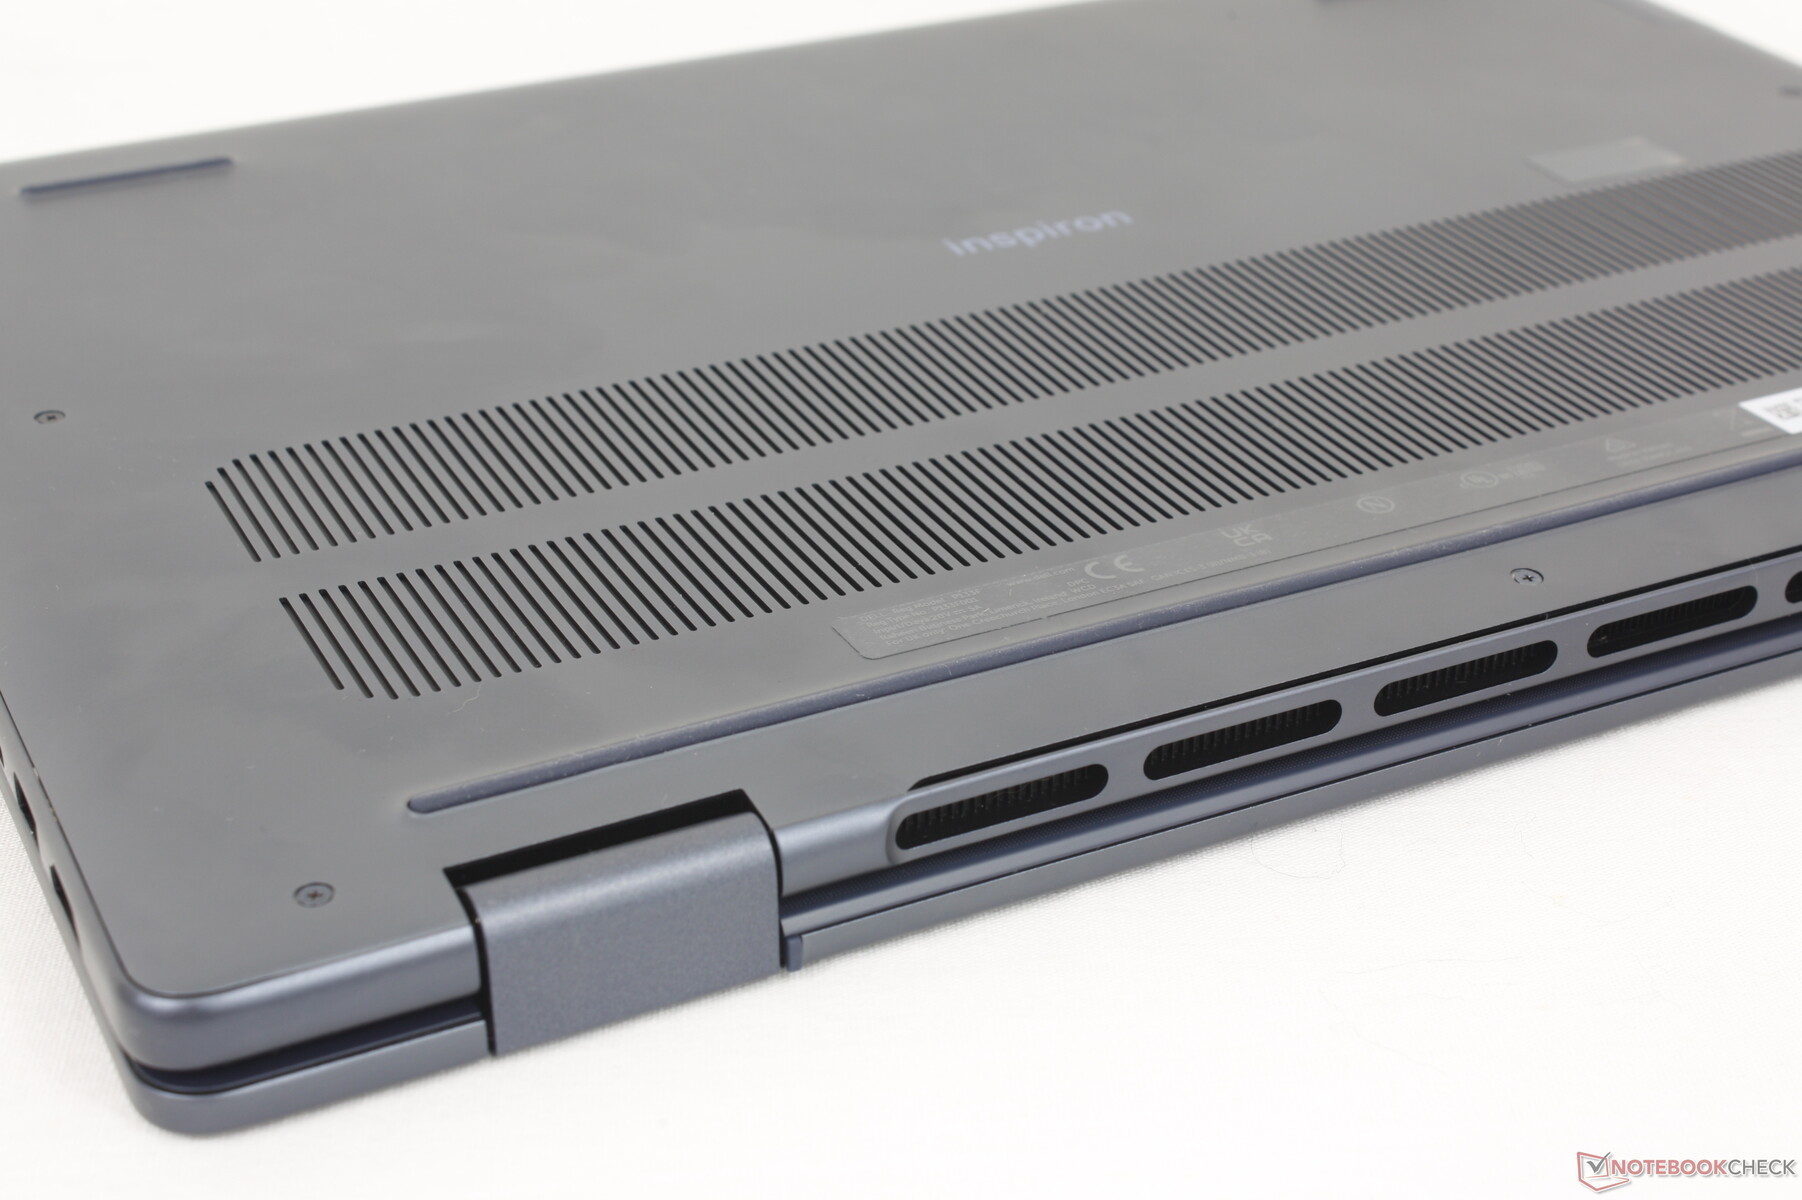
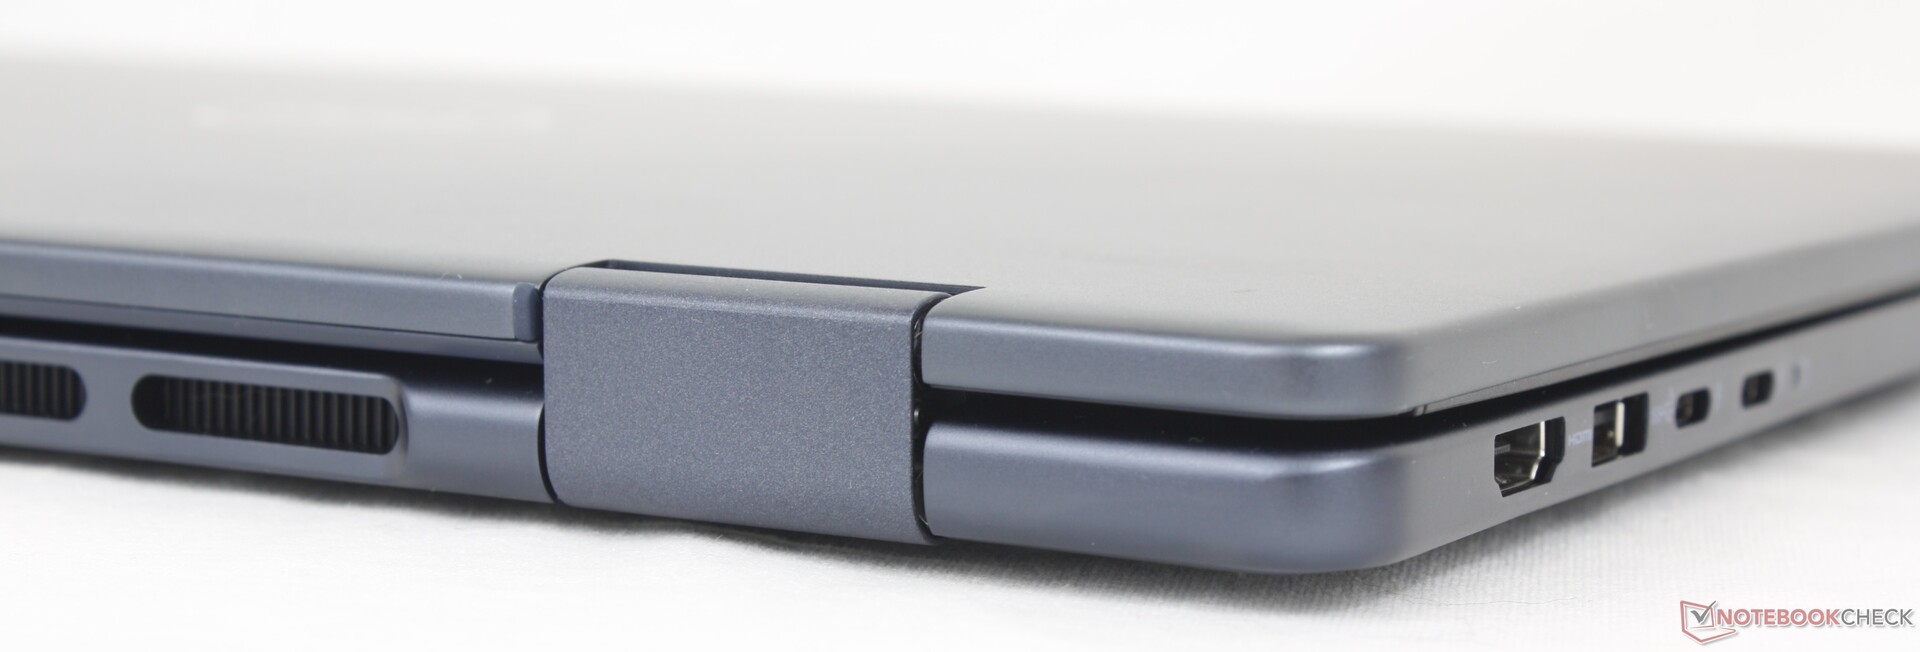
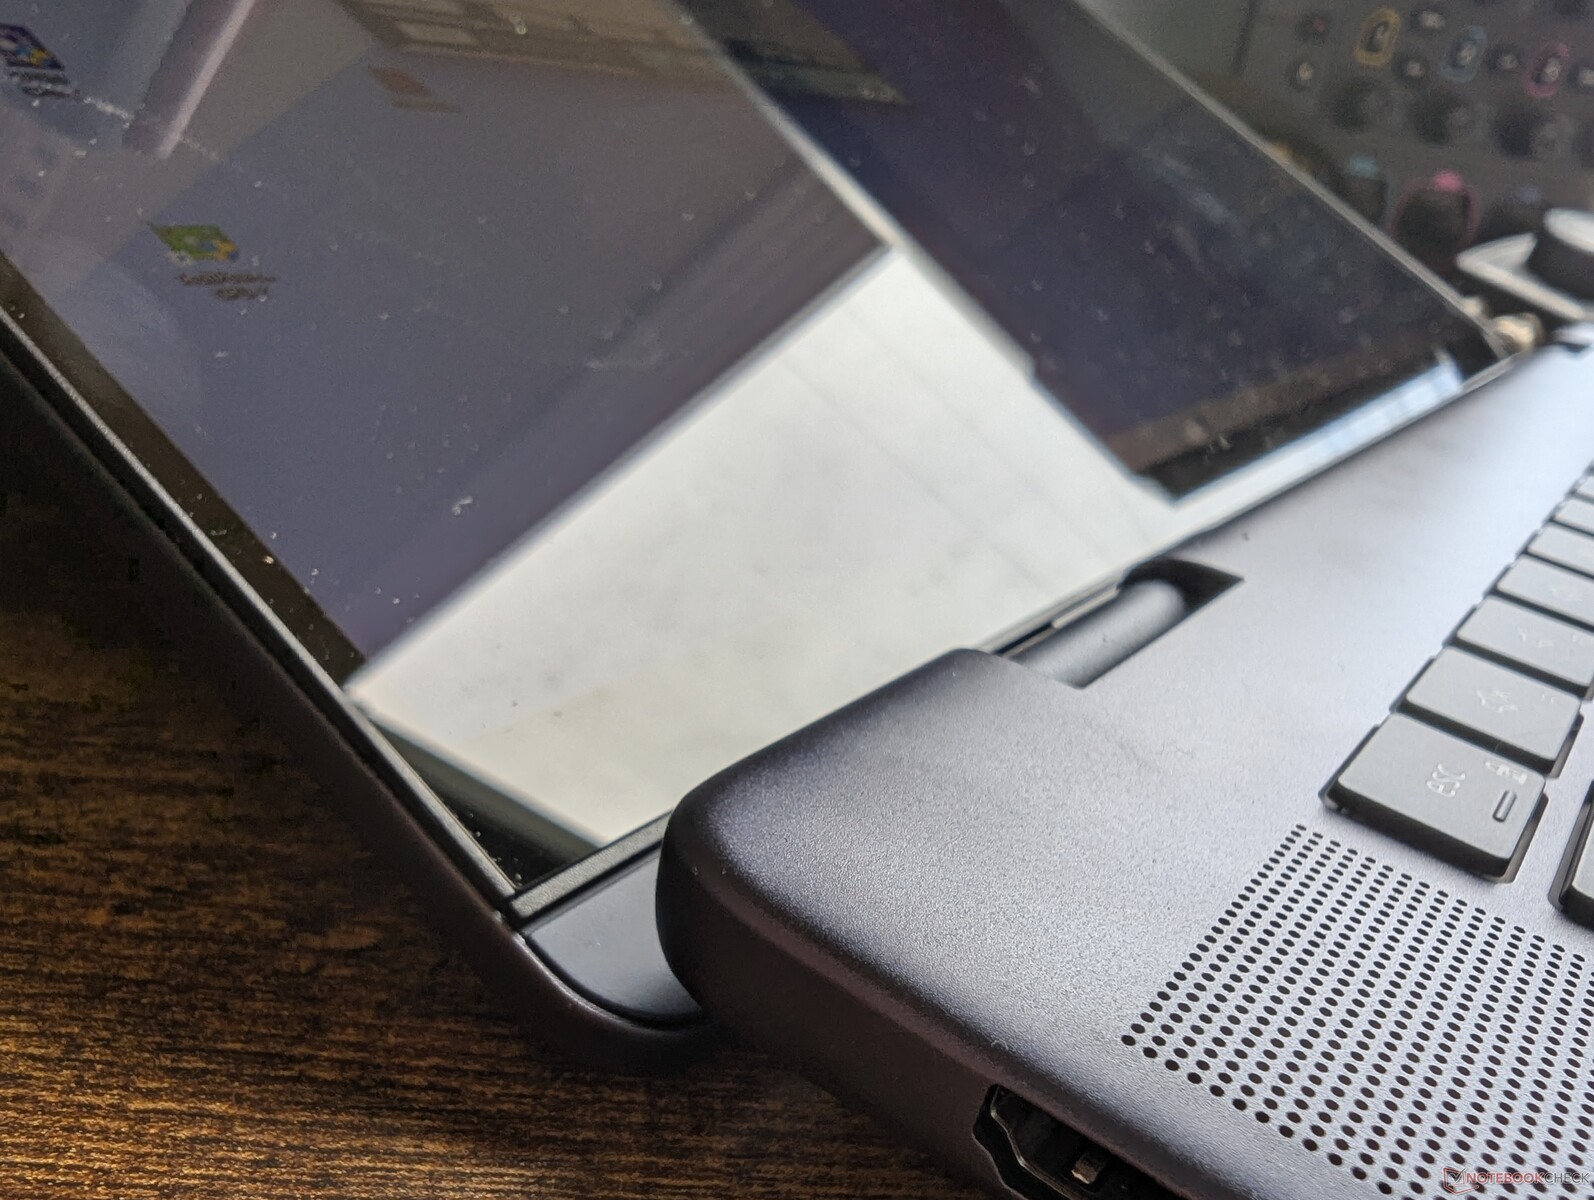
Istnieje kilka zmian zewnętrznych w stosunku do poprzedniego modelu. Po pierwsze, część podpórek pod nadgarstki nie jest już podniesiona, aby uzyskać czystszą krawędź między nią a klawiaturą. Po drugie, kratki wentylacyjne wzdłuż dolnej i tylnej krawędzi zostały przeprojektowane, aby były nieco większe. Po trzecie, sama tylna krawędź jest odważniejsza, aby uzyskać bardziej pudełkowy wygląd.
Poza powyższymi zmianami estetycznymi, materiały obudowy pozostają takie same jak wcześniej, bez większych ulepszeń, jeśli chodzi o sztywność lub jakość. Pokrywa i podstawa nadal składają się odpowiednio z aluminium i plastiku, z dobrą odpornością na skręcanie i wgłębienia, co zapewnia solidne pierwsze wrażenia, szczególnie w przypadku modelu ze średniej półki. Nie jesteśmy tak bardzo zaniepokojeni jakością wykonania modelu, jak tym, jak ciężki jest on w trybie tabletu.
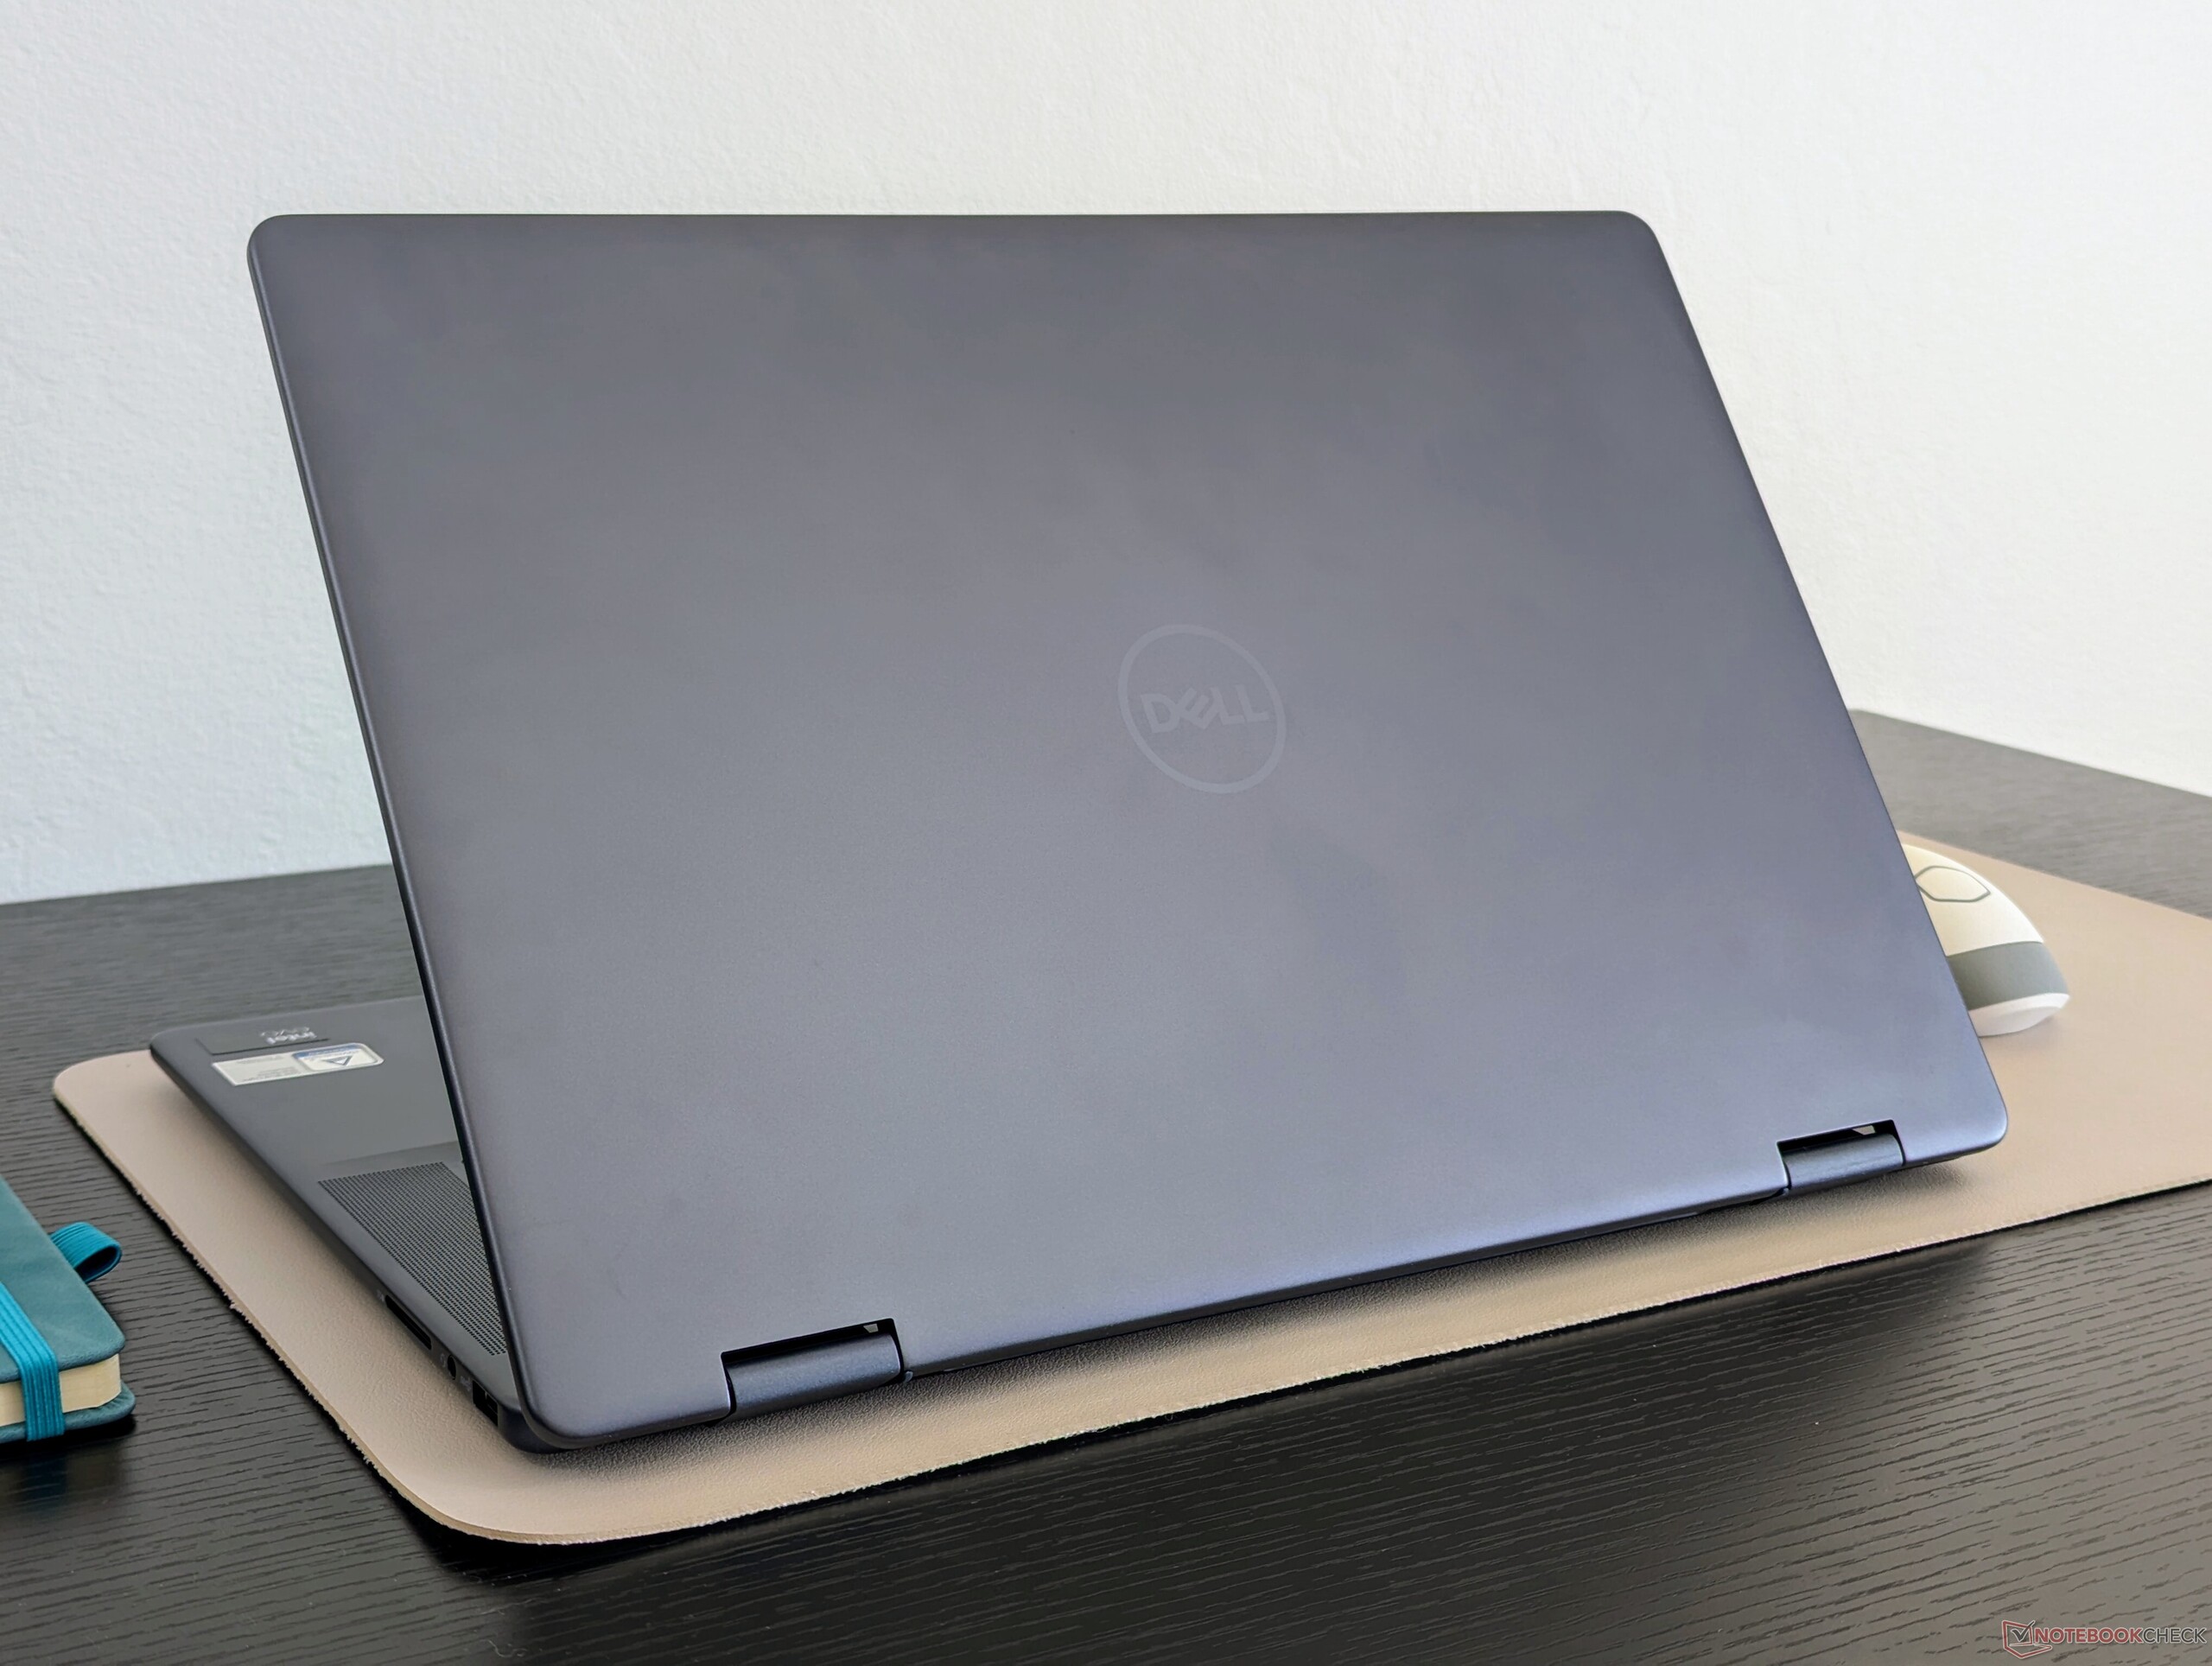
Zarówno wymiary, jak i waga są prawie dokładnie takie same, jak w przypadku modeli 2023 Inspiron 16 7630 2-w-1 i 2024 Inspiron 16 Plus 7640 clhell 2024 Inspiron 16 Plus 7640 clamshell mimo że ten ostatni zawiera opcję dyskretnego GPU. Wolelibyśmy lżejszą konstrukcję, ponieważ 16-calowy HP Envy x360 16 i Samsung Galaxy Book4 Pro 360 są zauważalnie lżejsze od naszego Della. Podczas gdy 16-calowy kabriolet będzie stosunkowo ciężki bez względu na wszystko, Inspiron 16 7640 2-w-1 jest prawdopodobnie jednym z najgorszych w podróży.
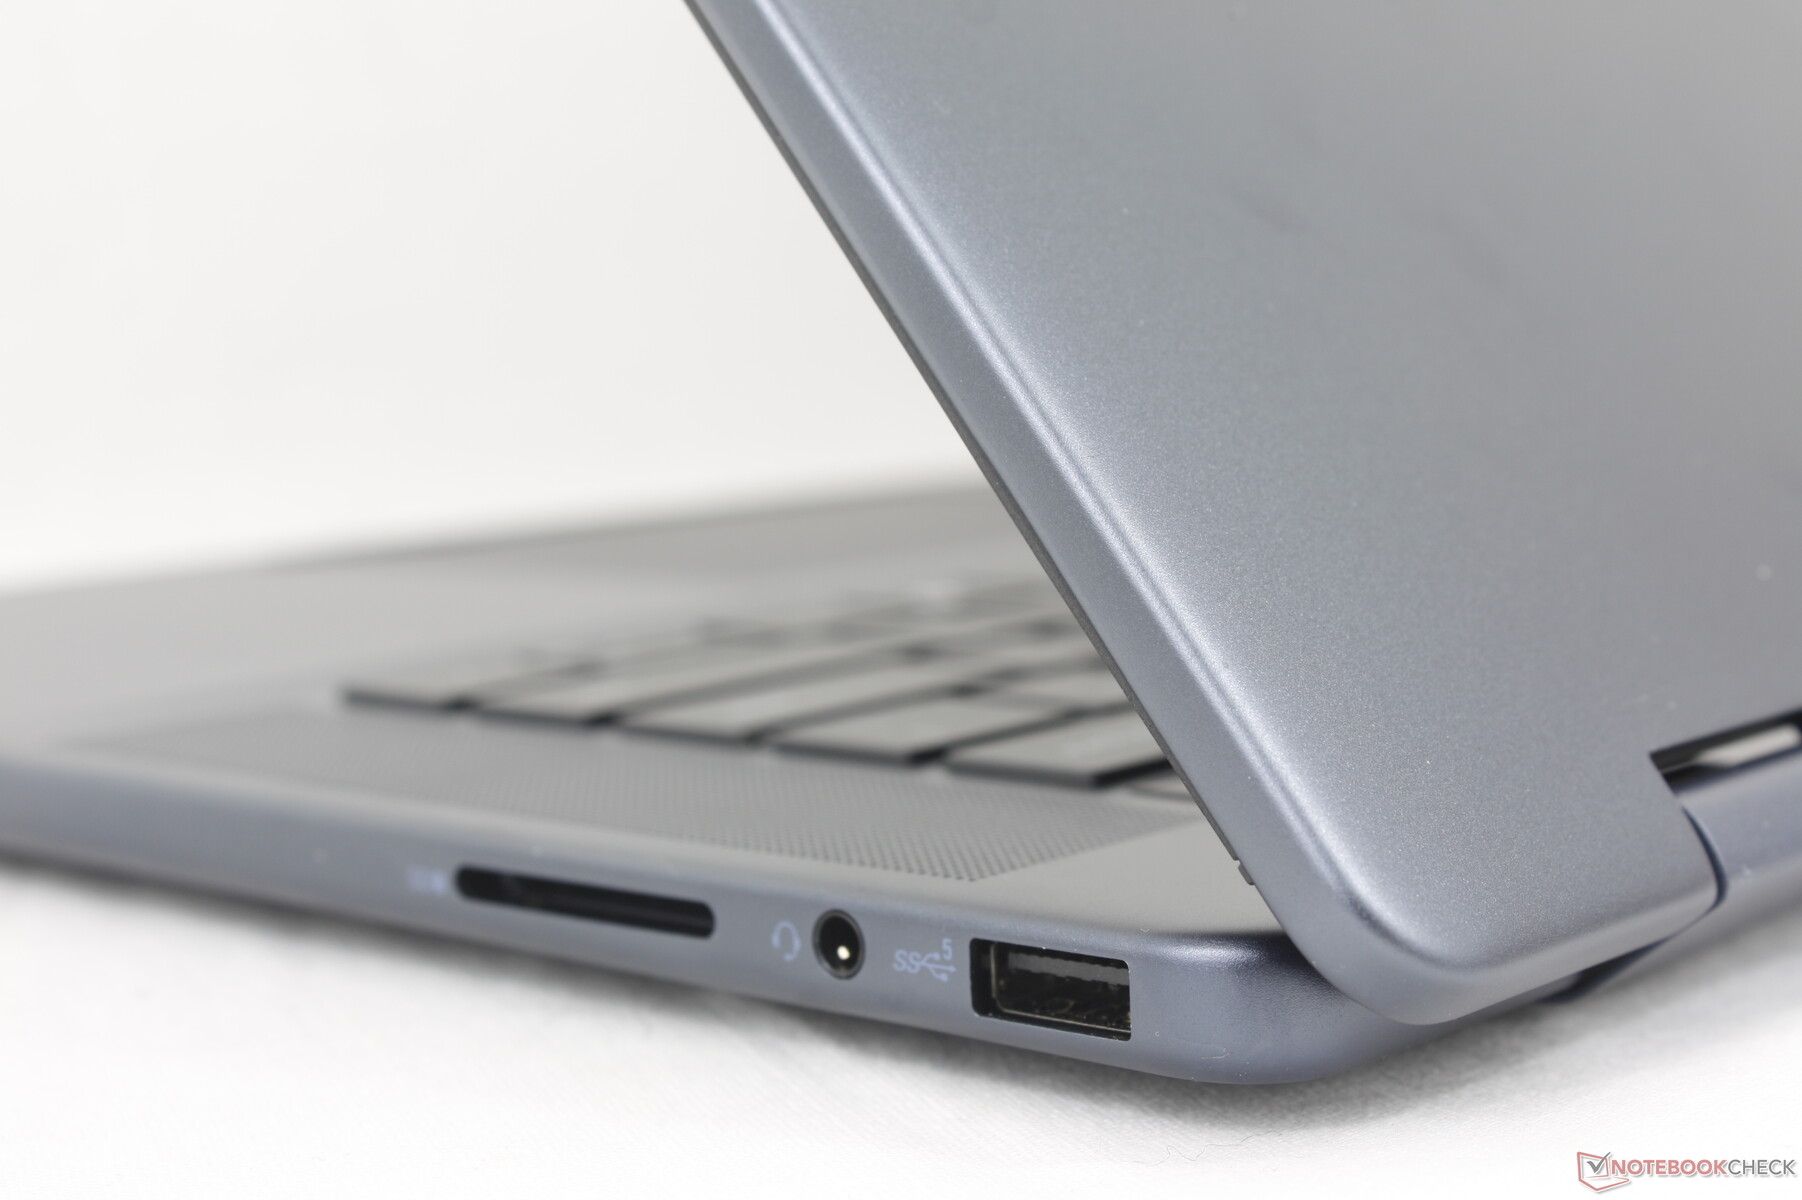

Łączność
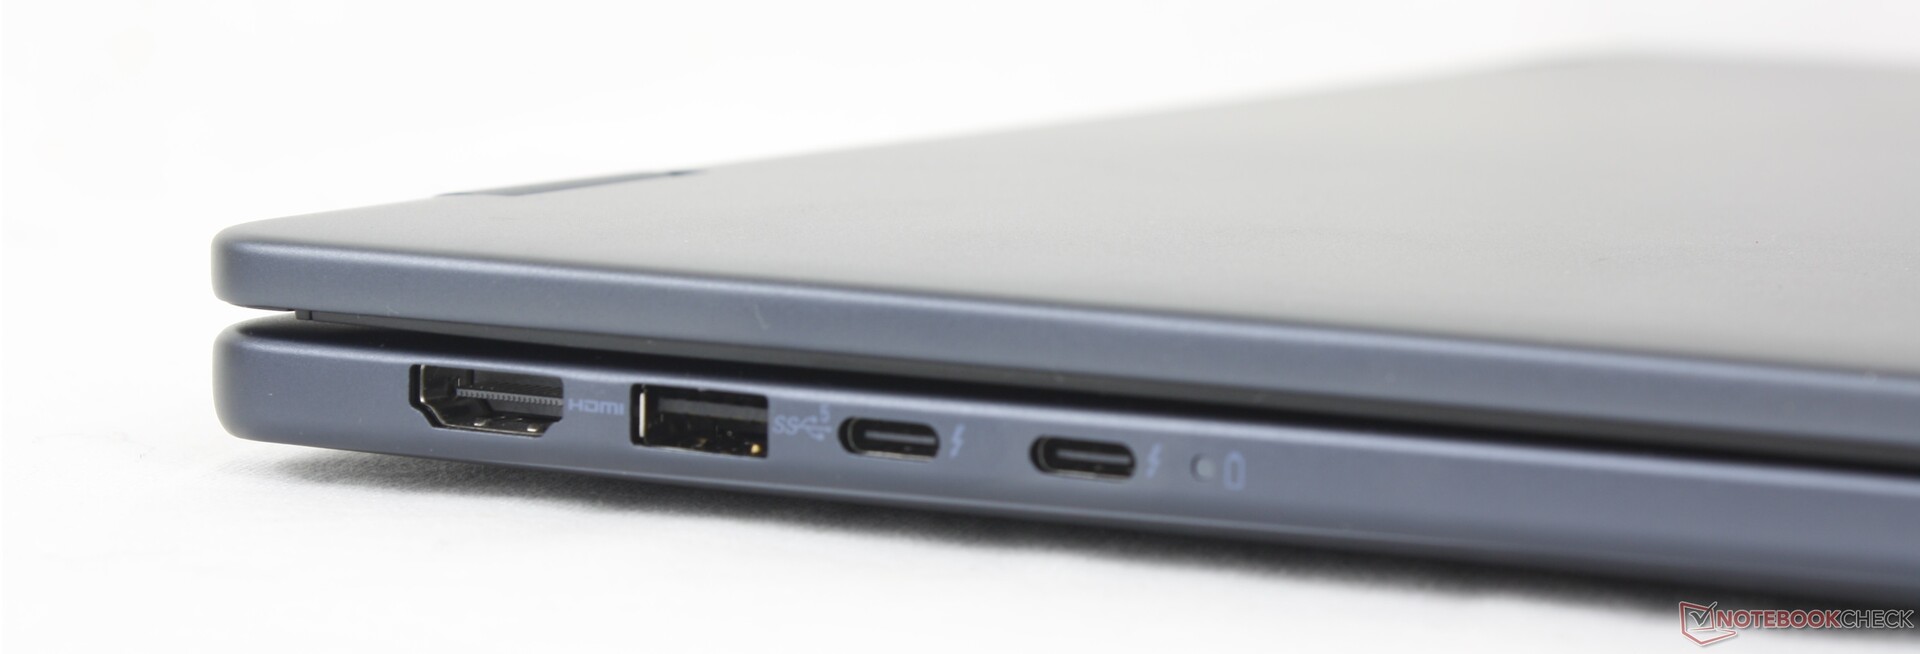
Opcje portów i ich rozmieszczenie pozostają identyczne jak w Inspiron 16 7635 2-w-1 lub 7630 2-w-1 pomimo licznych zmian zewnętrznych. Proszę zauważyć, że Thunderbolt 4 jest ponownie dostępny tylko w jednostkach SKU Intela, a port HDMI nadal jest tylko w wersji 1.4.
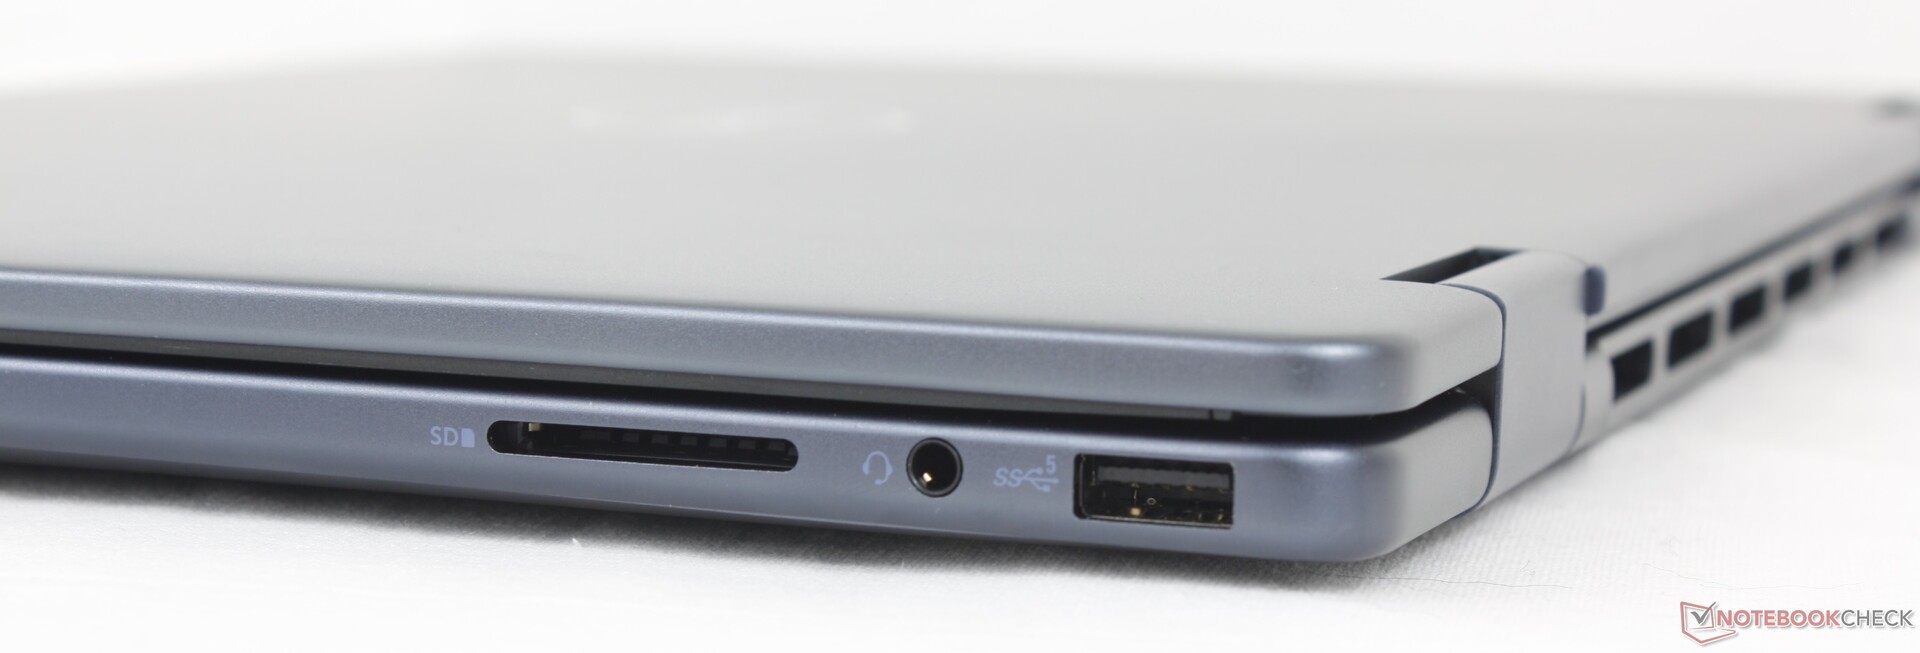
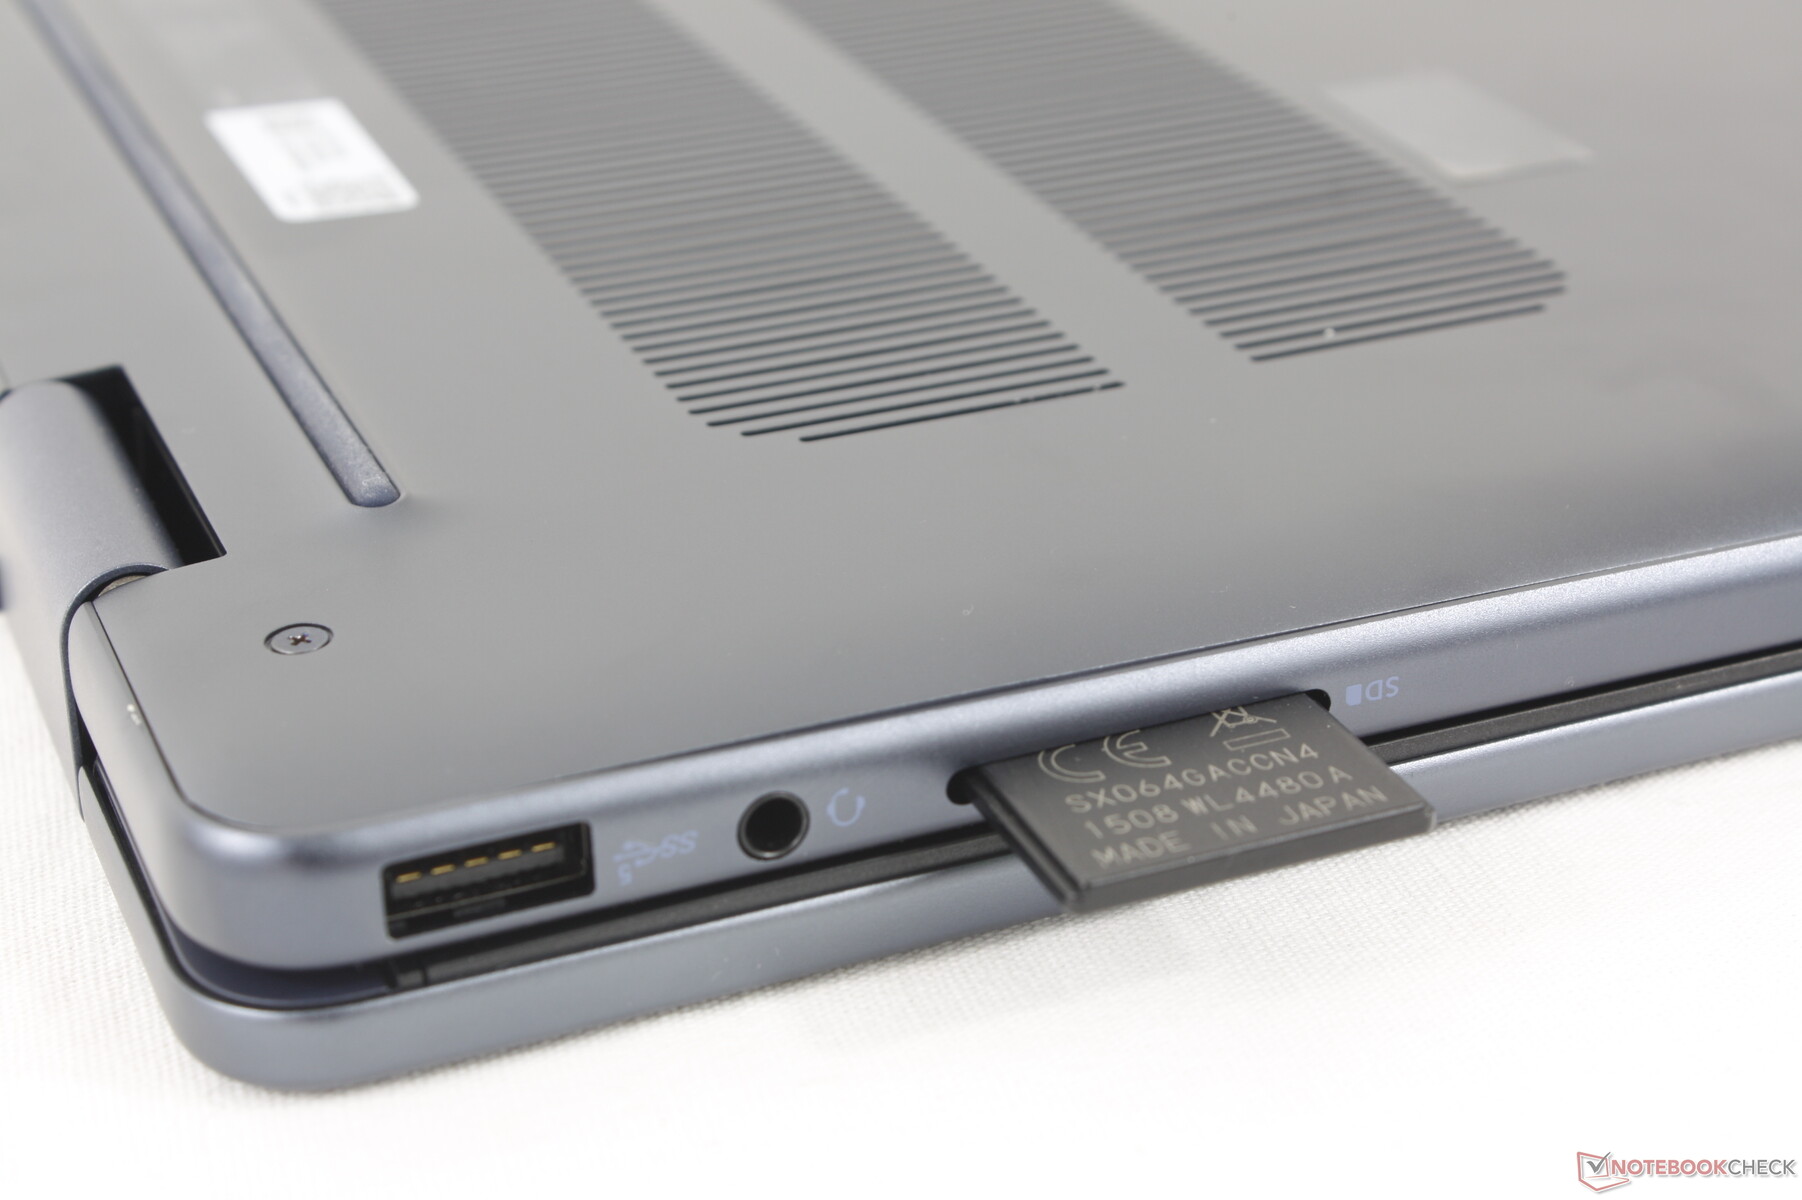
Czytnik kart SD
Szybkość transferu za pomocą zintegrowanego czytnika kart SD nie uległa poprawie w stosunku do zeszłorocznego modelu i wynosi nieco poniżej 30 MB/s. 16-calowe clamshelle, takie jak Lenovo IdeaPad Pro 5 16, mogą być ponad 2x szybsze, a XPS 16 jest jeszcze szybszy. Użytkownicy, którzy polegają na kartach SD, mogą docenić poręczny zintegrowany czytnik kart w Inspironie, ale prawdopodobnie będą również rozczarowani niskimi prędkościami.
| SD Card Reader | |
| average JPG Copy Test (av. of 3 runs) | |
| Samsung Galaxy Book4 Pro 360 (Angelbird AV Pro V60) | |
| Lenovo IdeaPad Pro 5 16IMH G9 (Angelbird AV Pro V60) | |
| Dell Inspiron 16 7635 2-in-1 (PNY EliteX-Pro60 V60 256 GB) | |
| Dell Inspiron 16 7640 2-in-1 (Toshiba Exceria Pro SDXC 64 GB UHS-II) | |
| Dell Inspiron 16 Plus 7640 (Angelbird AV Pro V60) | |
| maximum AS SSD Seq Read Test (1GB) | |
| Lenovo IdeaPad Pro 5 16IMH G9 (Angelbird AV Pro V60) | |
| Samsung Galaxy Book4 Pro 360 (Angelbird AV Pro V60) | |
| Dell Inspiron 16 7635 2-in-1 (PNY EliteX-Pro60 V60 256 GB) | |
| Dell Inspiron 16 7640 2-in-1 (Toshiba Exceria Pro SDXC 64 GB UHS-II) | |
| Dell Inspiron 16 Plus 7640 (Angelbird AV Pro V60) | |
Komunikacja
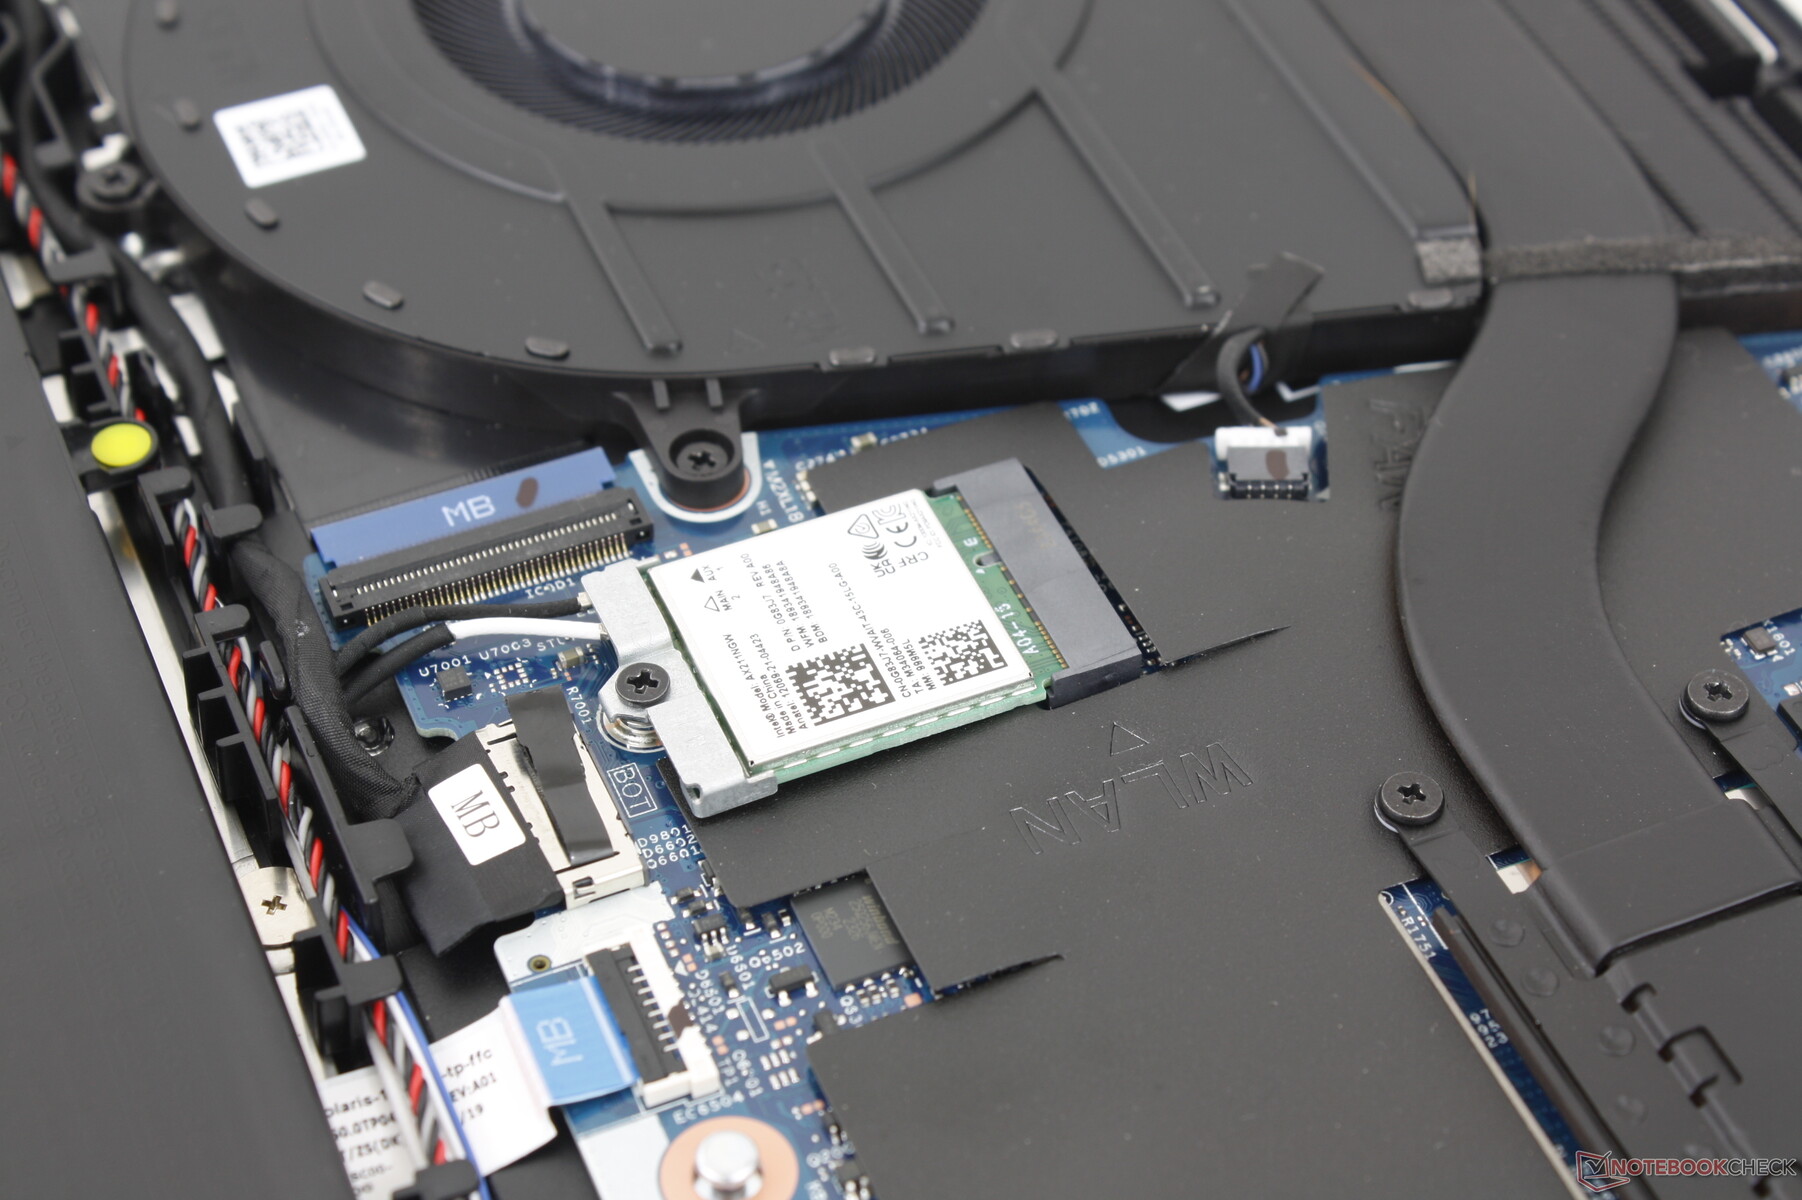
Model ten jest dostarczany z tym samym modułem WLAN Intel AX211, który można znaleźć w Inspiron 16 7640 clamshell do łączności Wi-Fi 6E i Bluetooth 5.3. Wydajność jest stabilna po sparowaniu z naszym routerem testowym Asus AXE11000, ale szybkość transferu w sieci 6 GHz mogłaby być szybsza.
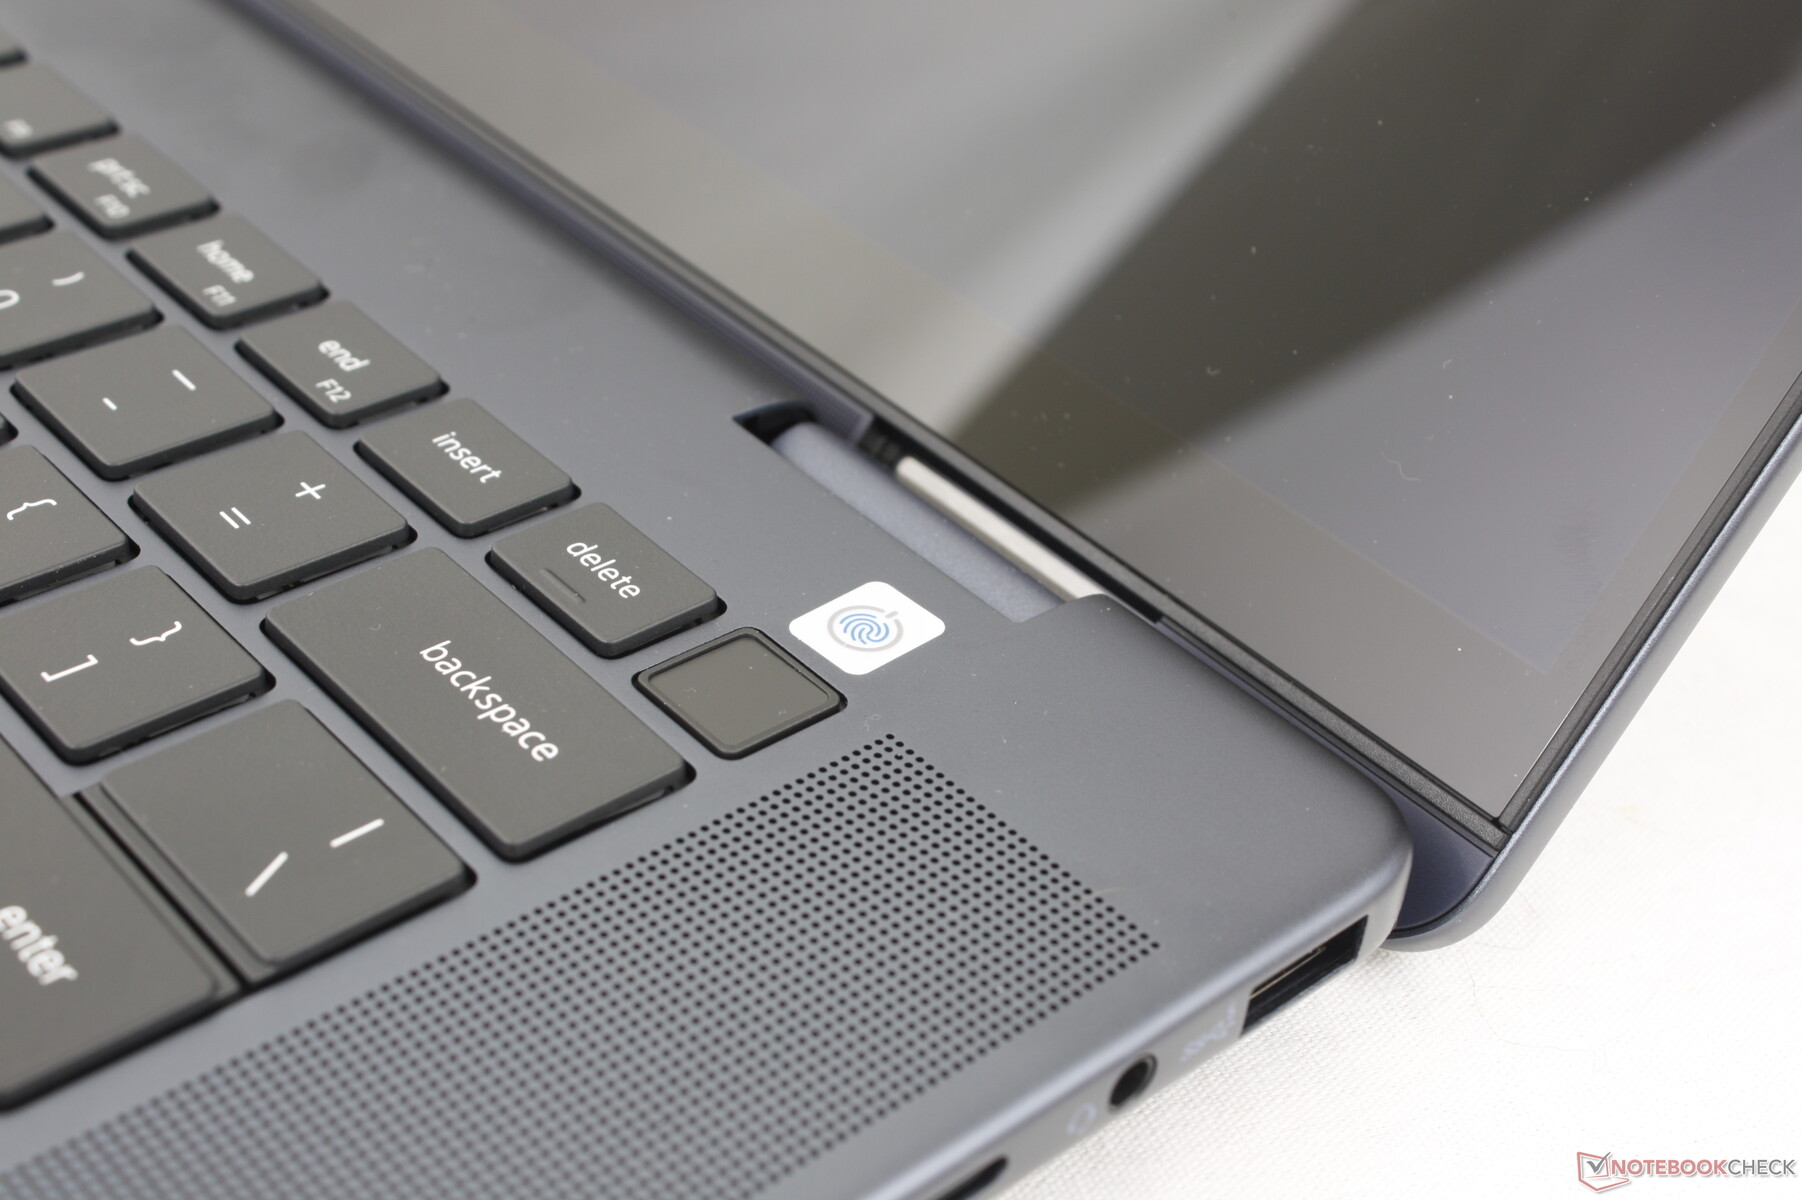
Kamera internetowa
Kamera internetowa 2 MP jest standardowo wyposażona w czujnik podczerwieni i fizyczną migawkę.


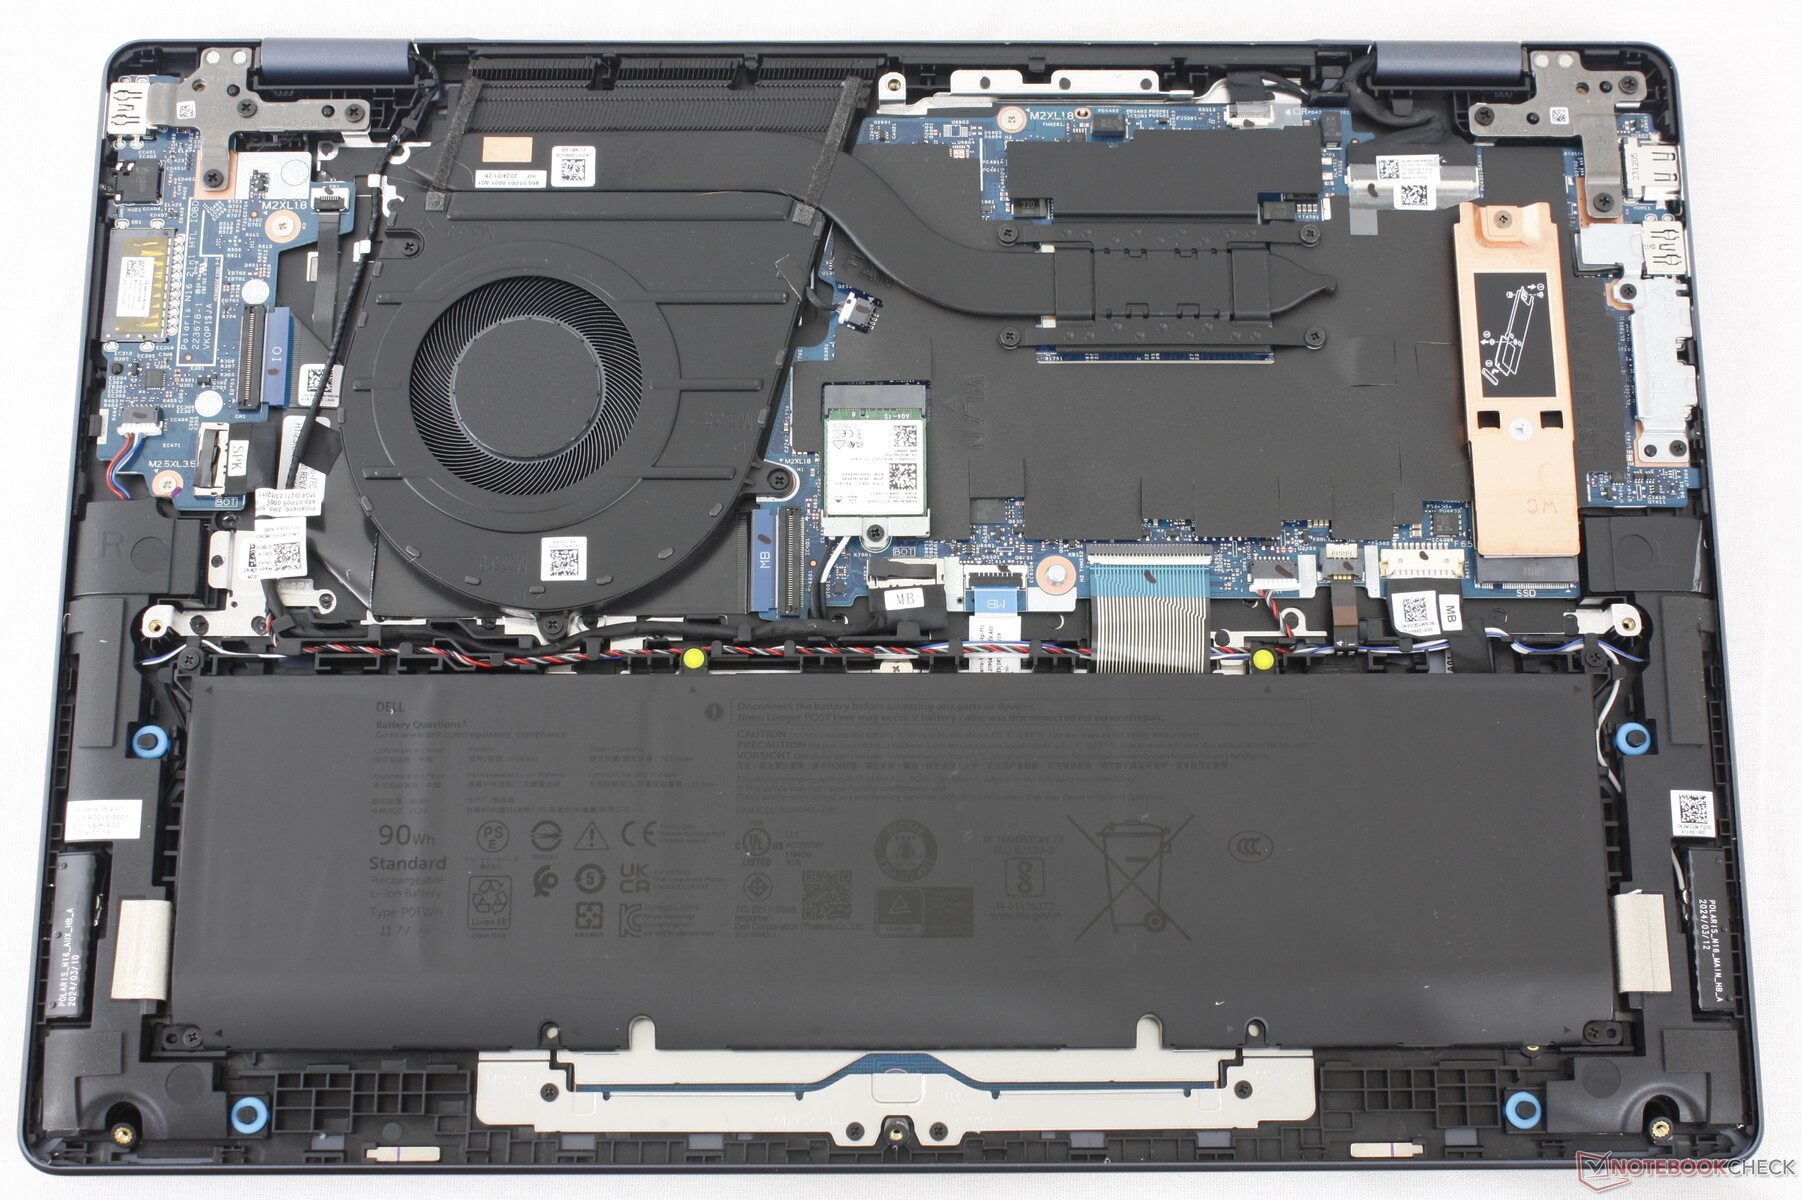
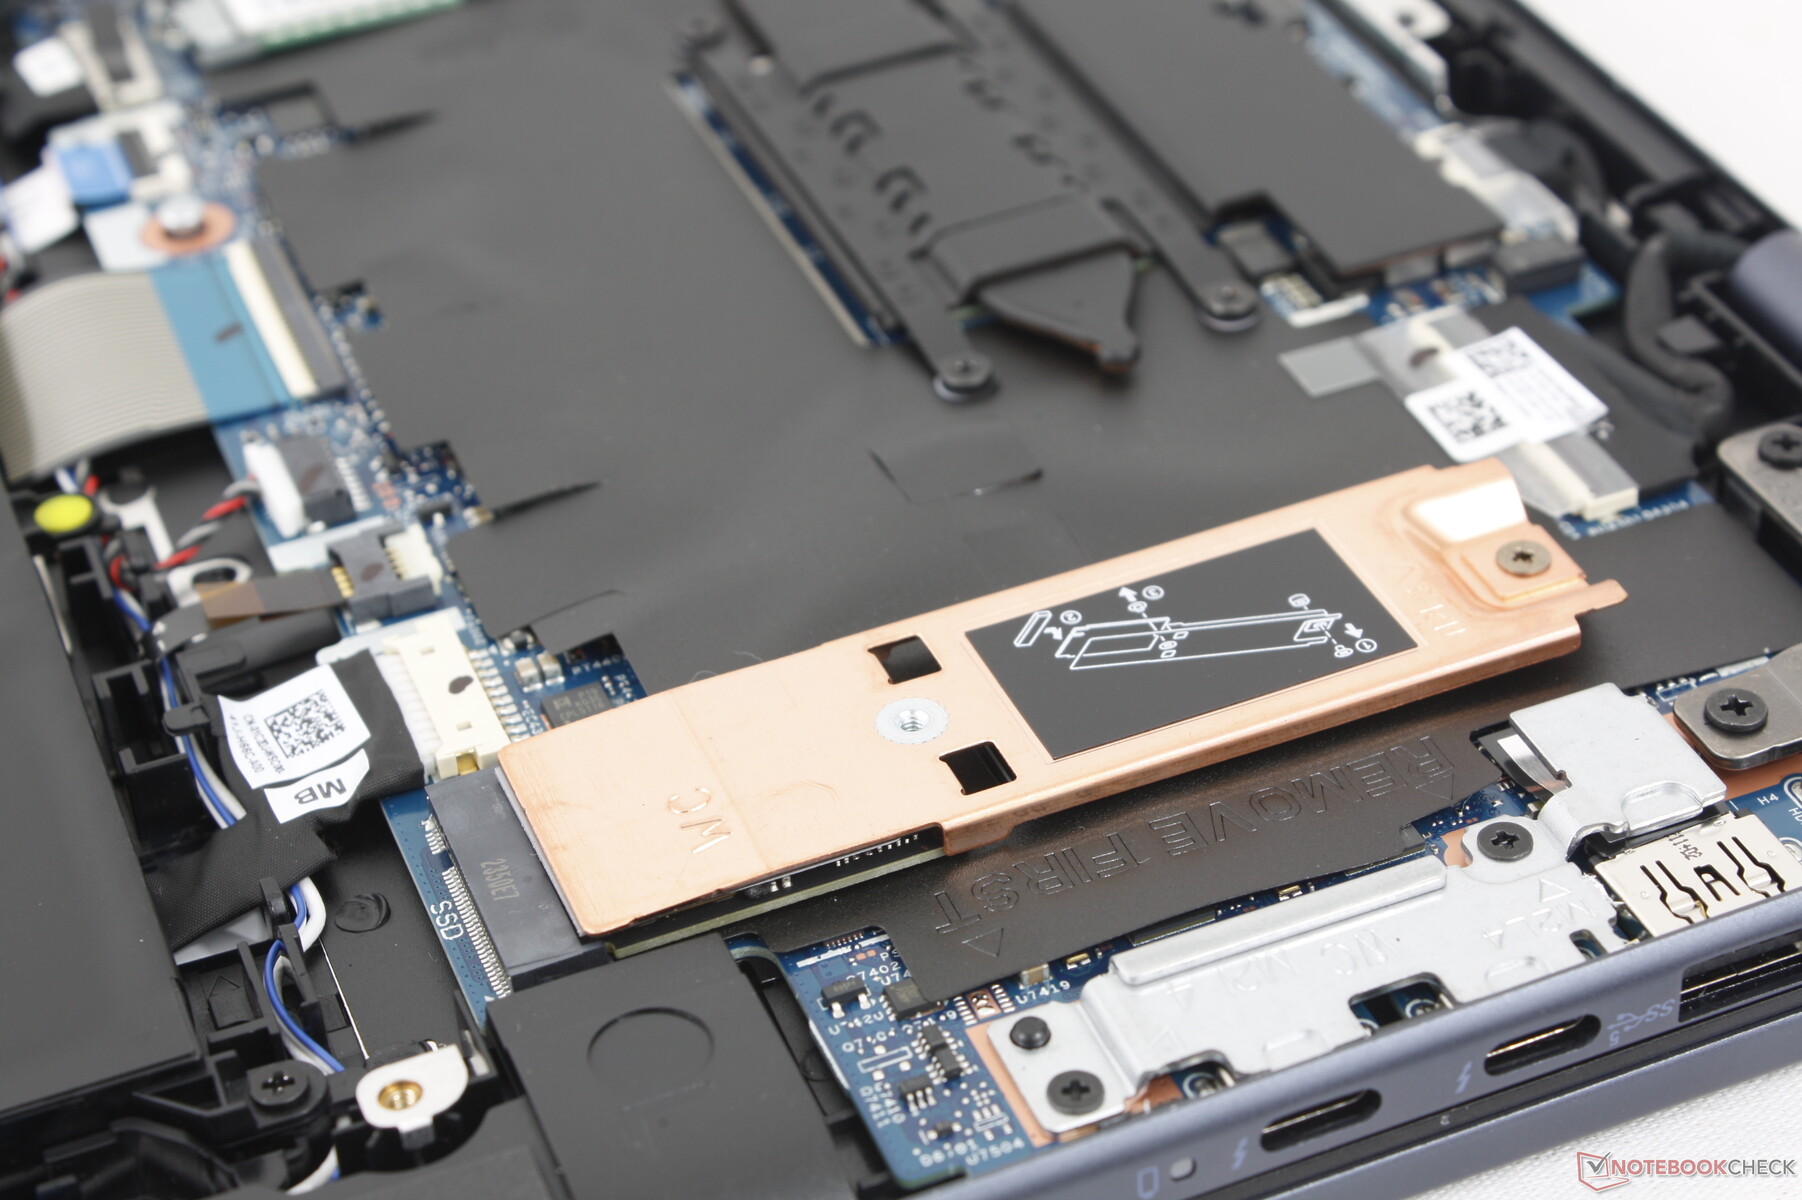
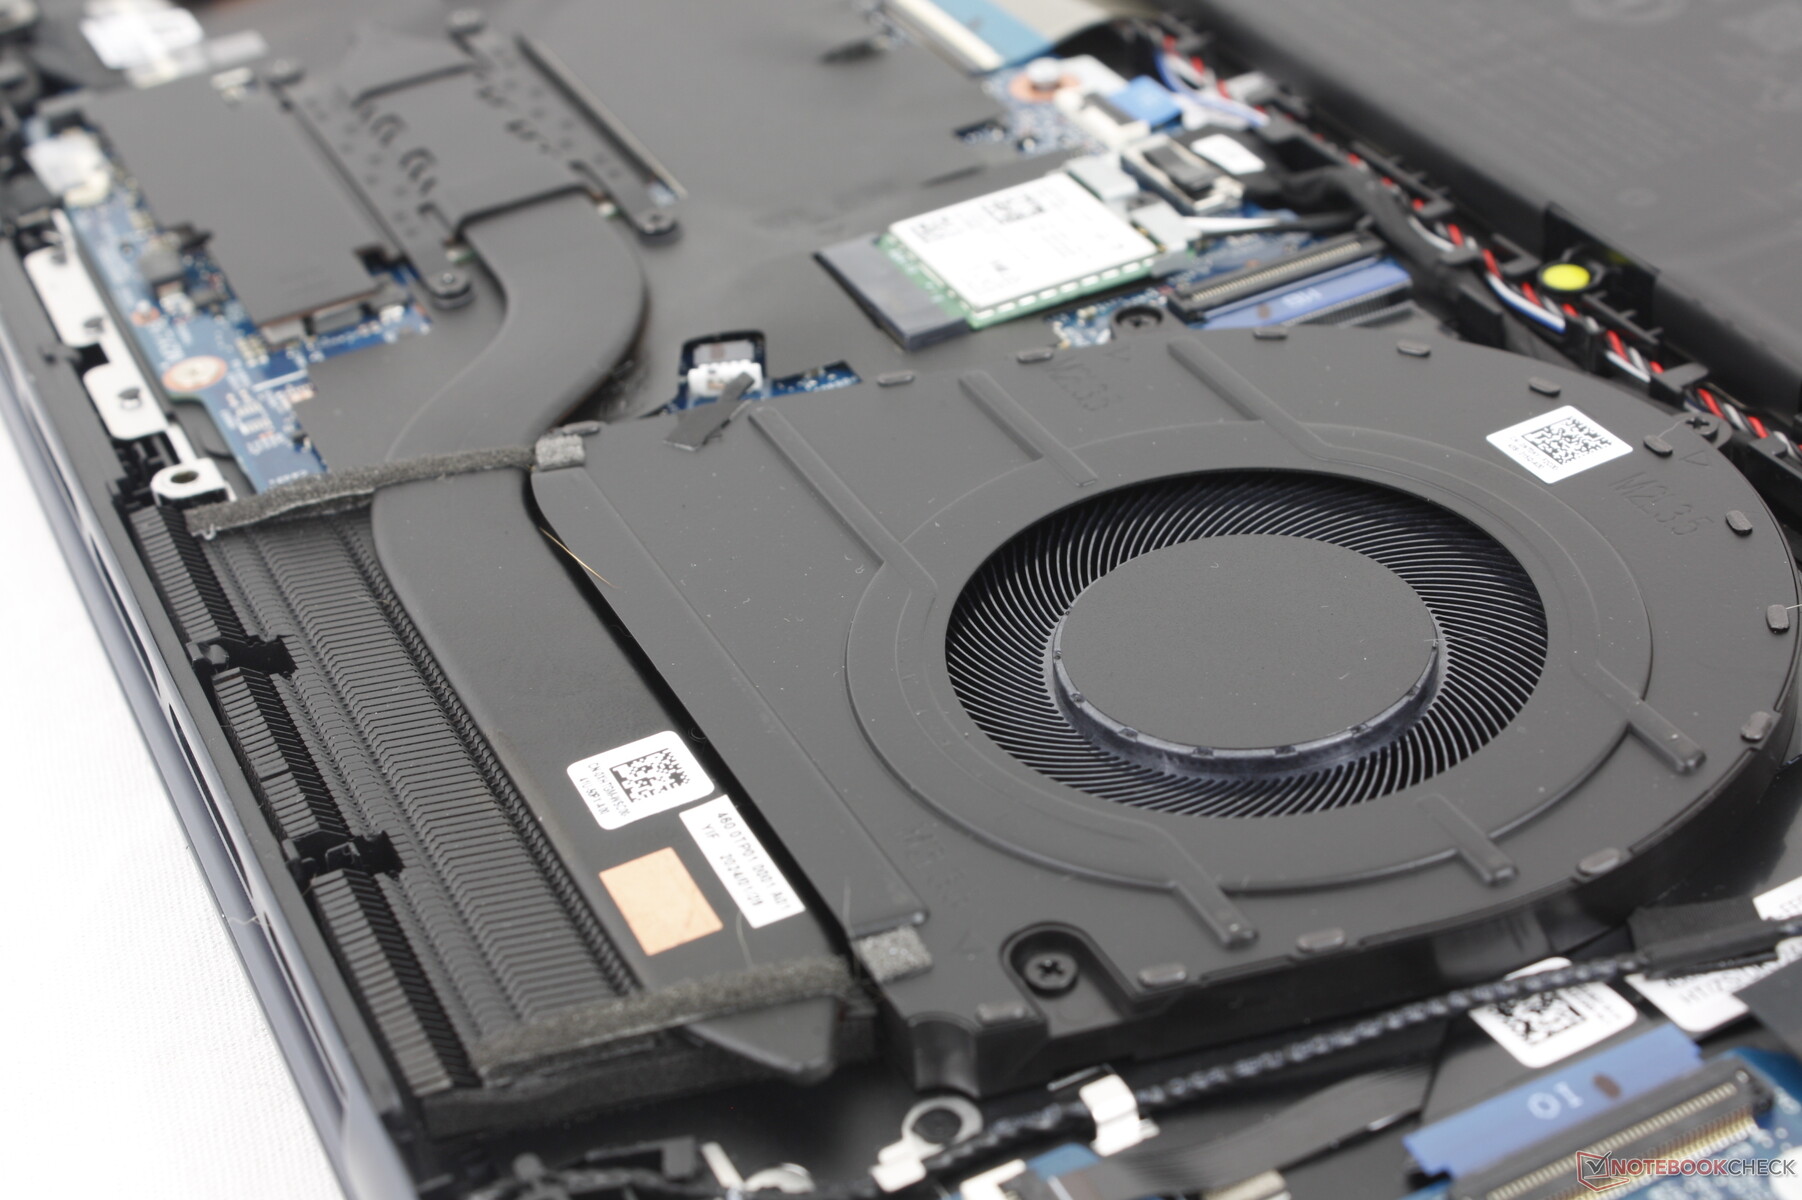
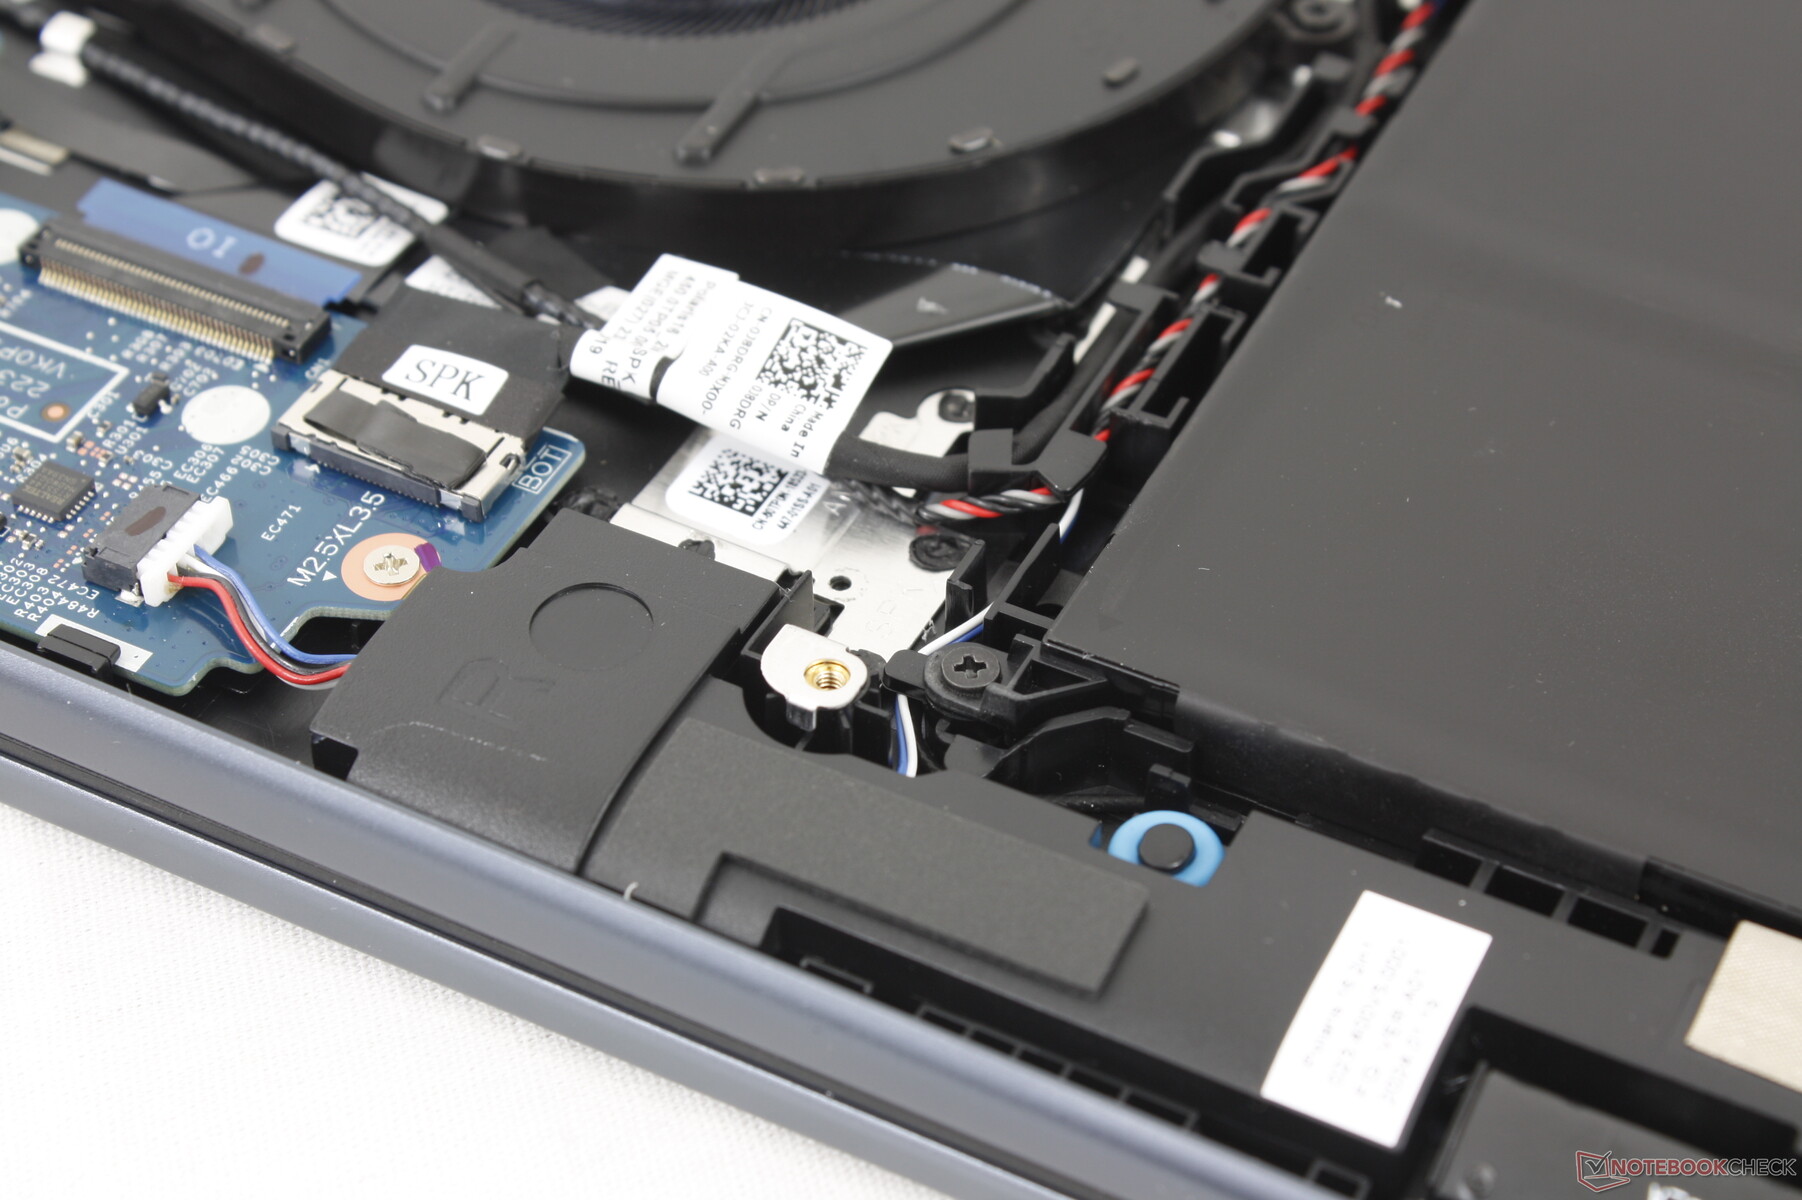
Konserwacja
Istnieje kilka wewnętrznych różnic między naszym modelem a zeszłorocznym Inspironem 16 7635 2-w-1. W szczególności dysk SSD został przesunięty, aby zrobić miejsce dla większego wentylatora i baterii, podczas gdy rurka cieplna jest teraz nieco grubsza, aby zrekompensować mniejszą długość. Dodatkowe dyski SSD nadal nie są obsługiwane, a pamięć RAM nie może być rozbudowywana przez użytkownika.

Akcesoria i gwarancja
Pudełko detaliczne zawiera aktywny rysik (PN5122W) oprócz dokumentacji i zasilacza sieciowego. Standardowa roczna ograniczona gwarancja ma zastosowanie w przypadku zakupu w USA.
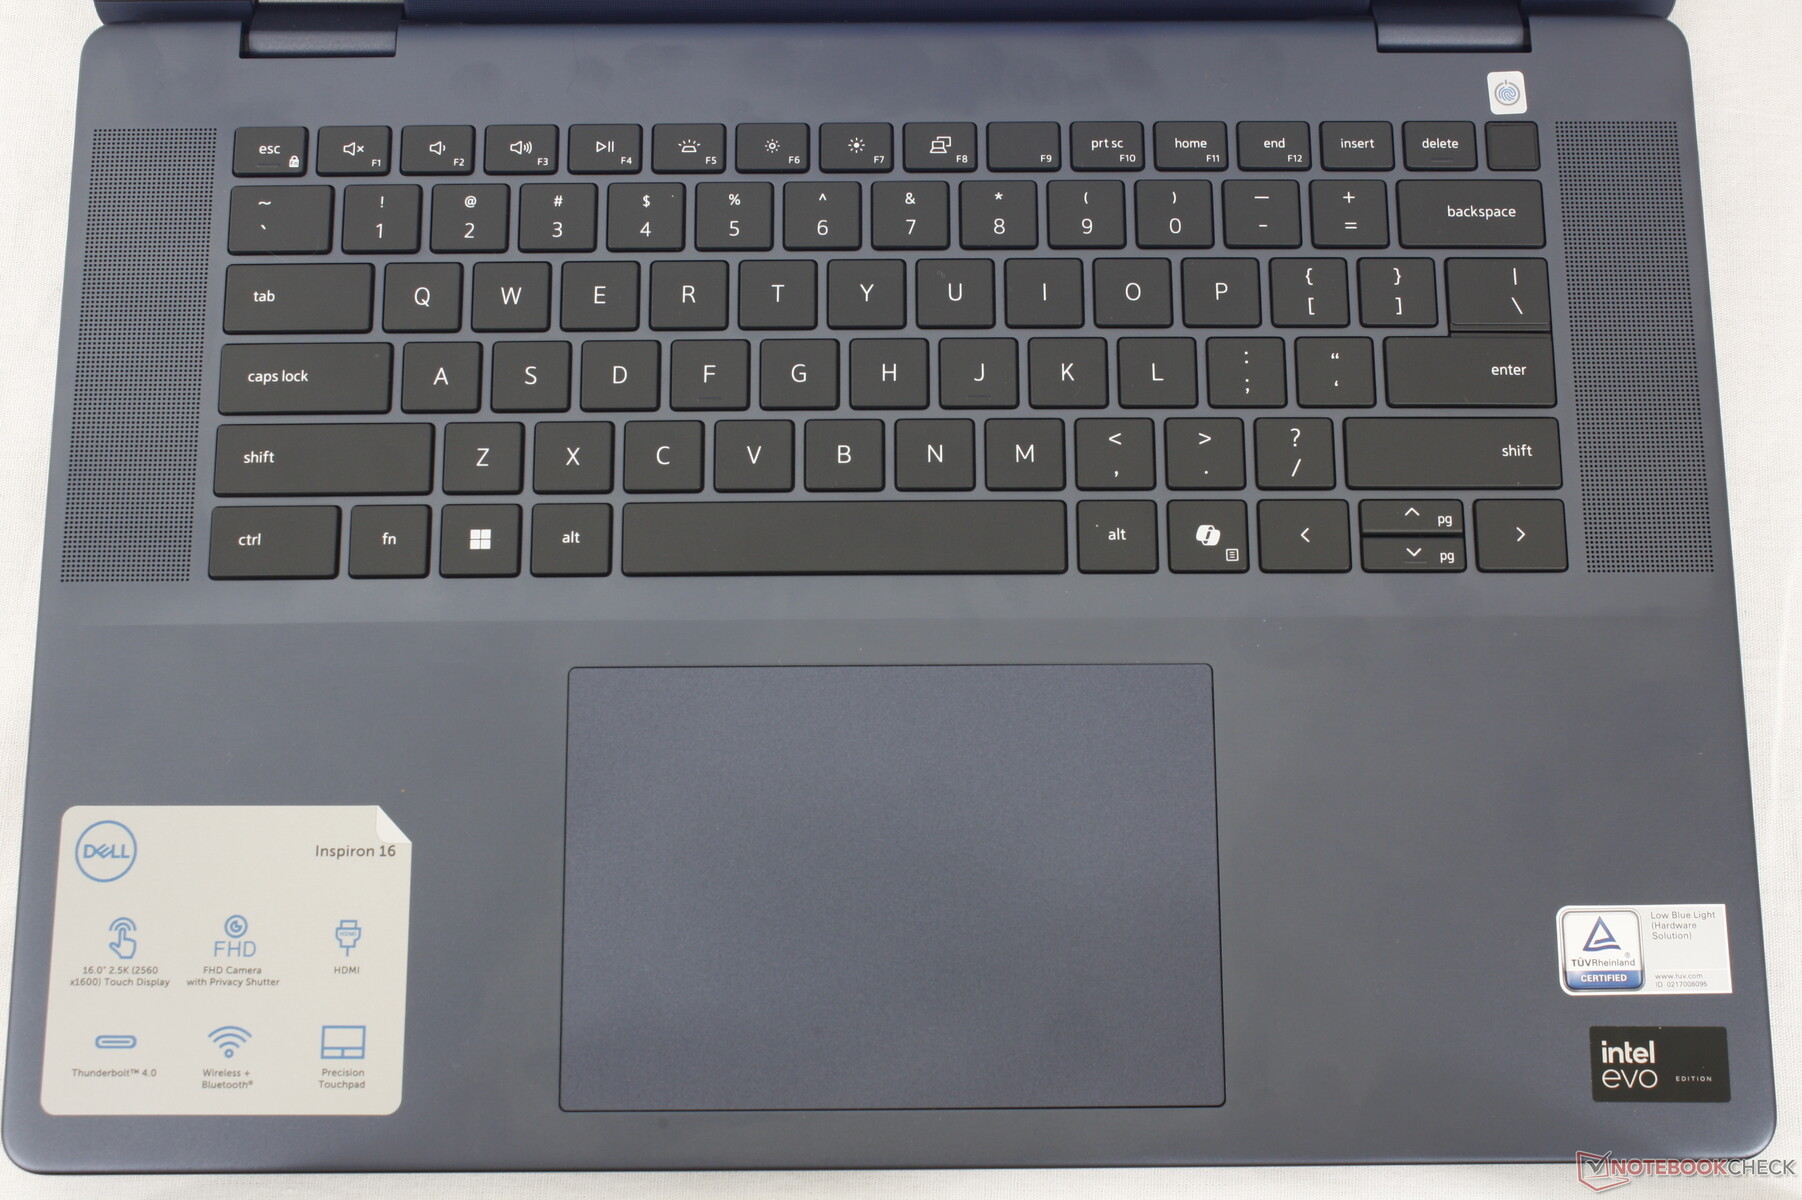
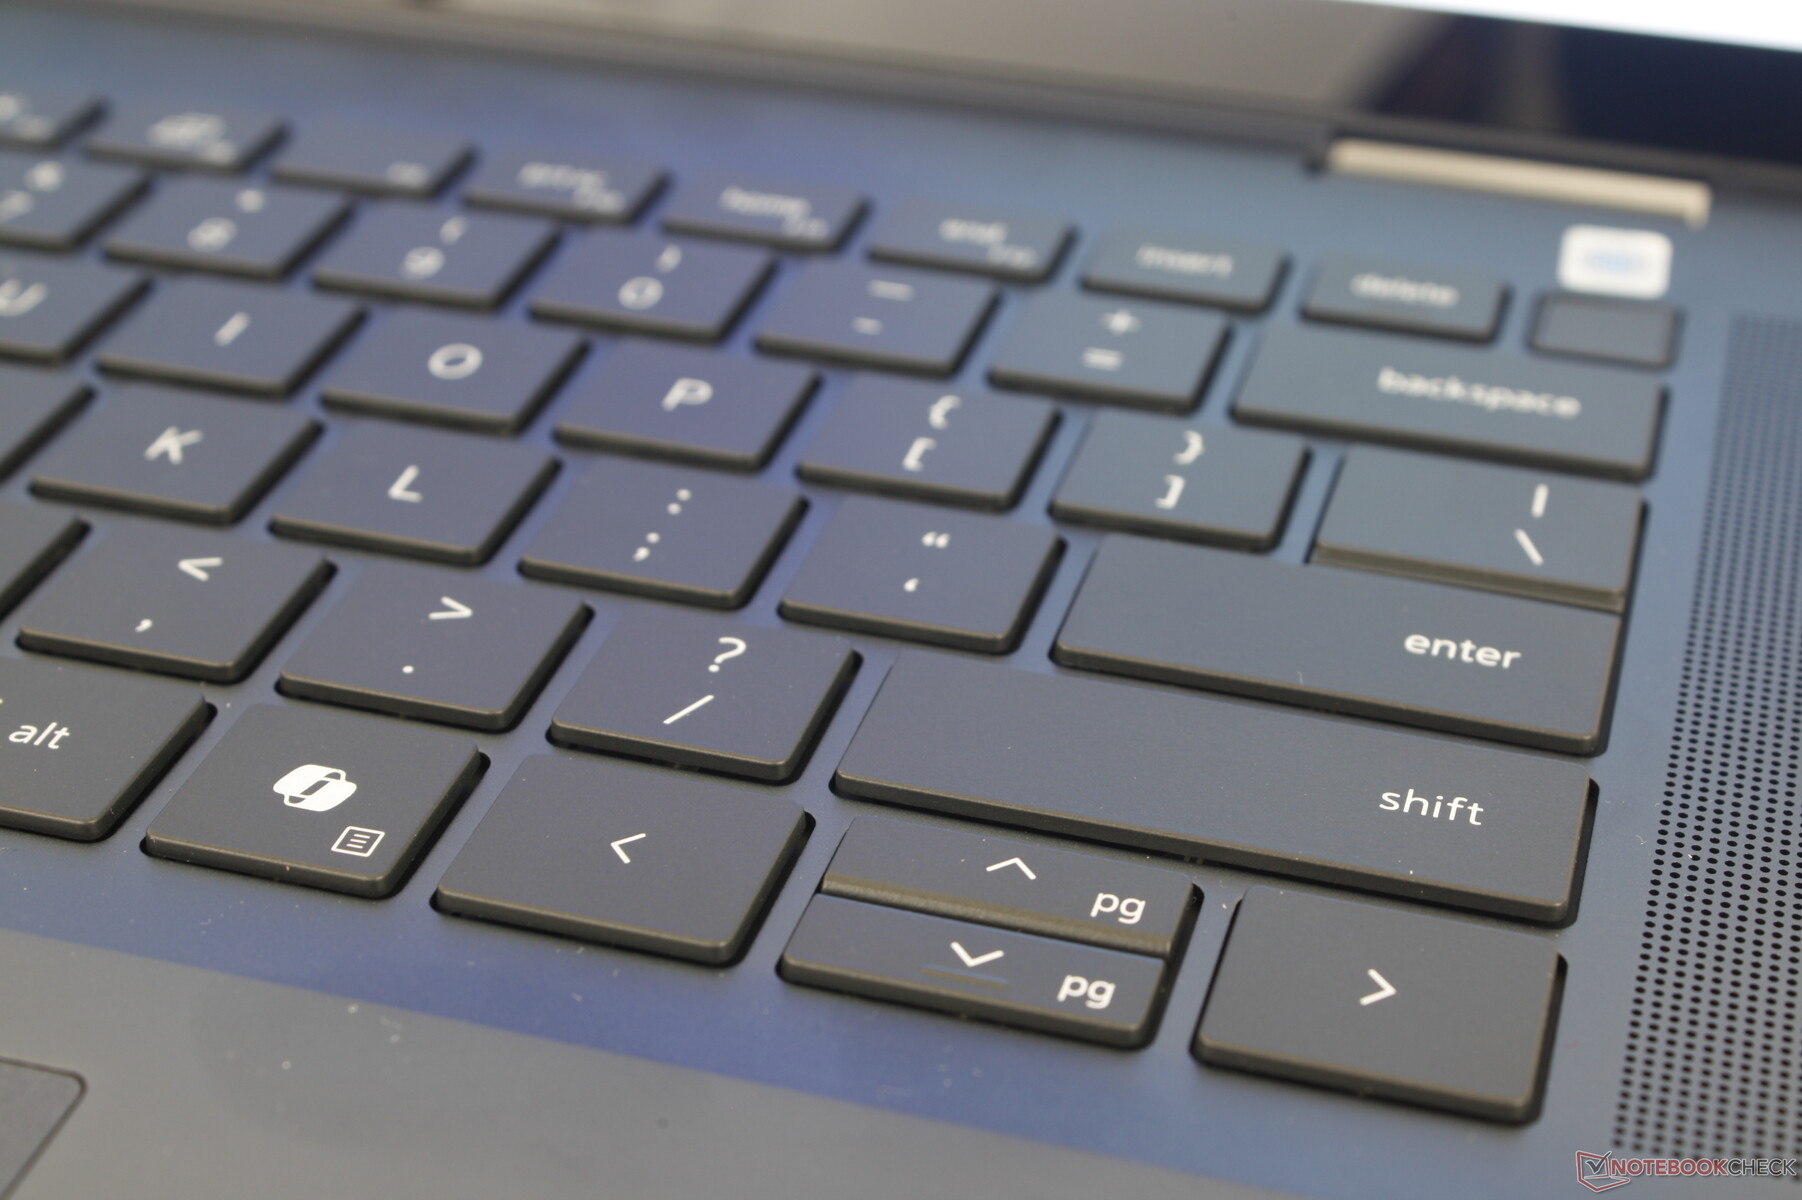
Urządzenia wejściowe - dobre, ale wciąż nieco gąbczaste
Klawiatura i panel dotykowy
Klawiatura i touchpad nie zmieniły się w stosunku do serii Inspiron 7630 2-w-1 pomimo wszystkich fizycznych zmian w innych częściach obudowy. Istnieje kilka drobnych różnic, takich jak nieco mniejszy przycisk zasilania w naszym nowszym modelu i wprowadzenie dedykowanego klawisza Co-Pilot, ale wszystko, począwszy od rozmiaru clickpada (13,3 x 9 cm) i sprzężenia zwrotnego klawiszy, jest identyczne z zeszłorocznym modelem. Byłoby miło zobaczyć ulepszenia w tym zakresie, ponieważ nadal uważamy, że klawisze i clickpad w Inspironie są bardziej gąbczaste i mają mniej satysfakcjonujące sprzężenie zwrotne niż klawisze i clickpad w serii HP Envy.

Wyświetlacz - 2.5K Mini-LED HDR600
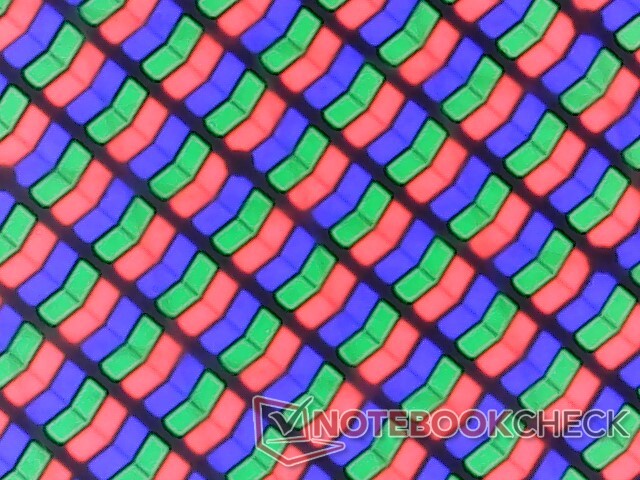
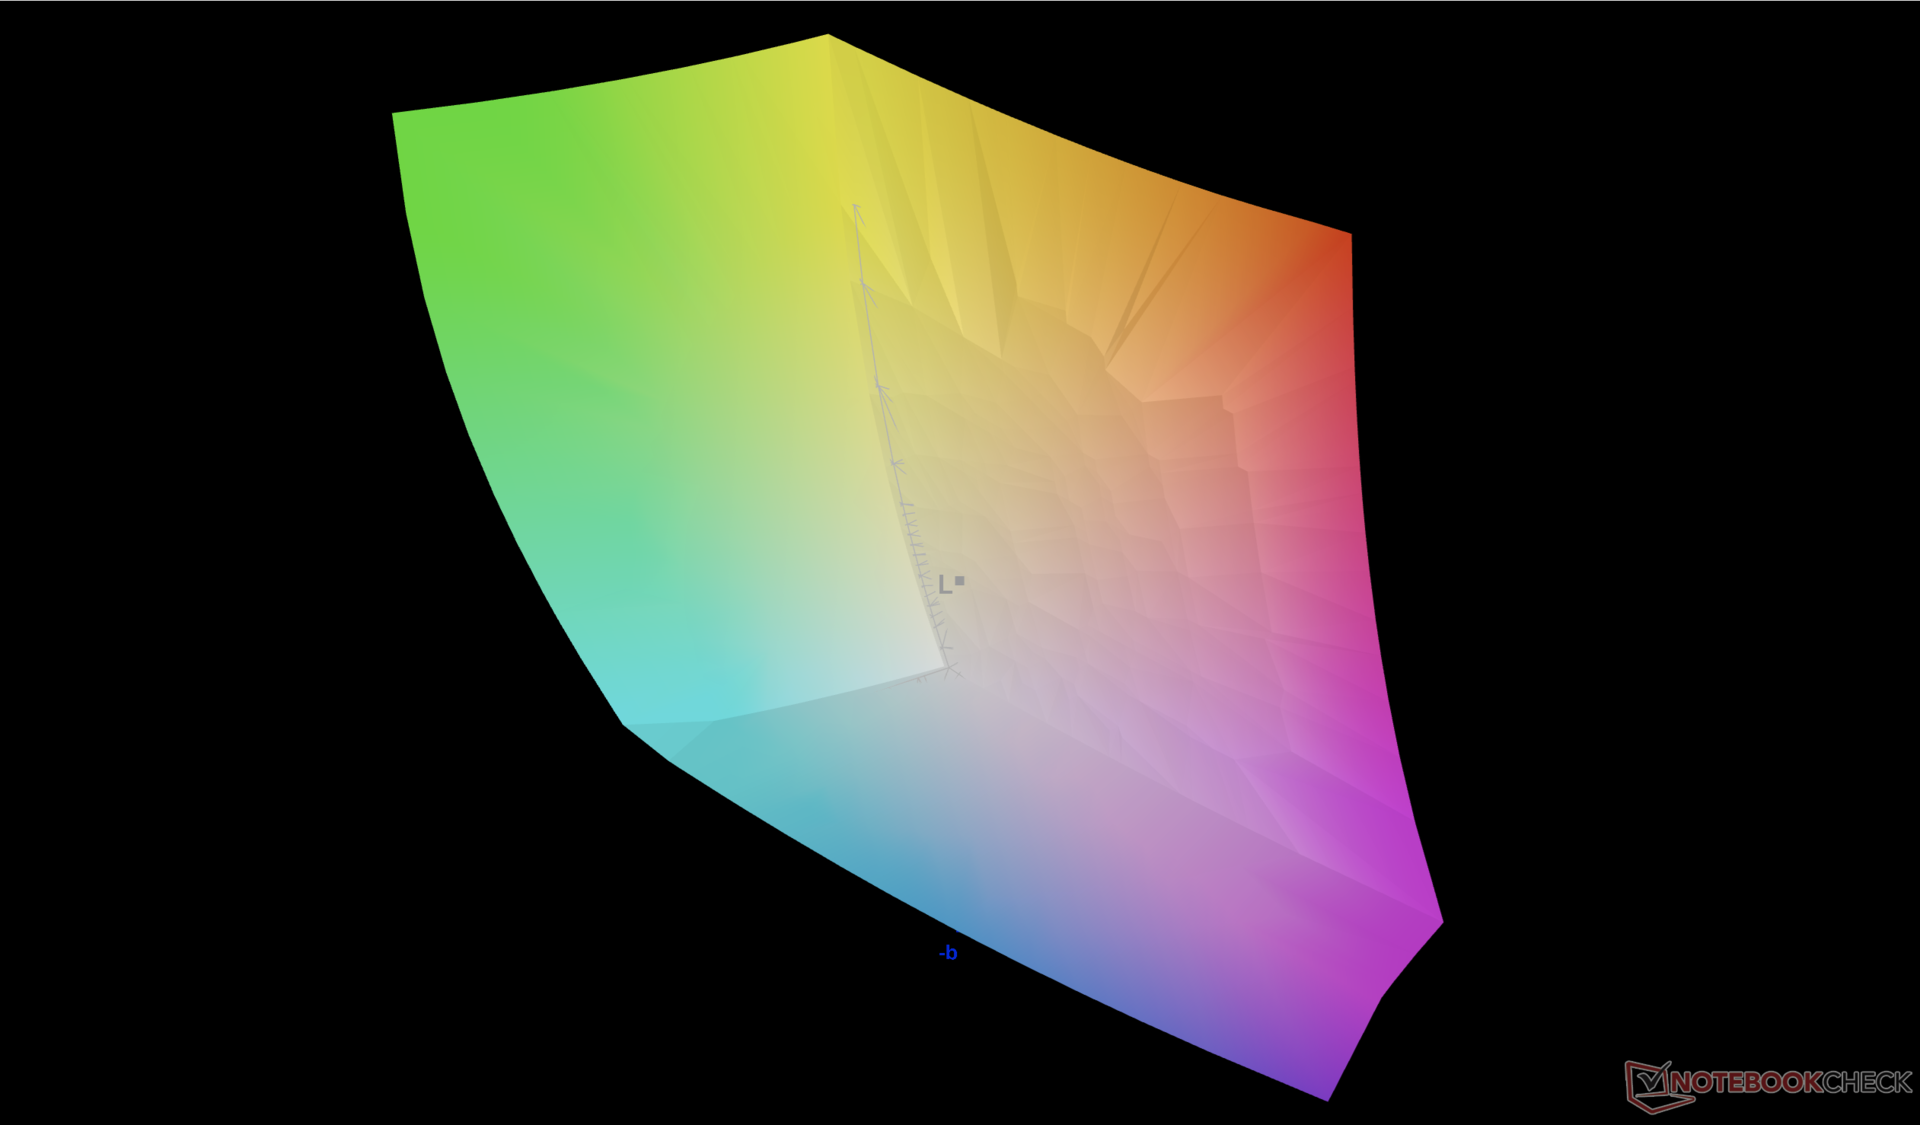
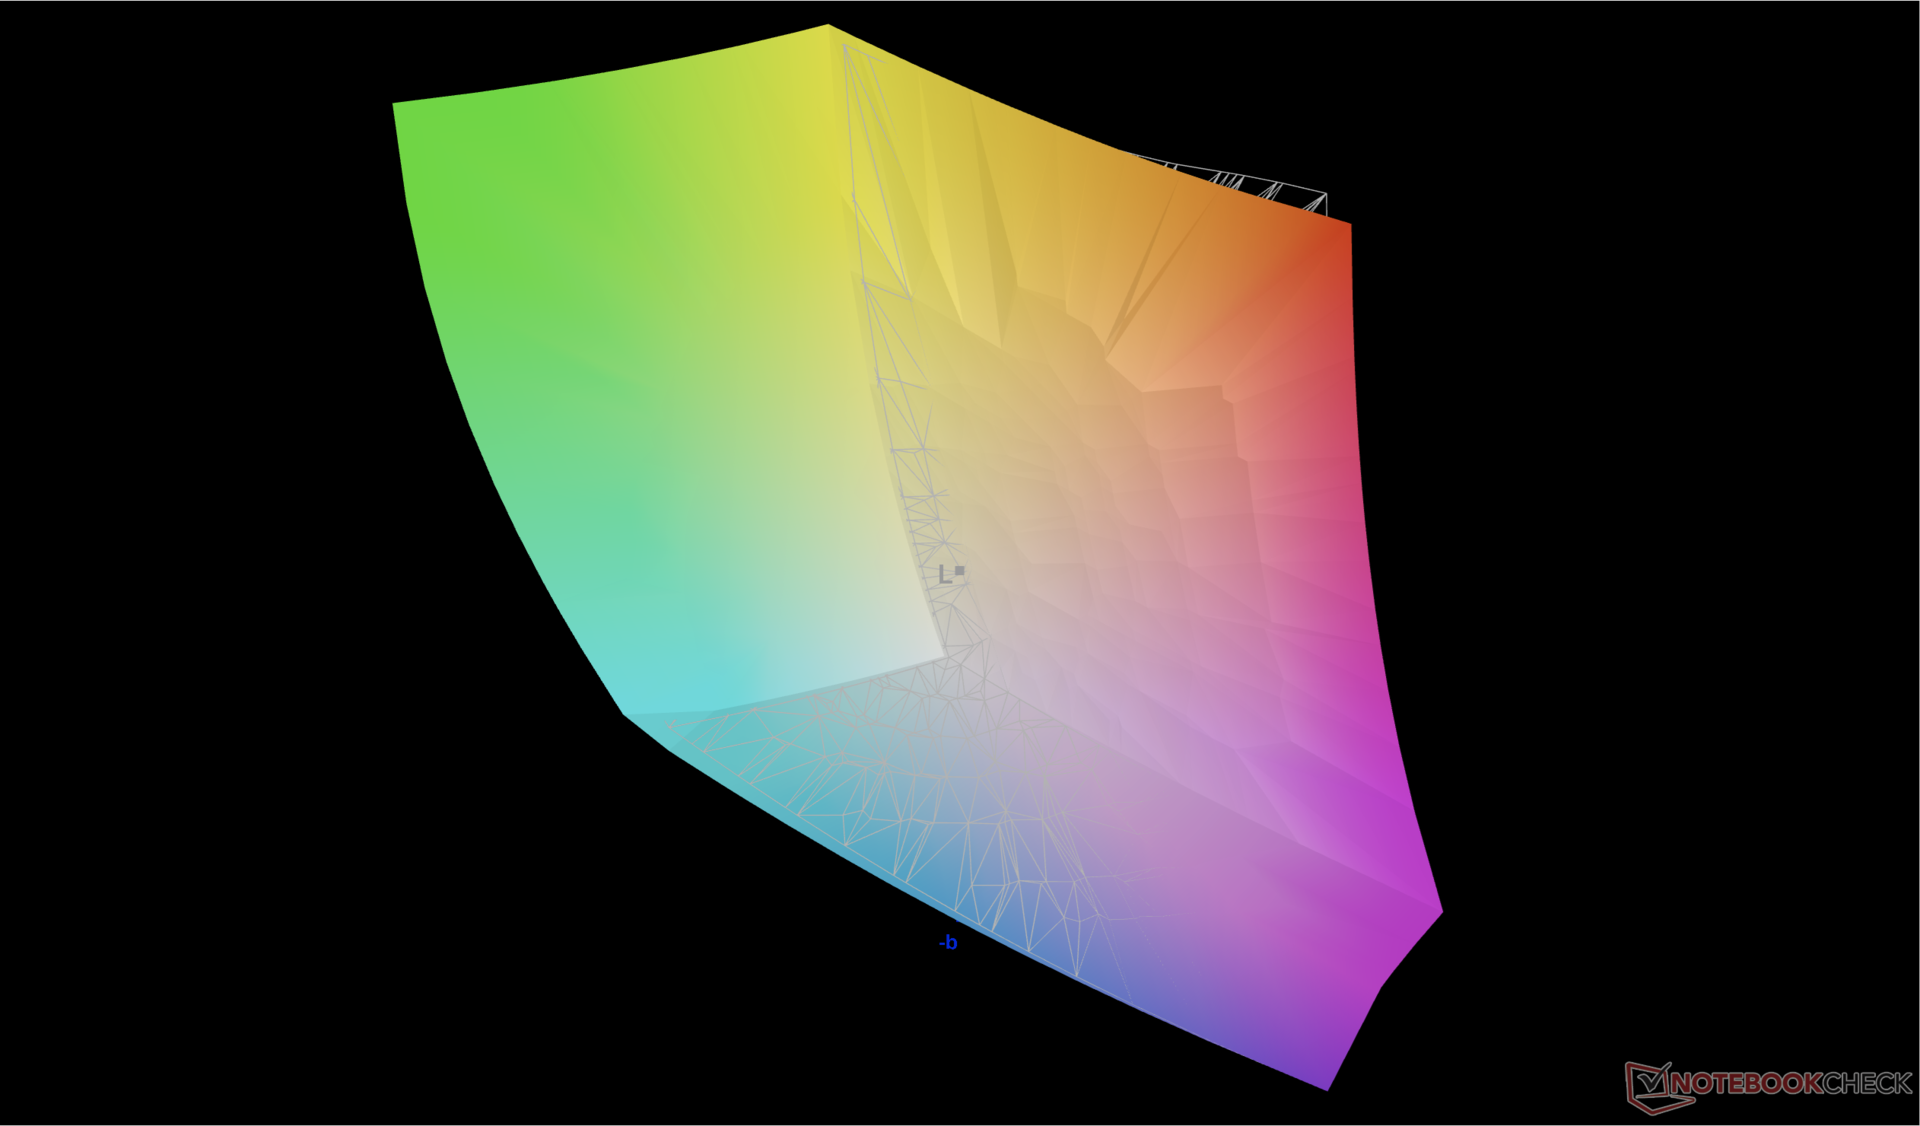
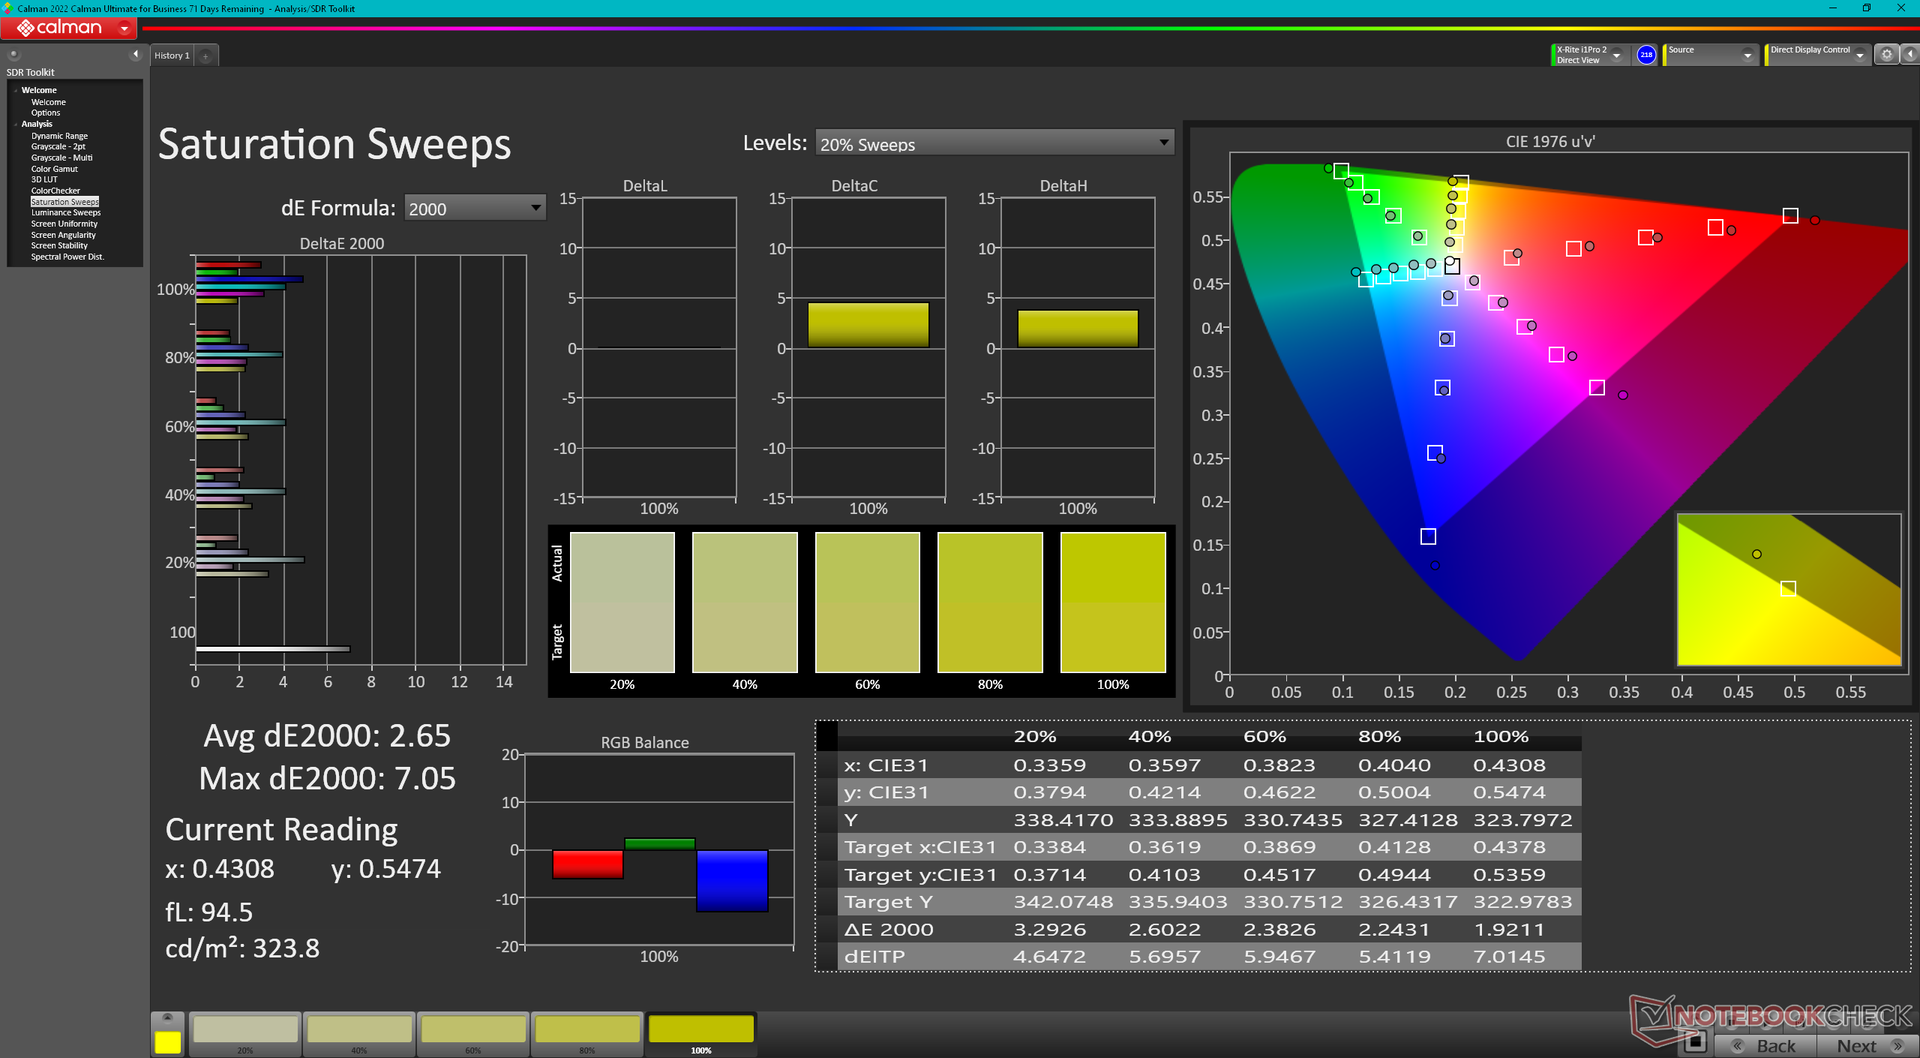
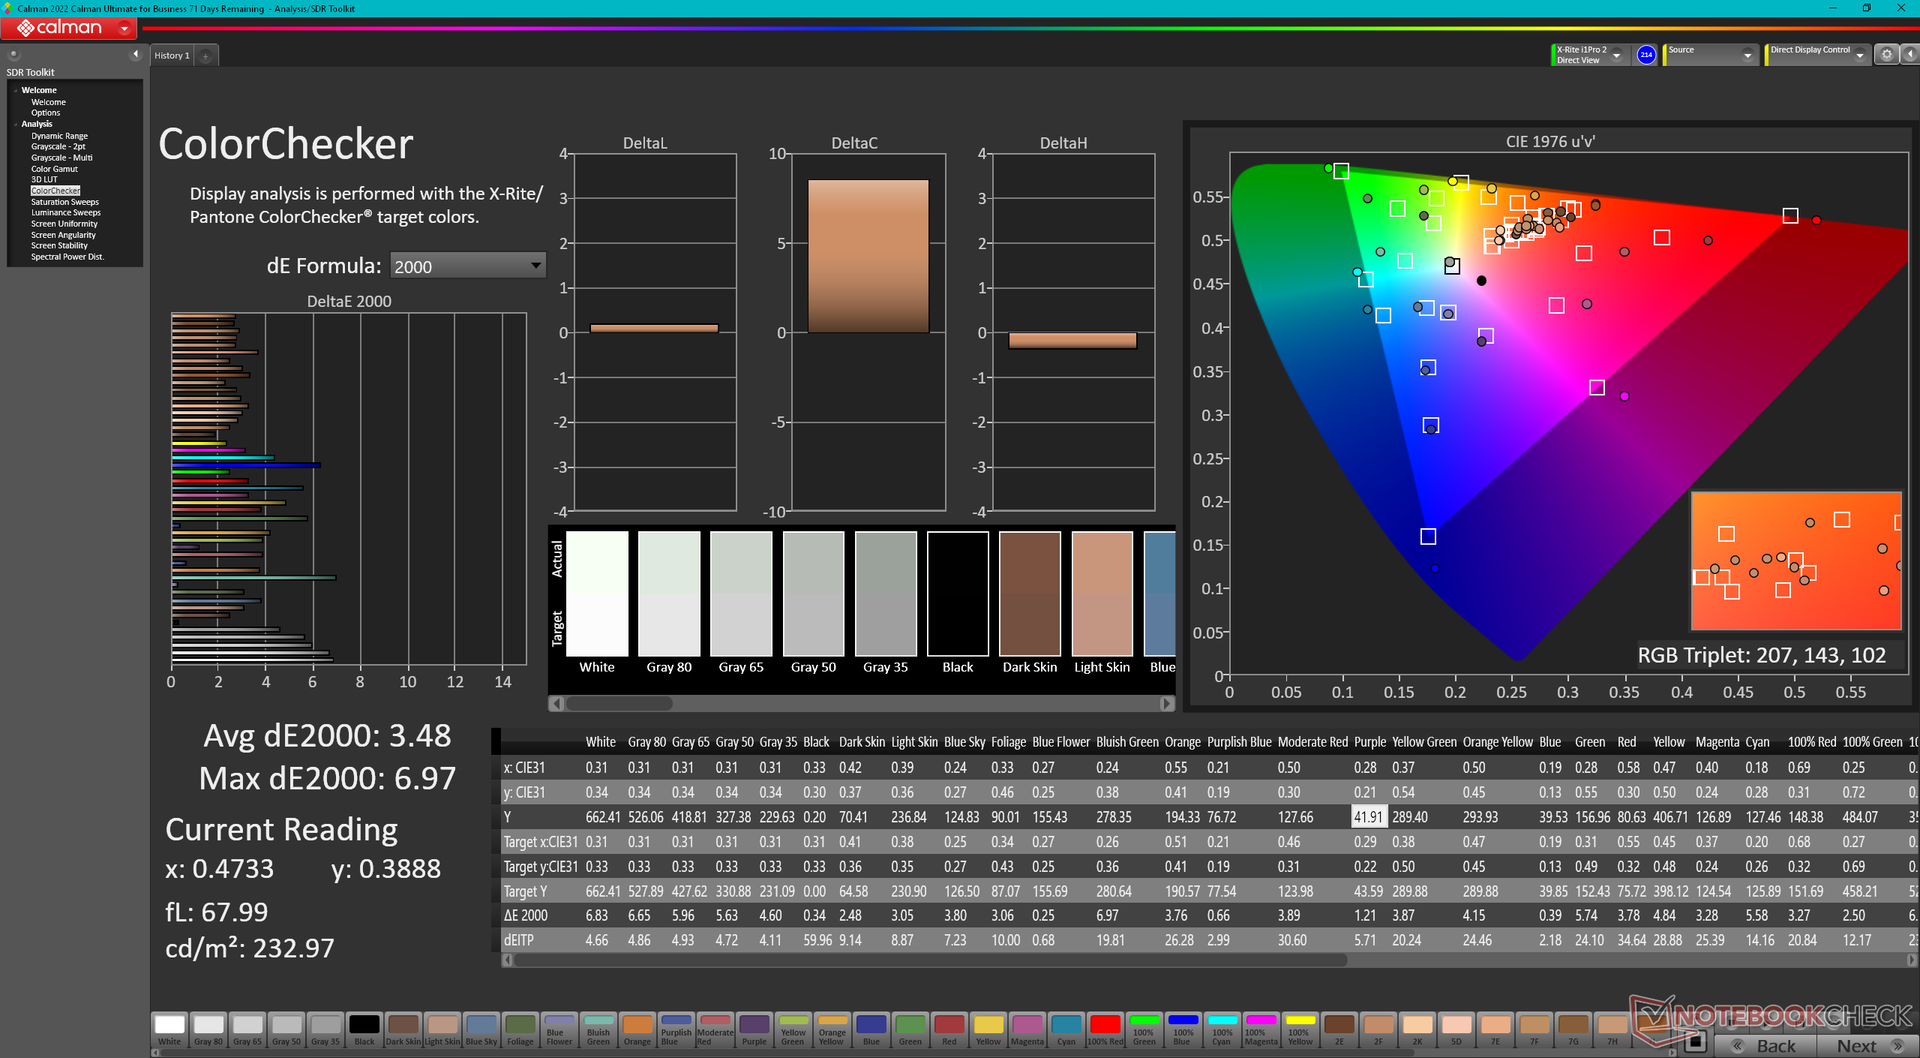
Opcjonalny panel Mini-LED jest kluczowym punktem sprzedaży tegorocznego Inspirona 16 2-w-1. Chociaż może nie oferować 4K i HDR1000, jak w niektórych ekstremalnych laptopach do gierale jego rozdzielczość 2,5K i obsługa HDR600 wciąż robi wrażenie jak na 16-calowym konwertowalnym laptopie w cenie około 1000 USD. Użytkownicy nadal otrzymują ten sam doskonały współczynnik kontrastu 3000:1 i pełne kolory DCI-P3, co w większości innych paneli mini-LED w droższych laptopach.
Zarówno kolory, jak i jasność są automatycznie ustawiane odpowiednio na sRGB i maksymalnie 400 nitów, gdy HDR jest wyłączony. Włączenie HDR zmienia profil kolorów na DCI-P3, jednocześnie podnosząc maksymalną jasność do 663 nitów podczas odtwarzania treści HDR.
Natywna częstotliwość odświeżania 90 Hz jest przyzwoita, ale panel nie obsługuje synchronizacji adaptacyjnej i zmiennej częstotliwości odświeżania systemu Windows, aby oszczędzać energię.
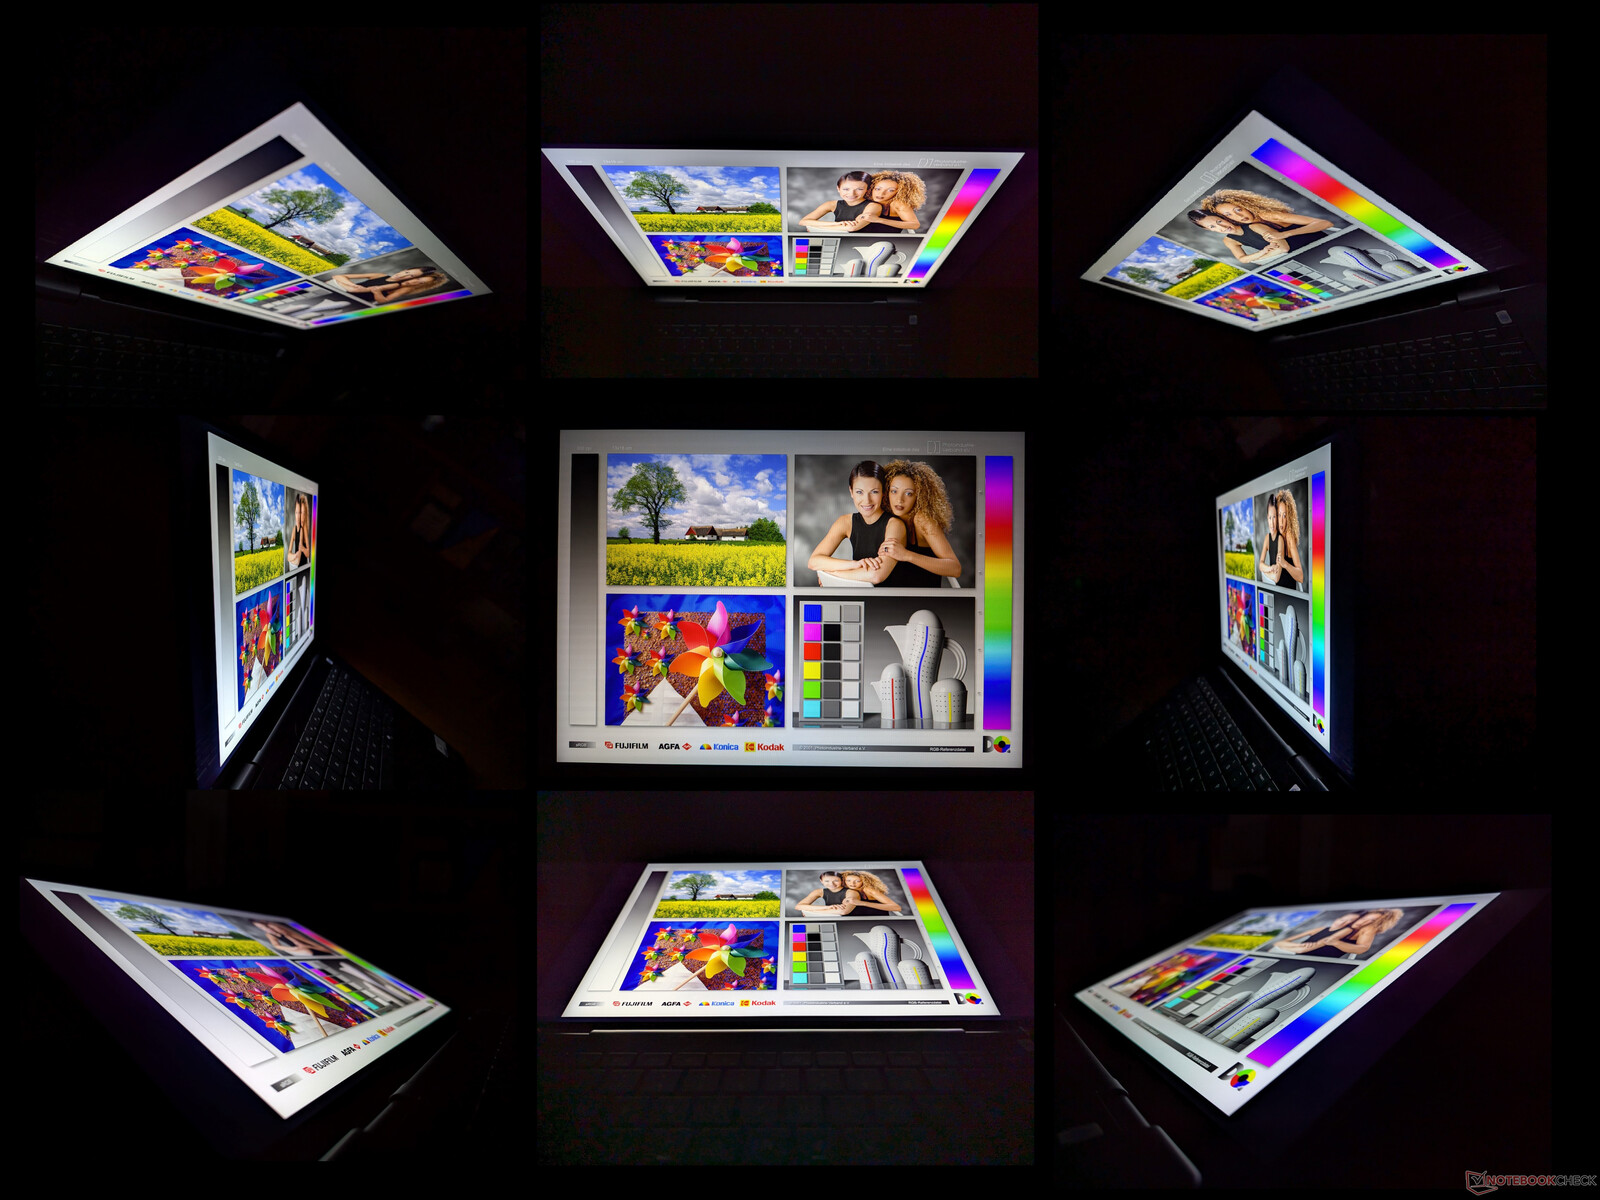
| |||||||||||||||||||||||||
rozświetlenie: 97 %
na akumulatorze: 413 cd/m²
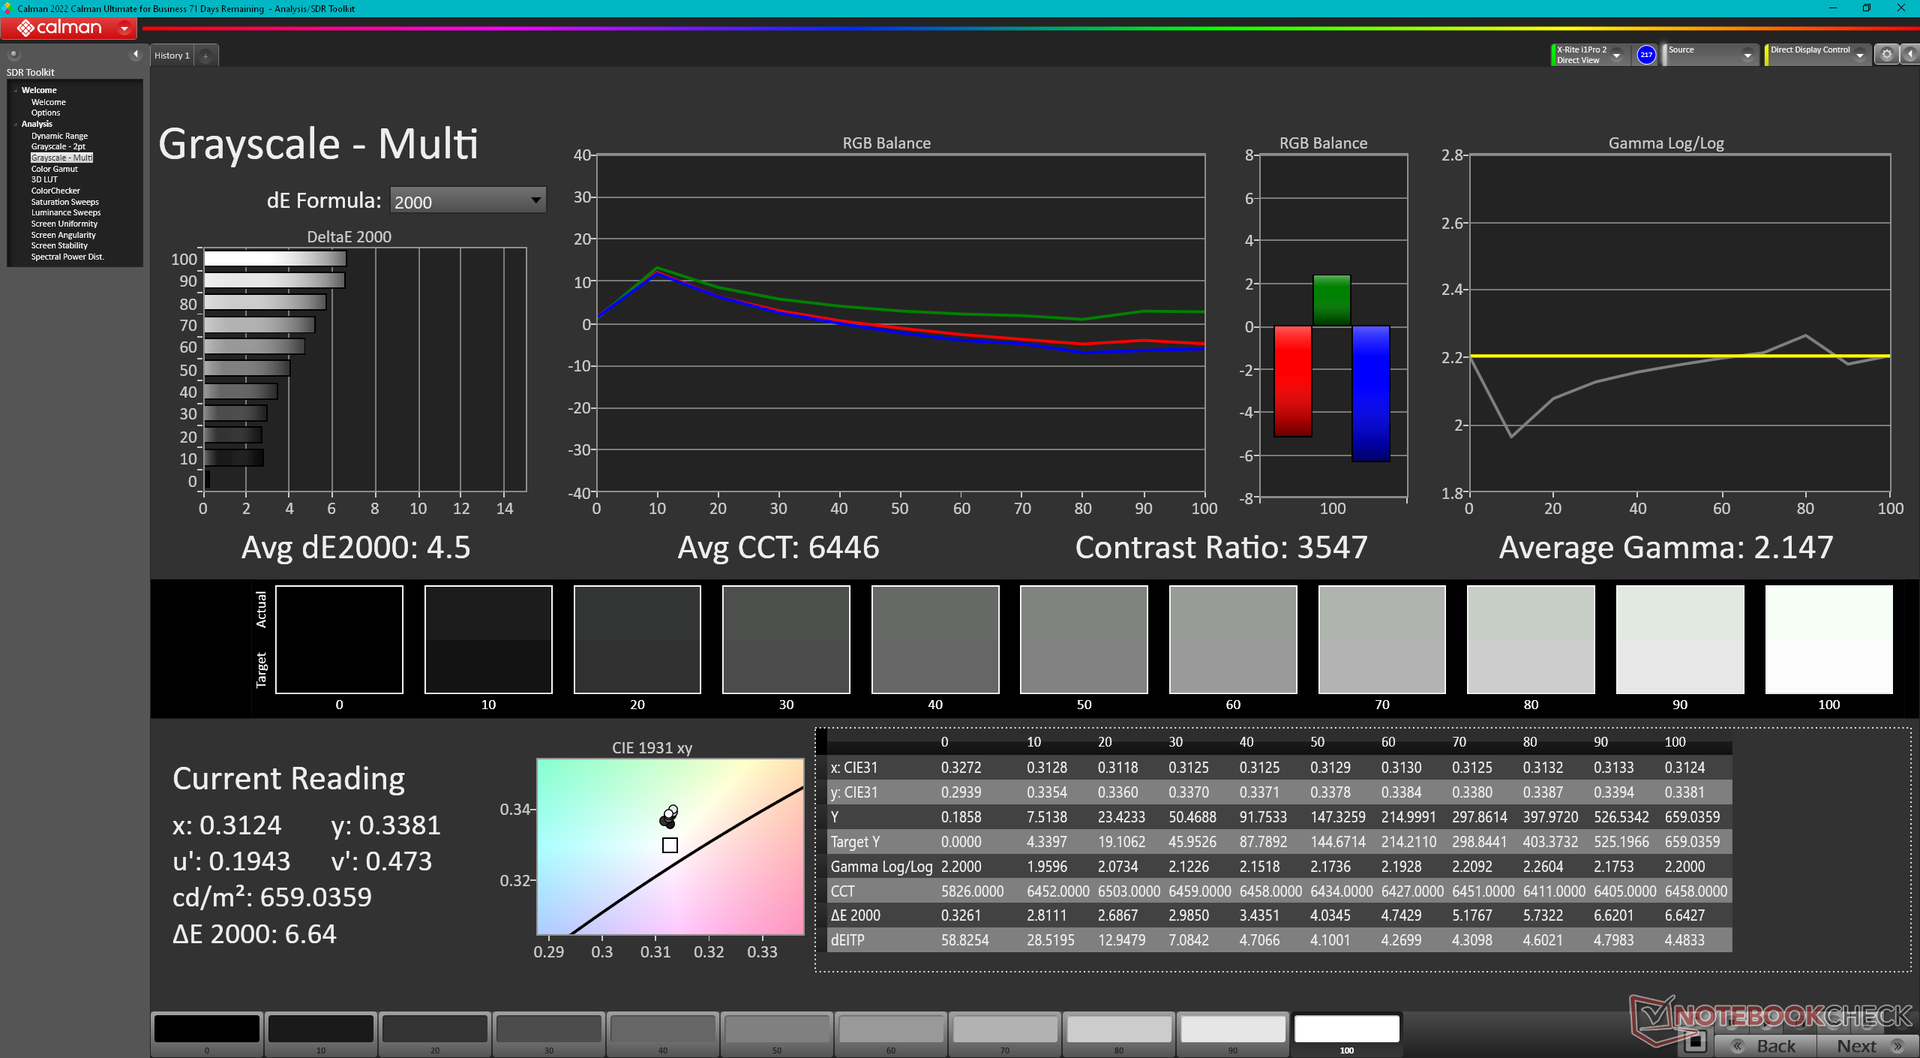
kontrast: 2950:1 (czerń: 0.14 cd/m²)
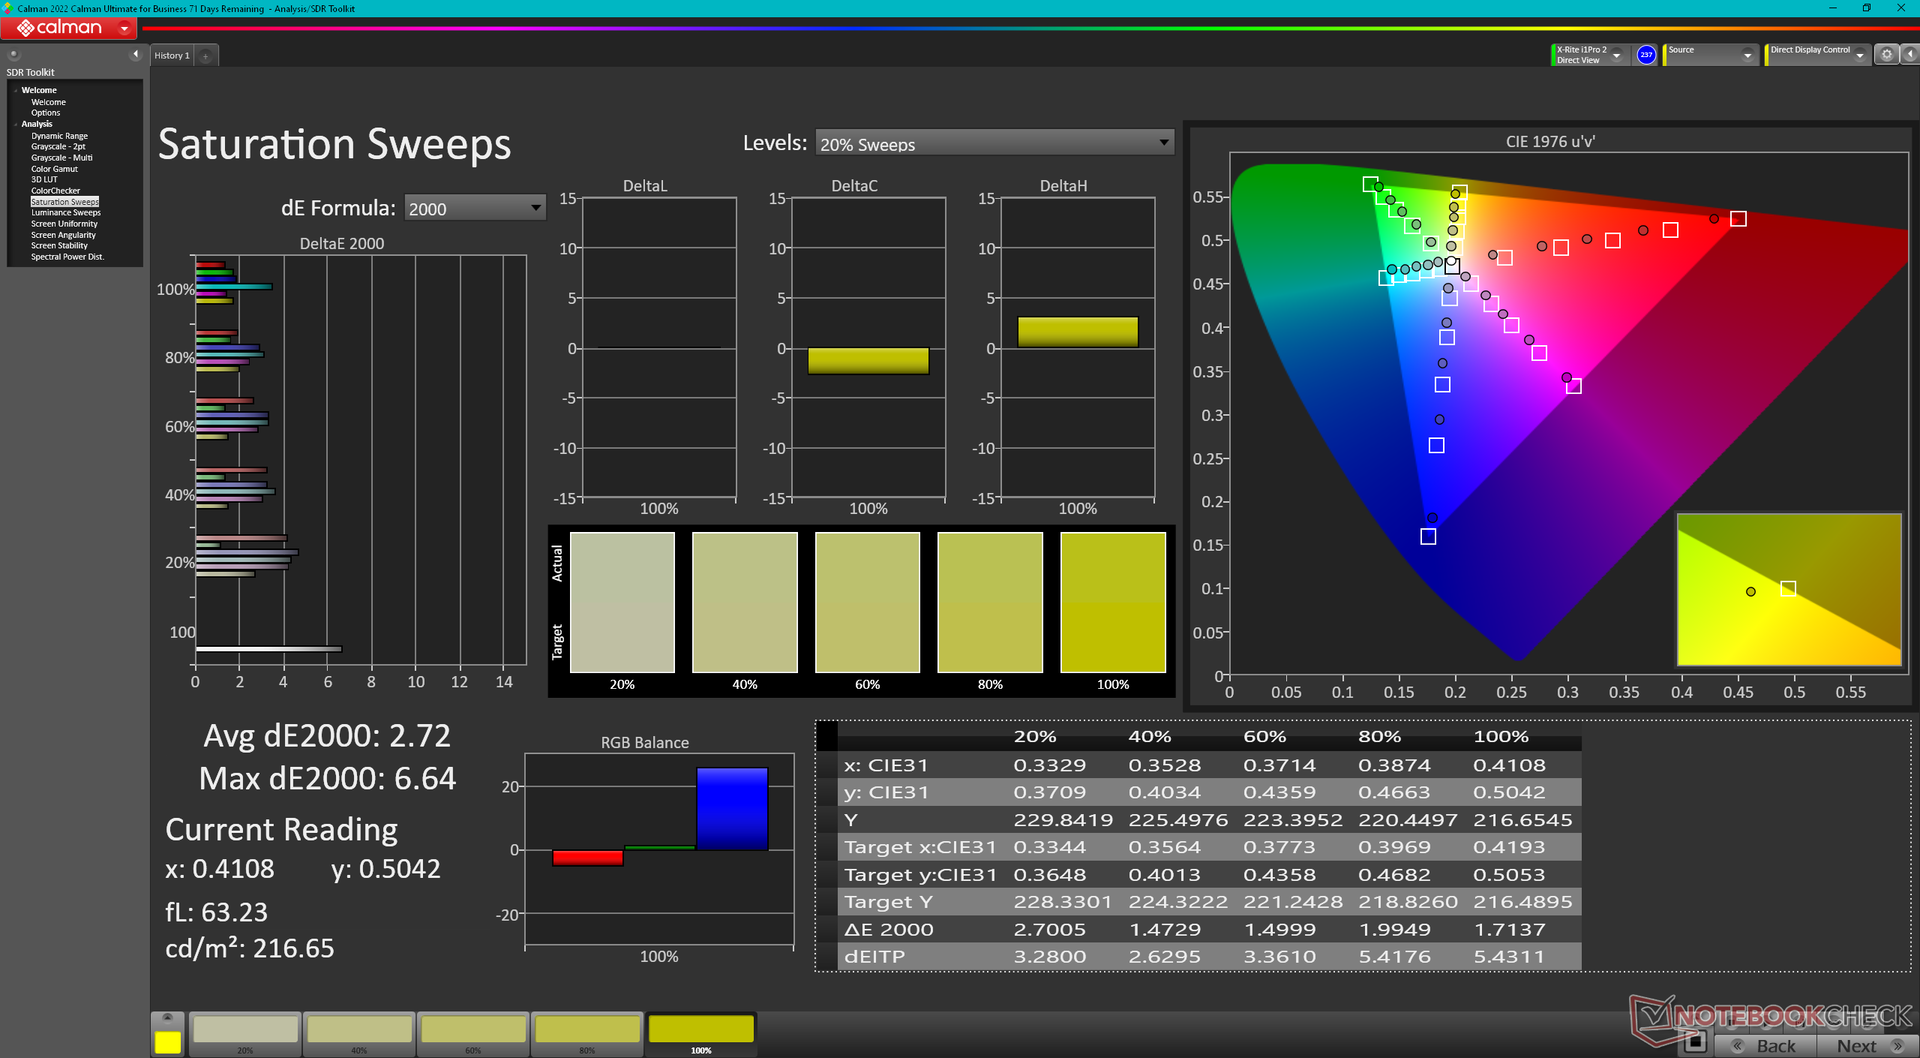
ΔE Color 3.48 | 0.5-29.43 Ø4.87
ΔE Greyscale 4.5 | 0.5-98 Ø5.1
92.5% AdobeRGB 1998 (Argyll 2.2.0 3D)
100% sRGB (Argyll 2.2.0 3D)
99.4% Display P3 (Argyll 2.2.0 3D)
Gamma: 2.15
| Dell Inspiron 16 7640 2-in-1 AU Optronics B160QAT, Mini-LED, 2560x1600, 16", 90 Hz | Dell Inspiron 16 Plus 7640 AU Optronics B160QAN, IPS, 2560x1600, 16", 120 Hz | Dell Inspiron 16 7635 2-in-1 Chi Mei 160JCA, IPS, 1920x1200, 16", 60 Hz | HP Envy x360 2-in-1 16-ad0097nr Samsung SDC41A6, OLED, 2880x1800, 16", 120 Hz | Lenovo IdeaPad Pro 5 16IMH G9 NE160QDM-NY2, IPS, 2560x1600, 16", 120 Hz | Samsung Galaxy Book4 Pro 360 ATNA60CL09-0, OLED, 2880x1800, 16", 120 Hz | |
|---|---|---|---|---|---|---|
| Display | -14% | -20% | 1% | -23% | 2% | |
| Display P3 Coverage | 99.4 | 76 -24% | 67.4 -32% | 99.6 0% | 63.3 -36% | 99.9 1% |
| sRGB Coverage | 100 | 99.8 0% | 98.2 -2% | 100 0% | 95.2 -5% | 100 0% |
| AdobeRGB 1998 Coverage | 92.5 | 76.7 -17% | 69.5 -25% | 96.5 4% | 65.3 -29% | 96.6 4% |
| Response Times | 3% | -5% | 37% | 43% | 35% | |
| Response Time Grey 50% / Grey 80% * | 15.4 ? | 25.6 ? -66% | 27.6 ? -79% | 0.8 ? 95% | 15 ? 3% | 0.49 ? 97% |
| Response Time Black / White * | 60.6 ? | 17.6 ? 71% | 18.2 ? 70% | 0.89 ? 99% | 10.3 ? 83% | 0.67 ? 99% |
| PWM Frequency | 2753.7 ? | 491.8 ? -82% | 240 ? -91% | |||
| Screen | -5% | -25% | 10% | -21% | 33% | |
| Brightness middle | 413 | 314.7 -24% | 301.3 -27% | 399.4 -3% | 368 -11% | 387 -6% |
| Brightness | 409 | 291 -29% | 269 -34% | 405 -1% | 368 -10% | 392 -4% |
| Brightness Distribution | 97 | 89 -8% | 79 -19% | 98 1% | 91 -6% | 98 1% |
| Black Level * | 0.14 | 0.28 -100% | 0.28 -100% | 0.31 -121% | ||
| Contrast | 2950 | 1124 -62% | 1076 -64% | 1187 -60% | ||
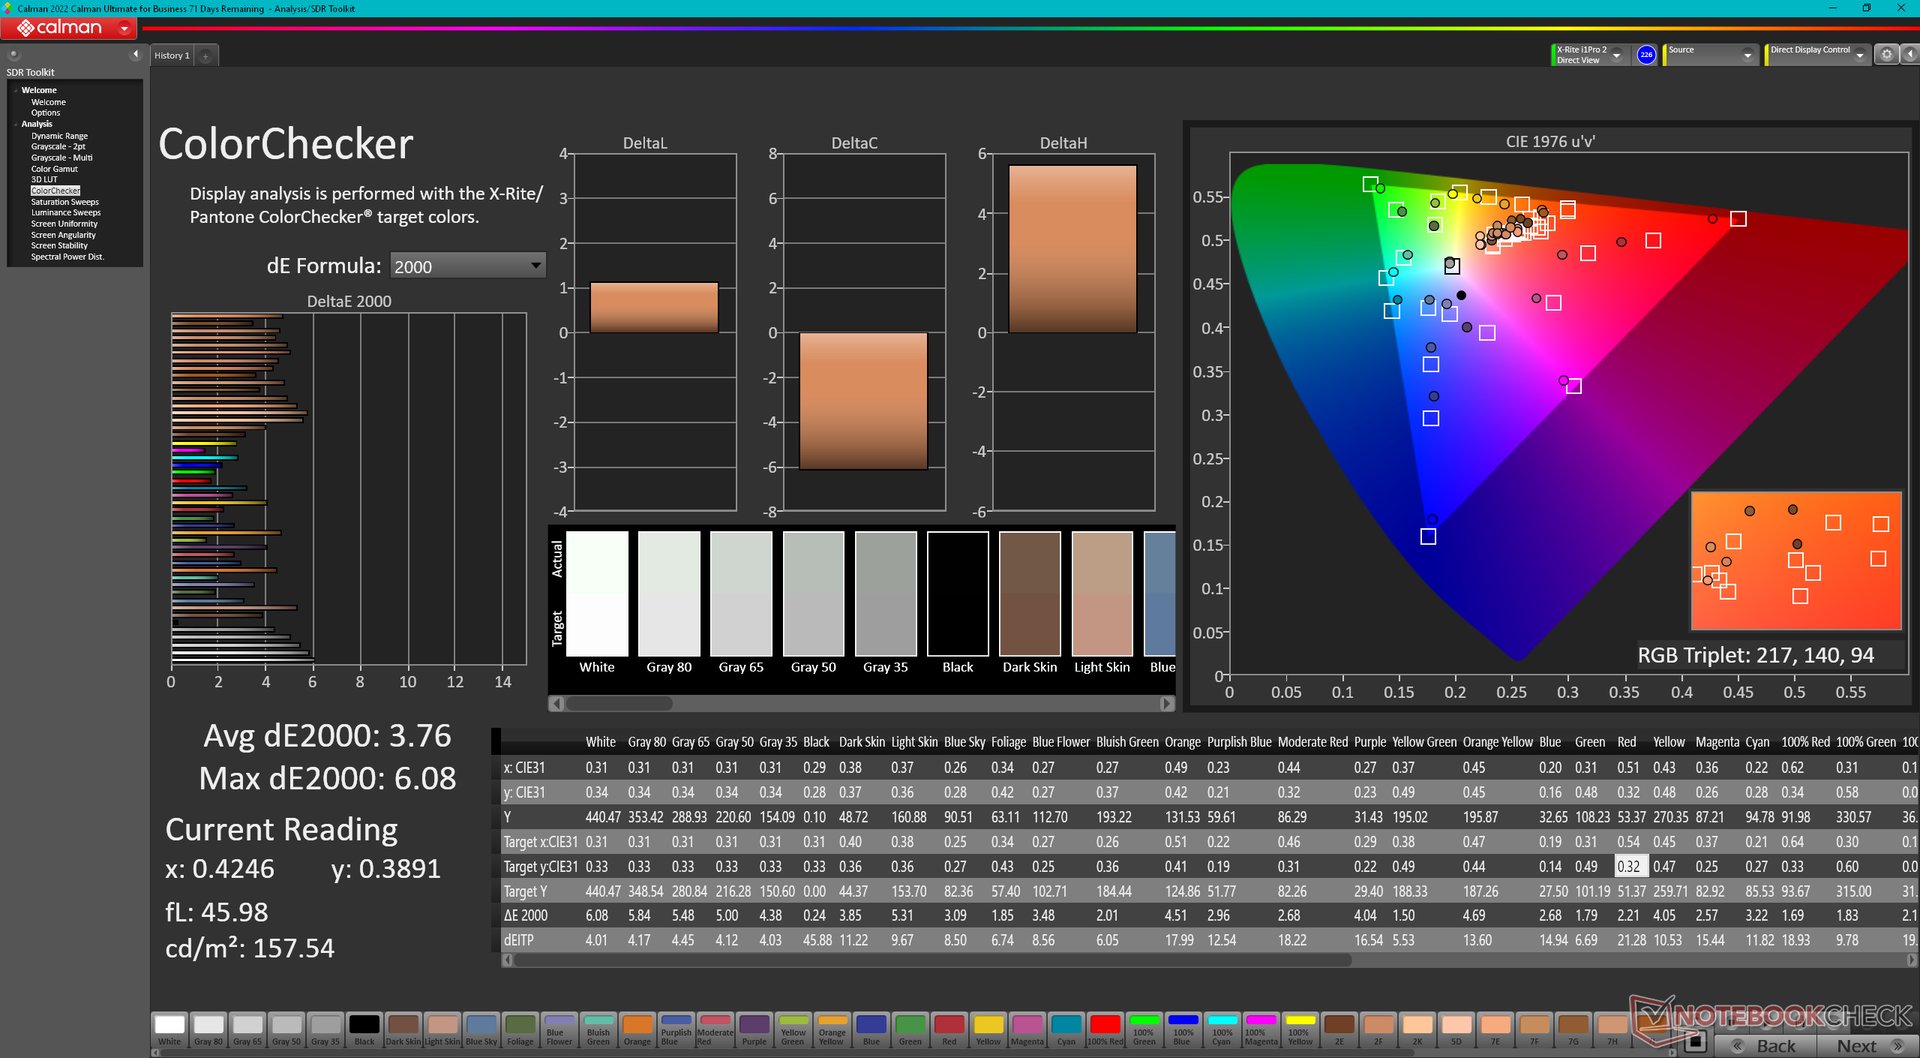
| Colorchecker dE 2000 * | 3.48 | 1.62 53% | 3.1 11% | 4.05 -16% | 2.4 31% | 1 71% |
| Colorchecker dE 2000 max. * | 6.97 | 2.94 58% | 5.5 21% | 6.69 4% | 6.5 7% | 1.9 73% |
| Greyscale dE 2000 * | 4.5 | 1.3 71% | 3.9 13% | 1.1 76% | 4.5 -0% | 1.7 62% |
| Gamma | 2.15 102% | 2.26 97% | 2.19 100% | 2.27 97% | 2.21 100% | 2.25 98% |
| CCT | 6446 101% | 6385 102% | 6186 105% | 6419 101% | 6324 103% | 6325 103% |
| Colorchecker dE 2000 calibrated * | 1.08 | 0.49 | 1.02 | 0.8 | ||
| Całkowita średnia (program / ustawienia) | -5% /
-6% | -17% /
-21% | 16% /
15% | -0% /
-12% | 23% /
26% |
* ... im mniej tym lepiej
Wyświetlacz jest dość dokładny jak na komputer średniej klasy ze średnimi wartościami DeltaE skali szarości i kolorów wynoszącymi odpowiednio 4,2 i 3,76. Wartości te pozostają względnie stabilne po włączeniu HDR, który automatycznie przełącza system na kolory DCI-P3. W obu przypadkach, temperatura barwowa jest nieco zbyt niska i wynosi około 6500K.

Wyświetl czasy reakcji
| ↔ Czas reakcji od czerni do bieli | ||
|---|---|---|
| 60.6 ms ... wzrost ↗ i spadek ↘ łącznie | ↗ 56.2 ms wzrost | 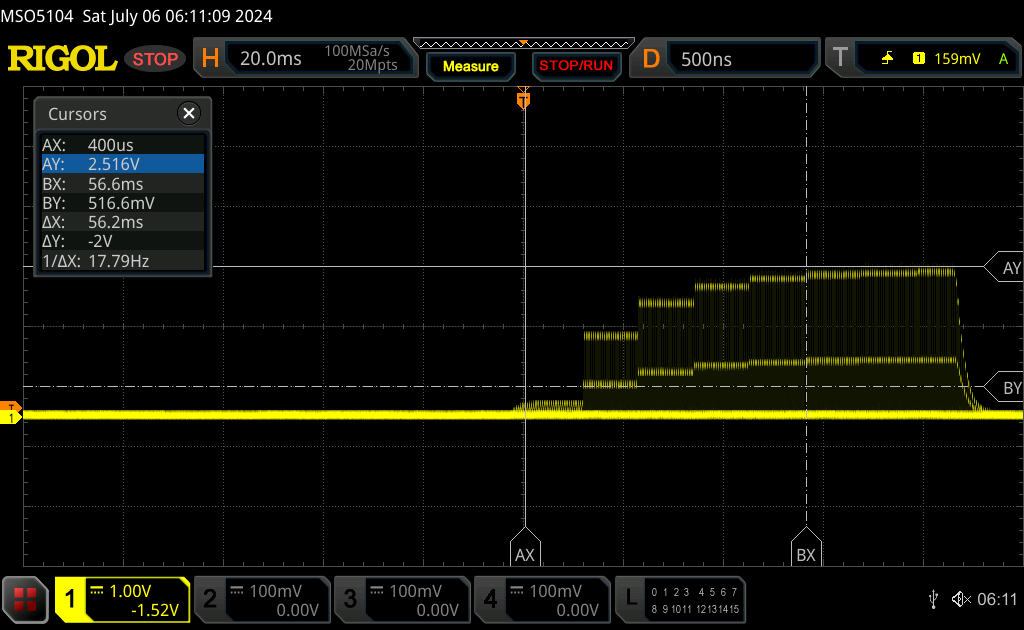 |
| ↘ 4.4 ms upadek | ||
| W naszych testach ekran wykazuje powolne tempo reakcji, co będzie niezadowalające dla graczy. Dla porównania, wszystkie testowane urządzenia wahają się od 0.1 (minimum) do 240 (maksimum) ms. » 100 % wszystkich urządzeń jest lepszych. Oznacza to, że zmierzony czas reakcji jest gorszy od średniej wszystkich testowanych urządzeń (20.8 ms). | ||
| ↔ Czas reakcji 50% szarości do 80% szarości | ||
| 15.4 ms ... wzrost ↗ i spadek ↘ łącznie | ↗ 8.6 ms wzrost | 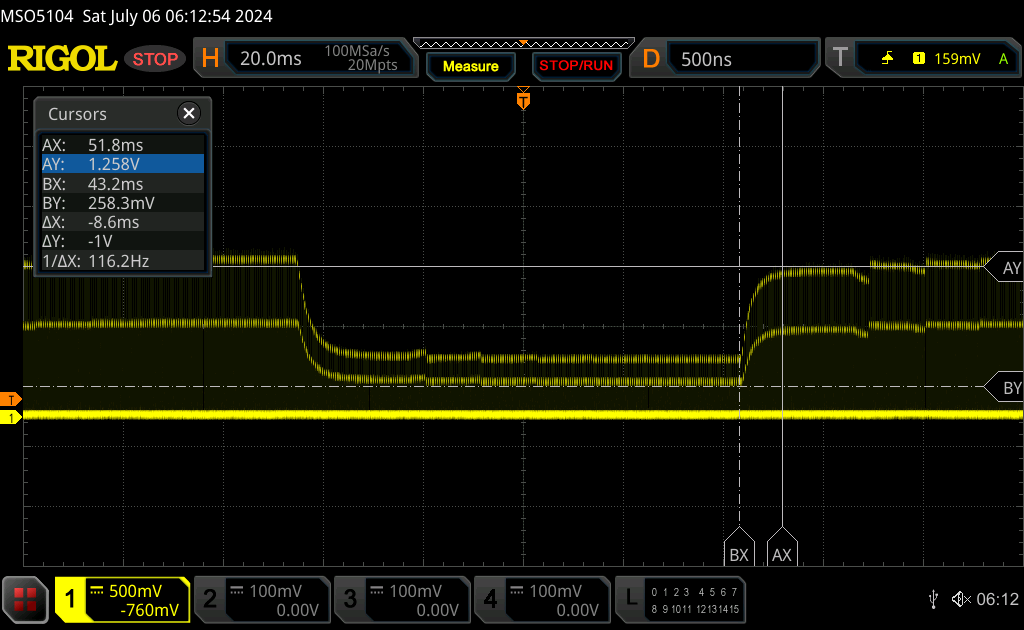 |
| ↘ 6.8 ms upadek | ||
| W naszych testach ekran wykazuje dobry współczynnik reakcji, ale może być zbyt wolny dla graczy rywalizujących ze sobą. Dla porównania, wszystkie testowane urządzenia wahają się od 0.165 (minimum) do 636 (maksimum) ms. » 27 % wszystkich urządzeń jest lepszych. Oznacza to, że zmierzony czas reakcji jest lepszy od średniej wszystkich testowanych urządzeń (32.5 ms). | ||
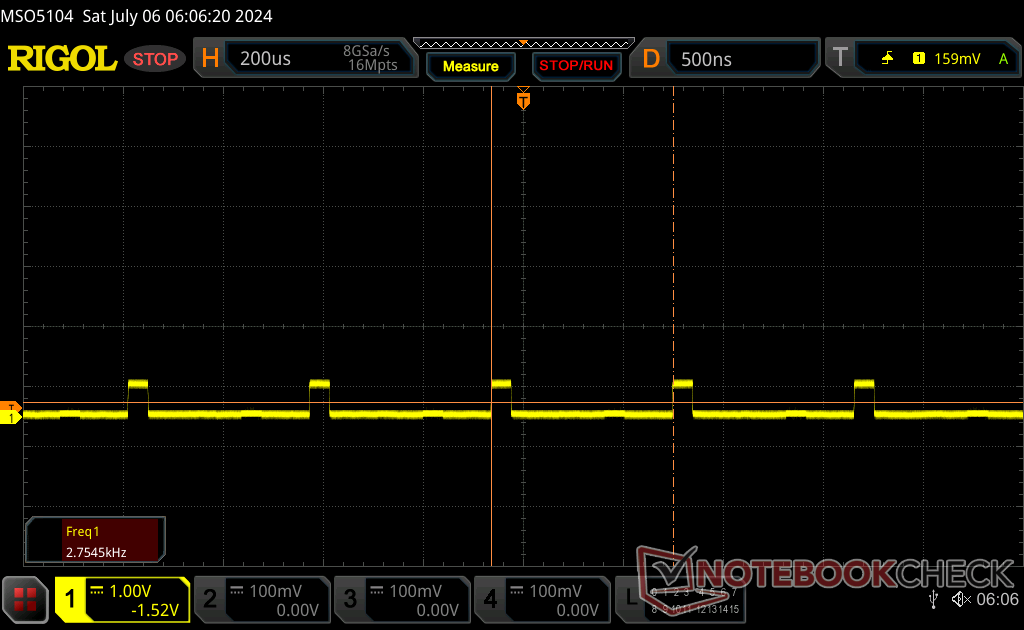
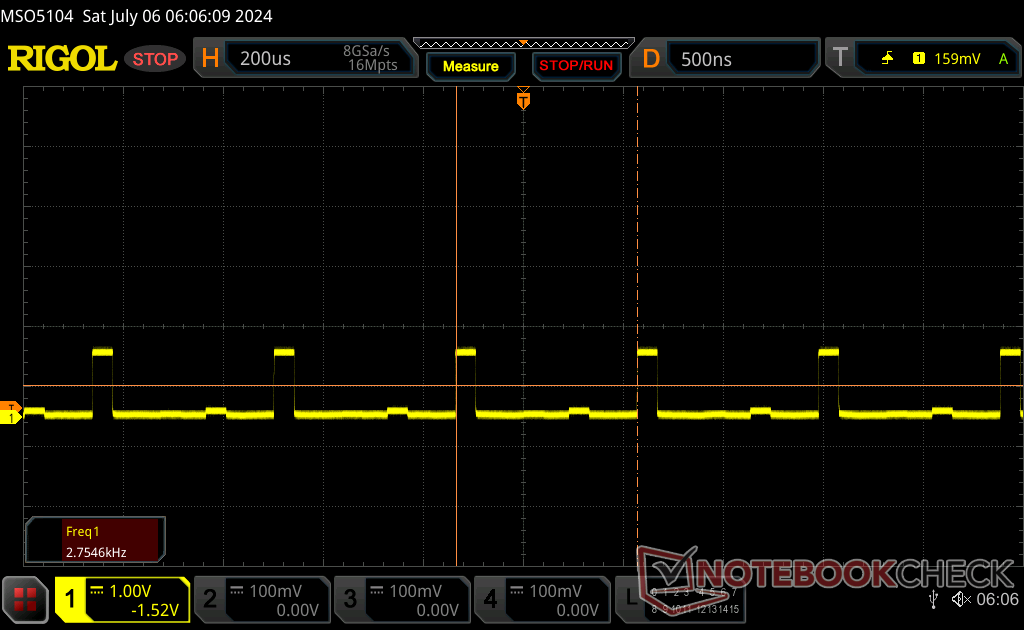
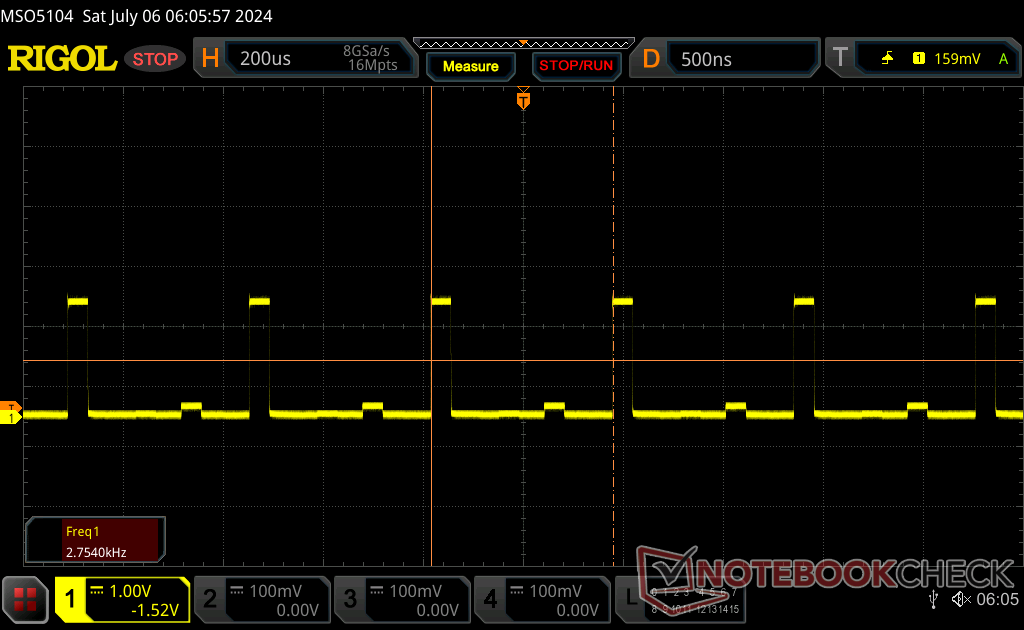
Migotanie ekranu / PWM (modulacja szerokości impulsu)
| Wykryto migotanie ekranu/wykryto PWM | 2753.7 Hz | ≤ 100 % ustawienia jasności | 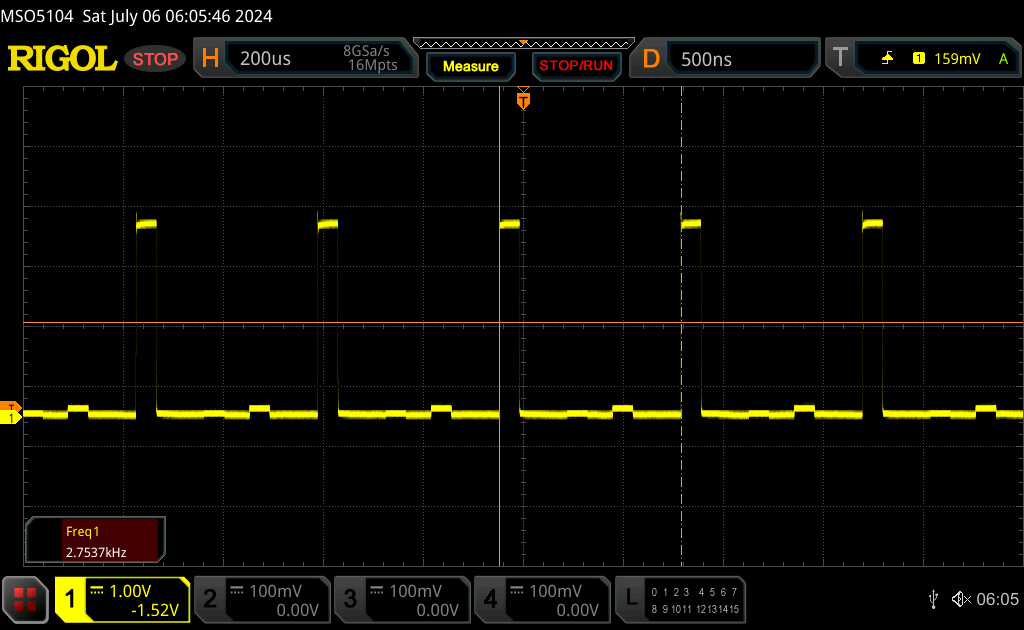 |
Podświetlenie wyświetlacza miga z częstotliwością 2753.7 Hz (najgorszy przypadek, np. przy użyciu PWM) Wykryto migotanie przy ustawieniu jasności 100 % i poniżej. Powyżej tego ustawienia jasności nie powinno być żadnego migotania ani PWM. Częstotliwość 2753.7 Hz jest dość wysoka, więc większość użytkowników wrażliwych na PWM nie powinna zauważyć żadnego migotania. Dla porównania: 53 % wszystkich testowanych urządzeń nie używa PWM do przyciemniania wyświetlacza. Jeśli wykryto PWM, zmierzono średnio 8516 (minimum: 5 - maksimum: 343500) Hz. | |||
Modulacja szerokości impulsu lub migotanie jest obecne na wszystkich poziomach jasności przy stałej częstotliwości 2753 Hz. Takiego zachowania należy oczekiwać od panelu mini-LED, a częstotliwość jest na szczęście na tyle szybka, że jest niezauważalna dla większości widzów.

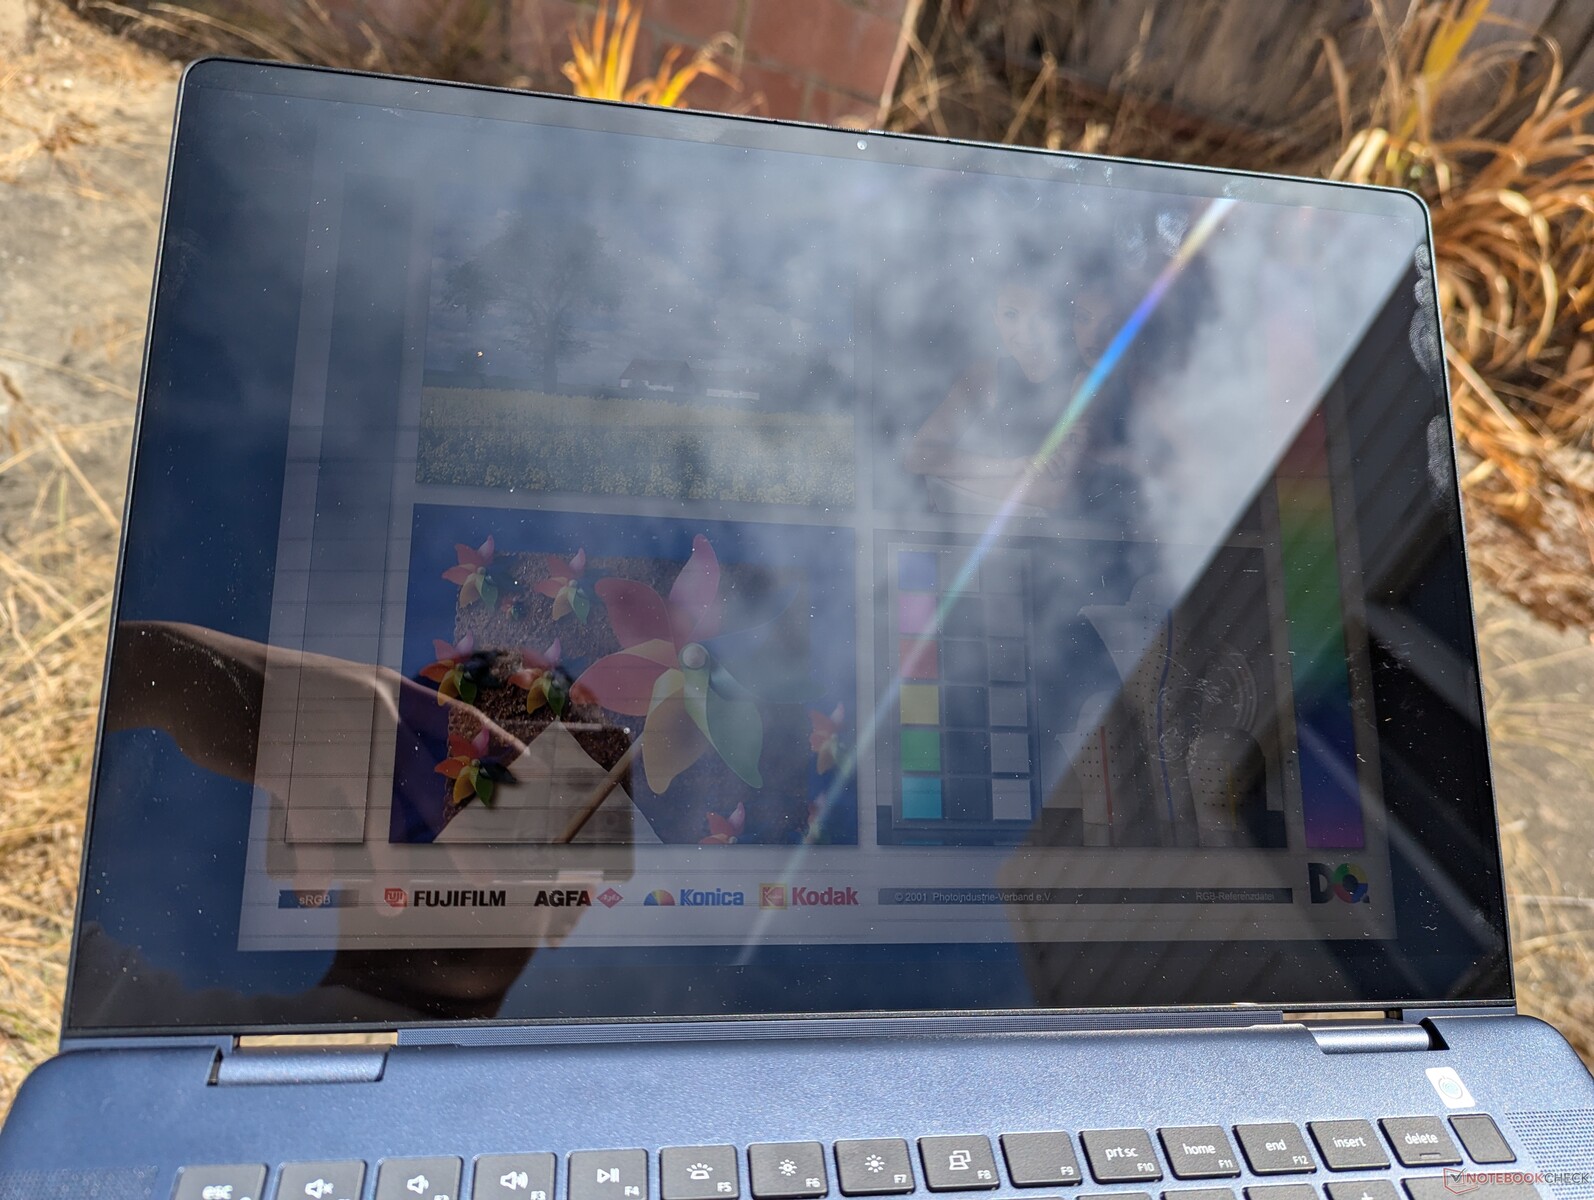
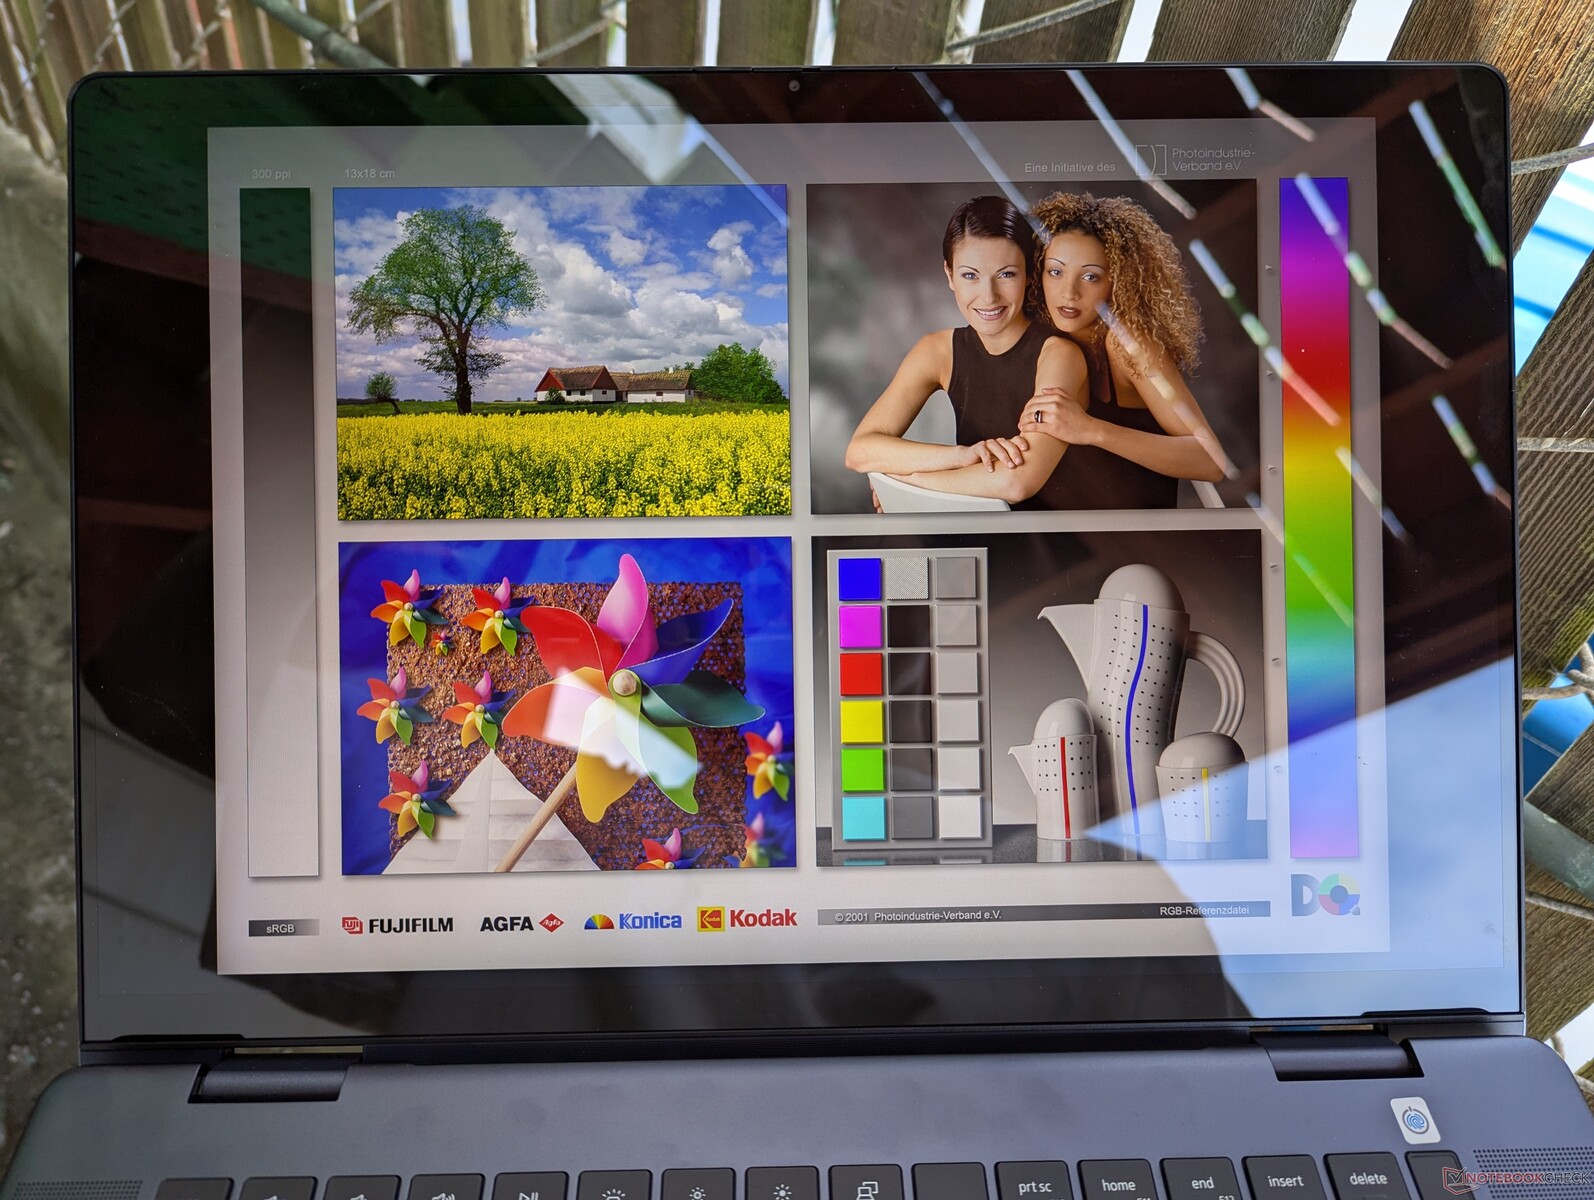
Przy 400 nitach w trybie SDR lub 600 nitach w trybie HDR, ekran jest jaśniejszy niż zarówno podstawowa opcja IPS, jak i opcja OLED w poprzednim modelu. Inspiron 16 2-w-1 nie jest jednak wystarczająco jasny do pracy na zewnątrz, gdzie odblaski szybko stają się problemem. Można by pomyśleć, że włączenie HDR może złagodzić ten problem, ponieważ podnosi pułap jasności, ale proszę pamiętać, że tryb Windows HDR nie jest dostępny na zasilaniu bateryjnym.

Osiągi - szybkie jak na kabriolet
Warunki testowania
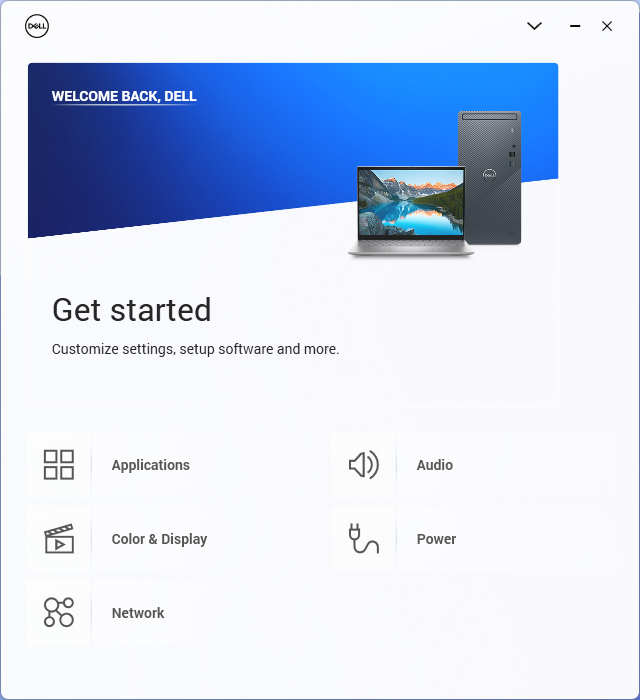
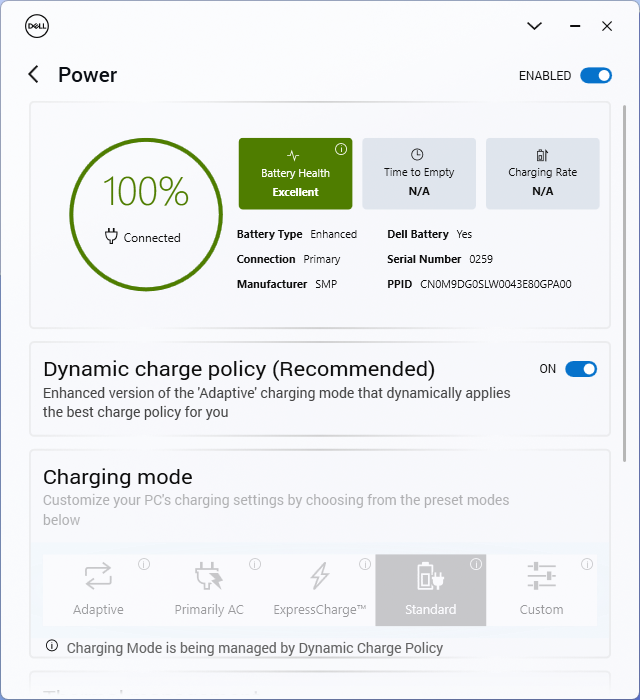
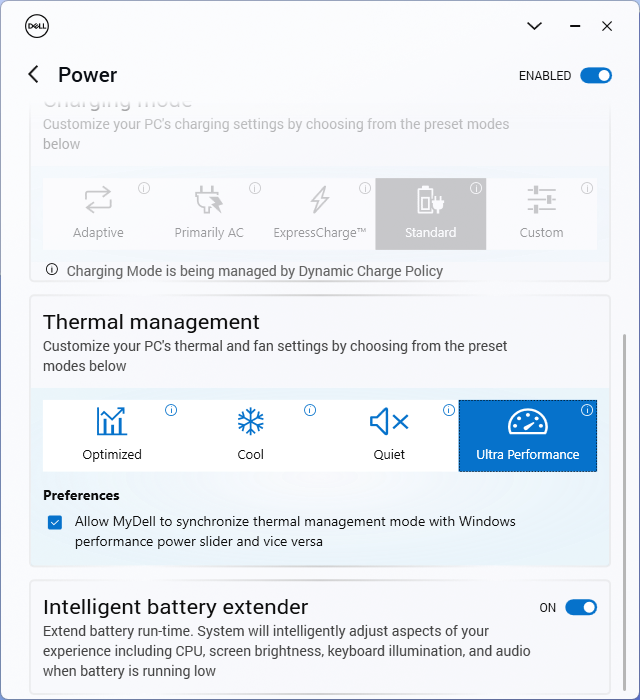
Ustawiliśmy MyDell na tryb wydajności przed uruchomieniem poniższych testów porównawczych. Oprogramowanie posiada wygodny przełącznik do synchronizacji profili zasilania Dell z profilami zasilania Windows, aby ułatwić przełączanie między ustawieniami zasilania.
Procesor
Posiadanie procesora Core z serii H w konwertowalnej obudowie może być czasami niepokojące, ponieważ producent może zaniżać jego wydajność. Na szczęście nie dotyczy to Inspirona 16 7640 2 w 1, ponieważ jego Core Ultra 7 155H osiągnąłby wydajność w granicach 5 procent przeciętnego komputera w naszej bazie danych wyposażonego w dziesięć takich samych procesorów. To sprawia, że model Dell jest jednym z najszybszych konwertowalnych komputerów w kategorii 16-calowych rozmiarów, pokonując wysokowydajne opcje, takie jak Ryzen 7 8840HS w HP Envy x360 16 2-w-1. Warto również zauważyć, że ten sam procesor można również znaleźć w wielu laptopach do gier, aby pokazać, że ten konwertowalny Dell nie oszukuje, jeśli chodzi o wydajność procesora.
Zrównoważony rozwój Turbo Boost jest dobry, ale nie idealny. Podczas uruchamiania CineBench R15 xT w pętli, nasz początkowy wynik 2680 punktów spadłby o około 15 procent po zaledwie trzech przebiegach. 16-calowe obudowy, takie jak Lenovo IdeaPad Pro 5 16 lub Inspiron 16 Plus 7640 z tym samym procesorem są w stanie utrzymać wyższe częstotliwości taktowania Turbo Boost przez dłuższy czas, co pokazuje poniższy wykres.
Decydując się na niższą półkę Core Ultra 5 125U będzie miało znaczący wpływ na wydajność wielowątkową o 40 procent w oparciu o nasz czas spędzony z Lenovo Yoga 7 2-w-1 16. Niemniej jednak, opcja z serii Core U może nadal być idealna dla tych, którzy wolą czas pracy na baterii od surowej wydajności.
Cinebench R15 Multi Loop
Cinebench R23: Multi Core | Single Core
Cinebench R20: CPU (Multi Core) | CPU (Single Core)
Cinebench R15: CPU Multi 64Bit | CPU Single 64Bit
Blender: v2.79 BMW27 CPU
7-Zip 18.03: 7z b 4 | 7z b 4 -mmt1
Geekbench 6.4: Multi-Core | Single-Core
Geekbench 5.5: Multi-Core | Single-Core
HWBOT x265 Benchmark v2.2: 4k Preset
LibreOffice : 20 Documents To PDF
R Benchmark 2.5: Overall mean
* ... im mniej tym lepiej
AIDA64: FP32 Ray-Trace | FPU Julia | CPU SHA3 | CPU Queen | FPU SinJulia | FPU Mandel | CPU AES | CPU ZLib | FP64 Ray-Trace | CPU PhotoWorxx
| Performance Rating | |
| Lenovo IdeaPad Pro 5 16IMH G9 | |
| HP Envy x360 2-in-1 16-ad0097nr | |
| Dell Inspiron 16 7640 2-in-1 | |
| Dell Inspiron 16 Plus 7640 | |
| Przeciętny Intel Core Ultra 7 155H | |
| Dell Inspiron 16 7635 2-in-1 | |
| Samsung Galaxy Book4 Pro 360 | |
| AIDA64 / FP32 Ray-Trace | |
| HP Envy x360 2-in-1 16-ad0097nr | |
| Lenovo IdeaPad Pro 5 16IMH G9 | |
| Dell Inspiron 16 7640 2-in-1 | |
| Dell Inspiron 16 Plus 7640 | |
| Przeciętny Intel Core Ultra 7 155H (6670 - 18470, n=50) | |
| Dell Inspiron 16 7635 2-in-1 | |
| Samsung Galaxy Book4 Pro 360 | |
| AIDA64 / FPU Julia | |
| Lenovo IdeaPad Pro 5 16IMH G9 | |
| HP Envy x360 2-in-1 16-ad0097nr | |
| Dell Inspiron 16 7640 2-in-1 | |
| Dell Inspiron 16 Plus 7640 | |
| Przeciętny Intel Core Ultra 7 155H (40905 - 93181, n=50) | |
| Dell Inspiron 16 7635 2-in-1 | |
| Samsung Galaxy Book4 Pro 360 | |
| AIDA64 / CPU SHA3 | |
| Lenovo IdeaPad Pro 5 16IMH G9 | |
| HP Envy x360 2-in-1 16-ad0097nr | |
| Dell Inspiron 16 7640 2-in-1 | |
| Dell Inspiron 16 Plus 7640 | |
| Przeciętny Intel Core Ultra 7 155H (1940 - 4436, n=50) | |
| Samsung Galaxy Book4 Pro 360 | |
| Dell Inspiron 16 7635 2-in-1 | |
| AIDA64 / CPU Queen | |
| HP Envy x360 2-in-1 16-ad0097nr | |
| Dell Inspiron 16 7640 2-in-1 | |
| Dell Inspiron 16 Plus 7640 | |
| Lenovo IdeaPad Pro 5 16IMH G9 | |
| Przeciętny Intel Core Ultra 7 155H (64698 - 94181, n=50) | |
| Samsung Galaxy Book4 Pro 360 | |
| Dell Inspiron 16 7635 2-in-1 | |
| AIDA64 / FPU SinJulia | |
| HP Envy x360 2-in-1 16-ad0097nr | |
| Lenovo IdeaPad Pro 5 16IMH G9 | |
| Dell Inspiron 16 7640 2-in-1 | |
| Dell Inspiron 16 Plus 7640 | |
| Przeciętny Intel Core Ultra 7 155H (5639 - 10647, n=50) | |
| Dell Inspiron 16 7635 2-in-1 | |
| Samsung Galaxy Book4 Pro 360 | |
| AIDA64 / FPU Mandel | |
| HP Envy x360 2-in-1 16-ad0097nr | |
| Lenovo IdeaPad Pro 5 16IMH G9 | |
| Dell Inspiron 16 7640 2-in-1 | |
| Dell Inspiron 16 Plus 7640 | |
| Dell Inspiron 16 7635 2-in-1 | |
| Przeciętny Intel Core Ultra 7 155H (18236 - 47685, n=50) | |
| Samsung Galaxy Book4 Pro 360 | |
| AIDA64 / CPU AES | |
| Lenovo IdeaPad Pro 5 16IMH G9 | |
| Przeciętny Intel Core Ultra 7 155H (45713 - 152179, n=50) | |
| Dell Inspiron 16 7640 2-in-1 | |
| HP Envy x360 2-in-1 16-ad0097nr | |
| Dell Inspiron 16 Plus 7640 | |
| Samsung Galaxy Book4 Pro 360 | |
| Dell Inspiron 16 7635 2-in-1 | |
| AIDA64 / CPU ZLib | |
| Lenovo IdeaPad Pro 5 16IMH G9 | |
| Dell Inspiron 16 Plus 7640 | |
| Dell Inspiron 16 7640 2-in-1 | |
| Przeciętny Intel Core Ultra 7 155H (557 - 1250, n=50) | |
| HP Envy x360 2-in-1 16-ad0097nr | |
| Samsung Galaxy Book4 Pro 360 | |
| Dell Inspiron 16 7635 2-in-1 | |
| AIDA64 / FP64 Ray-Trace | |
| HP Envy x360 2-in-1 16-ad0097nr | |
| Lenovo IdeaPad Pro 5 16IMH G9 | |
| Dell Inspiron 16 7640 2-in-1 | |
| Dell Inspiron 16 Plus 7640 | |
| Przeciętny Intel Core Ultra 7 155H (3569 - 9802, n=50) | |
| Dell Inspiron 16 7635 2-in-1 | |
| Samsung Galaxy Book4 Pro 360 | |
| AIDA64 / CPU PhotoWorxx | |
| Lenovo IdeaPad Pro 5 16IMH G9 | |
| Przeciętny Intel Core Ultra 7 155H (32719 - 54223, n=50) | |
| Samsung Galaxy Book4 Pro 360 | |
| Dell Inspiron 16 7640 2-in-1 | |
| Dell Inspiron 16 Plus 7640 | |
| HP Envy x360 2-in-1 16-ad0097nr | |
| Dell Inspiron 16 7635 2-in-1 | |
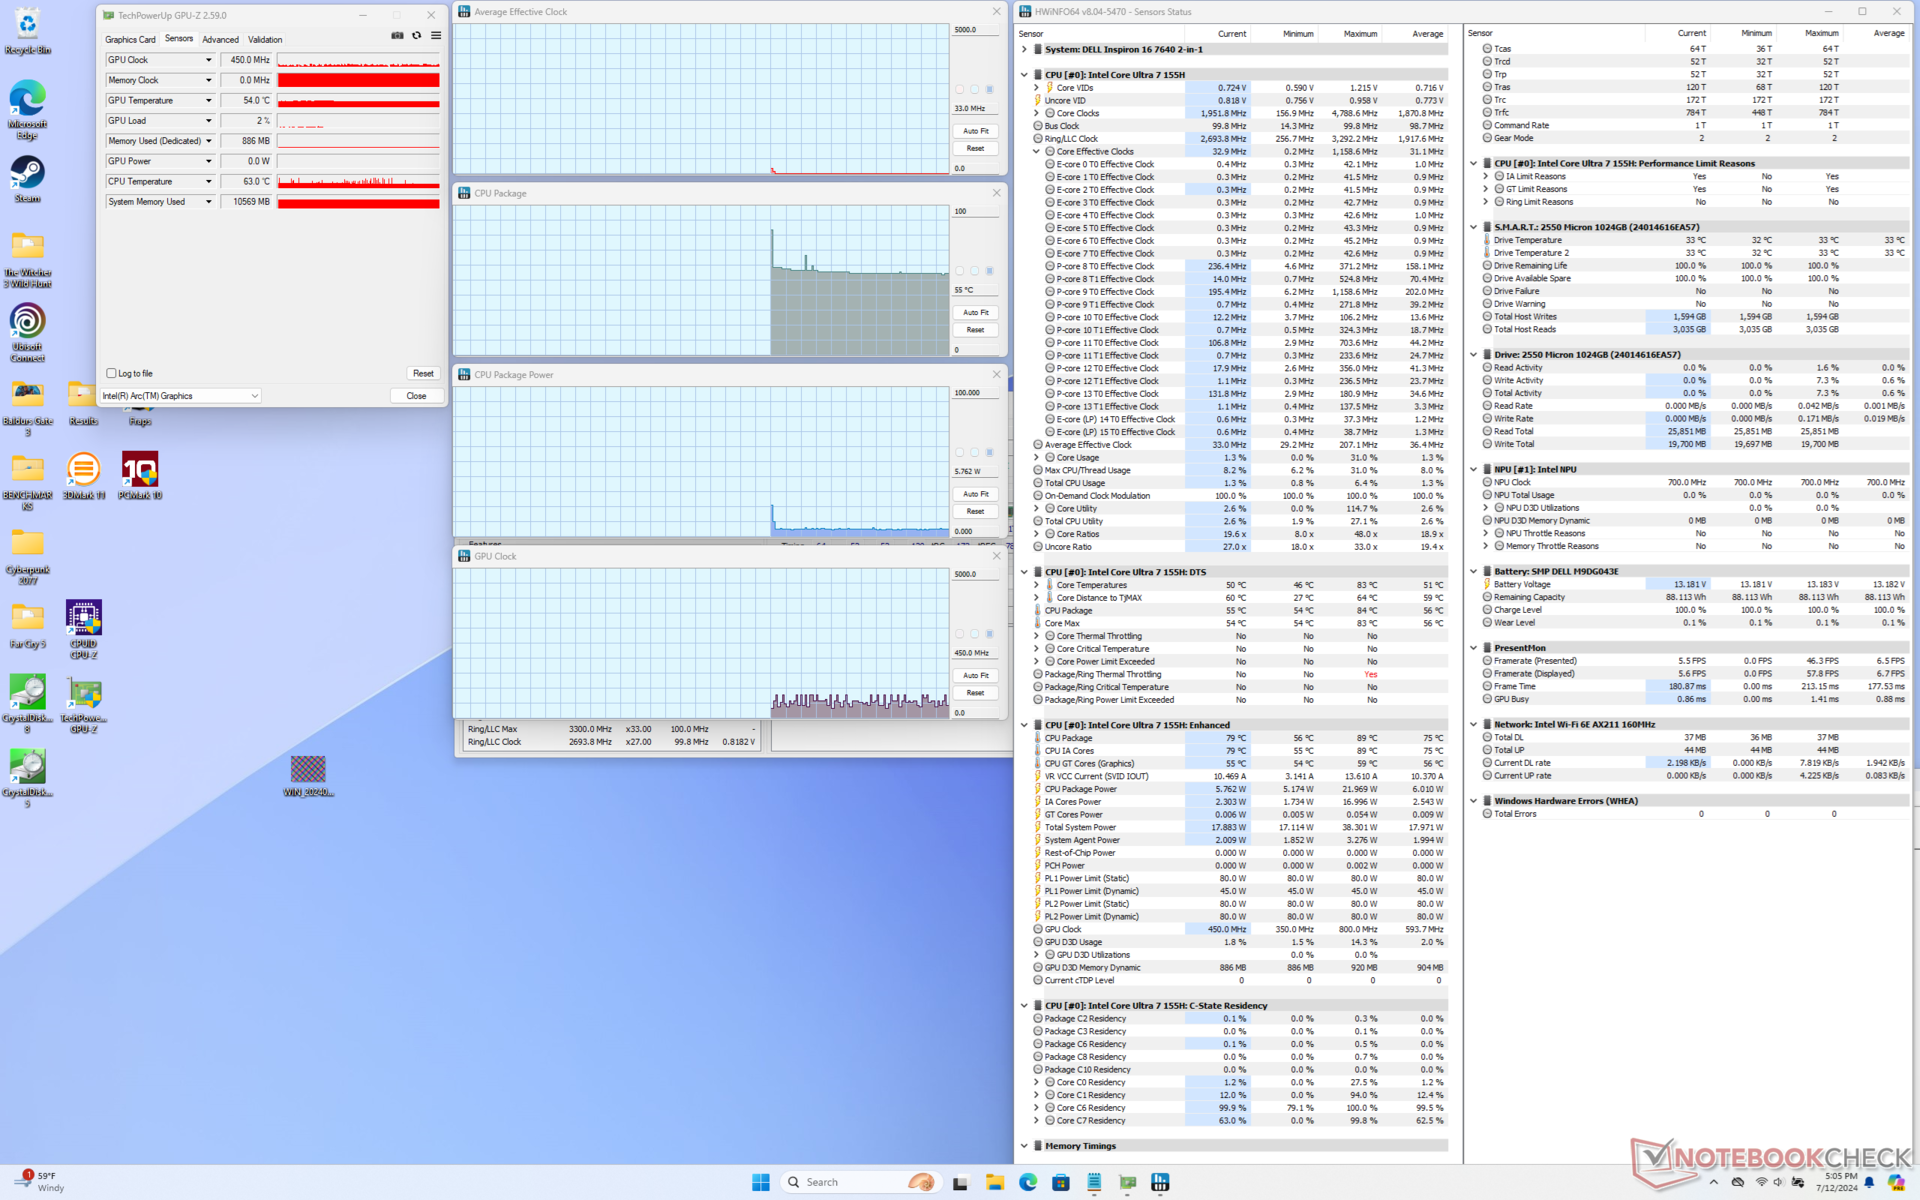
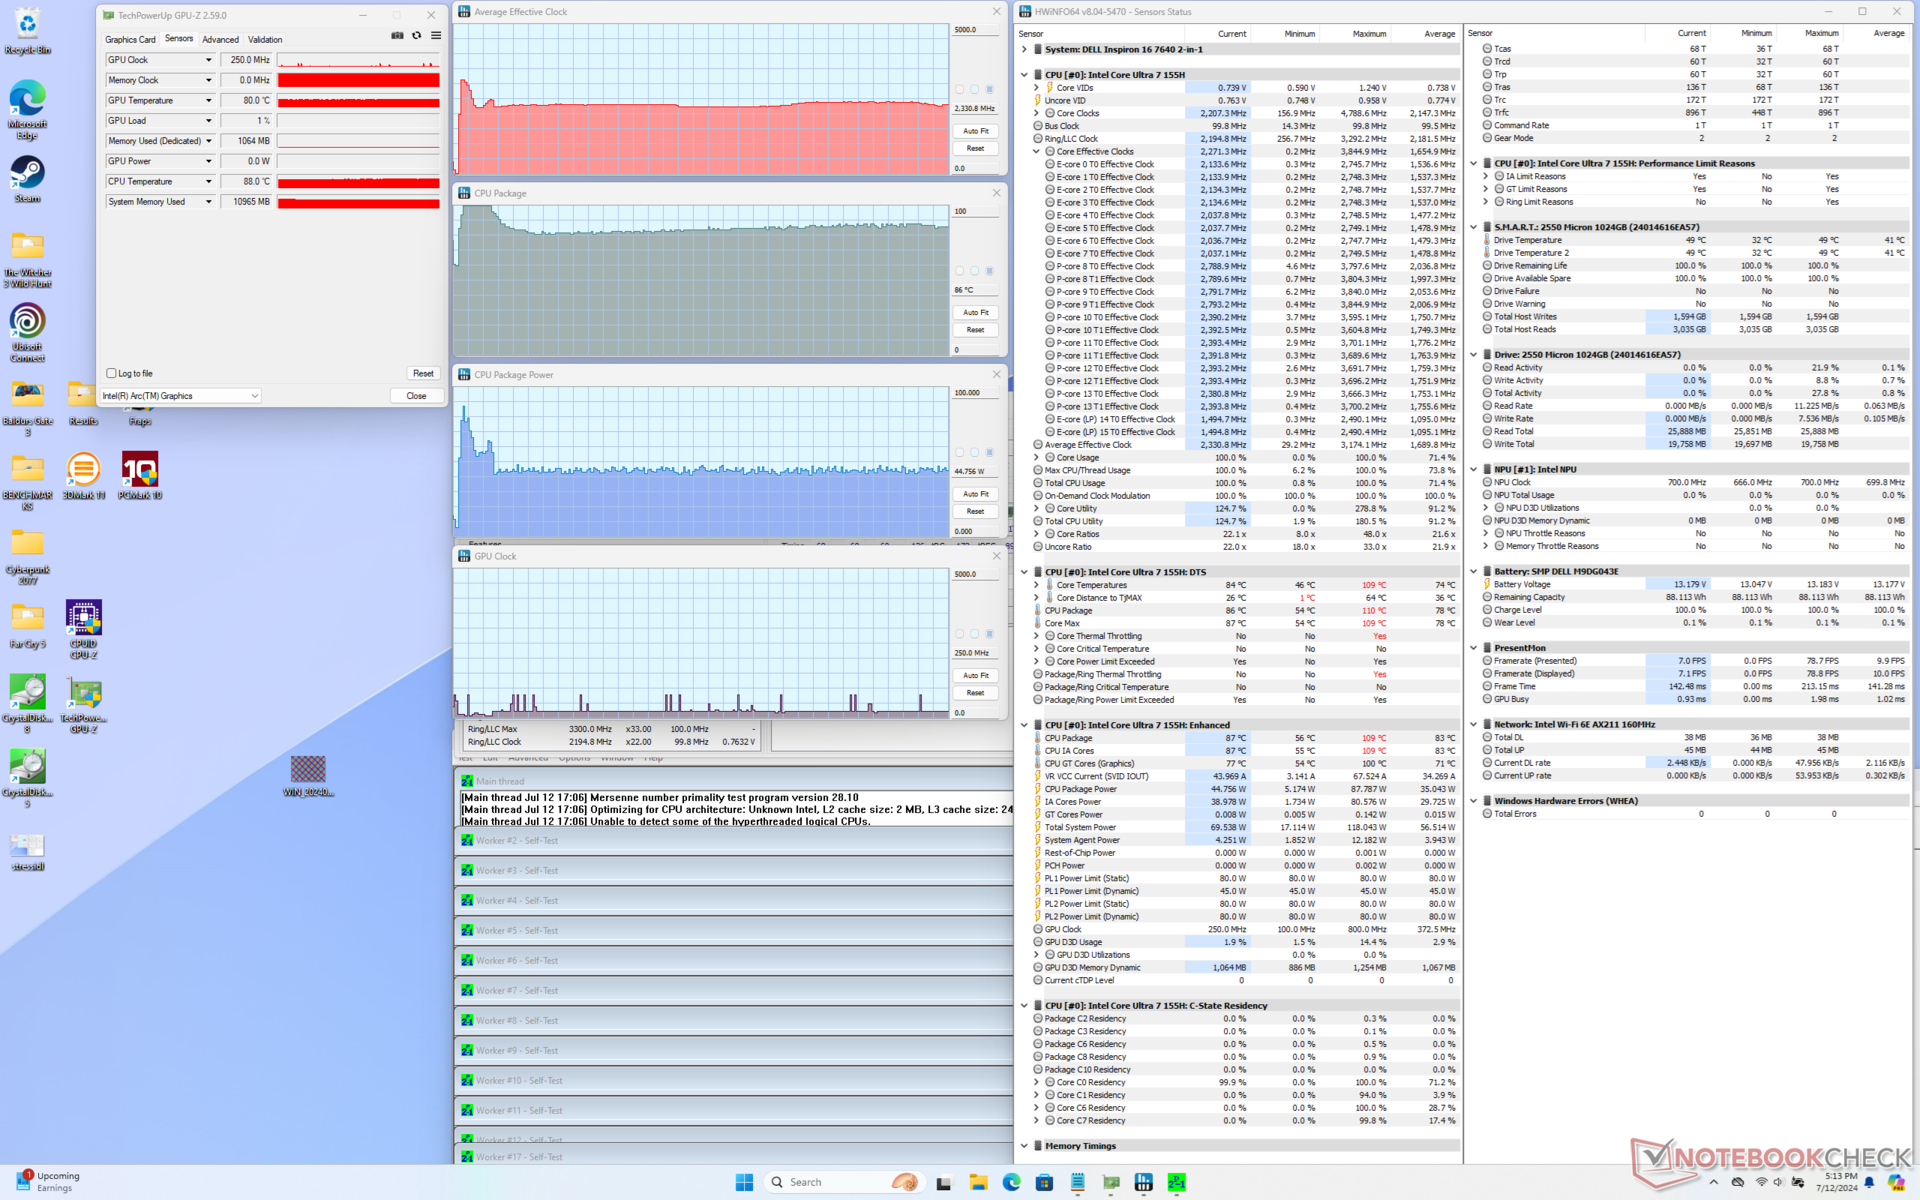
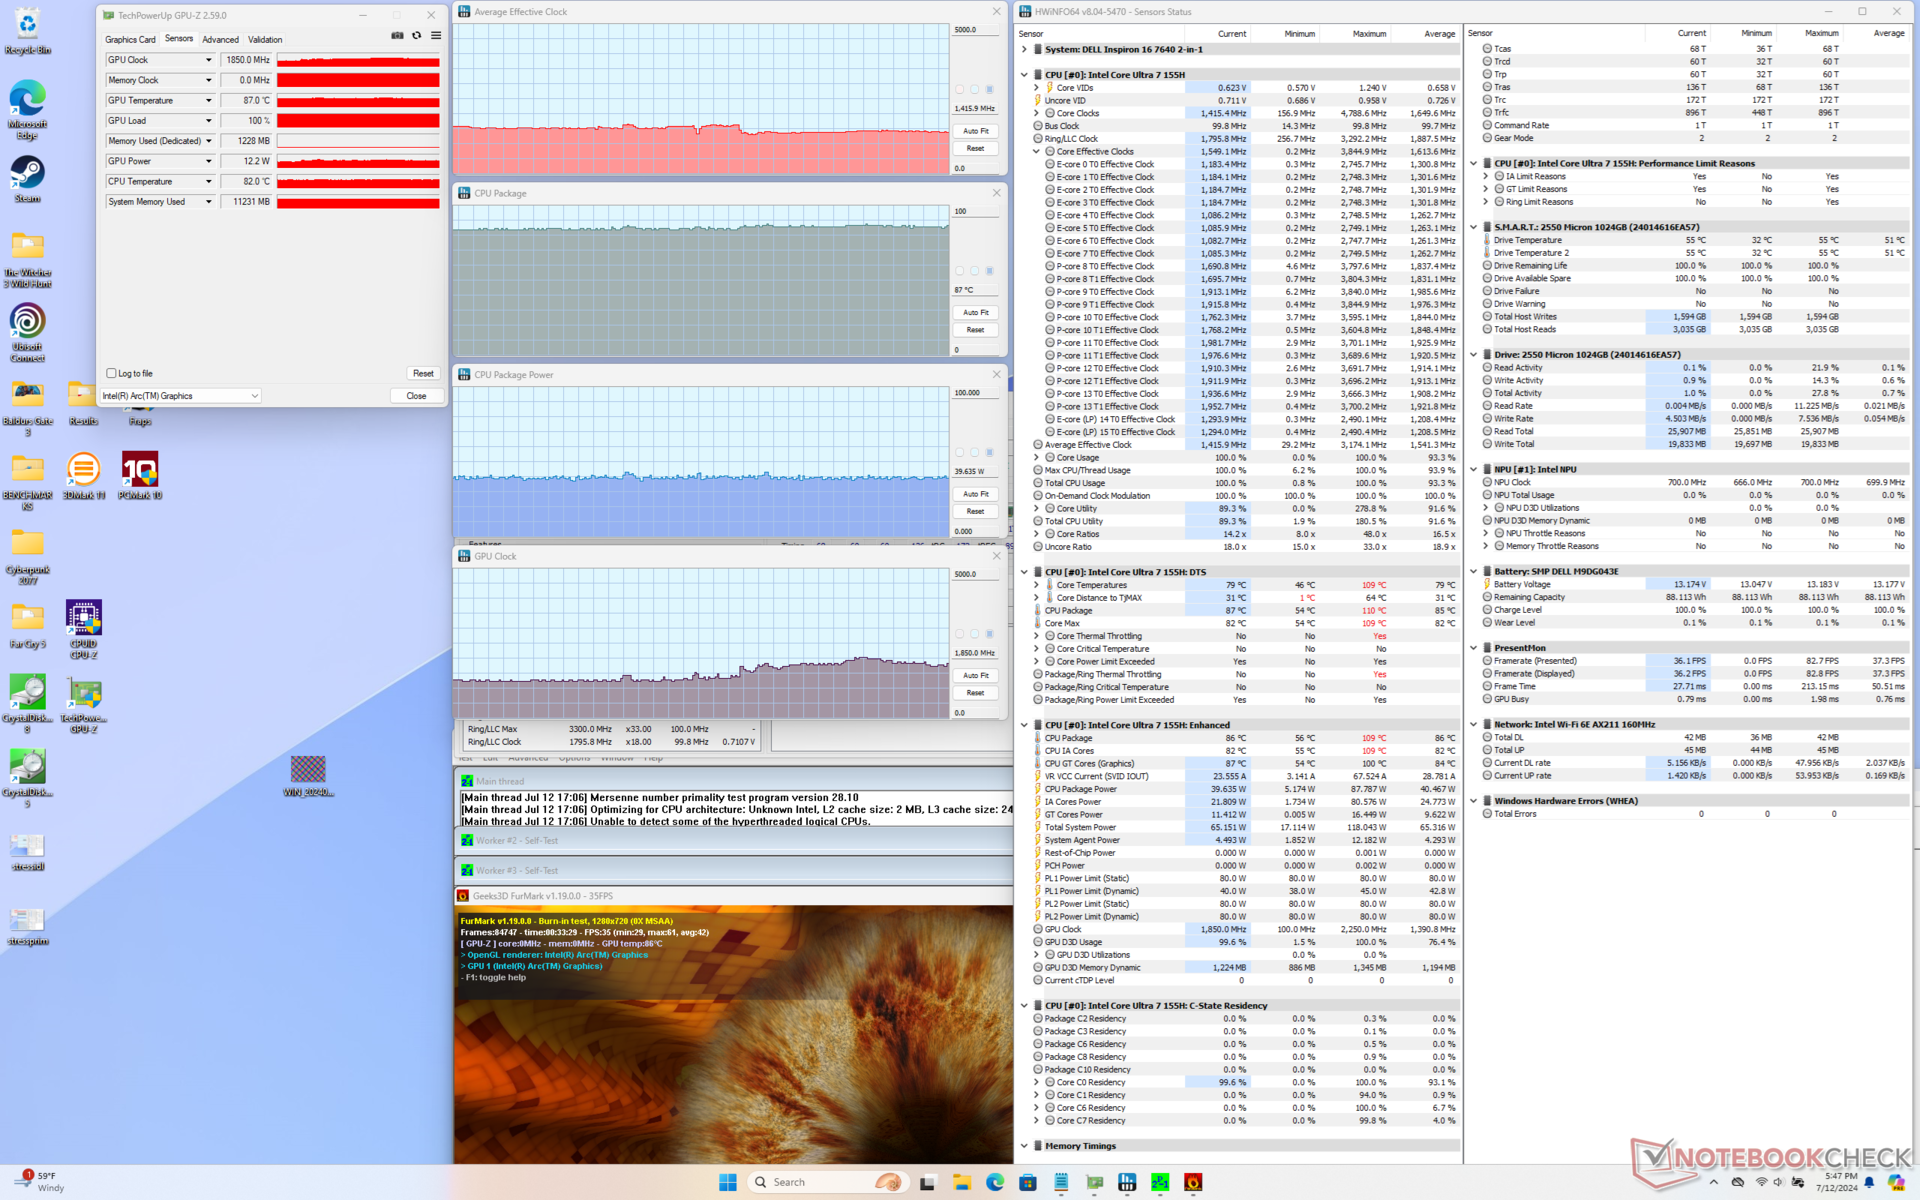
Test warunków skrajnych
Procesor zwiększał taktowanie do 3,2 GHz i 88 W przez zaledwie kilka sekund, zanim osiągnął bardzo wysoką temperaturę pakietu rdzenia wynoszącą 109 C (!). Następnie szybko spadłby do zaledwie 2,3 GHz i 44 W, aby utrzymać niższą temperaturę rdzenia wynoszącą 86 C. Zakresy temperatur są jednak cieplejsze niż to, co zarejestrowaliśmy na Inspironie 16 7635 2-w-1, szczególnie podczas uruchamiania gier, w których nasz procesor ustabilizowałby się w wysokim zakresie 90 C w porównaniu do zakresu 70 C na starszym Inspironie 16 7635 2-w-1. Różnica ta przyczyniła się również do ogólnej wyższej temperatury powierzchni, jak pokazano w sekcji Temperatura poniżej.
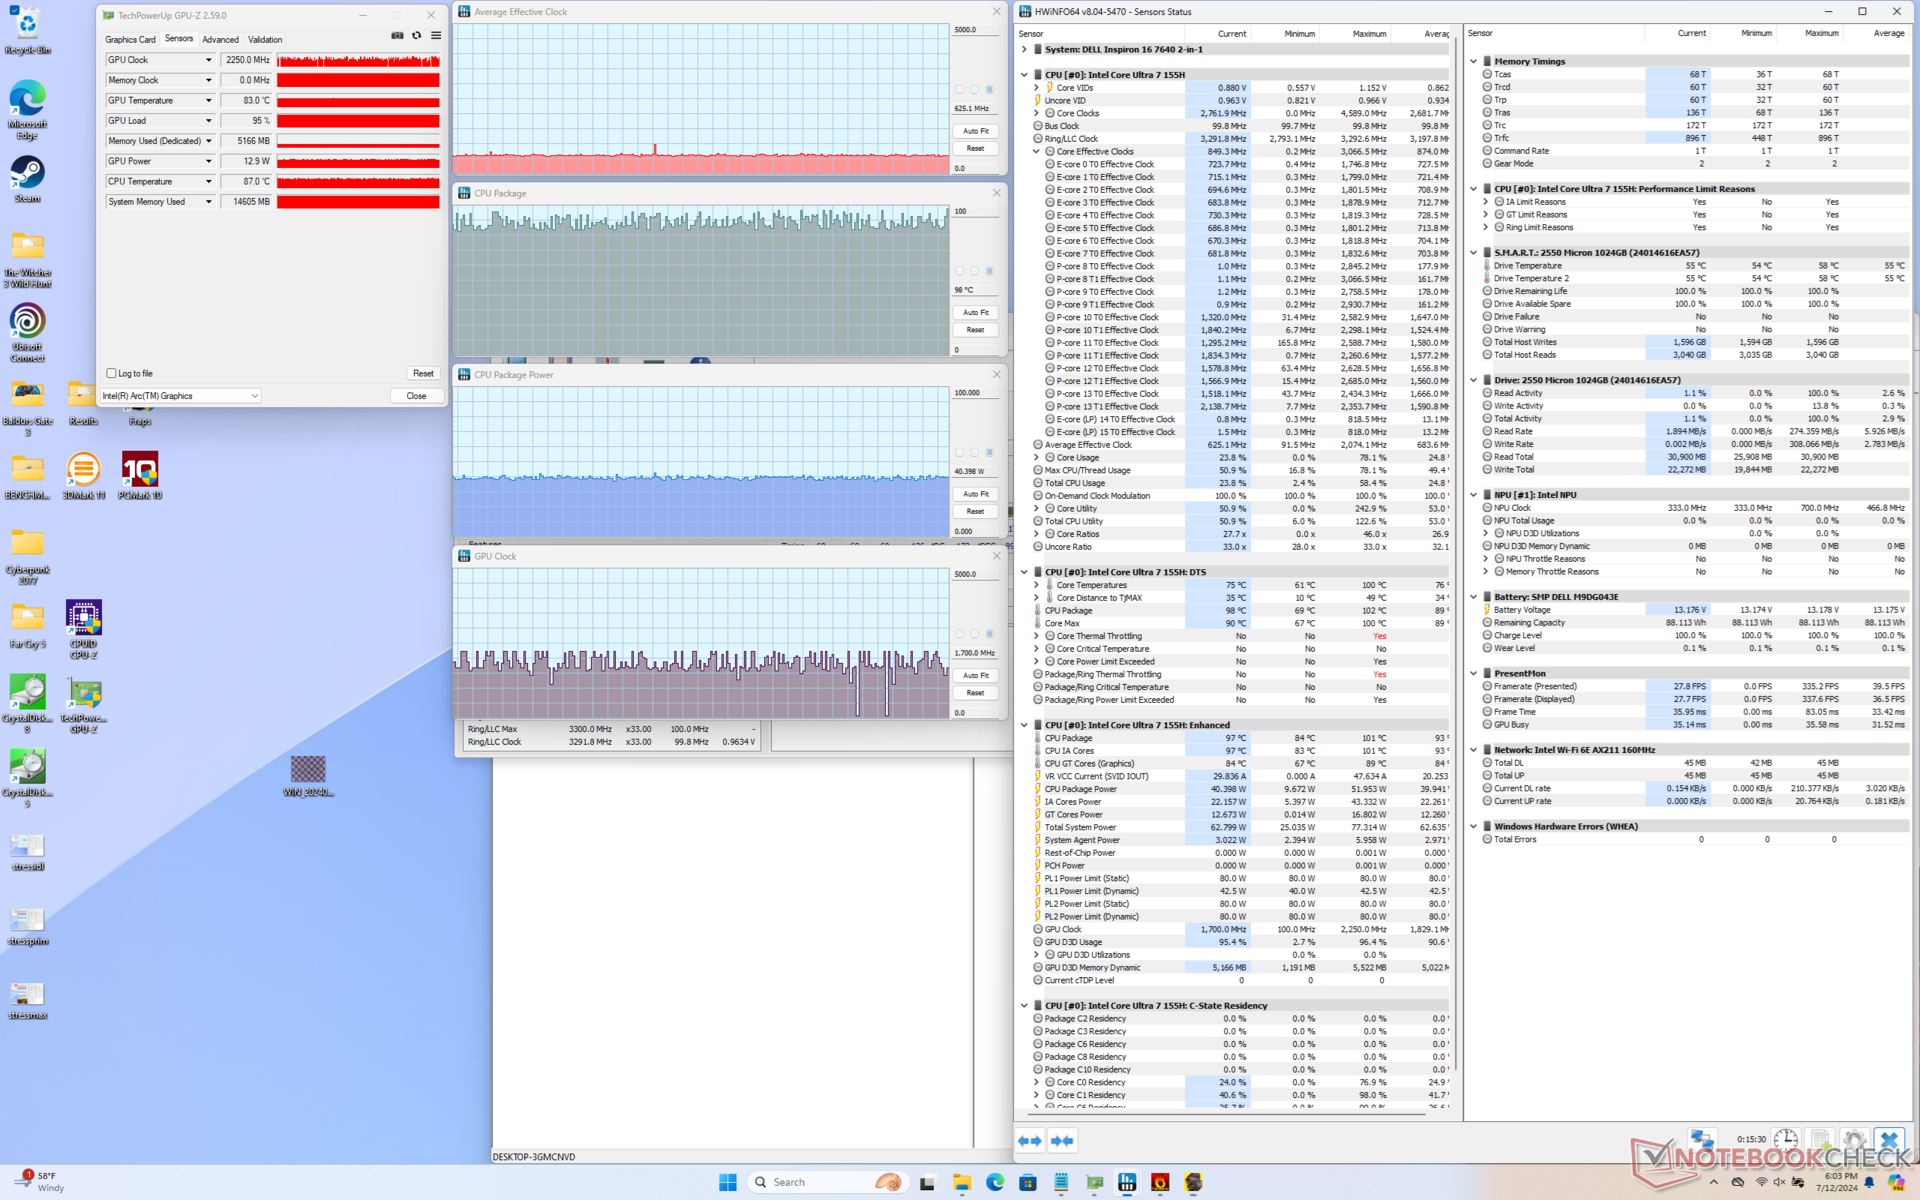
| Średnietaktowanie CPU (GHz) | TaktowanieGPU (MHz) | Średnia temperatura CPU (°C) | |
| System bezczynności | -- | -- | 55 |
| Prime95Stress | 2.3 | -- | 86 |
| Prime95+ FurMark Stress | 1.4 | 1250 - 1850 | 87 |
| Cyberpunk 2077 Stress | 0.6 | 1650 - 2250 | 90 - 98 |
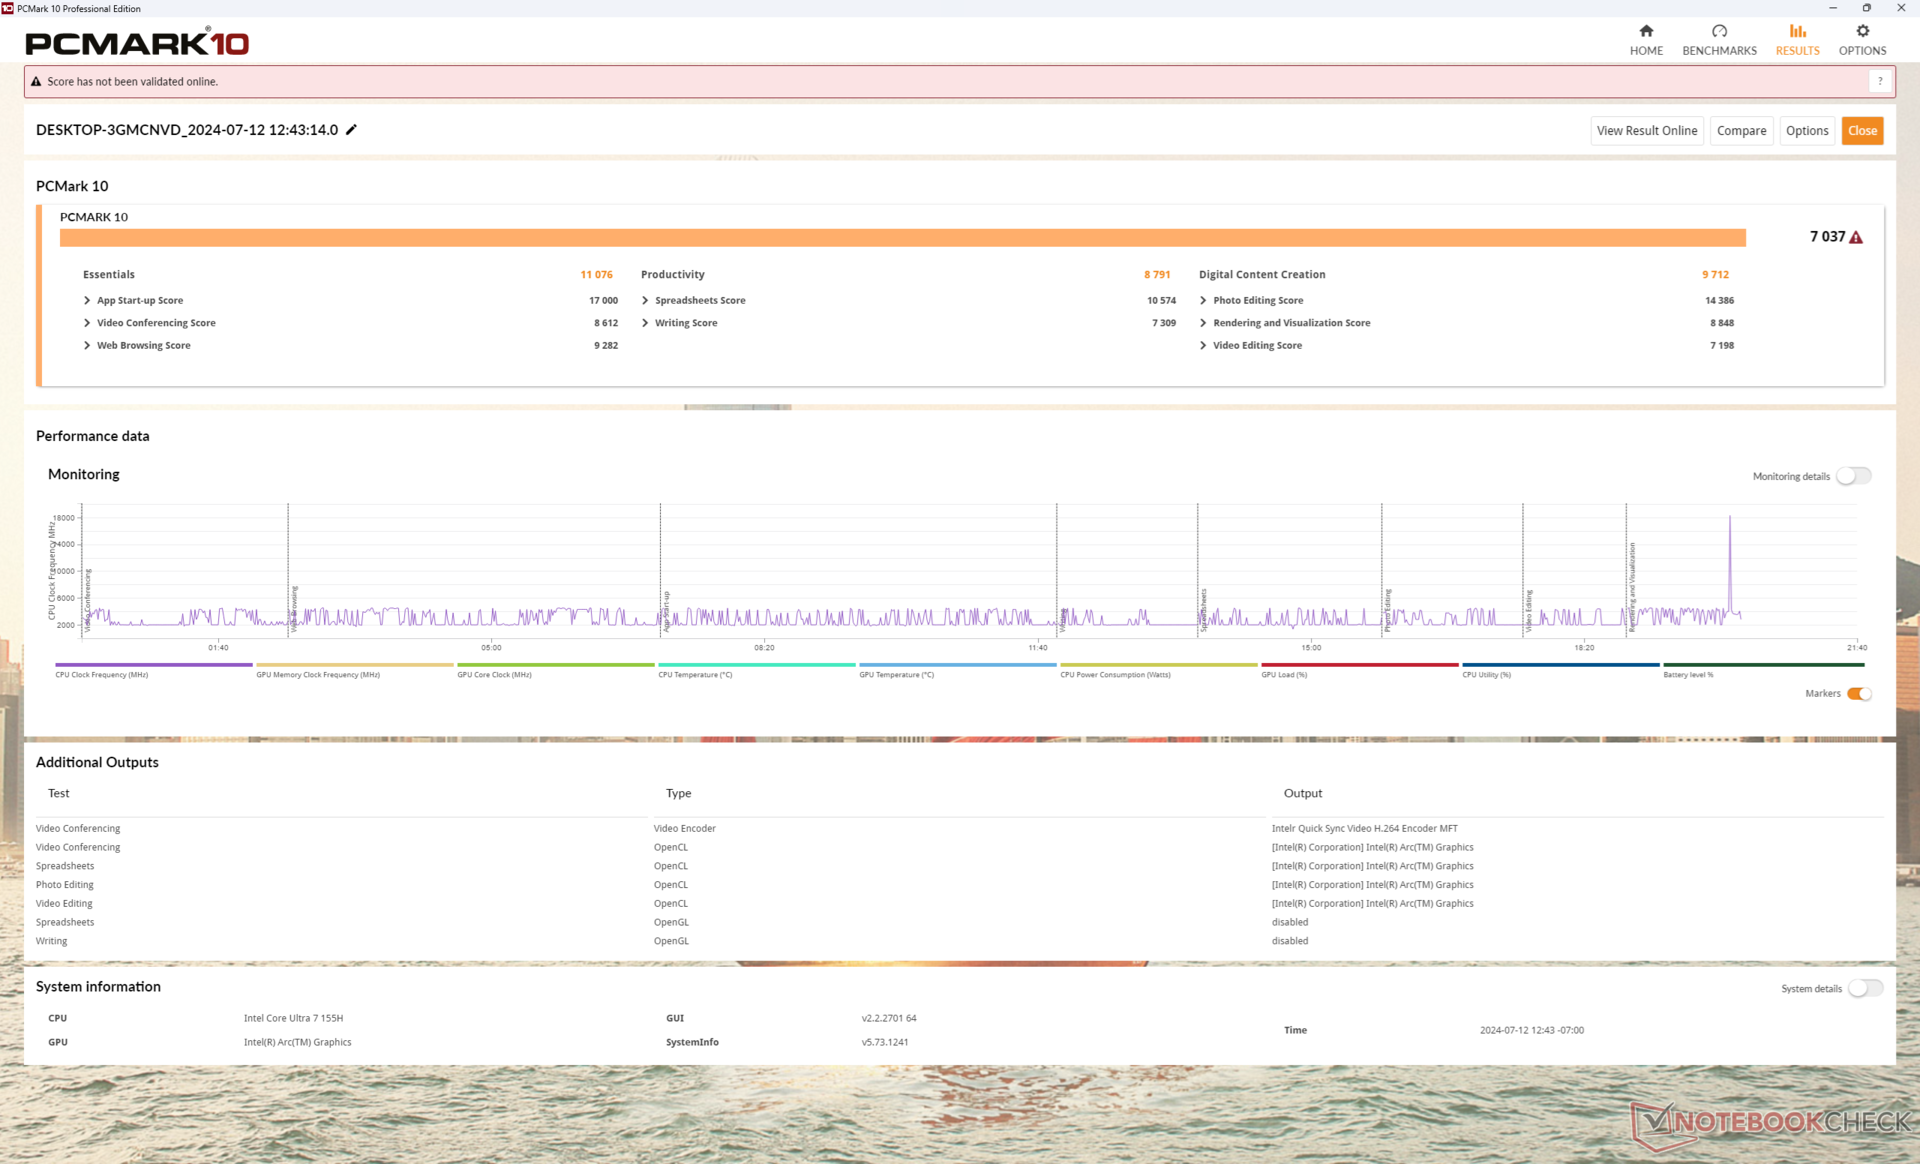
Wydajność systemu
Wyniki PCMark są doskonałe i porównywalne z innymi maszynami w naszej bazie danych wyposażonymi w ten sam procesor i zintegrowany układ graficzny. Nasz średni wynik dla Della jest jednym z najwyższych spośród wszystkich 16-calowych kabrioletów, ale alternatywy z oddzielnymi GPU, takie jak HP Spectre x360 16 nadal będą oferować szybszą wydajność graficzną.
CrossMark: Overall | Productivity | Creativity | Responsiveness
WebXPRT 3: Overall
WebXPRT 4: Overall
Mozilla Kraken 1.1: Total
| PCMark 10 / Score | |
| Lenovo IdeaPad Pro 5 16IMH G9 | |
| Dell Inspiron 16 Plus 7640 | |
| Dell Inspiron 16 7640 2-in-1 | |
| HP Envy x360 2-in-1 16-ad0097nr | |
| Przeciętny Intel Core Ultra 7 155H, Intel Arc 8-Core iGPU (4809 - 7529, n=34) | |
| Samsung Galaxy Book4 Pro 360 | |
| Dell Inspiron 16 7635 2-in-1 | |
| PCMark 10 / Essentials | |
| Lenovo IdeaPad Pro 5 16IMH G9 | |
| Dell Inspiron 16 7640 2-in-1 | |
| Dell Inspiron 16 7635 2-in-1 | |
| Samsung Galaxy Book4 Pro 360 | |
| HP Envy x360 2-in-1 16-ad0097nr | |
| Przeciętny Intel Core Ultra 7 155H, Intel Arc 8-Core iGPU (7605 - 11289, n=34) | |
| Dell Inspiron 16 Plus 7640 | |
| PCMark 10 / Productivity | |
| HP Envy x360 2-in-1 16-ad0097nr | |
| Dell Inspiron 16 7635 2-in-1 | |
| Lenovo IdeaPad Pro 5 16IMH G9 | |
| Dell Inspiron 16 7640 2-in-1 | |
| Przeciętny Intel Core Ultra 7 155H, Intel Arc 8-Core iGPU (6042 - 10591, n=34) | |
| Dell Inspiron 16 Plus 7640 | |
| Samsung Galaxy Book4 Pro 360 | |
| PCMark 10 / Digital Content Creation | |
| Dell Inspiron 16 Plus 7640 | |
| Lenovo IdeaPad Pro 5 16IMH G9 | |
| Dell Inspiron 16 7640 2-in-1 | |
| Przeciętny Intel Core Ultra 7 155H, Intel Arc 8-Core iGPU (4985 - 10709, n=34) | |
| HP Envy x360 2-in-1 16-ad0097nr | |
| Samsung Galaxy Book4 Pro 360 | |
| Dell Inspiron 16 7635 2-in-1 | |
| CrossMark / Overall | |
| Dell Inspiron 16 7640 2-in-1 | |
| Dell Inspiron 16 Plus 7640 | |
| Przeciętny Intel Core Ultra 7 155H, Intel Arc 8-Core iGPU (1366 - 1903, n=34) | |
| HP Envy x360 2-in-1 16-ad0097nr | |
| Samsung Galaxy Book4 Pro 360 | |
| Lenovo IdeaPad Pro 5 16IMH G9 | |
| Dell Inspiron 16 7635 2-in-1 | |
| CrossMark / Productivity | |
| Dell Inspiron 16 7640 2-in-1 | |
| HP Envy x360 2-in-1 16-ad0097nr | |
| Dell Inspiron 16 Plus 7640 | |
| Przeciętny Intel Core Ultra 7 155H, Intel Arc 8-Core iGPU (1291 - 1798, n=33) | |
| Samsung Galaxy Book4 Pro 360 | |
| Lenovo IdeaPad Pro 5 16IMH G9 | |
| Dell Inspiron 16 7635 2-in-1 | |
| CrossMark / Creativity | |
| Dell Inspiron 16 Plus 7640 | |
| Dell Inspiron 16 7640 2-in-1 | |
| Lenovo IdeaPad Pro 5 16IMH G9 | |
| Przeciętny Intel Core Ultra 7 155H, Intel Arc 8-Core iGPU (1519 - 1929, n=33) | |
| HP Envy x360 2-in-1 16-ad0097nr | |
| Samsung Galaxy Book4 Pro 360 | |
| Dell Inspiron 16 7635 2-in-1 | |
| CrossMark / Responsiveness | |
| Samsung Galaxy Book4 Pro 360 | |
| Przeciętny Intel Core Ultra 7 155H, Intel Arc 8-Core iGPU (939 - 1802, n=33) | |
| Dell Inspiron 16 7640 2-in-1 | |
| HP Envy x360 2-in-1 16-ad0097nr | |
| Dell Inspiron 16 Plus 7640 | |
| Lenovo IdeaPad Pro 5 16IMH G9 | |
| Dell Inspiron 16 7635 2-in-1 | |
| WebXPRT 3 / Overall | |
| HP Envy x360 2-in-1 16-ad0097nr | |
| Dell Inspiron 16 Plus 7640 | |
| Lenovo IdeaPad Pro 5 16IMH G9 | |
| Dell Inspiron 16 7640 2-in-1 | |
| Przeciętny Intel Core Ultra 7 155H, Intel Arc 8-Core iGPU (252 - 299, n=34) | |
| Dell Inspiron 16 7635 2-in-1 | |
| Samsung Galaxy Book4 Pro 360 | |
| WebXPRT 4 / Overall | |
| Lenovo IdeaPad Pro 5 16IMH G9 | |
| Dell Inspiron 16 7640 2-in-1 | |
| Dell Inspiron 16 Plus 7640 | |
| Przeciętny Intel Core Ultra 7 155H, Intel Arc 8-Core iGPU (166.4 - 309, n=29) | |
| HP Envy x360 2-in-1 16-ad0097nr | |
| Samsung Galaxy Book4 Pro 360 | |
| Dell Inspiron 16 7635 2-in-1 | |
| Mozilla Kraken 1.1 / Total | |
| Dell Inspiron 16 7635 2-in-1 | |
| Samsung Galaxy Book4 Pro 360 | |
| Przeciętny Intel Core Ultra 7 155H, Intel Arc 8-Core iGPU (517 - 614, n=35) | |
| HP Envy x360 2-in-1 16-ad0097nr | |
| Dell Inspiron 16 7640 2-in-1 | |
| Dell Inspiron 16 Plus 7640 | |
| Lenovo IdeaPad Pro 5 16IMH G9 | |
* ... im mniej tym lepiej
| PCMark 10 Score | 7037 pkt. | |
Pomoc | ||
| AIDA64 / Memory Copy | |
| Lenovo IdeaPad Pro 5 16IMH G9 | |
| Samsung Galaxy Book4 Pro 360 | |
| Przeciętny Intel Core Ultra 7 155H (62397 - 96791, n=50) | |
| Dell Inspiron 16 7640 2-in-1 | |
| HP Envy x360 2-in-1 16-ad0097nr | |
| Dell Inspiron 16 Plus 7640 | |
| Dell Inspiron 16 7635 2-in-1 | |
| AIDA64 / Memory Read | |
| Lenovo IdeaPad Pro 5 16IMH G9 | |
| Przeciętny Intel Core Ultra 7 155H (60544 - 90647, n=50) | |
| Dell Inspiron 16 Plus 7640 | |
| Samsung Galaxy Book4 Pro 360 | |
| Dell Inspiron 16 7640 2-in-1 | |
| HP Envy x360 2-in-1 16-ad0097nr | |
| Dell Inspiron 16 7635 2-in-1 | |
| AIDA64 / Memory Write | |
| HP Envy x360 2-in-1 16-ad0097nr | |
| Dell Inspiron 16 7640 2-in-1 | |
| Lenovo IdeaPad Pro 5 16IMH G9 | |
| Przeciętny Intel Core Ultra 7 155H (58692 - 93451, n=50) | |
| Samsung Galaxy Book4 Pro 360 | |
| Dell Inspiron 16 Plus 7640 | |
| Dell Inspiron 16 7635 2-in-1 | |
| AIDA64 / Memory Latency | |
| Dell Inspiron 16 7640 2-in-1 | |
| Przeciętny Intel Core Ultra 7 155H (116.2 - 233, n=50) | |
| Lenovo IdeaPad Pro 5 16IMH G9 | |
| Samsung Galaxy Book4 Pro 360 | |
| HP Envy x360 2-in-1 16-ad0097nr | |
| Dell Inspiron 16 Plus 7640 | |
| Dell Inspiron 16 7635 2-in-1 | |
* ... im mniej tym lepiej
Opóźnienie DPC
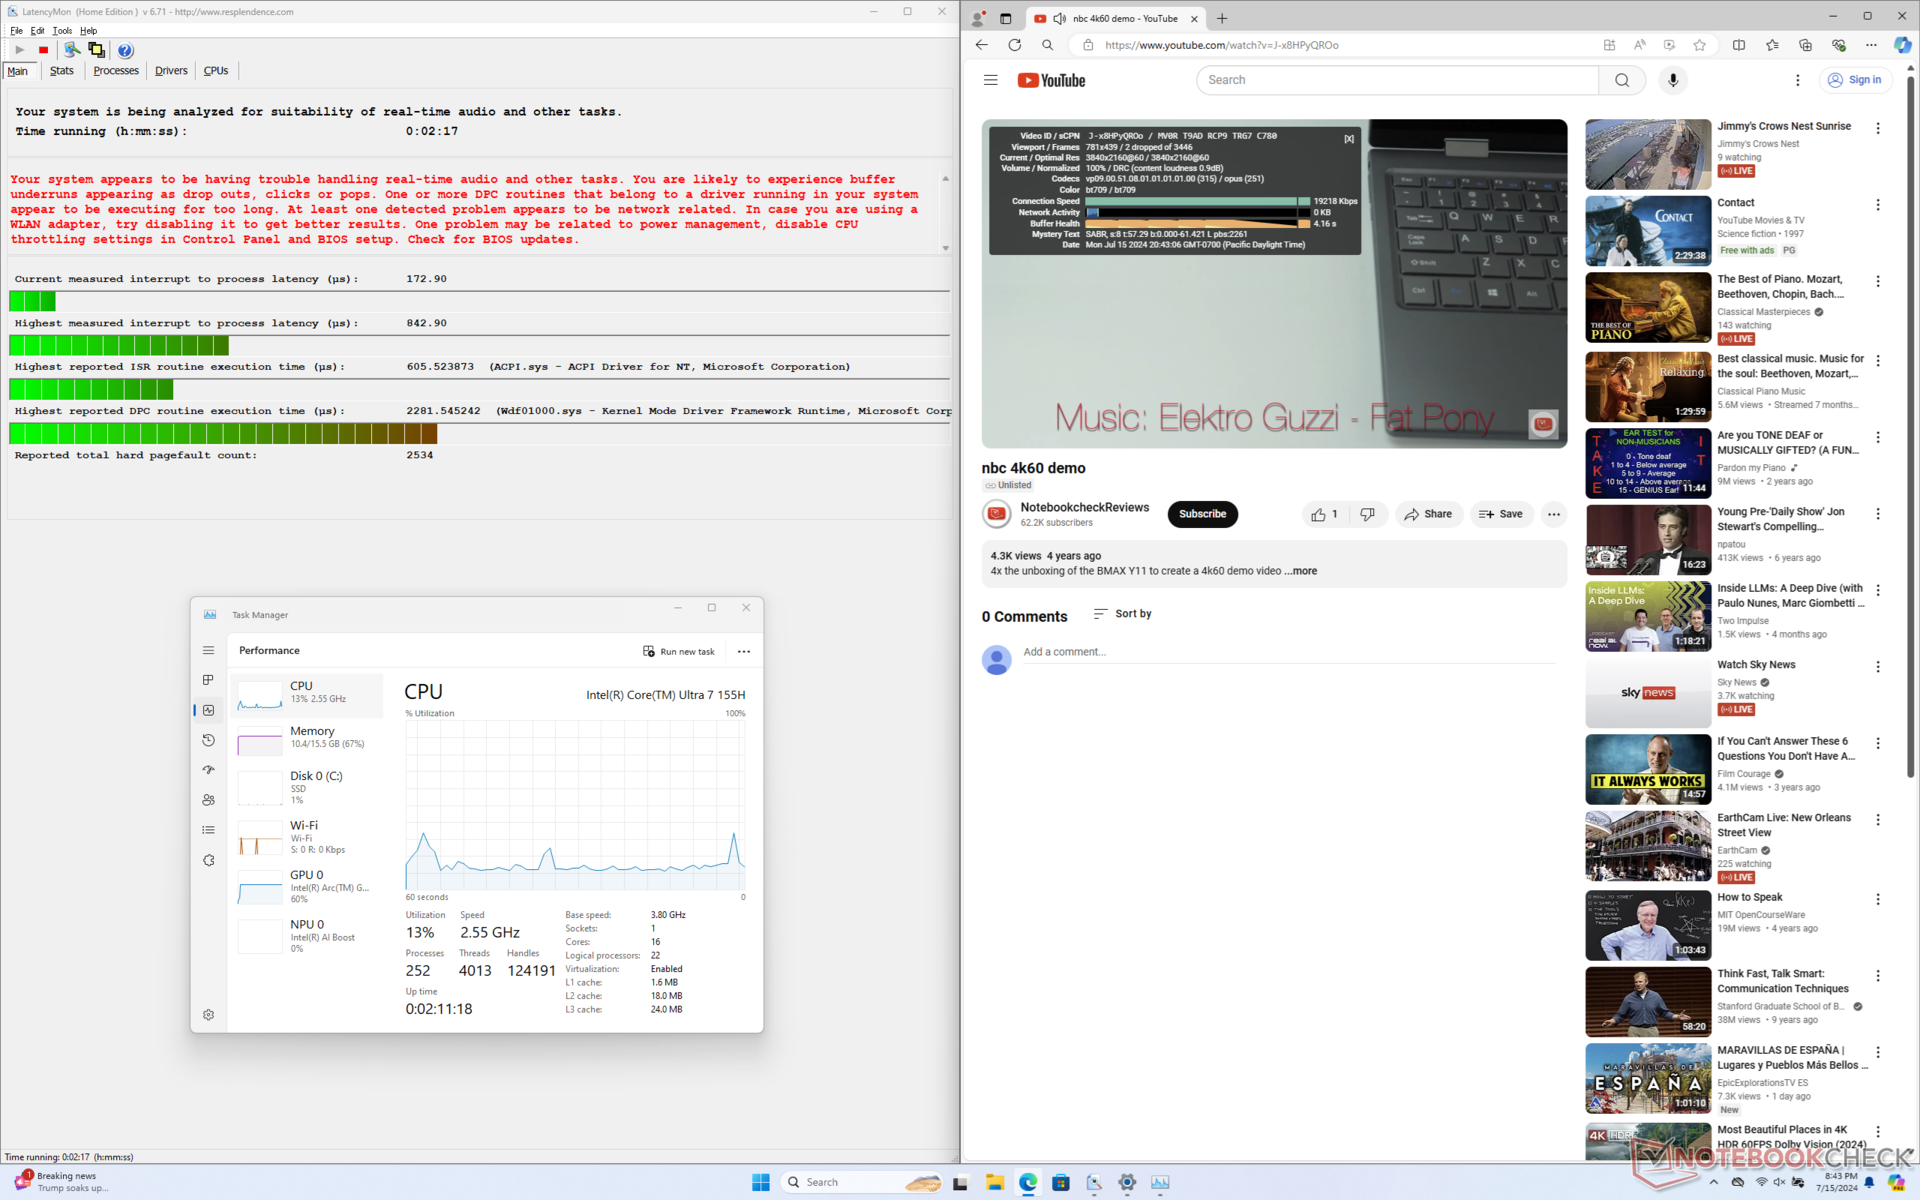
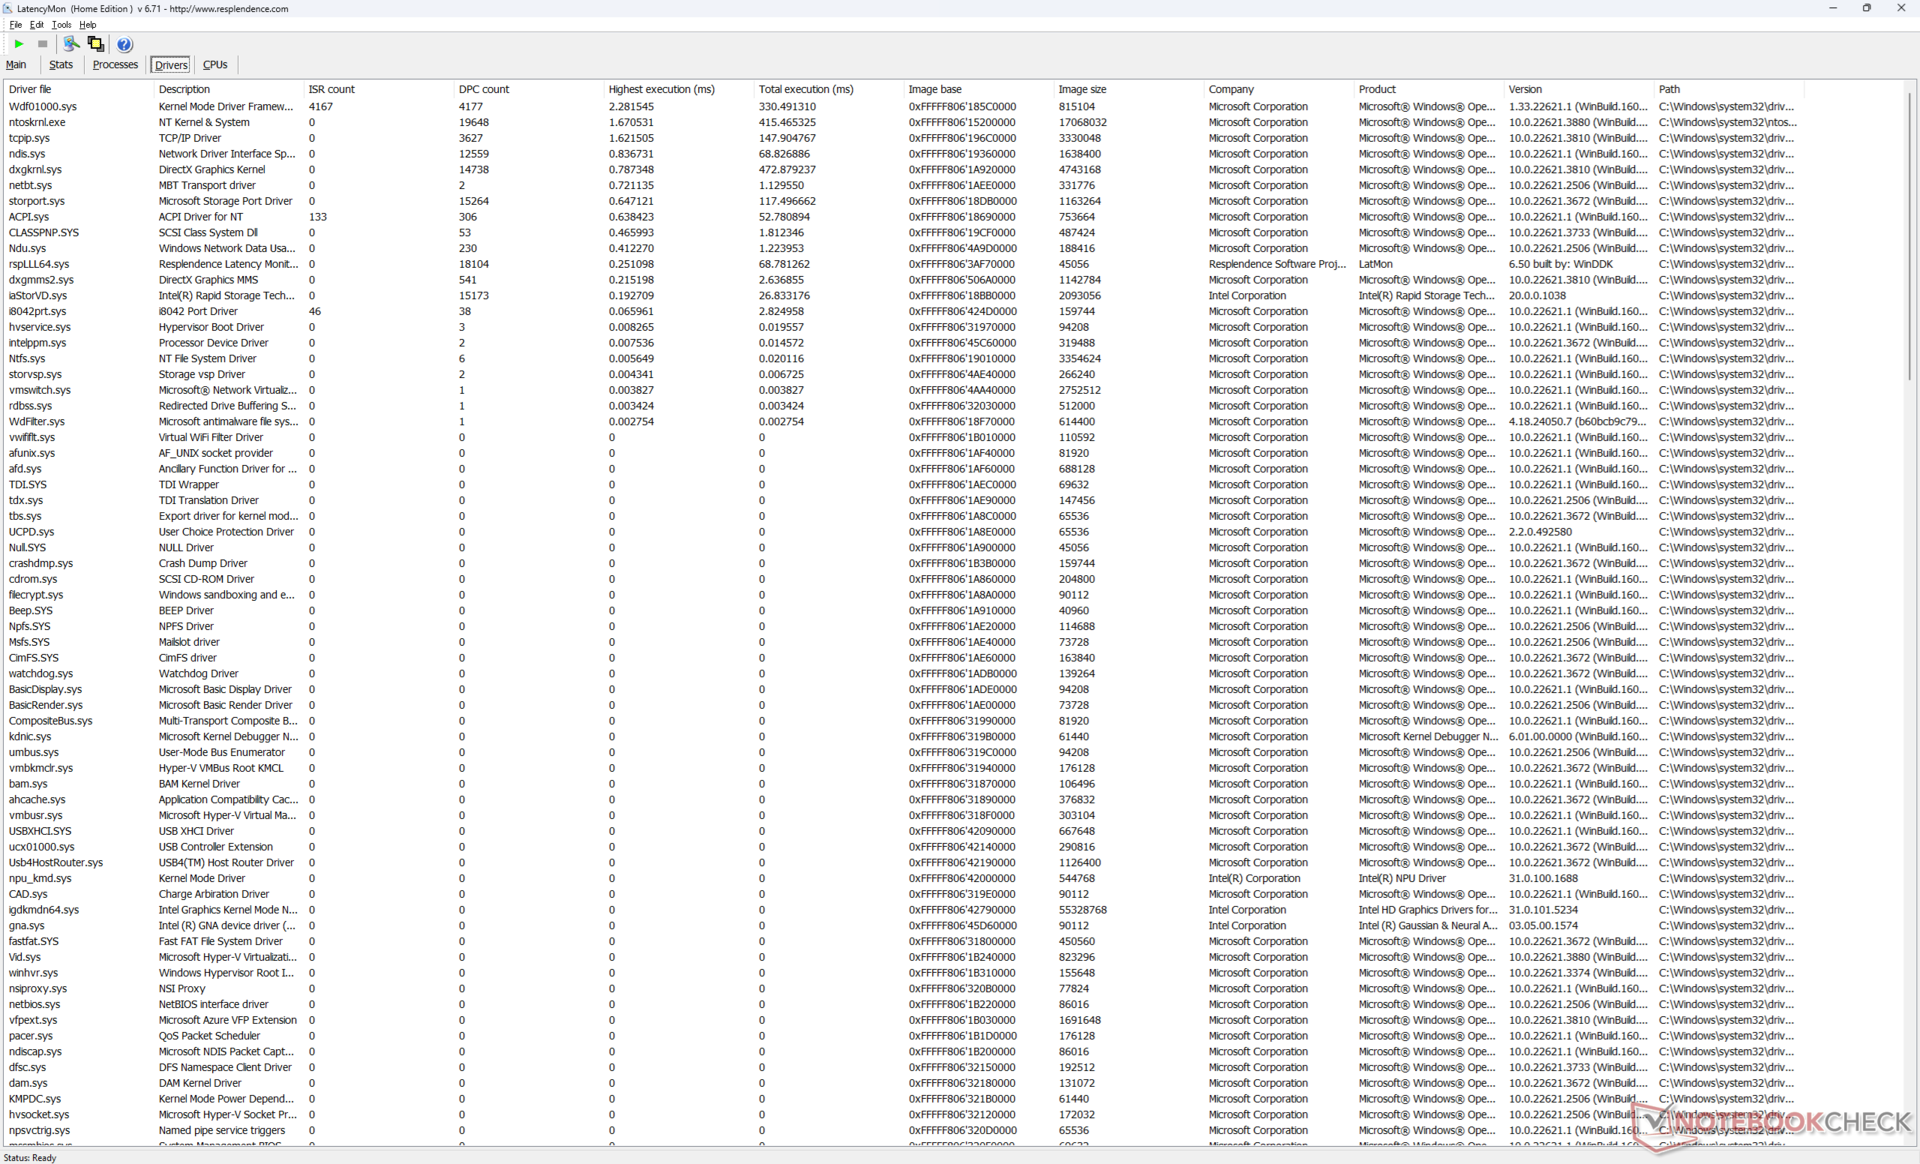
LatencyMon ujawnia drobne problemy z DPC podczas otwierania wielu kart przeglądarki na naszej stronie głównej. Jesteśmy również w stanie zarejestrować 2 spadki klatek podczas minutowego testu wideo 4K60, podczas gdy idealnie powinno być ich 0. Rozbieżności są na szczęście na tyle niewielkie, że są zasadniczo niezauważalne podczas rzeczywistego użytkowania.
| DPC Latencies / LatencyMon - interrupt to process latency (max), Web, Youtube, Prime95 | |
| Samsung Galaxy Book4 Pro 360 | |
| HP Envy x360 2-in-1 16-ad0097nr | |
| Dell Inspiron 16 7640 2-in-1 | |
| Lenovo IdeaPad Pro 5 16IMH G9 | |
| Dell Inspiron 16 Plus 7640 | |
| Dell Inspiron 16 7635 2-in-1 | |
* ... im mniej tym lepiej
Urządzenia pamięci masowej
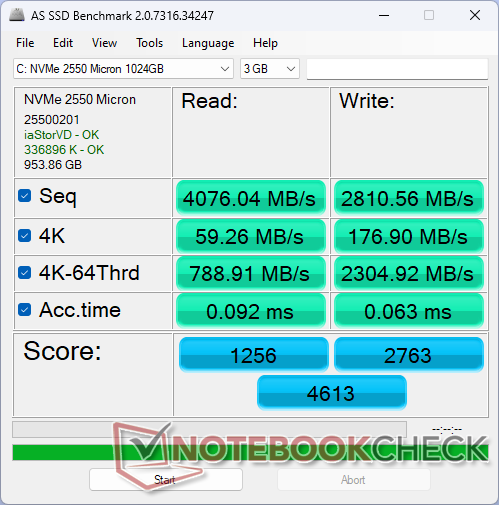
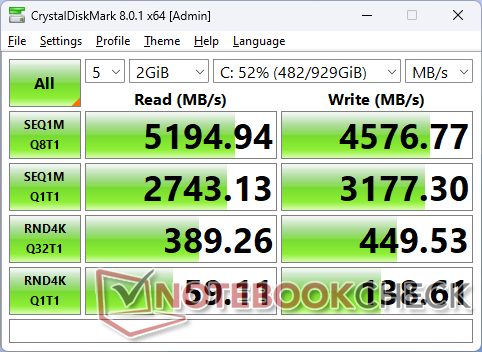
Dell pozyskuje dyski SSD dla serii Inspiron od wielu dostawców, w tym Kioxia, SK Hynix i Micron. Nasza konkretna jednostka testowa jest dostarczana z dyskiem Micron 2550 który jest średniej klasy dyskiem SSD PCIe4 NVMe zdolnym do odczytu z prędkością do 5200 MB/s. Droższe dyski, takie jak Samsung PM9A1, mogą osiągnąć ponad 7000 MB/s, ale Micron 2550 jest wystarczający i odpowiedni dla modelu średniej klasy, takiego jak nasz Inspiron 16 2-w-1.
Prędkości transferu znacznie przewyższają Kioxia BG5 w zeszłorocznym Inspironie 16 7635 2-w-1 z dużym marginesem, nawet po uwzględnieniu dławienia podczas stresu.

* ... im mniej tym lepiej
Disk Throttling: DiskSpd Read Loop, Queue Depth 8
Wydajność GPU
Wydajność graficzna jest całkiem dobra i jedna z najszybszych w przypadku kabrioletów bez uciekania się do opcji dyskretnych. The Arc 8 GPU jest porównywalny do Radeon 780M i znacznie wyprzedza starsze układy Iris Xe 96 EUs lub Radeon RX Vega o ponad 2x w wielu przypadkach. Dla przykładu, Radeon RX Vega 7 w zeszłorocznym Inspironie 16 7635 2-w-1 jest prawie 60 procent w tyle.
Użytkownicy, którzy wymagają wydajności na poziomie gier i akceleracji CUDA, mogą rozważyć Spectre x360 16 z układem GeForce RTX 4050 co stanowi kolejny 2-krotny wzrost grafiki w stosunku do Arc 8. Oczywiście Spectre jest również znacznie droższy od naszego Della.
Proszę pamiętać, że procesor graficzny Arc 8 jest dostępny tylko z konfiguracją Core Ultra 7 155H. Decydując się na Core Ultra 5 125U zamiast tego będziemy musieli zadowolić się Arc 4 co pociąga za sobą znaczny spadek wydajności graficznej o 40 do 45 procent.
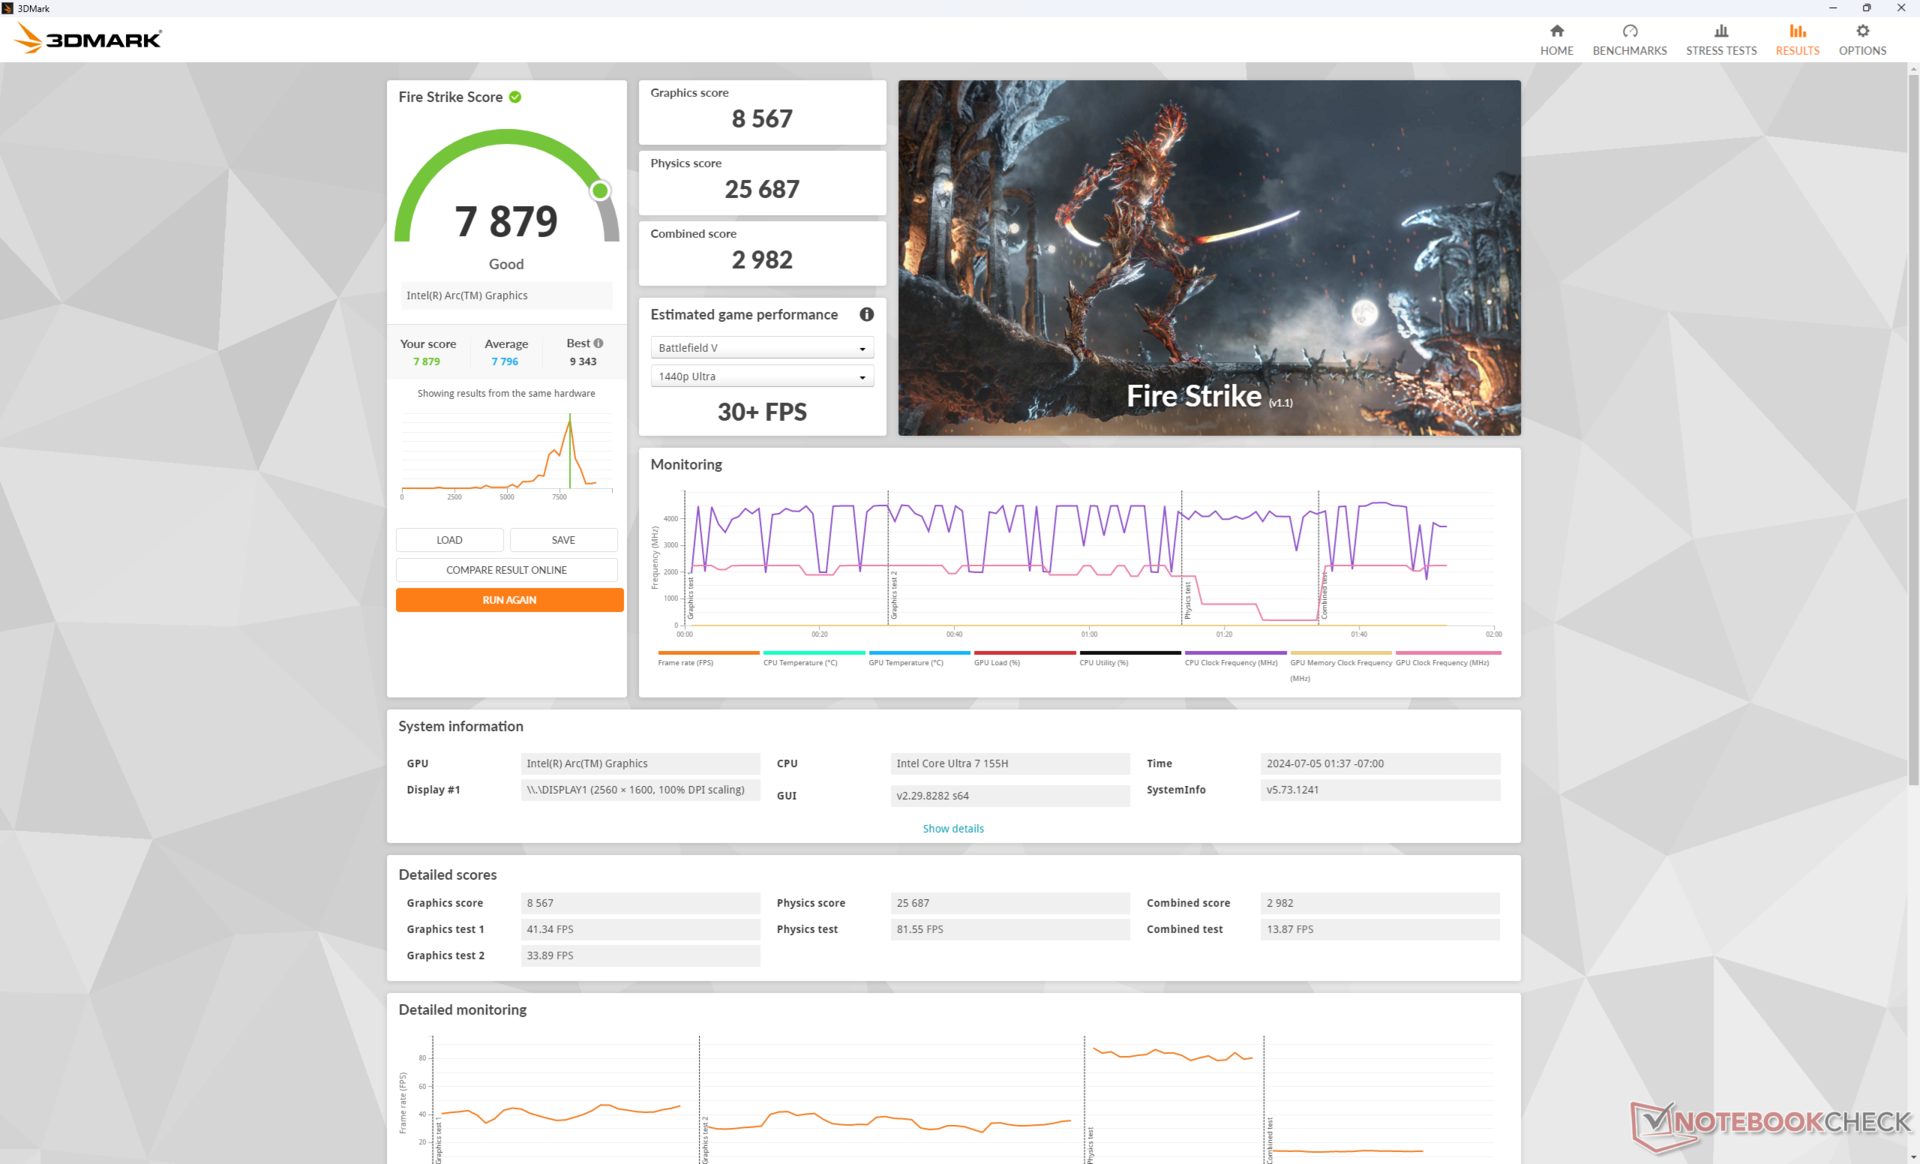
| Profil zasilania | Fire Strike Wynik grafiki | Fire Strike Wynik fizyki | Wynik łączny |
| Tryb wydajności | 8567 | 25687 | 2982 |
| Tryb zrównoważony | 8640 (-0%) | 26567 (-0%) | 2781 (-7%) |
| Zasilanie bateryjne | 7734 (-10%) | 25155 (-2%) | 2886 (-3%) |
Praca w trybie zrównoważonym miałaby co najwyżej minimalny wpływ na wydajność w oparciu o nasze wyniki Fire Strike w powyższej tabeli. Deficyt wydajności podczas pracy na zasilaniu bateryjnym jest niższy niż oczekiwano i wynosi zaledwie 10%, co zapewnia dobrą spójność między różnymi trybami zasilania.
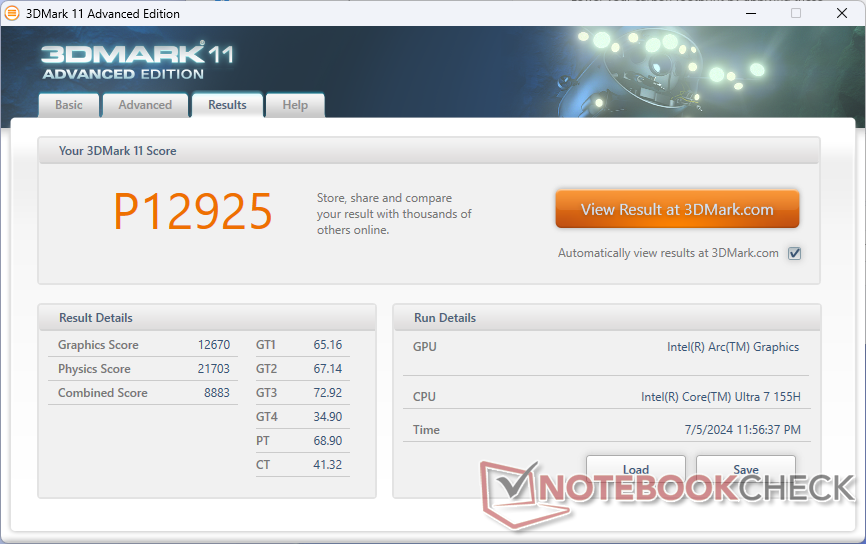
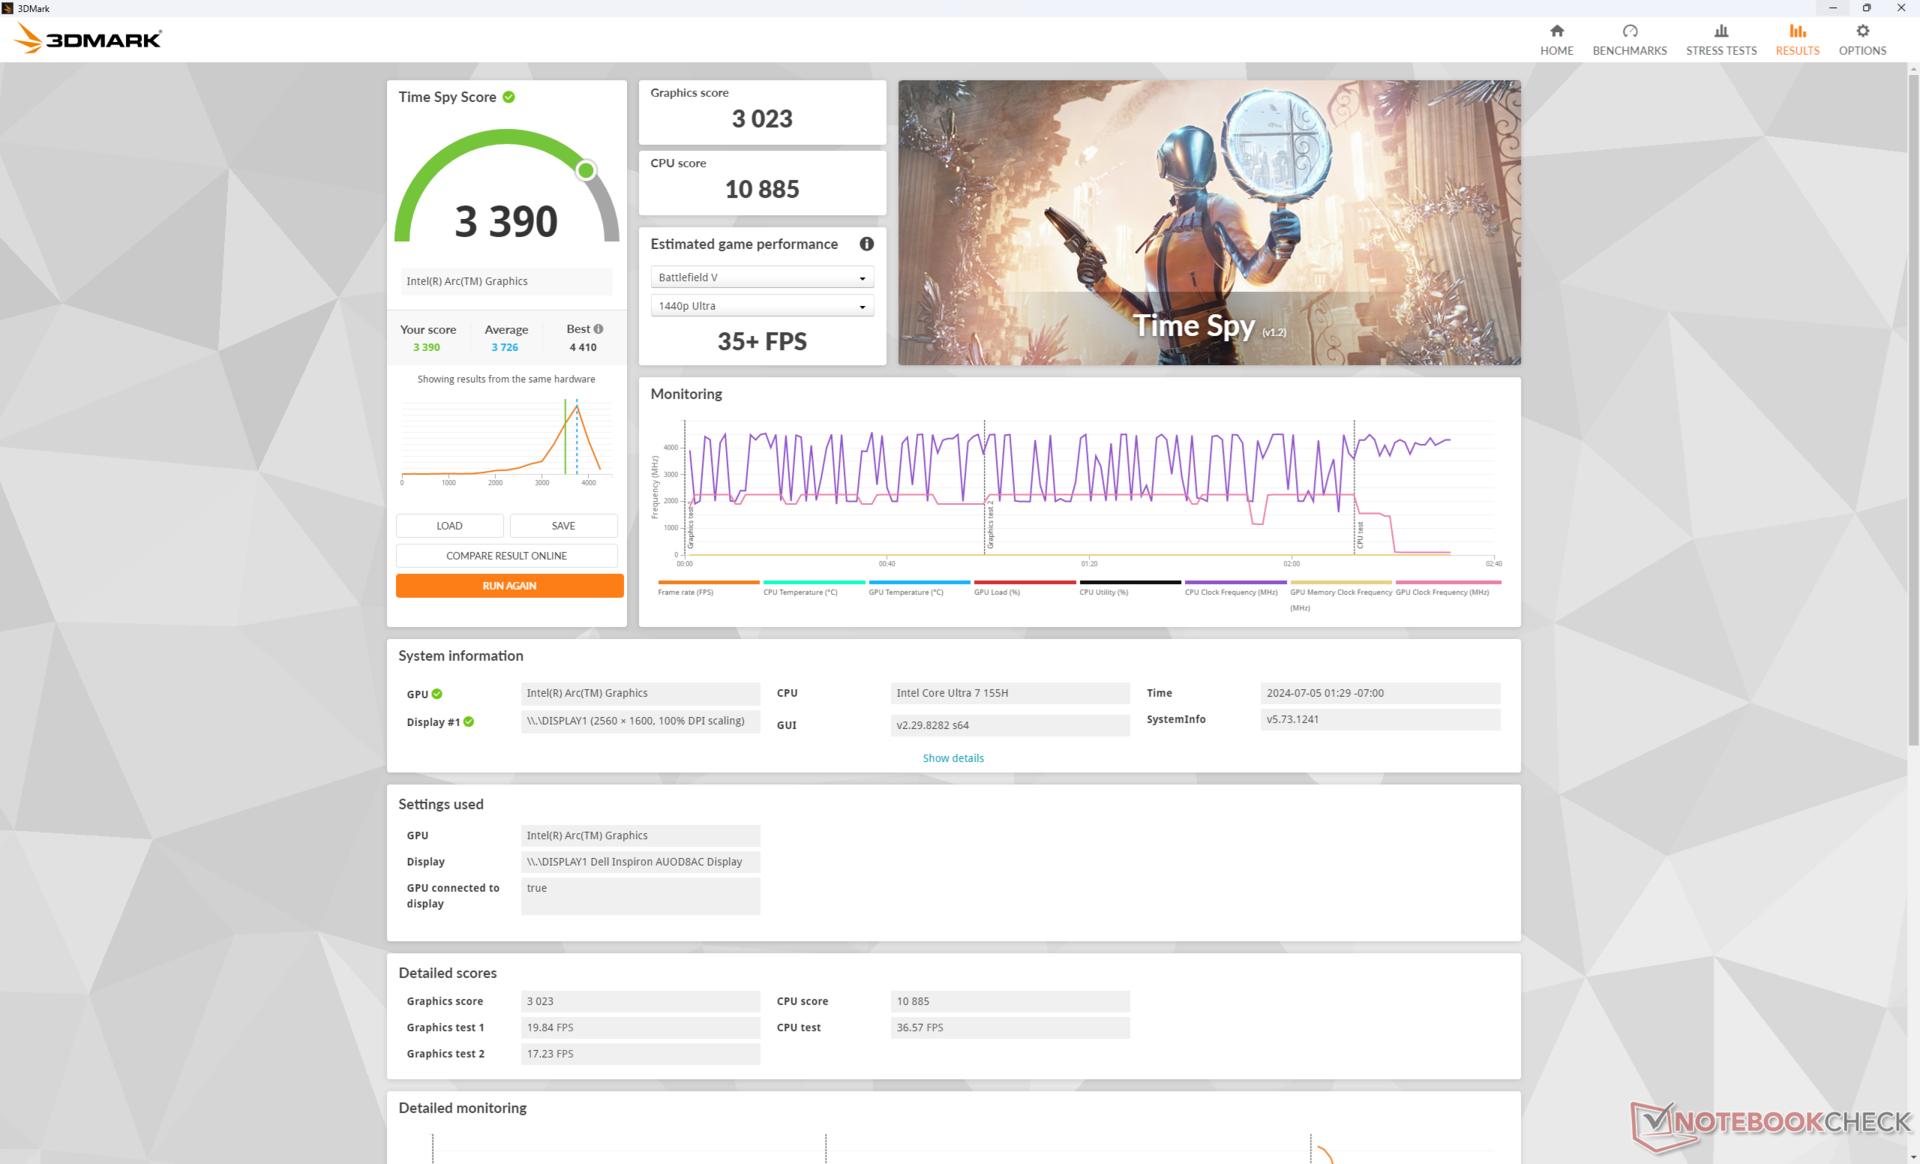
| 3DMark 11 Performance | 12925 pkt. | |
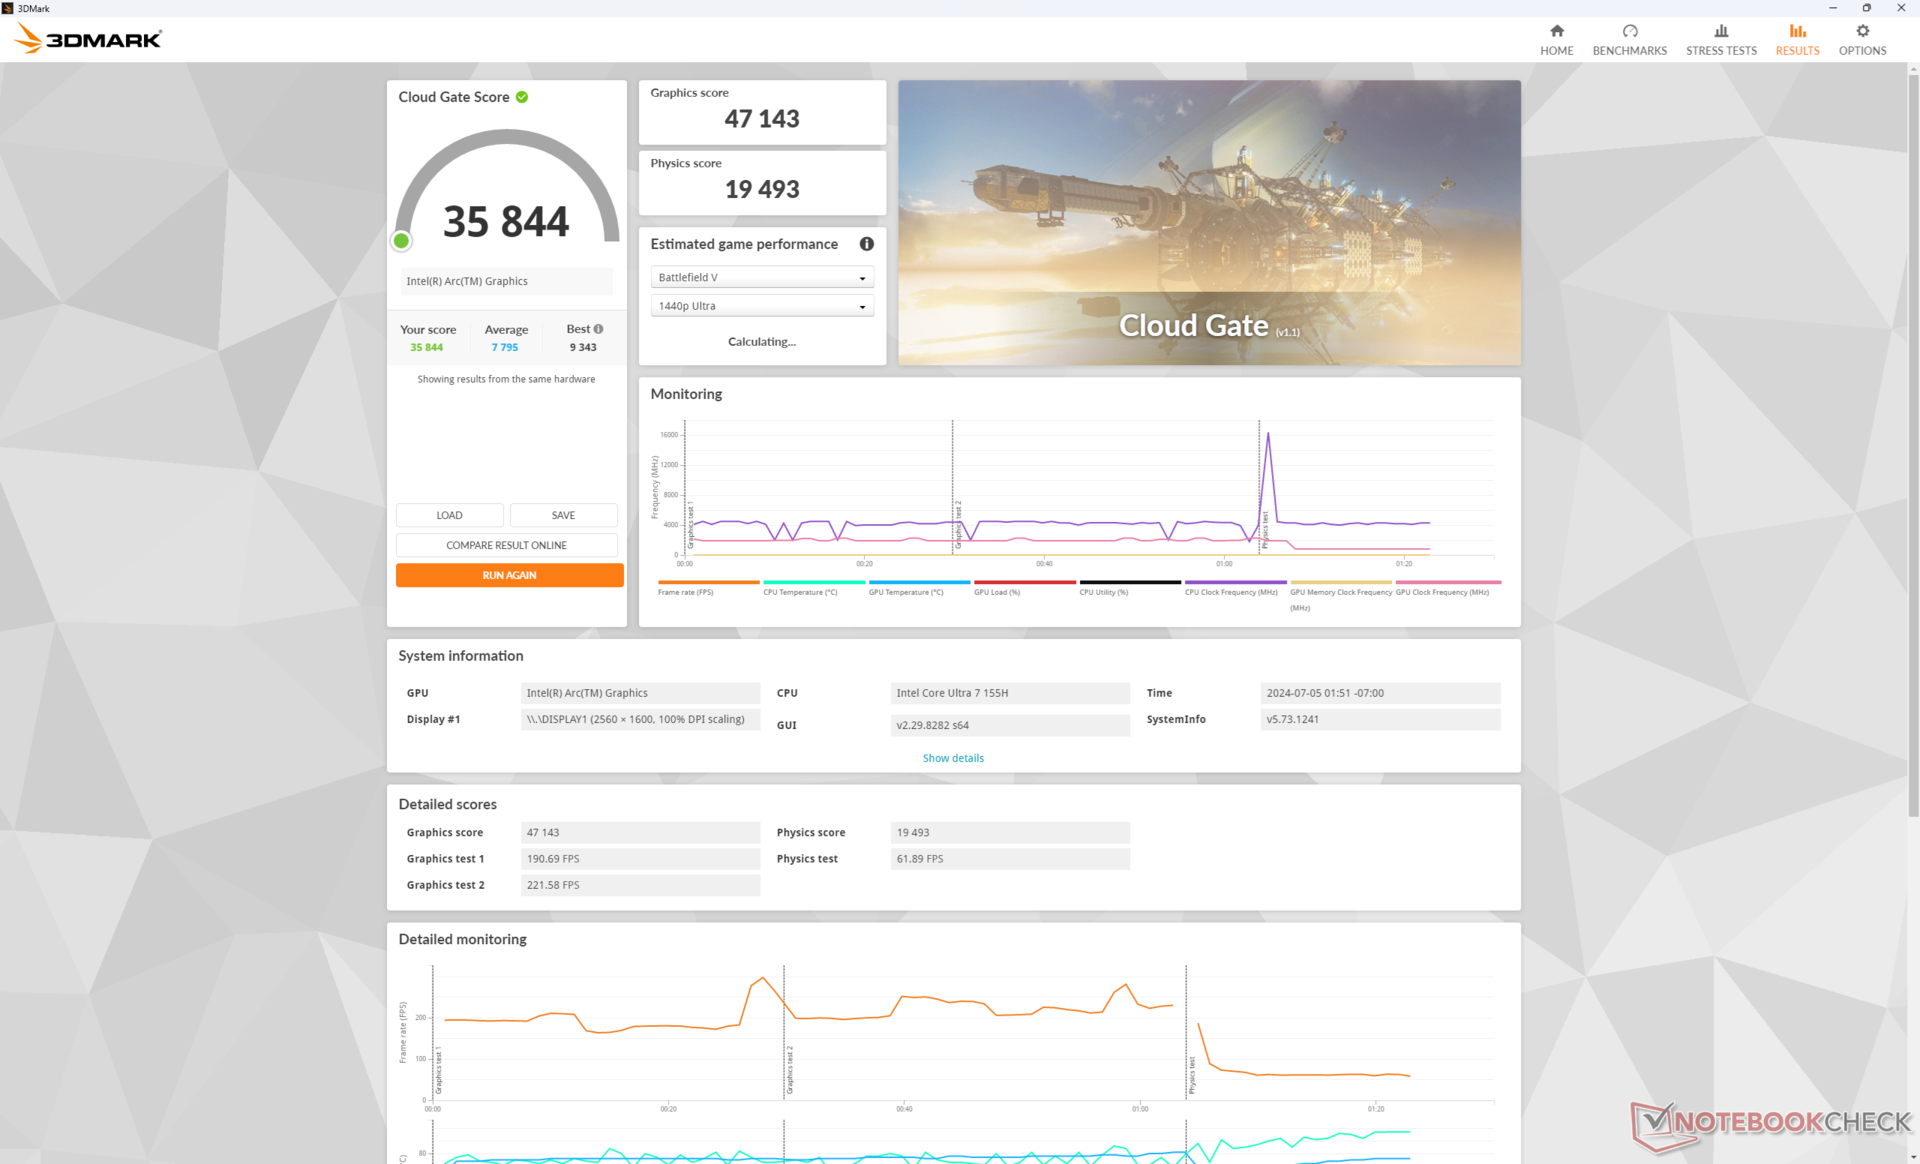
| 3DMark Cloud Gate Standard Score | 35844 pkt. | |
| 3DMark Fire Strike Score | 7879 pkt. | |
| 3DMark Time Spy Score | 3390 pkt. | |
Pomoc | ||
* ... im mniej tym lepiej
| The Witcher 3 - 1920x1080 Ultra Graphics & Postprocessing (HBAO+) | |
| Dell Inspiron 16 Plus 7640 | |
| HP Envy x360 2-in-1 16-ad0097nr | |
| Lenovo IdeaPad Pro 5 16IMH G9 | |
| Dell Inspiron 16 7640 2-in-1 | |
| Samsung Galaxy Book4 Pro 360 | |
| Dell Inspiron 16 7635 2-in-1 | |
| Final Fantasy XV Benchmark - 1920x1080 High Quality | |
| Dell Inspiron 16 Plus 7640 | |
| Lenovo IdeaPad Pro 5 16IMH G9 | |
| Dell Inspiron 16 7640 2-in-1 | |
| HP Envy x360 2-in-1 16-ad0097nr | |
| Samsung Galaxy Book4 Pro 360 | |
| Dell Inspiron 16 7635 2-in-1 | |
| Strange Brigade - 1920x1080 ultra AA:ultra AF:16 | |
| Dell Inspiron 16 Plus 7640 | |
| Lenovo IdeaPad Pro 5 16IMH G9 | |
| Dell Inspiron 16 7640 2-in-1 | |
| HP Envy x360 2-in-1 16-ad0097nr | |
| Samsung Galaxy Book4 Pro 360 | |
| Dell Inspiron 16 7635 2-in-1 | |
| Dota 2 Reborn - 1920x1080 ultra (3/3) best looking | |
| Dell Inspiron 16 Plus 7640 | |
| Lenovo IdeaPad Pro 5 16IMH G9 | |
| Dell Inspiron 16 7640 2-in-1 | |
| HP Envy x360 2-in-1 16-ad0097nr | |
| Samsung Galaxy Book4 Pro 360 | |
| Dell Inspiron 16 7635 2-in-1 | |
| X-Plane 11.11 - 1920x1080 high (fps_test=3) | |
| Dell Inspiron 16 Plus 7640 | |
| Dell Inspiron 16 7640 2-in-1 | |
| Lenovo IdeaPad Pro 5 16IMH G9 | |
| Samsung Galaxy Book4 Pro 360 | |
| HP Envy x360 2-in-1 16-ad0097nr | |
| Dell Inspiron 16 7635 2-in-1 | |
| Far Cry 5 - 1920x1080 Ultra Preset AA:T | |
| Dell Inspiron 16 Plus 7640 | |
| Lenovo IdeaPad Pro 5 16IMH G9 | |
| Dell Inspiron 16 7640 2-in-1 | |
| HP Envy x360 2-in-1 16-ad0097nr | |
Cyberpunk 2077 ultra FPS Chart
| low | med. | high | ultra | |
|---|---|---|---|---|
| The Witcher 3 (2015) | 141.5 | 81.2 | 44.5 | 23.9 |
| Dota 2 Reborn (2015) | 101.5 | 93.3 | 77.8 | 78 |
| Final Fantasy XV Benchmark (2018) | 65 | 36.5 | 26.8 | |
| X-Plane 11.11 (2018) | 50.8 | 40.8 | 40.1 | |
| Far Cry 5 (2018) | 68 | 38 | 36 | 34 |
| Strange Brigade (2018) | 145.6 | 71.8 | 55.4 | 45.4 |
| Tiny Tina's Wonderlands (2022) | 49.2 | 37.3 | 26.4 | 21.2 |
| F1 22 (2022) | 68.8 | 65.6 | ||
| Baldur's Gate 3 (2023) | 30.8 | 27.4 | 23.7 | 22 |
| Cyberpunk 2077 2.2 Phantom Liberty (2023) | 31 | 26.3 | 21.9 |
Emisje
System Noise - Loud And Proud
Bez większych zmian w rozwiązaniu chłodzącym w stosunku do modelu 2023, pomimo naszego bardziej wymagającego procesora, wewnętrzny wentylator będzie musiał pracować tak samo głośno lub głośniej niż wcześniej i właśnie to odnotowaliśmy w naszych testach. Wentylator w Inspiron 16 7640 2-w-1 przyspiesza szybciej od cichego do głośnego, gdy wprowadzane są większe obciążenia. Na przykład, jesteśmy w stanie zarejestrować hałas wentylatora na poziomie 45 dB(A) mniej niż w połowie pierwszej sceny benchmarku 3DMark 06, podczas gdy Inspiron 16 7635 2-w-1 osiągnął poziom 40 dB(A). Uruchamianie gier również skutkowałoby hałasem wentylatora na poziomie 45 dB(A), co czyni naszego Della jednym z głośniejszych 16-calowych kabrioletów na rynku.

Hałas
| luz |
| 22.9 / 22.9 / 25 dB |
| obciążenie |
| 45.1 / 44.9 dB |
 | ||
30 dB cichy 40 dB(A) słyszalny 50 dB(A) irytujący |
||
min: | ||
| Dell Inspiron 16 7640 2-in-1 Arc 8-Core, Ultra 7 155H, Micron 2550 1TB | Dell Inspiron 16 Plus 7640 NVIDIA GeForce RTX 4060 Laptop GPU, Ultra 7 155H, SK hynix BC901 HFS001TEJ4X164N | Dell Inspiron 16 7635 2-in-1 Vega 7, R5 7530U, Kioxia BG5 KBG50ZNS512G | HP Envy x360 2-in-1 16-ad0097nr Radeon 780M, R7 8840HS, KIOXIA BG5 KBG50ZNV1T02 | Lenovo IdeaPad Pro 5 16IMH G9 Arc 8-Core, Ultra 7 155H, Samsung PM9C1a MZAL81T0HDLB | Samsung Galaxy Book4 Pro 360 Arc 7-Core, Ultra 5 125H, Samsung PM9B1 512GB MZVL4512HBLU | |
|---|---|---|---|---|---|---|
| Noise | 2% | 2% | 10% | -4% | 2% | |
| wyłączone / środowisko * | 22.9 | 23.8 -4% | 23.6 -3% | 22.9 -0% | 24.1 -5% | 24.1 -5% |
| Idle Minimum * | 22.9 | 24.2 -6% | 23.6 -3% | 23 -0% | 24.1 -5% | 24.1 -5% |
| Idle Average * | 22.9 | 24.2 -6% | 23.6 -3% | 23 -0% | 24.1 -5% | 24.1 -5% |
| Idle Maximum * | 25 | 24.2 3% | 23.6 6% | 23 8% | 28.2 -13% | 26.4 -6% |
| Load Average * | 45.1 | 28.9 36% | 40.3 11% | 23.8 47% | 44.4 2% | 35.2 22% |
| Cyberpunk 2077 ultra * | 44.9 | |||||
| Load Maximum * | 44.9 | 51 -14% | 44.2 2% | 43.8 2% | 44.4 1% | 39.2 13% |
| Witcher 3 ultra * | 51 | 44.2 | 43.8 | 36.5 | 38.5 |
* ... im mniej tym lepiej
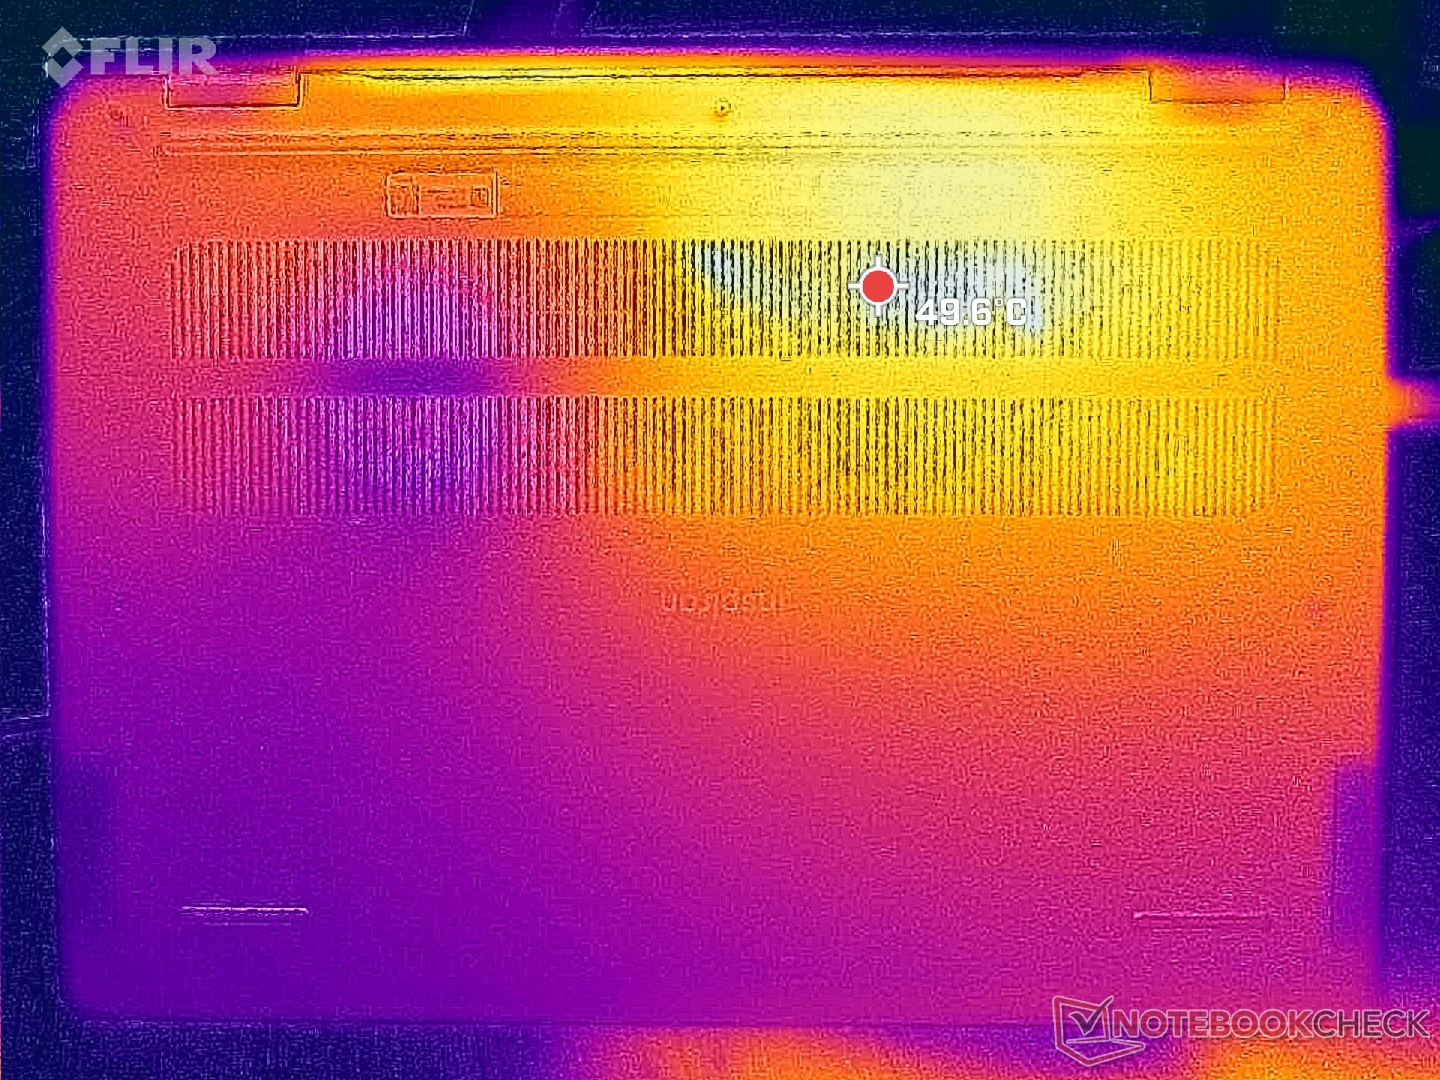
Temperatura
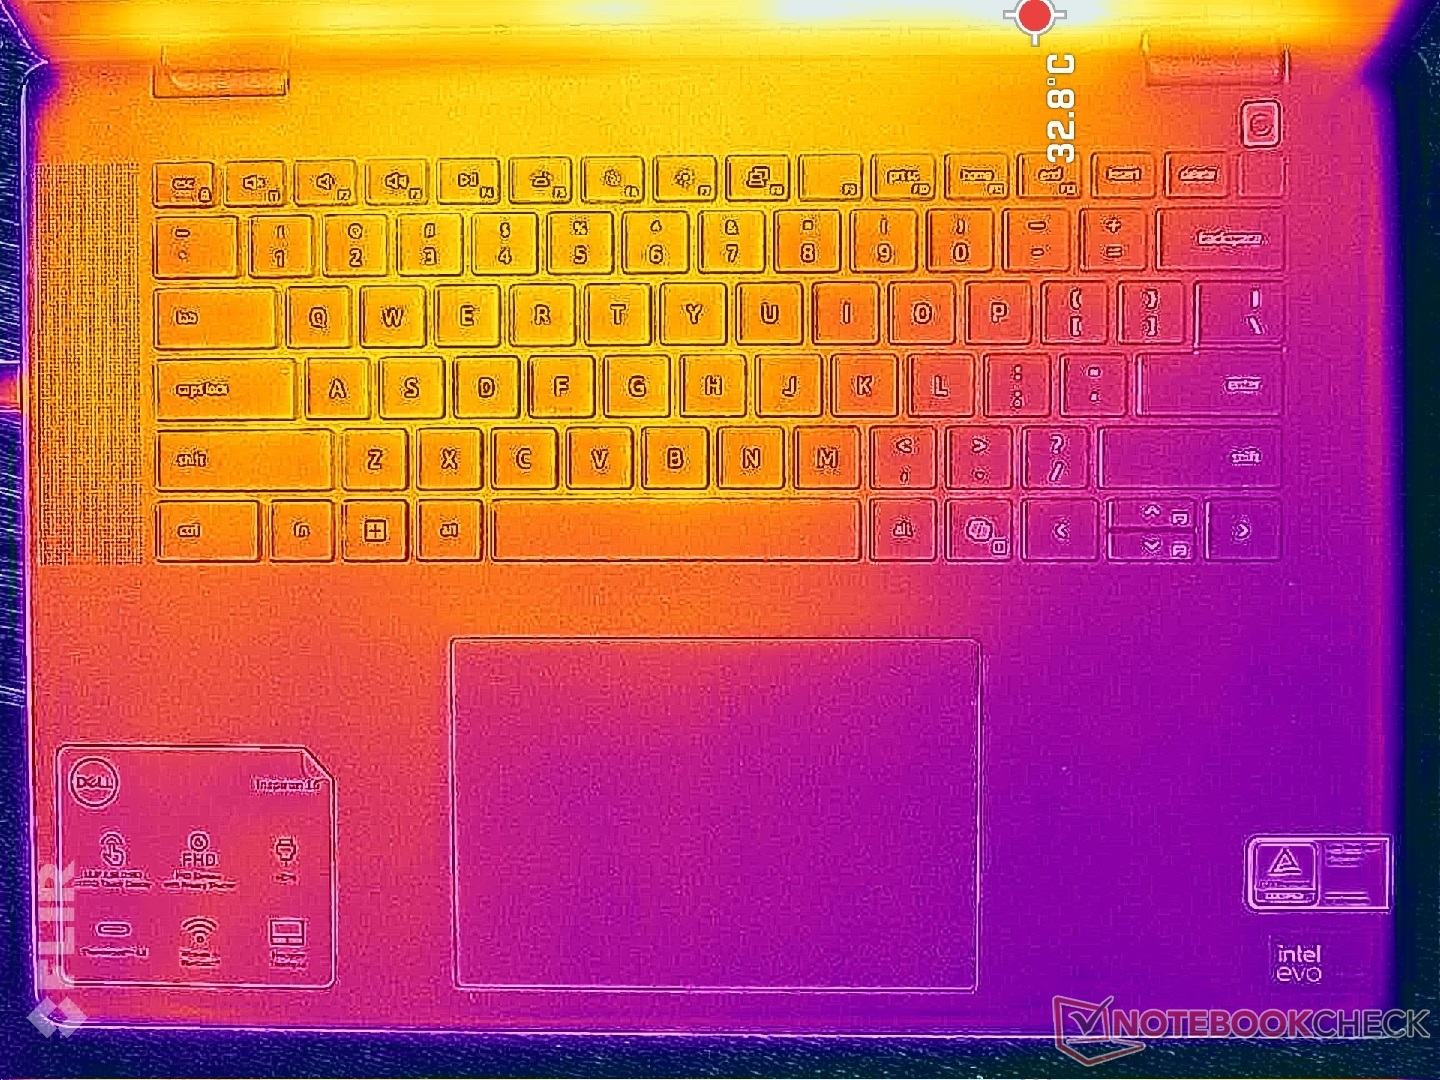
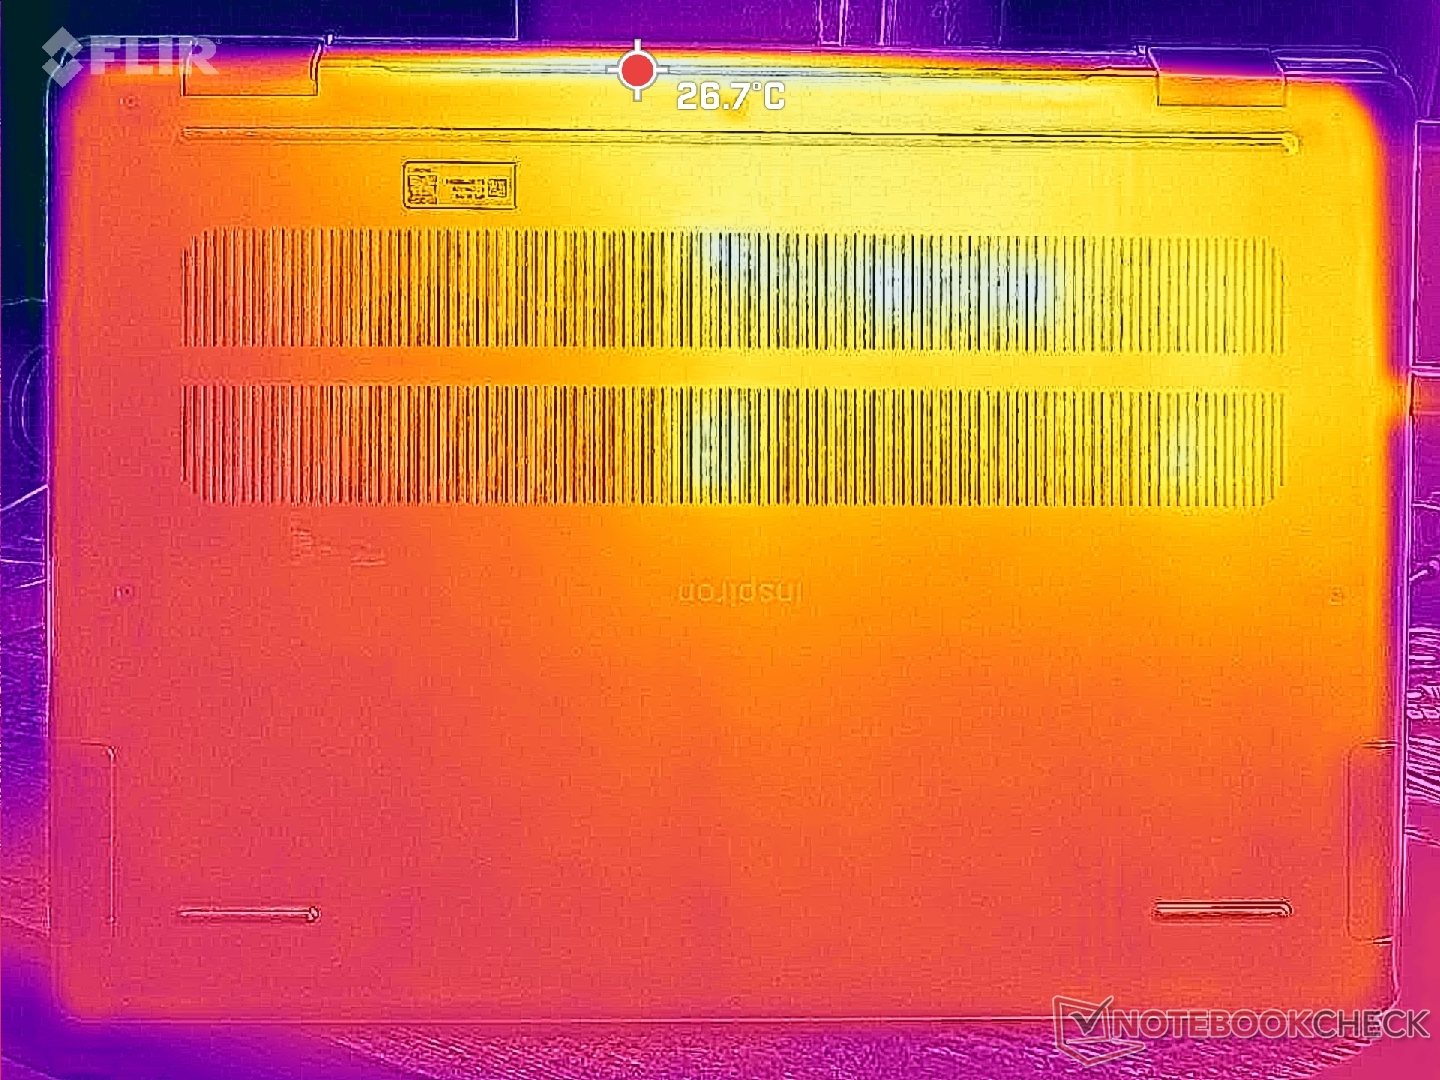
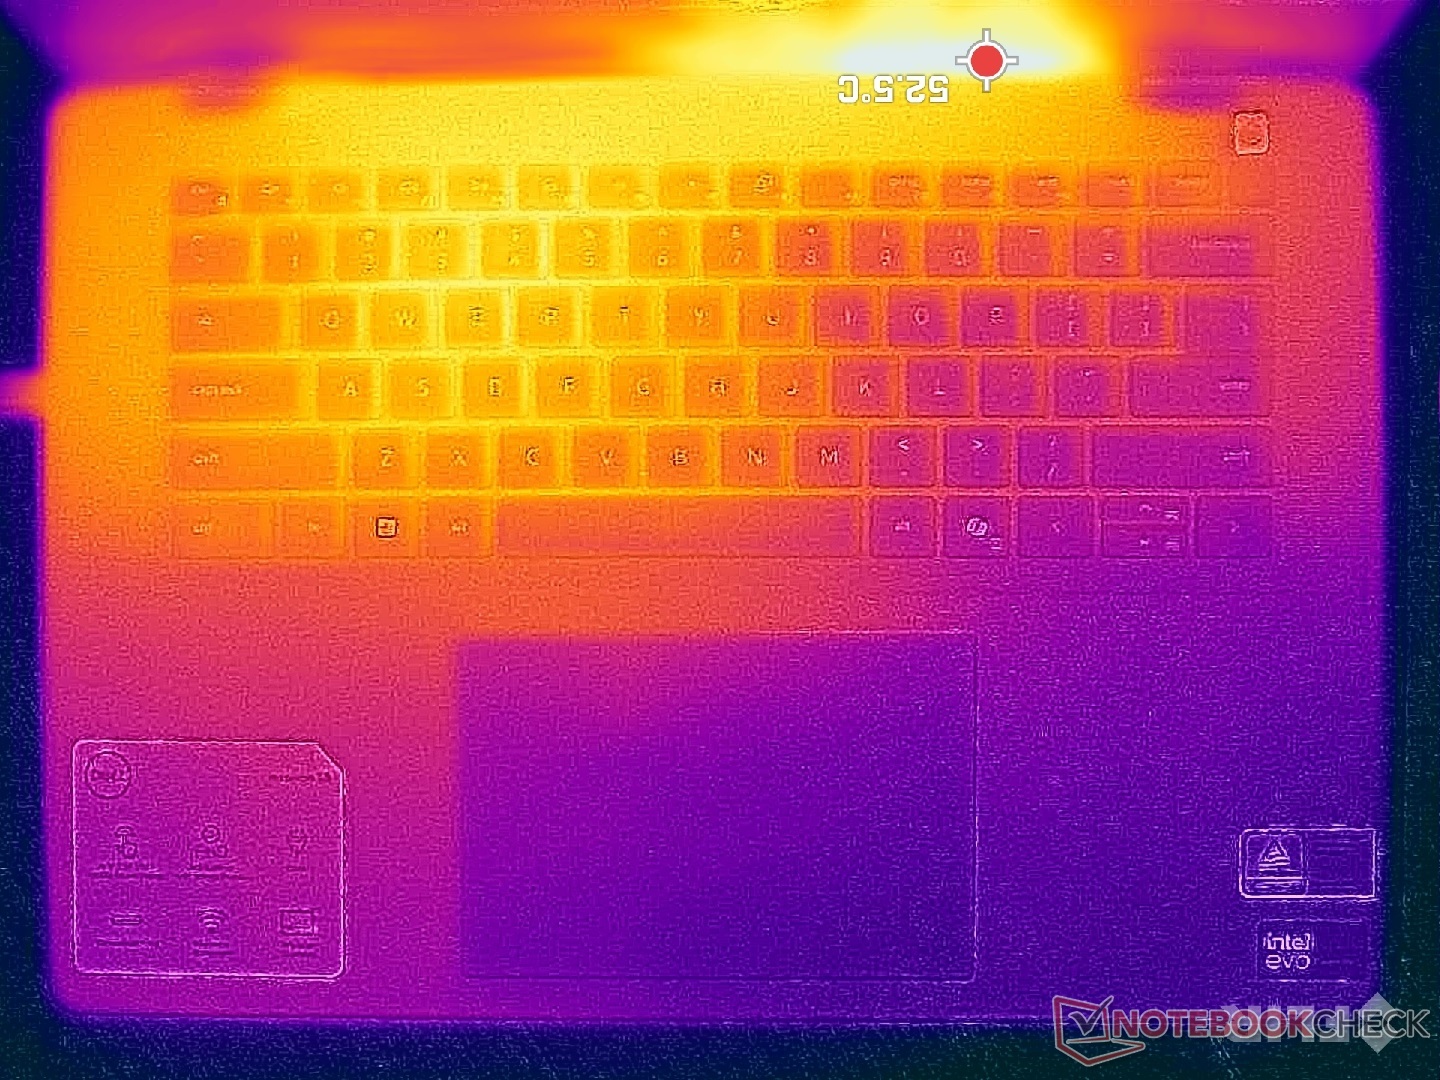
Temperatury powierzchniowe są ponownie wyższe na lewej połowie obudowy niż na prawej ze względu na asymetryczne rozwiązanie chłodzenia. Tym razem jednak średnie temperatury mogą być znacznie wyższe niż wcześniej ze względu na mocniejszy procesor Core z serii H. Przykładowo, gorące punkty w naszym egzemplarzu mogą osiągnąć 47 C zarówno na pokrywie C, jak i D, w porównaniu do zaledwie 39 C do 42 C w zeszłorocznym modelu. Miejsca te znajdują się na szczęście z tyłu urządzenia, gdzie palce są mniej narażone na dotyk.
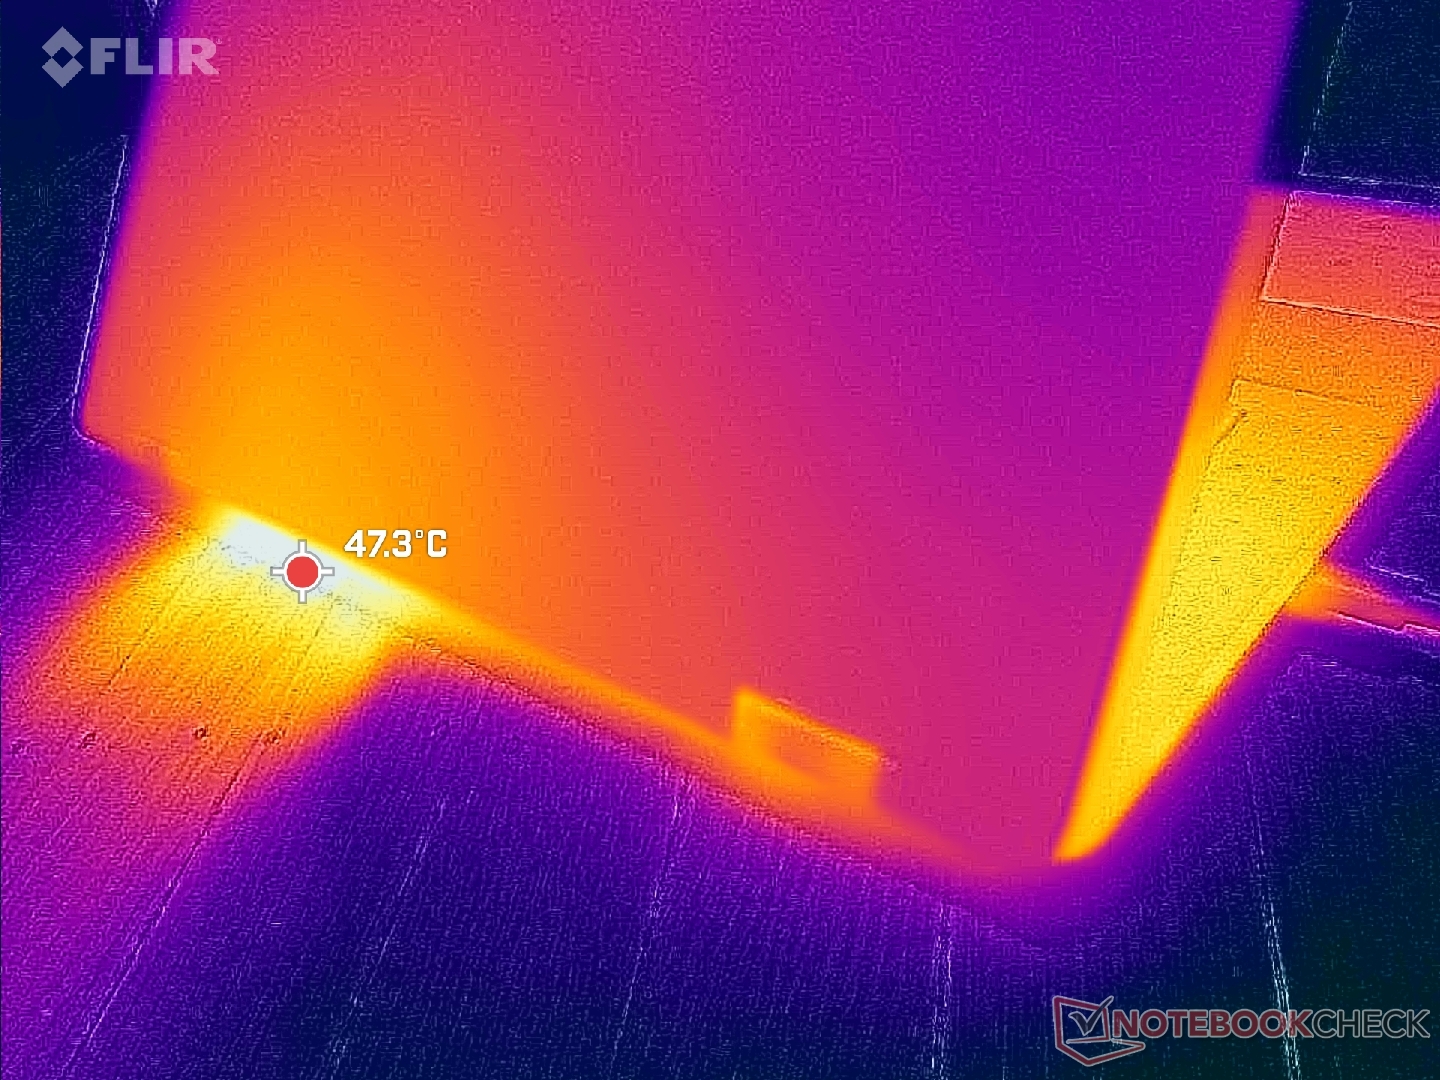
(-) Maksymalna temperatura w górnej części wynosi 46.8 °C / 116 F, w porównaniu do średniej 35.3 °C / 96 F , począwszy od 19.6 do 60 °C dla klasy Convertible.
(-) Dno nagrzewa się maksymalnie do 45.6 °C / 114 F, w porównaniu do średniej 36.8 °C / 98 F
(+) W stanie bezczynności średnia temperatura górnej części wynosi 29.9 °C / 86 F, w porównaniu ze średnią temperaturą urządzenia wynoszącą 30.3 °C / ### class_avg_f### F.
(+) Podparcia dłoni i touchpad osiągają maksymalną temperaturę skóry (33.8 °C / 92.8 F) i dlatego nie są gorące.
(-) Średnia temperatura obszaru podparcia dłoni w podobnych urządzeniach wynosiła 28 °C / 82.4 F (-5.8 °C / -10.4 F).
| Dell Inspiron 16 7640 2-in-1 Intel Core Ultra 7 155H, Intel Arc 8-Core iGPU | Dell Inspiron 16 Plus 7640 Intel Core Ultra 7 155H, NVIDIA GeForce RTX 4060 Laptop GPU | Dell Inspiron 16 7635 2-in-1 AMD Ryzen 5 7530U, AMD Radeon RX Vega 7 | HP Envy x360 2-in-1 16-ad0097nr AMD Ryzen 7 8840HS, AMD Radeon 780M | Lenovo IdeaPad Pro 5 16IMH G9 Intel Core Ultra 7 155H, Intel Arc 8-Core iGPU | Samsung Galaxy Book4 Pro 360 Intel Core Ultra 5 125H, Intel Arc 7-Core iGPU | |
|---|---|---|---|---|---|---|
| Heat | 3% | 11% | 8% | 19% | 18% | |
| Maximum Upper Side * | 46.8 | 43.4 7% | 41.6 11% | 42.6 9% | 36.3 22% | 38.6 18% |
| Maximum Bottom * | 45.6 | 41.6 9% | 39 14% | 47.8 -5% | 39.1 14% | 39.2 14% |
| Idle Upper Side * | 32.2 | 32.8 -2% | 29.4 9% | 27.4 15% | 24.9 23% | 25.2 22% |
| Idle Bottom * | 31.4 | 32.4 -3% | 28.6 9% | 27.8 11% | 26.1 17% | 25.7 18% |
* ... im mniej tym lepiej
Głośniki
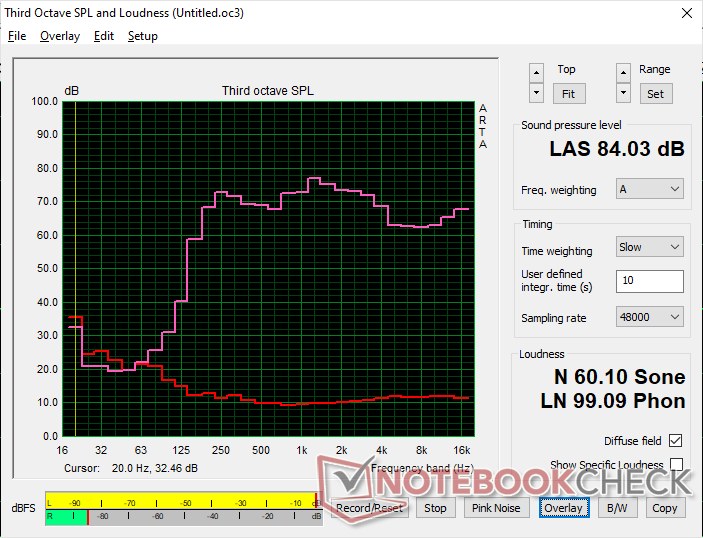
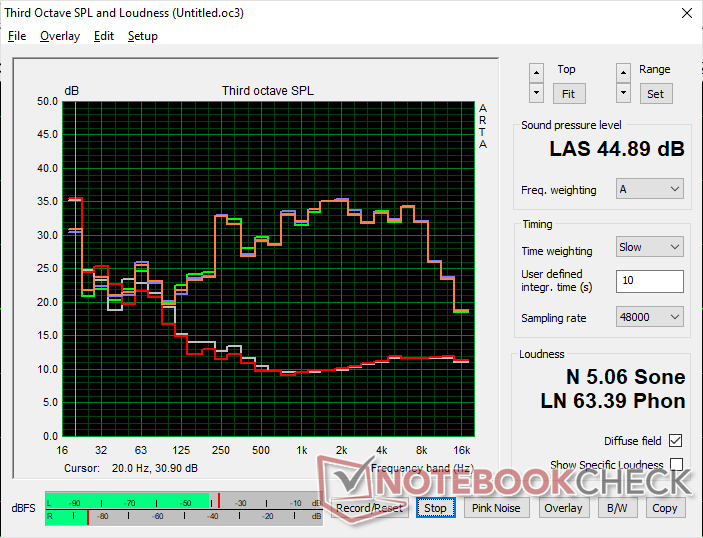
Dell Inspiron 16 7640 2-in-1 analiza dźwięku
(+) | głośniki mogą odtwarzać stosunkowo głośno (84 dB)
Bas 100 - 315 Hz
(±) | zredukowany bas - średnio 13.9% niższy od mediany
(±) | liniowość basu jest średnia (14% delta do poprzedniej częstotliwości)
Średnie 400 - 2000 Hz
(+) | zbalansowane środki średnie - tylko 3.6% od mediany
(+) | średnie są liniowe (3.6% delta do poprzedniej częstotliwości)
Wysokie 2–16 kHz
(+) | zrównoważone maksima - tylko 4.5% od mediany
(+) | wzloty są liniowe (2.8% delta do poprzedniej częstotliwości)
Ogólnie 100 - 16.000 Hz
(+) | ogólny dźwięk jest liniowy (12% różnicy w stosunku do mediany)
W porównaniu do tej samej klasy
» 11% wszystkich testowanych urządzeń w tej klasie było lepszych, 4% podobnych, 85% gorszych
» Najlepszy miał deltę 6%, średnia wynosiła ###średnia###%, najgorsza wynosiła 57%
W porównaniu do wszystkich testowanych urządzeń
» 8% wszystkich testowanych urządzeń było lepszych, 2% podobnych, 90% gorszych
» Najlepszy miał deltę 4%, średnia wynosiła ###średnia###%, najgorsza wynosiła 134%
Apple MacBook Pro 16 2021 M1 Pro analiza dźwięku
(+) | głośniki mogą odtwarzać stosunkowo głośno (84.7 dB)
Bas 100 - 315 Hz
(+) | dobry bas - tylko 3.8% od mediany
(+) | bas jest liniowy (5.2% delta do poprzedniej częstotliwości)
Średnie 400 - 2000 Hz
(+) | zbalansowane środki średnie - tylko 1.3% od mediany
(+) | średnie są liniowe (2.1% delta do poprzedniej częstotliwości)
Wysokie 2–16 kHz
(+) | zrównoważone maksima - tylko 1.9% od mediany
(+) | wzloty są liniowe (2.7% delta do poprzedniej częstotliwości)
Ogólnie 100 - 16.000 Hz
(+) | ogólny dźwięk jest liniowy (4.6% różnicy w stosunku do mediany)
W porównaniu do tej samej klasy
» 0% wszystkich testowanych urządzeń w tej klasie było lepszych, 0% podobnych, 100% gorszych
» Najlepszy miał deltę 5%, średnia wynosiła ###średnia###%, najgorsza wynosiła 45%
W porównaniu do wszystkich testowanych urządzeń
» 0% wszystkich testowanych urządzeń było lepszych, 0% podobnych, 100% gorszych
» Najlepszy miał deltę 4%, średnia wynosiła ###średnia###%, najgorsza wynosiła 134%
Zarządzanie energią - Core-H i Mini-LED mogą być wymagające
Zużycie energii
Praca na biegu jałowym na pulpicie wymaga od 6 W do 14 W w zależności od ustawienia jasności, co jest o kilka watów wyższe niż to, co zarejestrowaliśmy na Inspiron 16 7635 2-w-1. Oczywiście bardziej wymagający procesor z serii H i panel mini-LED o wyższej rozdzielczości są odpowiedzialne za ogólnie wyższe zużycie energii.
Zużycie energii jest ponownie wyższe niż w Inspiron 16 7635 2-w-1 o ponad 40 procent podczas uruchamiania bardziej wymagających aplikacji, takich jak gry. Przy ponad 2-krotnym wzroście wydajności GPU w porównaniu do RX Vega 7, wzrost zużycia powinien być jednak opłacalny dla większości użytkowników. Podobny wniosek można wyciągnąć w przypadku zadań intensywnie wykorzystujących procesor CPU, a także podczas uruchamiania Prime95. Jeśli czas pracy na baterii jest bardziej pożądany niż wydajność, to wybór tańszej i wolniejszej konfiguracji Core Ultra 5 125U pozwoli zaoszczędzić sporo energii w tym zakresie.
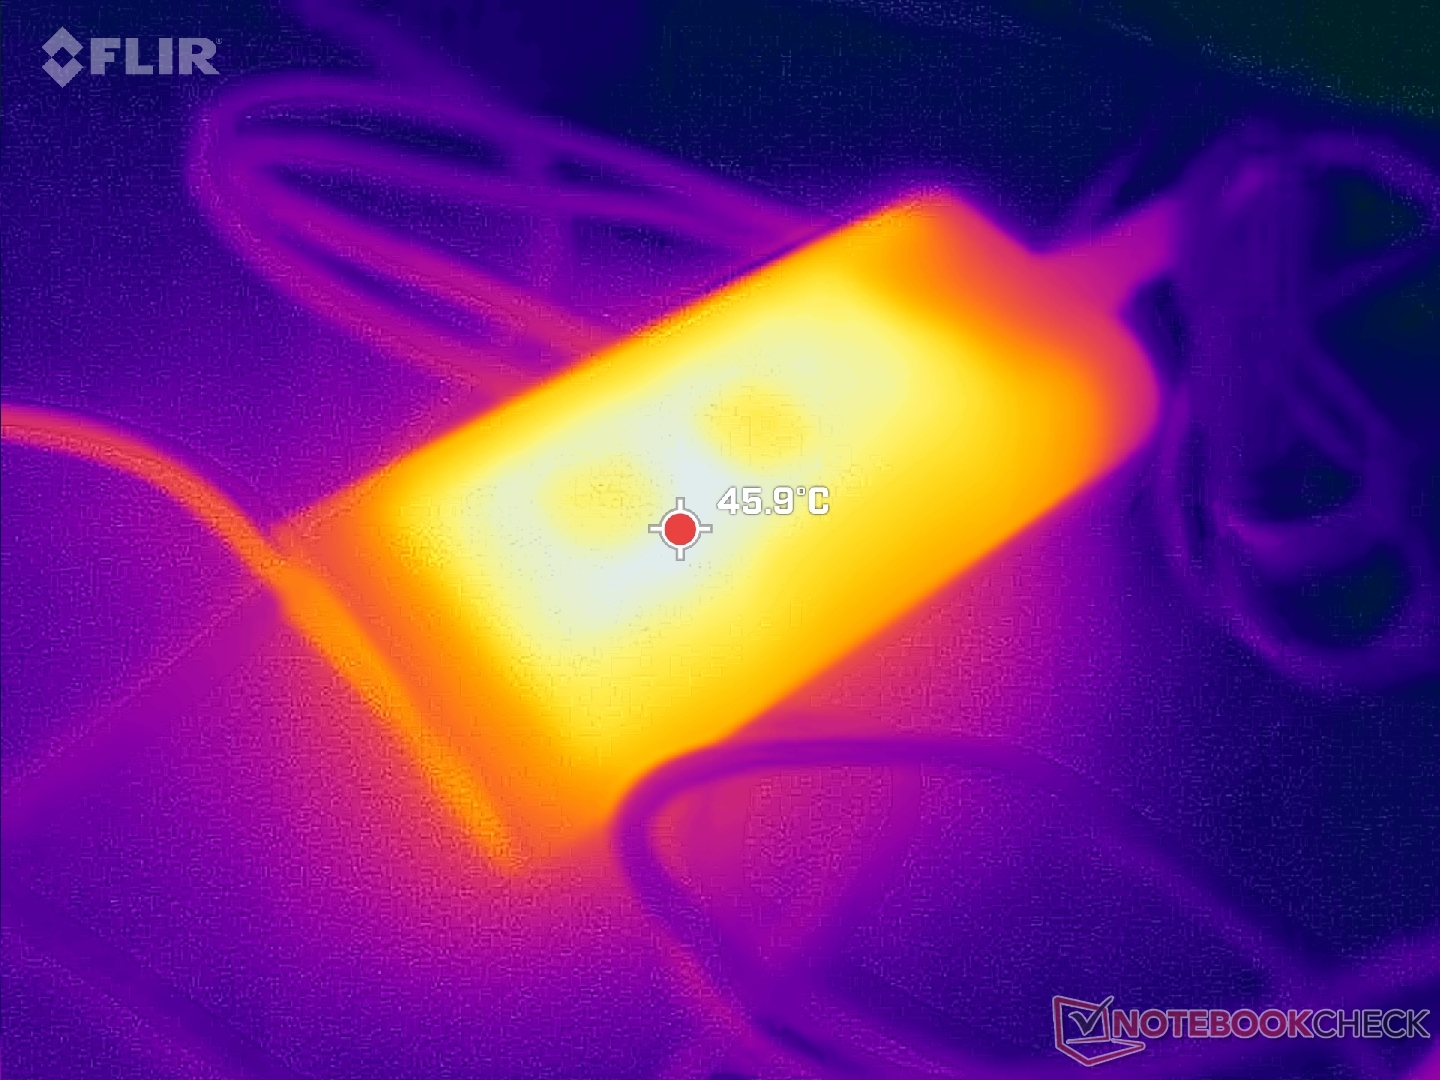
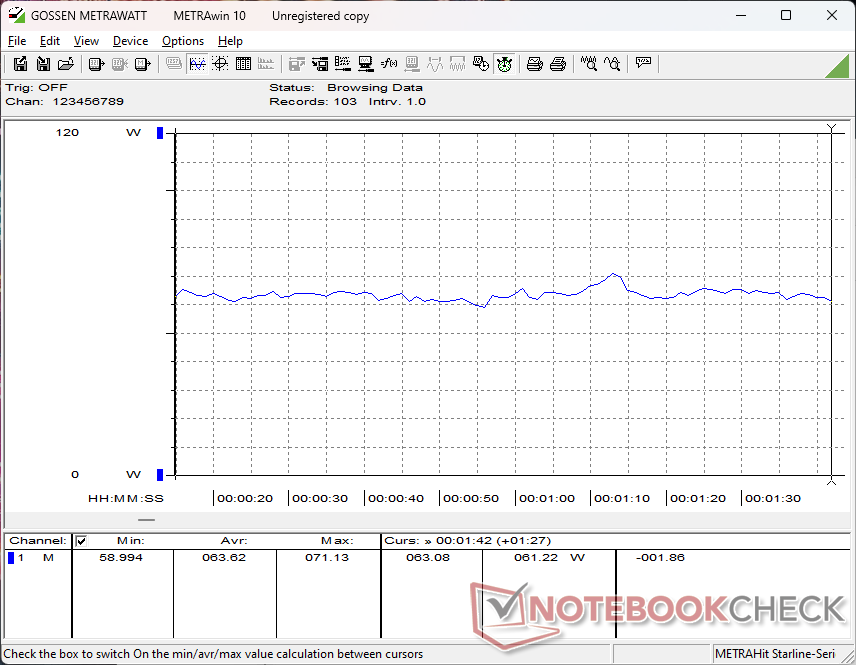
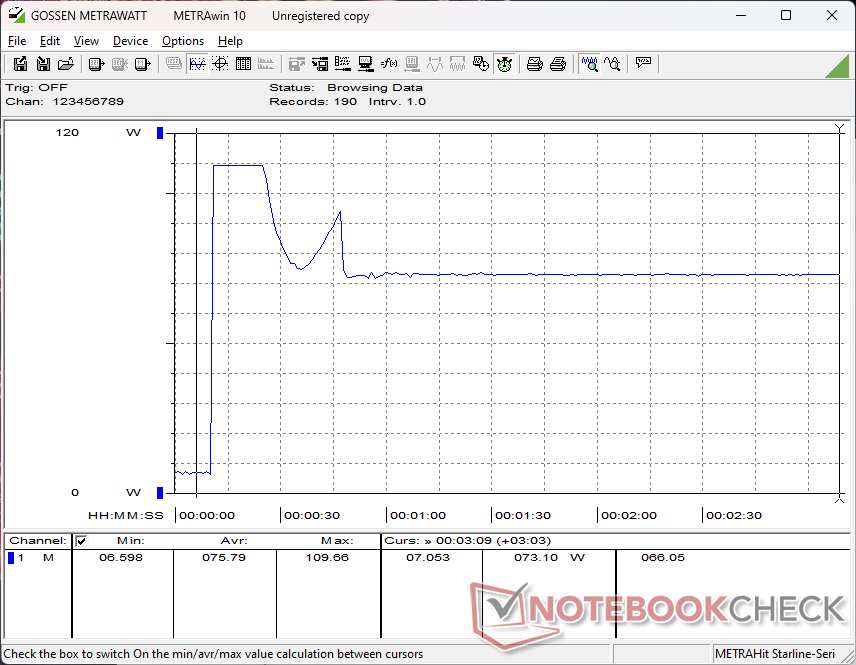
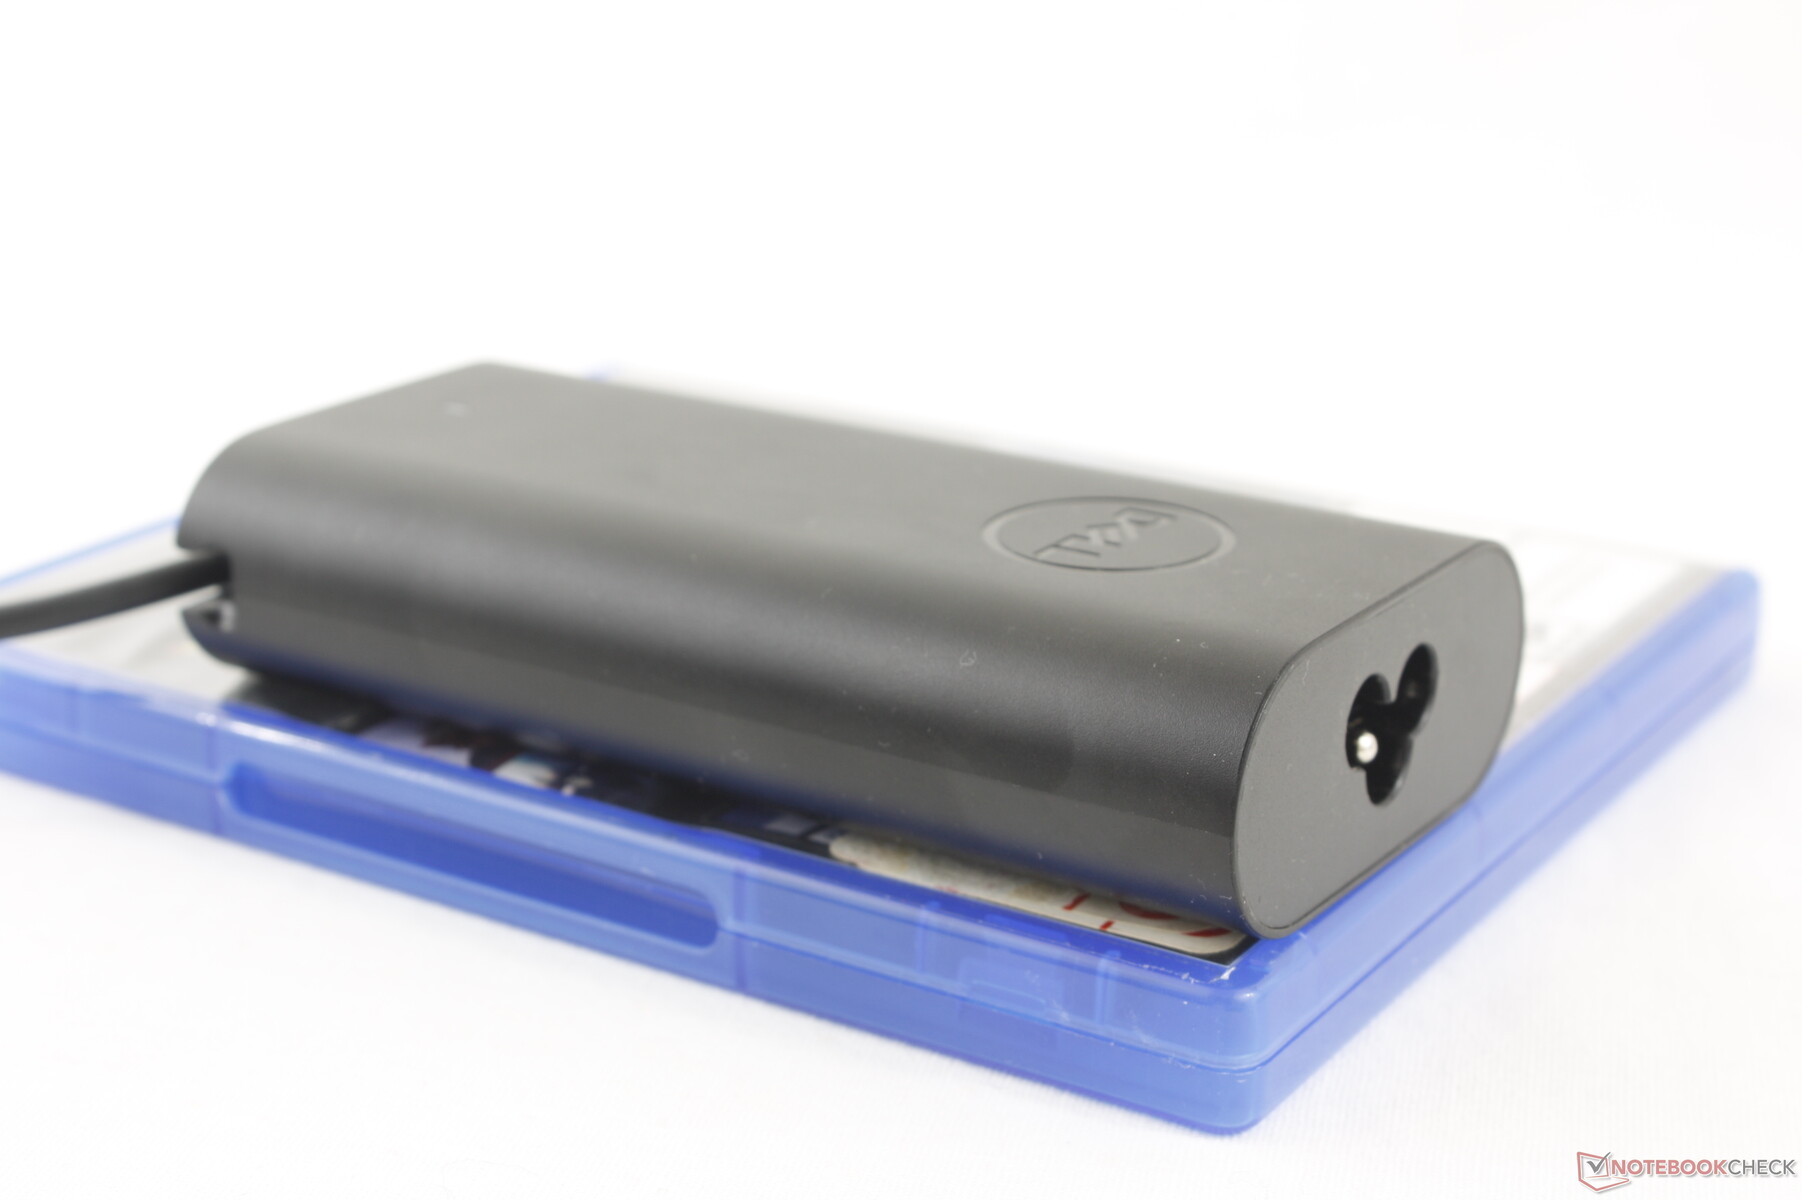
Udało nam się zarejestrować maksymalny pobór mocy na poziomie 110 W, mimo że mały-średni (~12,2 x 5,9 x 2,7 cm) zasilacz sieciowy USB-C ma moc znamionową tylko 100 W. Ten maksymalny pobór jest tylko tymczasowy, jak pokazuje nasz wykres poniżej, ze względu na ograniczenia termiczne. Niemniej jednak jest on znacznie wyższy niż ten, który odnotowaliśmy na Inspironie 16 7635 2-w-1 ze względu na wyższy potencjał Turbo Boost procesora Core z serii H.

| wyłączony / stan wstrzymania | |
| luz | |
| obciążenie |
|
Legenda:
min: | |
| Dell Inspiron 16 7640 2-in-1 Ultra 7 155H, Arc 8-Core, Micron 2550 1TB, Mini-LED, 2560x1600, 16" | Dell Inspiron 16 Plus 7640 Ultra 7 155H, NVIDIA GeForce RTX 4060 Laptop GPU, SK hynix BC901 HFS001TEJ4X164N, IPS, 2560x1600, 16" | Dell Inspiron 16 7635 2-in-1 R5 7530U, Vega 7, Kioxia BG5 KBG50ZNS512G, IPS, 1920x1200, 16" | HP Envy x360 2-in-1 16-ad0097nr R7 8840HS, Radeon 780M, KIOXIA BG5 KBG50ZNV1T02, OLED, 2880x1800, 16" | Lenovo IdeaPad Pro 5 16IMH G9 Ultra 7 155H, Arc 8-Core, Samsung PM9C1a MZAL81T0HDLB, IPS, 2560x1600, 16" | Samsung Galaxy Book4 Pro 360 Ultra 5 125H, Arc 7-Core, Samsung PM9B1 512GB MZVL4512HBLU, OLED, 2880x1800, 16" | |
|---|---|---|---|---|---|---|
| Power Consumption | 7% | 35% | 26% | 22% | 44% | |
| Idle Minimum * | 6.1 | 4.2 31% | 4.8 21% | 5 18% | 3.5 43% | 3 51% |
| Idle Average * | 13.5 | 6.9 49% | 7.6 44% | 6.2 54% | 9.6 29% | 6.3 53% |
| Idle Maximum * | 13.8 | 15.2 -10% | 8.7 37% | 14.7 -7% | 9.9 28% | 6.5 53% |
| Load Average * | 63.6 | 70.4 -11% | 47.1 26% | 49.9 22% | 62.7 1% | 49.3 22% |
| Cyberpunk 2077 ultra external monitor * | 64.6 | |||||
| Cyberpunk 2077 ultra * | 67 | |||||
| Load Maximum * | 109.7 | 137.4 -25% | 56.4 49% | 65 41% | 101.2 8% | 65.5 40% |
| Witcher 3 ultra * | 115.9 | 46.6 | 54.5 | 55.8 | 45.9 |
* ... im mniej tym lepiej
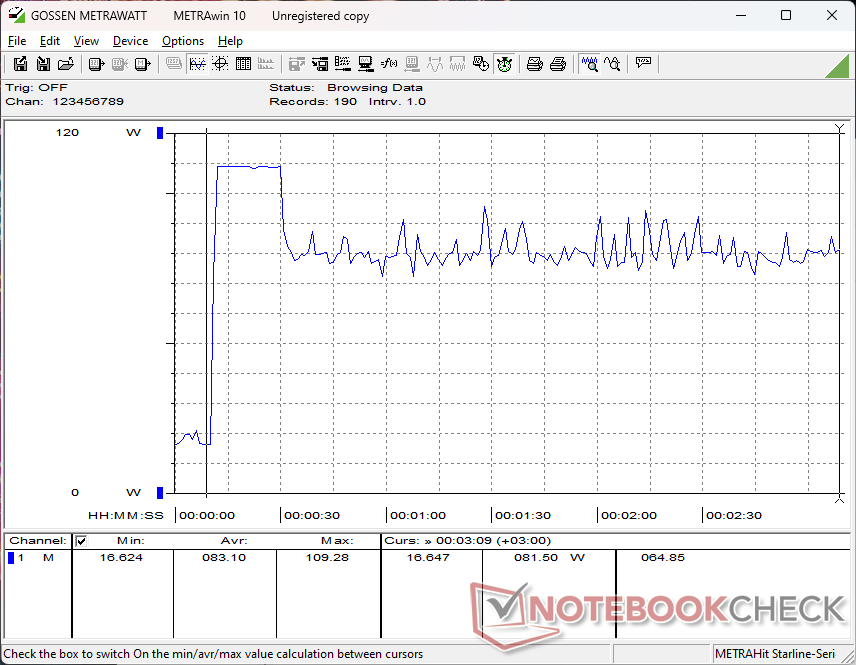
Power Consumption Cyberpunk / Stress Test
Power Consumption external Monitor
Żywotność baterii
Akumulator o pojemności 90 Wh jest większy niż akumulator 64 Wh w zeszłorocznym Inspironie 16 7635 2-w-1. Mimo to, czas pracy jest krótszy o prawie trzy godziny podczas naszego testu przeglądania ze względu na bardziej wymagający wyświetlacz i procesor, jak wspomniano powyżej. Różnice w czasie pracy utrzymują się nawet wtedy, gdy ekrany są ustawione na identyczny poziom jasności 150 nitów.
Ładowanie dużej baterii od pustej do pełnej pojemności jest stosunkowo powolne i trwa około 2,5 godziny w porównaniu do 1,5 godziny w przypadku większości innych Ultrabooków.
| Dell Inspiron 16 7640 2-in-1 Ultra 7 155H, Arc 8-Core, 90 Wh | Dell Inspiron 16 Plus 7640 Ultra 7 155H, NVIDIA GeForce RTX 4060 Laptop GPU, 90 Wh | Dell Inspiron 16 7635 2-in-1 R5 7530U, Vega 7, 64 Wh | HP Envy x360 2-in-1 16-ad0097nr R7 8840HS, Radeon 780M, 68 Wh | Lenovo IdeaPad Pro 5 16IMH G9 Ultra 7 155H, Arc 8-Core, 84 Wh | Samsung Galaxy Book4 Pro 360 Ultra 5 125H, Arc 7-Core, 76 Wh | |
|---|---|---|---|---|---|---|
| Czasy pracy | 16% | 23% | -12% | -9% | 0% | |
| Reader / Idle | 1310 | 1560 19% | 935 -29% | |||
| WiFi v1.3 | 686 | 799 16% | 869 27% | 459 -33% | 756 10% | 531 -23% |
| Load | 93 | 114 23% | 116 25% | 68 -27% | 114 23% | |
| H.264 | 957 | 881 |
Za
Przeciw
Werdykt - duży rozmiar i wydajność
Inspiron 16 7640 2-w-1 ma kilka mocnych stron. Po pierwsze, jego wydajność z Core Ultra 7 155H jest na najwyższym poziomie, zwłaszcza w porównaniu do innych 16-calowych konwertowalnych laptopów ze zintegrowaną grafiką. Jest to procesor klasy gamingowej bez większych problemów z dławieniem i powinien poradzić sobie z każdą treścią lub wielozadaniowymi aplikacjami, które można rzucić na maszynę. Po drugie, panel mini-LED wzmacnia ten model jako wysokiej klasy odtwarzacz multimedialny z poręczną obudową 2 w 1 i aktywnym piórem.
Inspiron 16 7640 2 w 1 jest duży i wydajny. Chociaż jego wydajność i wyświetlacz są imponujące w stosunku do ceny, użytkownicy płacą za to nieporęczną obudową i krótszym czasem pracy na baterii.
Wyższa wydajność i jaśniejsze wyświetlacze wiążą się z przewidywalnym kosztem wyższego zużycia energii. Bardziej wymagające komponenty prowadzą do większej ilości generowanego ciepła, co skutkuje głośniejszym hałasem wentylatora i krótszym czasem pracy niż w przypadku zeszłorocznego modelu. Różnice również nie są niewielkie, co pokazały nasze testy i pomiary powyżej.
Dodatkowo, nie można zignorować dużego rozmiaru i wagi tego modelu. Dostępne są lżejsze 16-calowe urządzenia konwertowalne, w tym LG Gram 16 2-w-1 lub Samsung Galaxy Book4 Pro 360 które są bardziej przyjazne w podróży. Dell jest większy i cięższy niż nawet HP Spectre x360 16 który w szczególności oferuje dyskretną grafikę GeForce.
Inspiron 16 7640 2-w-1 jest jednak nadal atrakcyjny pomimo swoich wad ze względu na rozsądną cenę wywoławczą 1000 USD. Wyróżnia się szybkością i jakością obrazu na tle innych laptopów w tym samym przedziale cenowym.
Cena i dostępność
Podstawowa konfiguracja z procesorem Core Ultra 5 125U i standardowym ekranem dotykowym IPS o rozdzielczości 1200p zaczyna się od 800 USD, podczas gdy recenzowana konfiguracja z procesorem Core Ultra 7 155H i ekranem mini-LED 2,5K kosztuje obecnie 1000 USD.
Wskazówka: Nasz system ocen został niedawno zaktualizowany, a wyniki wersji 8 nie są porównywalne z wynikami wersji 7. Dodatkowe informacje znajdą Państwo tutaj verfügbar.
Uwaga: Niedawno zaktualizowaliśmy nasz system oceniania i wyniki wersji 8 nie są porównywalne z wynikami wersji 7. Więcej informacji znajdą Państwo tutaj .
Dell Inspiron 16 7640 2-in-1
- 19/07/2024 v8
Allen Ngo
 Total Sustainability Score:
 Przezroczystość
Wyboru urządzeń do recenzji dokonuje nasza redakcja. Próbka testowa została udostępniona autorowi jako pożyczka od producenta lub sprzedawcy detalicznego na potrzeby tej recenzji. Pożyczkodawca nie miał wpływu na tę recenzję, producent nie otrzymał też kopii tej recenzji przed publikacją. Nie było obowiązku publikowania tej recenzji. Nigdy nie przyjmujemy rekompensaty ani płatności w zamian za nasze recenzje. Jako niezależna firma medialna, Notebookcheck nie podlega władzy producentów, sprzedawców detalicznych ani wydawców.
Tak testuje Notebookcheck
Każdego roku Notebookcheck niezależnie sprawdza setki laptopów i smartfonów, stosując standardowe procedury, aby zapewnić porównywalność wszystkich wyników. Od około 20 lat stale rozwijamy nasze metody badawcze, ustanawiając przy tym standardy branżowe. W naszych laboratoriach testowych doświadczeni technicy i redaktorzy korzystają z wysokiej jakości sprzętu pomiarowego. Testy te obejmują wieloetapowy proces walidacji. Nasz kompleksowy system ocen opiera się na setkach uzasadnionych pomiarów i benchmarków, co pozwala zachować obiektywizm.Price comparison

