Notebookcheck Logo
Teaser

Recenzja HP ZBook Ultra G1a 14: Wydajna alternatywa dla MacBooka Pro do pracy i gier

AMD Ryzen AI Max to nie żart.

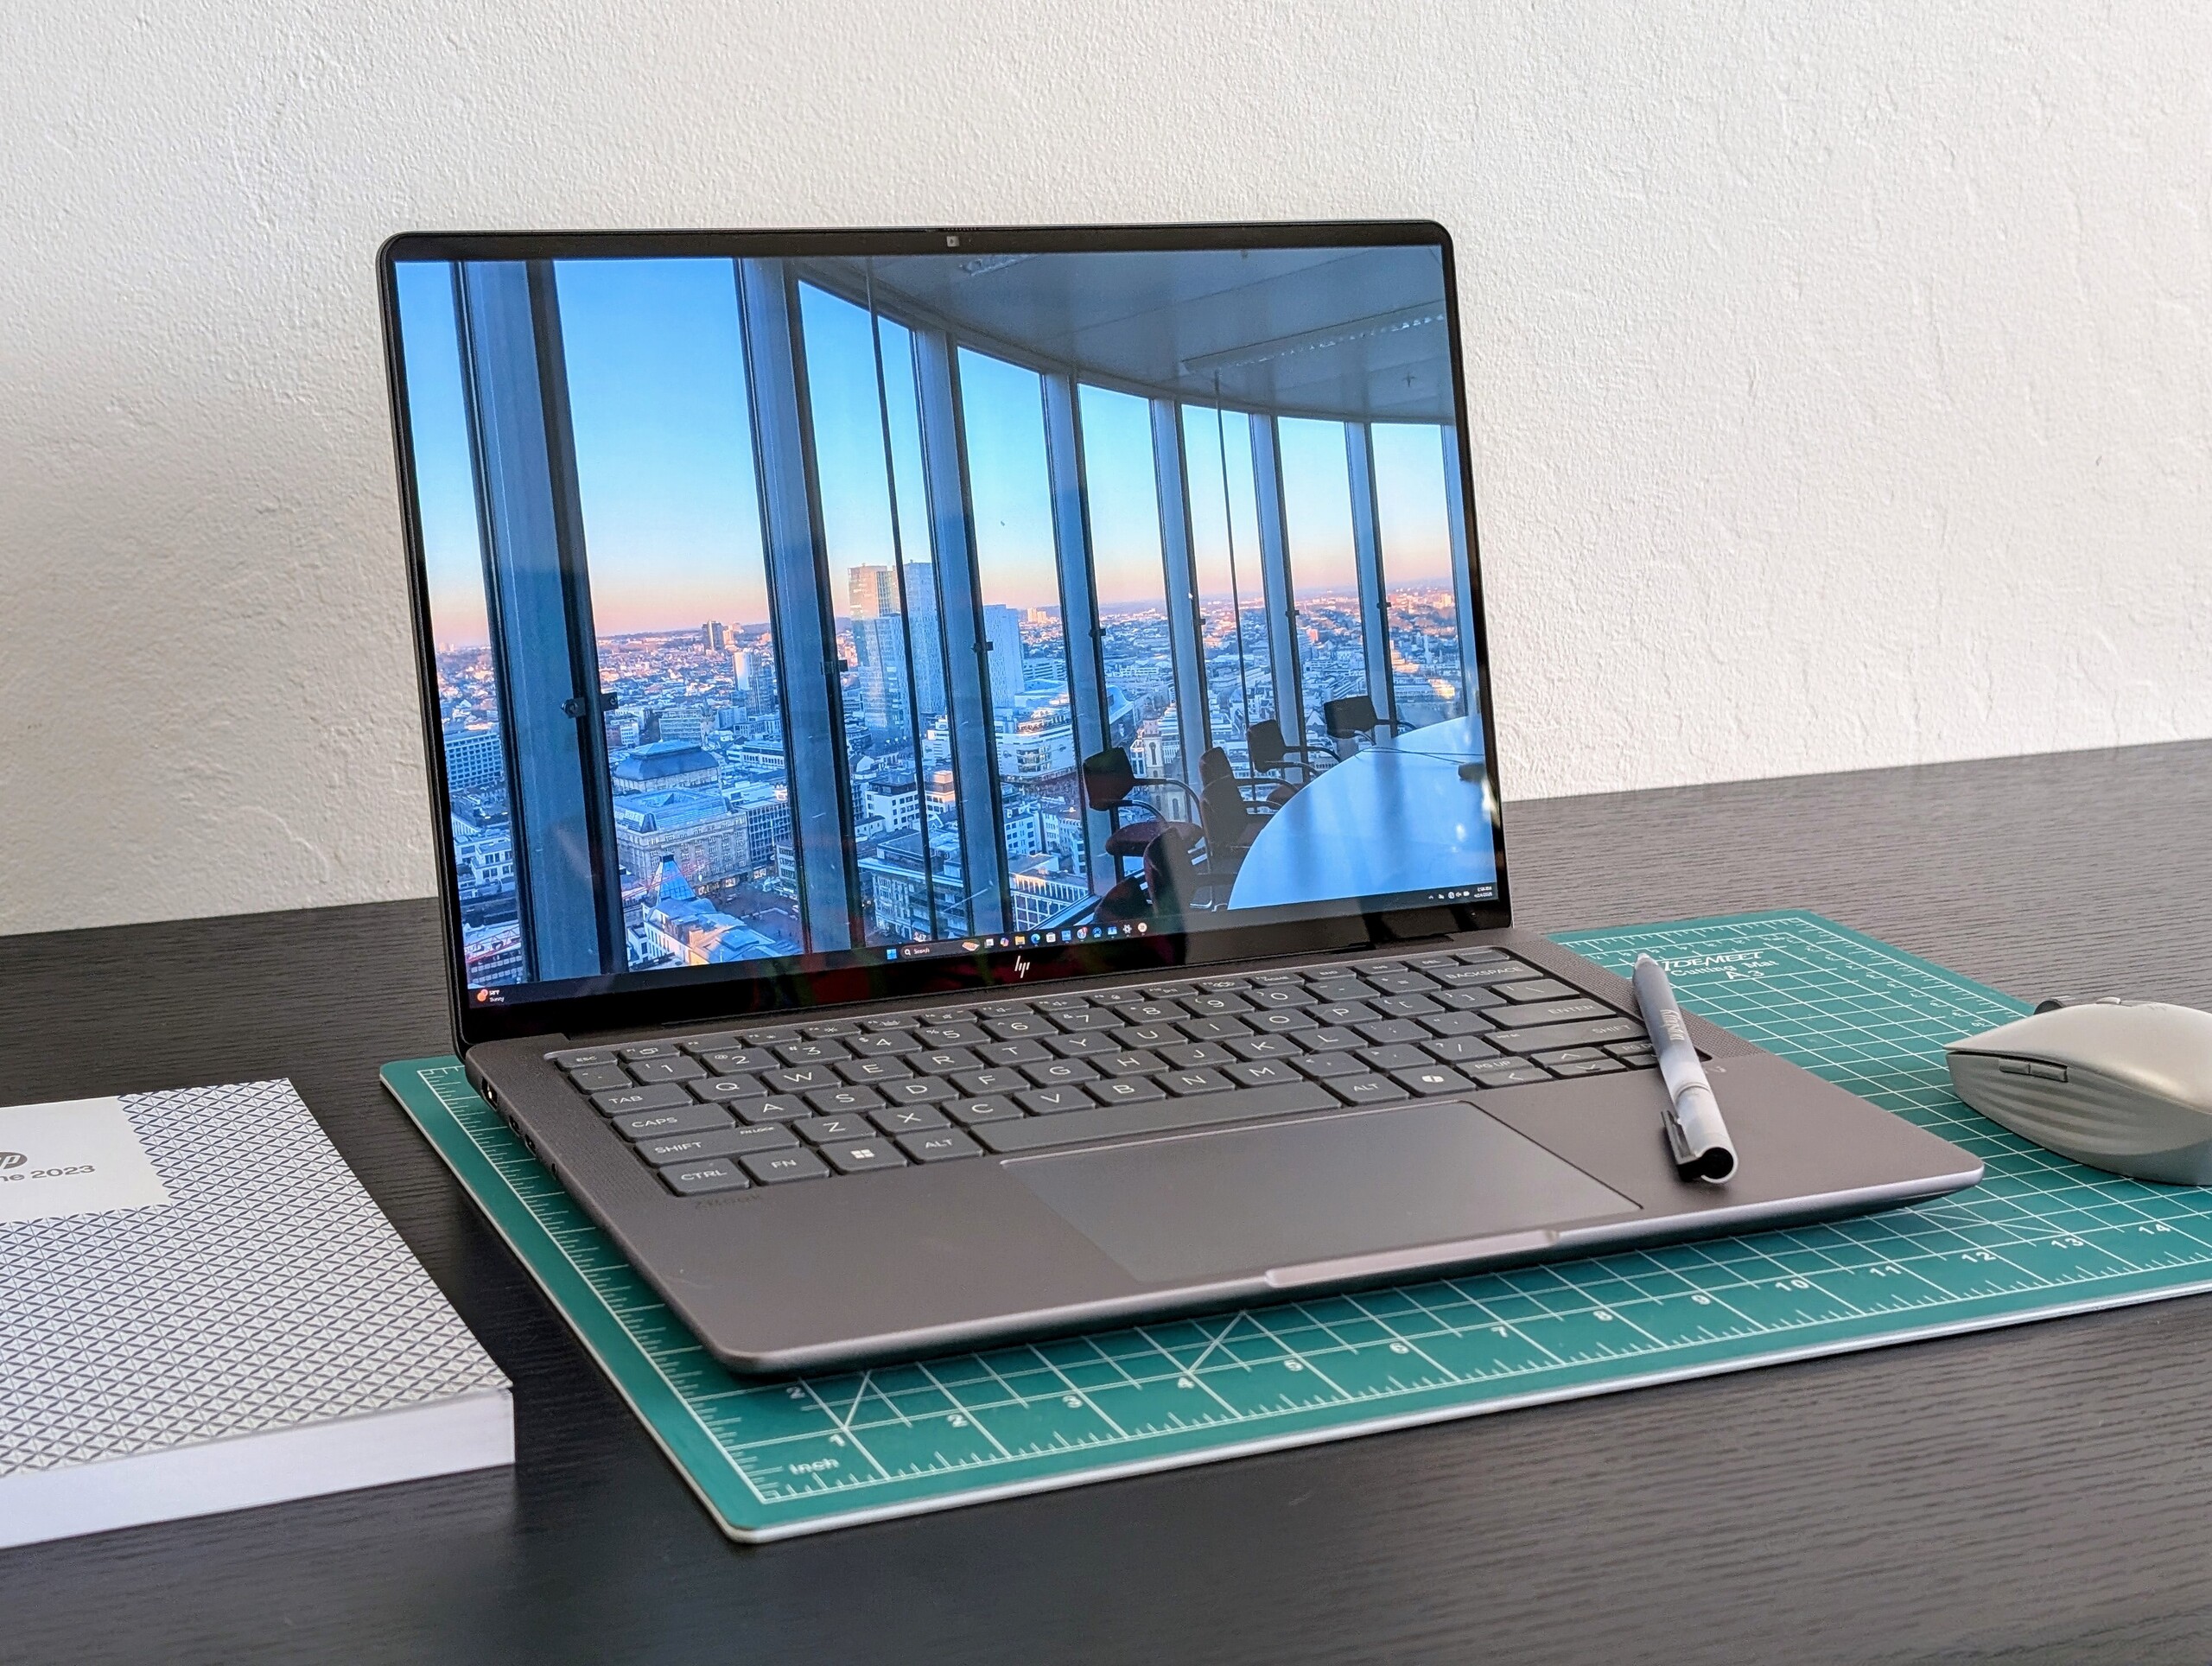
Firma HP nie przesadzała, mówiąc, że jej najnowszy ZBook będzie "najszybszym na świecie 14-calowym komputerem stacjonarnym". Ryzen AI Max+ 395 działa dobrze na wyspecjalizowanych komputerach stacjonarnych i mini PC, ale jest jeszcze bardziej imponujący w cienkiej i lekkiej 14-calowej obudowie.
Allen Ngo, 👁 Allen Ngo (tłumaczenie DeepL / Ninh Duy) Opublikowany 🇺🇸 🇫🇷 ...
Business Laptop / Notebook Workstation Zen 5 AMD

Werdykt - AMD daje z siebie wszystko

ZBook Ultra G1a 14 jest możliwy tylko dzięki wyjątkowej serii Ryzen AI Max. Wyspecjalizowany procesor Zen 5 integruje grafikę Radeon 8060S i do 128 GB pamięci RAM, zapewniając bardzo wysoki poziom wydajności, biorąc pod uwagę 14-calową obudowę. Wydajność w przeliczeniu na objętość jest gęsta i z łatwością stanowi najmocniejszą zaletę tego modelu. Imponujący ekran dotykowy OLED 120 Hz i profesjonalny design ZBooka dobrze uzupełniają pakiet.

Skondensowanie tak dużej wydajności w tak małej obudowie ma swoje wady. Pamięć RAM jest stała i nie obsługuje ECC, pamięć masowa jest ograniczona do jednego dysku, a czas pracy na baterii jest nieco krótki w tej kategorii rozmiarów. Ogólna wydajność spada podczas pracy na baterii, podczas gdy zasilacz sieciowy jest większy niż oczekiwano ze względu na wymagające elementy wewnętrzne.

Profesjonaliści, którzy chcą mieć przyjaznego w podróży 14-calowego konia roboczego bez poświęcania zbyt dużej wydajności, znajdą ZBook Ultra G1a 14 jako najlepszą opcję. Aby uzyskać coś bardziej wydajnego, użytkownicy musieliby zacząć rozglądać się za 15-calowe lub większe alternatywy z grafiką RTX 4000 Ada lub wyższą.

Za

+ ekran dotykowy OLED 1800p 120 Hz z kolorami P3
+ bardzo wysoka wydajność w przeliczeniu na objętość
+ gęsta, wysokiej jakości metalowa konstrukcja
+ do 128 GB bardzo szybkiej pamięci RAM
+ Opcje AMD Pro

Przeciw

- stosunkowo duży zasilacz sieciowy USB-C o mocy 140 W
- zmniejszona wydajność na zasilaniu bateryjnym
- wysokie zużycie energii; średnia żywotność baterii
- Pamięć RAM bez możliwości serwisowania
- brak opcji ECC

Cena i dostępność

HP dostarcza obecnie ZBook Ultra G1a 14 za 4000 USD w konfiguracji przedstawionej w niniejszej recenzji.

Amazon Logo
$1,099.00
HP ZBook 14 Firefly G11 (Latest Model) 14" Workstation Intel Core Ultra 7 155U (12-Core) 1TB SSD 64GB RAM FHD+ (1920x1200) IPS Windows 11 Pro
  • $1,049.00
    HP ZBook Firefly G11 14” AI-Ready Mobile Workstation IPS WUXGA (Intel Ultra 7 155U 12-Core, 64GB DDR5, 1TB SSD, Backlit KYB, Fingerprint, 2 Thunderbolt 4, WiFi 6E, 5MP Cam, Win 11 Pro) w/MAJ Deskpad
  • $1,249.99
    HP ZBook Firefly G11 Mobile Workstation (14" FHD+, NVIDIA RTX 500, Intel Core Ultra 7 155H, 32GB DDR5 RAM, 1TB SSD) AI Copilot Laptop for Engineer, Designer, IST Hub, Backlit, Fingerprint, Win 11 Pro

Nie należy mylić z zorientowanym na biuro EliteBook X G1a 14zorientowany na stacje robocze ZBook Ultra G1a 14 jest jednym z pierwszych laptopów wyposażonych w procesor AMD Ryzen AI Max+ Pro 395 ze zintegrowaną grafiką Radeon 8060S. Na uwagę zasługuje również 128 GB szybkiej pamięci RAM LPDDR5X-8533, co jest niespotykane w przypadku 14-calowej stacji roboczej. Model ten różni się od ZBook Firefly 14 który jest nieco większy i oferuje tylko opcje Intel i Nvidia.

Nasza jednostka testowa to wysokiej klasy konfiguracja z procesorem Ryzen AI Max+ Pro 395, kartą graficzną Radeon 8060S i ekranem dotykowym 2,8K OLED 120 Hz za około 4000 USD w sprzedaży detalicznej. Mniejsze jednostki SKU mogą być dostarczane z procesorem innym niż Pro Ryzen AI Max 380, kartą graficzną Radeon 8040S lub wyświetlaczem IPS 1200p w niższych cenach początkowych.

Alternatywy dla ZBook Ultra G1a 14 obejmują inne 14-calowe profesjonalne laptopy, takie jak Dell Precision 5490, seria ThinkPad P14lub MacBook Pro 14.

Więcej recenzji HP:

Specyfikacje

HP ZBook Ultra G1a 14
Procesor
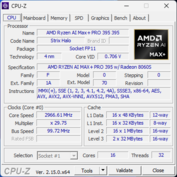
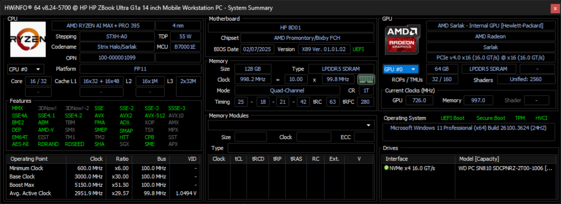
AMD Ryzen AI Max+ PRO 395 16 x 3 - 5.1 GHz, 81 W PL2 / Short Burst, 66 W PL1 / Sustained, Strix Halo PRO
Karta grafiki
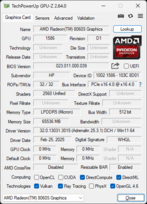
AMD Radeon RX 8060S, rdzeń: 2115 MHz, LPDDR5x, 32.0.13031.3015
Pamięć
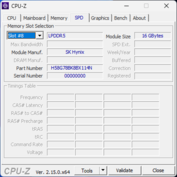
128 GB 
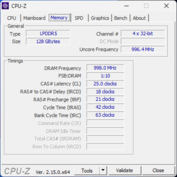
, LPDDR5x-8533, Dual-Channel, Soldered
Matryca
14.00 cali 16:10, 2880 x 1800 pikseli 243 PPI, 10-point capacitive, Samsung SDC41B3, OLED, refleksująca: tak, 120 Hz
Chipset
AMD Promontory/Bixby FCH
Dysk twardy
WDC PC SN810 2TB, 2048 GB 
Karta dźwiękowa
AMD Zen - Audio Processor - HD Audio Controller
Złącza
2 USB 3.1 Gen2, 2 USB 4.0 40 Gbps, 2 Thunderbolt, USB-C Power Delivery (PD), 1 HDMI, 3 DisplayPort, 1 blokada Kensingtona, gniazda audio: 3.5 mm combo
Łączność
Mediatek Wi-Fi 7 MT7925 Wireless LAN Card (a/b/g/ac = Wi-Fi 5/ax = Wi-Fi 6/ Wi-Fi 6E 6 GHz be = Wi-Fi 7), Bluetooth 5.4
Gabaryty
wysokość x szerokość x głębokość (mm): 18.5 x 312.2 x 215.5
Akumulator
74.5 Wh litowo-polimerowy
System operacyjny
Microsoft Windows 11 Pro
Kamera
kamerka: 1440p30
Główny aparat: 5.2 MPix
Inne
głośniki: Quad speakers, Stereo, klawiatura: Chiclet, podświetlanie klawiatury: tak, MyHP, Wolf Security, 36 miesiące(y) gwarancji
Waga
1.586 kg, zasilacz: 503 g
Cena
4000 USD
Uwaga: Producent może używać komponentów pochodzących od różnych dostawców, w tym paneli wyświetlaczy, napędów lub kart pamięci o podobnych specyfikacjach.


Przypadek

Cechy zewnętrzne i wymiary są prawie 1:1 z EliteBook X G1a 14. Oba modele mają nawet te same porty, klawiaturę, rozmiar clickpada i poczwórne głośniki Poly Studio. Być może najłatwiejszym sposobem na odróżnienie modelu ZBook od modelu EliteBook jest ciemniejszy szary odcień ZBooka.

Porównanie rozmiarów

315.7 mm 224.4 mm 19.2 mm 1.5 kg312.2 mm 215.5 mm 18.5 mm 1.6 kg310.6 mm 210.3 mm 18.95 mm 1.6 kg312.8 mm 214.75 mm 16 mm 982 g312 mm 223 mm 16.5 mm 1.3 kg312.6 mm 221.2 mm 15.5 mm 1.6 kg297 mm 210 mm 1 mm 5.7 g

Łączność

Przód: Brak portów
Przód: Brak portów
Po prawej stronie: USB-C (40 Gb/s) Thunderbolt 4 z DisplayPort 2.1 + Power Delivery, USB-A (10 Gb/s), blokada bezpieczeństwa
Tył: Brak portów
Tył: Brak portów
Po lewej: HDMI 2.1, USB-C (10 Gb/s) z DisplayPort 2.1 + Power Delivery, USB-C (40 Gb/s) Thunderbolt 4 z DisplayPort 2.1 + Power Delivery, zestaw słuchawkowy 3,5 mm

Komunikacja

Networking
iperf3 transmit AXE11000
Apple MacBook Pro 14 2024 M4 Pro
Broadcom 0x14E4, 0x4388 WiFi 6E AirPort
1624 (1567min, 1567.29P1 - 1680max) MBit/s +18%
HP ZBook Firefly 14 G11
Intel Wi-Fi 6E AX211
1543 (1276min - 1724max) MBit/s +12%
Lenovo ThinkPad X1 Carbon Gen 13 21NS0010GE
Intel BE201 320MHz
1382 (797min - 1565max) MBit/s 0%
HP ZBook Ultra G1a 14
Mediatek Wi-Fi 7 MT7925 Wireless LAN Card
1382 (1195min - 1624max) MBit/s
Asus ExpertBook P5 P5405-NZ0102X
Intel BE201 320MHz
1213 (638min - 1410max) MBit/s -12%
Dell Precision 5000 5490
Intel Wi-Fi 7 BE200 320MHz
834 (746min - 993max) MBit/s -40%
iperf3 receive AXE11000
Lenovo ThinkPad X1 Carbon Gen 13 21NS0010GE
Intel BE201 320MHz
1706 (1635min - 1733max) MBit/s +9%
Apple MacBook Pro 14 2024 M4 Pro
Broadcom 0x14E4, 0x4388 WiFi 6E AirPort
1679 (1603min, 1604.16P1 - 1714max) MBit/s +8%
Asus ExpertBook P5 P5405-NZ0102X
Intel BE201 320MHz
1627 (1282min - 1732max) MBit/s +4%
HP ZBook Ultra G1a 14
Mediatek Wi-Fi 7 MT7925 Wireless LAN Card
1561 (1331min - 1699max) MBit/s
HP ZBook Firefly 14 G11
Intel Wi-Fi 6E AX211
1446 (1326min - 1510max) MBit/s -7%
Dell Precision 5000 5490
Intel Wi-Fi 7 BE200 320MHz
845 (782min - 875max) MBit/s -46%
iperf3 transmit AXE11000 6GHz
HP ZBook Ultra G1a 14
Mediatek Wi-Fi 7 MT7925 Wireless LAN Card
1409 (1348min - 1451max) MBit/s
HP ZBook Firefly 14 G11
Intel Wi-Fi 6E AX211
1359 (999min - 1469max) MBit/s -4%
Dell Precision 5000 5490
Intel Wi-Fi 7 BE200 320MHz
1330 (808min - 1711max) MBit/s -6%
Asus ExpertBook P5 P5405-NZ0102X
Intel BE201 320MHz
1299 (1057min - 1447max) MBit/s -8%
Lenovo ThinkPad X1 Carbon Gen 13 21NS0010GE
Intel BE201 320MHz
1282 (426min - 1539max) MBit/s -9%
iperf3 receive AXE11000 6GHz
HP ZBook Ultra G1a 14
Mediatek Wi-Fi 7 MT7925 Wireless LAN Card
1762 (1731min - 1782max) MBit/s
Asus ExpertBook P5 P5405-NZ0102X
Intel BE201 320MHz
1739 (1693min - 1758max) MBit/s -1%
Lenovo ThinkPad X1 Carbon Gen 13 21NS0010GE
Intel BE201 320MHz
1709 (1589min - 1742max) MBit/s -3%
HP ZBook Firefly 14 G11
Intel Wi-Fi 6E AX211
1635 (1580min - 1662max) MBit/s -7%
Dell Precision 5000 5490
Intel Wi-Fi 7 BE200 320MHz
1449 (1278min - 1511max) MBit/s -18%
0501001502002503003504004505005506006507007508008509009501000105011001150120012501300135014001450150015501600165017001750Tooltip
HP ZBook Ultra G1a 14; iperf3 transmit AXE11000 6GHz; iperf 3.1.3: Ø1410 (1348-1451)
HP ZBook Ultra G1a 14; iperf3 receive AXE11000 6GHz; iperf 3.1.3: Ø1761 (1731-1782)

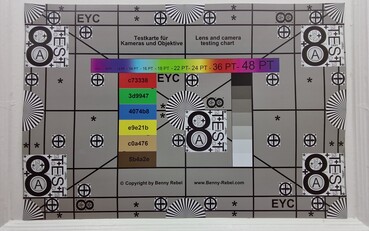
Kamera internetowa

Kamera internetowa 5 MP z podczerwienią i fizyczną migawką jest standardem.
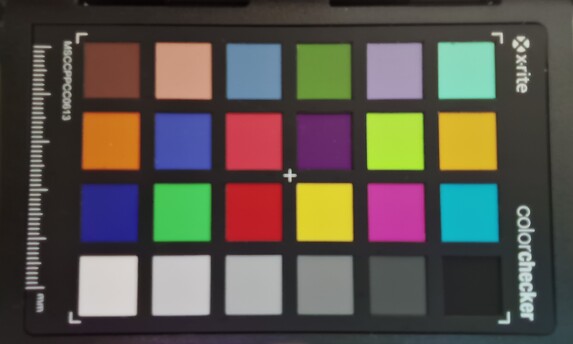
ColorChecker
6.7 ∆E
2.3 ∆E
7.5 ∆E
17 ∆E
11.6 ∆E
7.7 ∆E
2.8 ∆E
2.9 ∆E
5.3 ∆E
6 ∆E
9.5 ∆E
8.9 ∆E
6.2 ∆E
15.4 ∆E
5.7 ∆E
4.9 ∆E
5.5 ∆E
16 ∆E
7.9 ∆E
2 ∆E
5.4 ∆E
6.9 ∆E
4.1 ∆E
4.4 ∆E
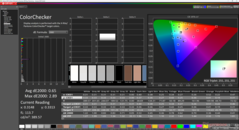
ColorChecker HP ZBook Ultra G1a 14: 7.2 ∆E min: 2.01 - max: 16.96 ∆E

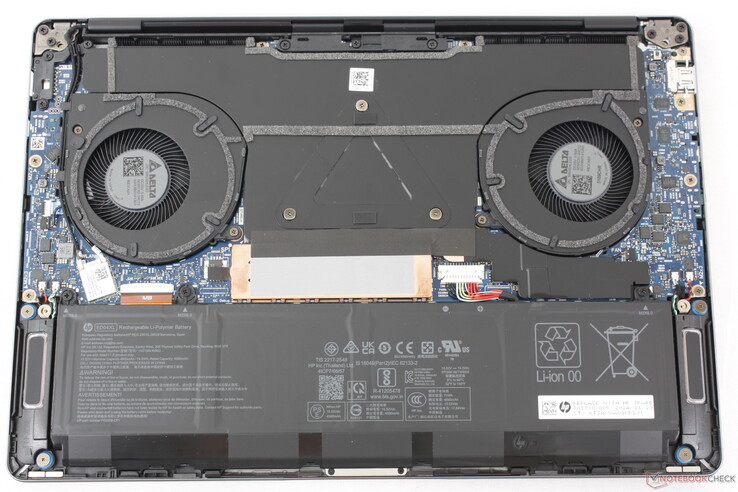
Konserwacja

Serwisowanie wymaga odkręcenia tylko czterech śrub krzyżakowych z dolnego panelu. Rozbudowa jest poza tym ograniczona, ponieważ pamięć RAM i WLAN są przylutowane. Nie ma też miejsca na drugi dysk SSD.

ZBook Ultra G1a 14 - podzespoły wewnętrzne

Zrównoważony rozwój

Podczas produkcji HP wykorzystuje 80 procent aluminium pochodzącego z recyklingu, 65 procent plastiku pochodzącego z recyklingu, 30 procent plastiku pochodzącego z recyklingu oceanicznego, 50 procent miedzi pochodzącej z recyklingu i 20 procent oleju spożywczego pochodzącego z recyklingu dla różnych komponentów modelu. W międzyczasie opakowanie jest w 100 procentach pozyskiwane w sposób zrównoważony, z niewielką ilością plastiku owiniętego wokół zasilacza sieciowego.

Akcesoria i gwarancja

W pudełku detalicznym nie ma żadnych dodatków poza zasilaczem sieciowym i dokumentacją. Trzyletnia gwarancja producenta jest standardem, czego można oczekiwać od wysokiej klasy modelu ZBook.

Urządzenia wejściowe

Klawiatura i panel dotykowy

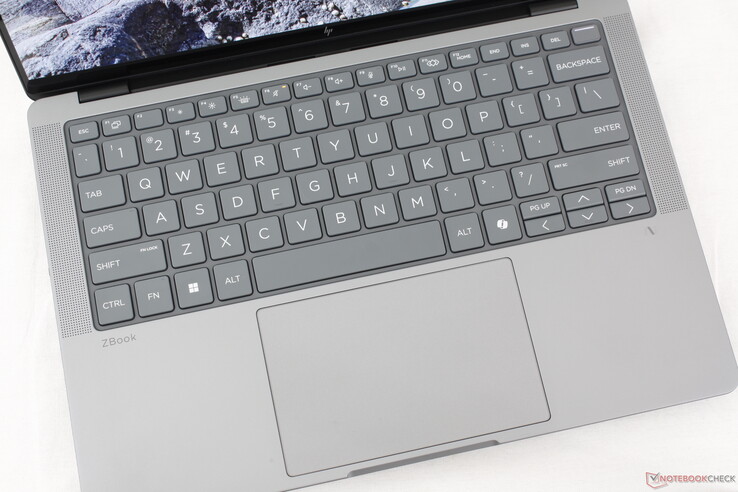
Wrażenia z pisania są podobne do EliteBook X G1a 14, co nie jest złe, ponieważ ogólnie uważamy, że klawiatury w modelach HP Elite są jednymi z najlepszych na każdym profesjonalnym laptopie. Klawisz spacji jest jednak dziwnie miękki i cichszy niż reszta klawiatury, podczas gdy klawisze strzałek są nadal tak ciasne jak zawsze. Są to niewielkie wady w skądinąd wygodnym układzie.

Taka sama klawiatura i clickpad jak w EliteBooku

Wyświetlacz

Wyraźny OLED bez większych problemów z ziarnistością

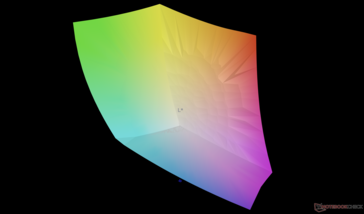
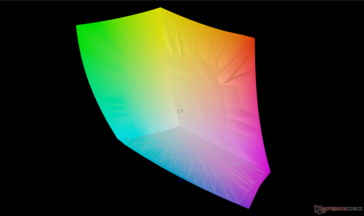
Ekran dotykowy OLED obsługuje 120 Hz i jest dobrze skalibrowany zgodnie ze standardem P3. Nie jest on jednak szczególnie jasny, przy maksymalnie 400 nitach w porównaniu do ponad 600 nitów lub 450 na MacBook Pro 14 lub Book Firefly 14 G11.

HDR i synchronizacja adaptacyjna nie są obsługiwane.

Opcje matowe i błyszczące
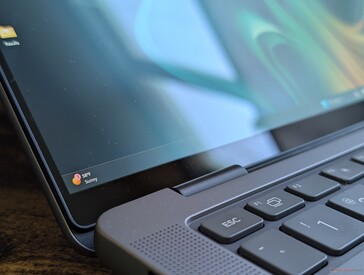
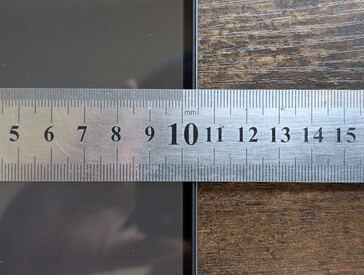
Wąskie ramki boczne
Wąskie ramki boczne
389.5
cd/m²
385.8
cd/m²
387.3
cd/m²
387.5
cd/m²
384.7
cd/m²
387.3
cd/m²
387.4
cd/m²
384.9
cd/m²
388.7
cd/m²
podświetlenie ekranu
Samsung SDC41B3 testowany z X-Rite i1Pro 2
maksimum: 389.5 cd/m² (Nits) średnia: 387 cd/m² Minimum: 4.32 cd/m²
rozświetlenie: 99 %
na akumulatorze: 384.7 cd/m²
kontrast: ∞:1 (czerń: 0 cd/m²)
ΔE Color 3.36 | 0.5-29.43 Ø4.87, calibrated: 0.65
ΔE Greyscale 1 | 0.5-98 Ø5.1
95.6% AdobeRGB 1998 (Argyll 2.2.0 3D)
100% sRGB (Argyll 2.2.0 3D)
99.7% Display P3 (Argyll 2.2.0 3D)
Gamma: 2.26
HP ZBook Ultra G1a 14
Samsung SDC41B3, OLED, 2880x1800, 14", 120 Hz
HP ZBook Firefly 14 G11
AUO6DA8, IPS, 2560x1600, 14", 120 Hz
Lenovo ThinkPad X1 Carbon Gen 13 21NS0010GE
ATNA40YK20-0, OLED, 2880x1800, 14", 120 Hz
Dell Precision 5000 5490
AU Optronics B140QAN, IPS, 2560x1600, 14", 60 Hz
Asus ExpertBook P5 P5405-NZ0102X
NE140QDM-NX4, IPS LED, 2560x1600, 14", 144 Hz
Apple MacBook Pro 14 2024 M4 Pro
MiniLED, 3024x1964, 14.2", 120 Hz
Display
-3%
1%
-12%
-19%
-2%
Display P3 Coverage
99.7
98.9
-1%
99.5
0%
79.7
-20%
70.8
-29%
99.6
0%
sRGB Coverage
100
99.9
0%
100
0%
100
0%
98
-2%
100
0%
AdobeRGB 1998 Coverage
95.6
86.6
-9%
97.1
2%
79.5
-17%
71.6
-25%
89
-7%
Response Times
-966%
-98%
-4331%
-2990%
-4060%
Response Time Grey 50% / Grey 80% *
0.94 ?(0.53, 0.41)
12.3 ?(5.6, 6.7)
-1209%
2.4 ?(1.2, 1.2)
-155%
52.3 ?(23.6, 28.7)
-5464%
36.3 ?(17.7, 18.6)
-3762%
77.2 ?(36.8, 40.4)
-8113%
Response Time Black / White *
1.01 ?(0.46, 0.55)
8.3 ?(4.7, 3.6)
-722%
1.9 ?(0.9, 1)
-88%
33.3 ?(16.2, 17.1)
-3197%
23.4 ?(11.1, 12.3)
-2217%
71.6 ?(44.2, 27.4)
-6989%
PWM Frequency
492.6
240 ?(100)
-51%
14880 ?(100)
2921%
Screen
20%
-118%
-2%
-97%
50%
Brightness middle
384.7
554.1
44%
407
6%
485.1
26%
457
19%
638
66%
Brightness
387
540
40%
410
6%
471
22%
457
18%
621
60%
Brightness Distribution
99
93
-6%
99
0%
90
-9%
95
-4%
95
-4%
Black Level *
0.58
0.38
0.12
Colorchecker dE 2000 *
3.36
2.54
24%
4.9
-46%
2.15
36%
4.9
-46%
0.6
82%
Colorchecker dE 2000 max. *
6.45
4.99
23%
9.1
-41%
5.39
16%
8.5
-32%
1.4
78%
Colorchecker dE 2000 calibrated *
0.65
0.56
14%
4.7
-623%
0.67
-3%
1.7
-162%
Greyscale dE 2000 *
1
1
-0%
2.3
-130%
2
-100%
5.7
-470%
0.8
20%
Gamma
2.26 97%
2.3 96%
2.26 97%
2.3 96%
2.25 98%
2.22 99%
CCT
6380 102%
6556 99%
6310 103%
6826 95%
7647 85%
6430 101%
Contrast
955
1277
3808
Całkowita średnia (program / ustawienia)
-316% / -150%
-72% / -86%
-1448% / -726%
-1035% / -559%
-1337% / -991%

* ... im mniej tym lepiej

vs. sRGB
vs. sRGB
vs. P3
vs. P3
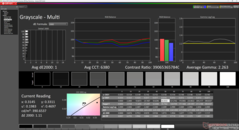
Skala szarości przed kalibracją (P3)
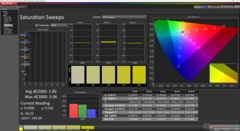
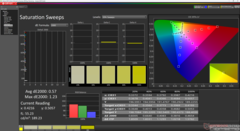
Pomiary nasycenia przed kalibracją (P3)
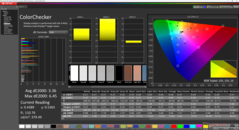
ColorChecker przed kalibracją (P3)
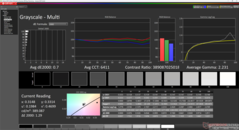
Skala szarości po kalibracji
Pomiary nasycenia po kalibracji
ColorChecker po kalibracji

Wyświetl czasy reakcji

Czasy reakcji wyświetlacza pokazują, jak szybko ekran może zmieniać kolor z jednego koloru na drugi. Długi czas reakcji może powodować powstawanie powidoków i sprawiać, że poruszające się obiekty będą niewyraźne (duchy). Gracze szybkich tytułów 3D powinni zwrócić szczególną uwagę na szybki czas reakcji.
       Czas reakcji od czerni do bieli
1.01 ms ... wzrost ↗ i spadek ↘ łącznie↗ 0.46 ms wzrost
↘ 0.55 ms upadek
W naszych testach ekran wykazuje bardzo szybką reakcję i powinien bardzo dobrze nadawać się do szybkich gier.
Dla porównania, wszystkie testowane urządzenia wahają się od 0.1 (minimum) do 240 (maksimum) ms. » 2 % wszystkich urządzeń jest lepszych.
Oznacza to, że zmierzony czas reakcji jest lepszy od średniej wszystkich testowanych urządzeń (20.8 ms).
       Czas reakcji 50% szarości do 80% szarości
0.94 ms ... wzrost ↗ i spadek ↘ łącznie↗ 0.53 ms wzrost
↘ 0.41 ms upadek
W naszych testach ekran wykazuje bardzo szybką reakcję i powinien bardzo dobrze nadawać się do szybkich gier.
Dla porównania, wszystkie testowane urządzenia wahają się od 0.165 (minimum) do 636 (maksimum) ms. » 2 % wszystkich urządzeń jest lepszych.
Oznacza to, że zmierzony czas reakcji jest lepszy od średniej wszystkich testowanych urządzeń (32.5 ms).

Migotanie ekranu / PWM (modulacja szerokości impulsu)

Aby przyciemnić ekran, niektóre notebooki po prostu w krótkich odstępach czasu włączają i wyłączają podświetlenie — jest to metoda zwana modulacją szerokości impulsu (PWM). W idealnym przypadku ta częstotliwość cykli powinna być niewykrywalna dla ludzkiego oka. Jeśli wspomniana częstotliwość jest zbyt niska, użytkownicy o wrażliwych oczach mogą odczuwać zmęczenie lub bóle głowy, a nawet całkowicie zauważyć migotanie.
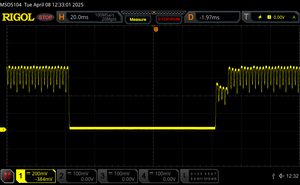
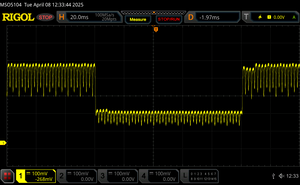
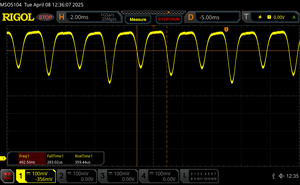
Wykryto migotanie ekranu/wykryto PWM 492.6 Hz
Amplitude: 43 %

Podświetlenie wyświetlacza miga z częstotliwością 492.6 Hz (najgorszy przypadek, np. przy użyciu PWM) .

Częstotliwość 492.6 Hz jest stosunkowo wysoka, więc większość użytkowników wrażliwych na PWM nie powinna zauważyć żadnego migotania. Istnieją jednak doniesienia, że ​​niektórzy użytkownicy są nadal wrażliwi na PWM przy częstotliwości 500 Hz i wyższej, więc należy zachować ostrożność.

Dla porównania: 53 % wszystkich testowanych urządzeń nie używa PWM do przyciemniania wyświetlacza. Jeśli wykryto PWM, zmierzono średnio 8516 (minimum: 5 - maksimum: 343500) Hz.

0 procent jasności
0 procent jasności
25 procent jasności
25 procent jasności
50 procent jasności
50 procent jasności
75 procent jasności
75 procent jasności
100 procent jasności

zMIANA!

Kąty widzenia: proszę opisać kąty widzenia w praktyce (ważne w przypadku korzystania z telefonu komórkowego, korzystania na kolanach?!,...) Proszę dodać kompozycję zdjęć do porównania (zdjęcie referencyjne NBC, maksymalna jasność wyświetlacza, ciemne pomieszczenie, ta sama przysłona i czas otwarcia migawki dla wszystkich zdjęć, 45° stopnie we wszystkich kierunkach)

Wydajność


Warunki testowania

Przed wykonaniem poniższych testów ustawiliśmy zarówno system Windows, jak i MyHP w tryb wysokiej wydajności.

Przylutowana pamięć RAM jest konfigurowalna między systemową pamięcią RAM i pamięcią wideo RAM, jak opisano szczegółowo tutaj.

Procesor

Surowa wydajność procesora Ryzen AI Max+ PRO 395 jest jedną z najszybszych spośród wszystkich 14-calowych stacji roboczych, jeśli nie *najszybszą*. Osiąga lepsze wyniki niż Core Ultra 9 185H w konkurencyjnym Precision 5470 o ~80% w wielowątkowych obciążeniach, a jednocześnie dorównuje 14-rdzeniowemu Apple M4 Pro. Wydajność jednowątkowa jest jednak przeciętna, więc w pewnych warunkach nadal przegrywa z flagowym Apple.

Zrównoważona wydajność pod obciążeniem jest doskonała i lepsza niż oczekiwano od 14-calowej obudowy.

Cinebench R15 Multi Loop

0245490735980122514701715196022052450269529403185343036753920416544104655Tooltip
HP ZBook Ultra G1a 14 AMD Ryzen AI Max+ PRO 395: Ø4735 (4586.1-4783.54)
HP ZBook Firefly 14 G11 Intel Core Ultra 7 165H: Ø1726 (1519.58-2641.31)
Lenovo ThinkPad X1 Carbon Gen 13 21NS0010GE Intel Core Ultra 7 258V: Ø1317 (1177.47-1571.22)
Dell Precision 5000 5490 Intel Core Ultra 9 185H: Ø2234 (2141.1-2808.99)
Asus ExpertBook P5 P5405-NZ0102X Intel Core Ultra 7 258V: Ø1503 (1441.91-1634.86)
Apple MacBook Pro 14 2024 M4 Pro Apple M4 Pro (14 cores): Ø3031 (2989.31-3216.21)
Asus ROG Flow Z13 GZ302EA-RU073W AMD Ryzen AI Max+ 395: Ø4722 (4665.27-4830.33)
CPU Performance Rating: Percent
Cinebench 2024: CPU Multi Core | CPU Single Core
Cinebench R23: Multi Core | Single Core
Cinebench R20: CPU (Multi Core) | CPU (Single Core)
Cinebench R15: CPU Multi 64Bit | CPU Single 64Bit
Blender: v2.79 BMW27 CPU
7-Zip 18.03: 7z b 4 | 7z b 4 -mmt1
Geekbench 6.4: Multi-Core | Single-Core
Geekbench 5.5: Multi-Core | Single-Core
HWBOT x265 Benchmark v2.2: 4k Preset
LibreOffice : 20 Documents To PDF
R Benchmark 2.5: Overall mean
CPU Performance Rating
Apple MacBook Pro 14 2024 M4 Pro -11!
Apple M4 Pro (14 cores)
91.3 pt
Asus ROG Flow Z13 GZ302EA-RU073W
AMD Ryzen AI Max+ 395
85.4 pt
HP ZBook Ultra G1a 14
AMD Ryzen AI Max+ PRO 395
80 pt
Przeciętny AMD Ryzen AI Max+ PRO 395
 
80 pt
Xiaomi RedmiBook Pro 14 2025
Intel Core Ultra 7 255H
70.2 pt
Asus VivoBook S 14 OLED M5406WA -2!
AMD Ryzen AI 9 HX 370
68.6 pt
Lenovo Yoga Pro 7 14ASP G9
AMD Ryzen AI 9 365
64.5 pt
Dell Precision 5000 5490 -2!
Intel Core Ultra 9 185H
58.9 pt
Asus Zenbook 14 OLED UM3406HA
AMD Ryzen 7 8840HS
55.2 pt
HP ZBook Firefly 14 G11 -1!
Intel Core Ultra 7 165H
53.2 pt
Lenovo ThinkPad X1 Carbon Gen 13 21NS0010GE
Intel Core Ultra 7 258V
51.1 pt
Asus ExpertBook P5 P5405-NZ0102X -2!
Intel Core Ultra 7 258V
49.9 pt
Lenovo Yoga 7 2-in-1 14AHP9 Arctic Grey
AMD Ryzen 5 8640HS
48.7 pt
Cinebench 2024 / CPU Multi Core
Apple MacBook Pro 14 2024 M4 Pro
Apple M4 Pro (14 cores)
1662 Points +1%
Asus ROG Flow Z13 GZ302EA-RU073W
AMD Ryzen AI Max+ 395
1648 Points 0%
HP ZBook Ultra G1a 14
AMD Ryzen AI Max+ PRO 395
1643 Points
Przeciętny AMD Ryzen AI Max+ PRO 395
  (n=1)
1643 Points 0%
Xiaomi RedmiBook Pro 14 2025
Intel Core Ultra 7 255H
1053 Points -36%
Lenovo Yoga Pro 7 14ASP G9
AMD Ryzen AI 9 365
996 Points -39%
Asus Zenbook 14 OLED UM3406HA
AMD Ryzen 7 8840HS
677 Points -59%
Lenovo Yoga 7 2-in-1 14AHP9 Arctic Grey
AMD Ryzen 5 8640HS
634 Points -61%
HP ZBook Firefly 14 G11
Intel Core Ultra 7 165H
616 Points -63%
Lenovo ThinkPad X1 Carbon Gen 13 21NS0010GE
Intel Core Ultra 7 258V
524 Points -68%
Cinebench 2024 / CPU Single Core
Apple MacBook Pro 14 2024 M4 Pro
Apple M4 Pro (14 cores)
177 Points +58%
Xiaomi RedmiBook Pro 14 2025
Intel Core Ultra 7 255H
127.6 Points +14%
Lenovo ThinkPad X1 Carbon Gen 13 21NS0010GE
Intel Core Ultra 7 258V
118.2 Points +5%
Asus ROG Flow Z13 GZ302EA-RU073W
AMD Ryzen AI Max+ 395
116.8 Points +4%
Lenovo Yoga Pro 7 14ASP G9
AMD Ryzen AI 9 365
113.5 Points +1%
HP ZBook Ultra G1a 14
AMD Ryzen AI Max+ PRO 395
112.2 Points
Przeciętny AMD Ryzen AI Max+ PRO 395
  (n=1)
112.2 Points 0%
Asus Zenbook 14 OLED UM3406HA
AMD Ryzen 7 8840HS
99 Points -12%
Lenovo Yoga 7 2-in-1 14AHP9 Arctic Grey
AMD Ryzen 5 8640HS
97 Points -14%
Cinebench R23 / Multi Core
HP ZBook Ultra G1a 14
AMD Ryzen AI Max+ PRO 395
30706 (29203.2min - 30705.8max) Points
Przeciętny AMD Ryzen AI Max+ PRO 395
  (n=1)
30706 Points 0%
Asus ROG Flow Z13 GZ302EA-RU073W
AMD Ryzen AI Max+ 395
29063 Points -5%
Apple MacBook Pro 14 2024 M4 Pro
Apple M4 Pro (14 cores)
23433 Points -24%
Asus VivoBook S 14 OLED M5406WA
AMD Ryzen AI 9 HX 370
21058 Points -31%
Xiaomi RedmiBook Pro 14 2025
Intel Core Ultra 7 255H
20022 Points -35%
Lenovo Yoga Pro 7 14ASP G9
AMD Ryzen AI 9 365
18748 Points -39%
Dell Precision 5000 5490
Intel Core Ultra 9 185H
17002 (14526.5min - 17001.9max) Points -45%
HP ZBook Firefly 14 G11
Intel Core Ultra 7 165H
14055 (11053.4min - 14054.8max) Points -54%
Asus Zenbook 14 OLED UM3406HA
AMD Ryzen 7 8840HS
13888 Points -55%
Lenovo Yoga 7 2-in-1 14AHP9 Arctic Grey
AMD Ryzen 5 8640HS
11486 Points -63%
Asus ExpertBook P5 P5405-NZ0102X
Intel Core Ultra 7 258V
11049 Points -64%
Lenovo ThinkPad X1 Carbon Gen 13 21NS0010GE
Intel Core Ultra 7 258V
10471 Points -66%
Cinebench R23 / Single Core
Apple MacBook Pro 14 2024 M4 Pro
Apple M4 Pro (14 cores)
2249 Points +12%
Xiaomi RedmiBook Pro 14 2025
Intel Core Ultra 7 255H
2152 Points +7%
Asus ROG Flow Z13 GZ302EA-RU073W
AMD Ryzen AI Max+ 395
2034 Points +2%
HP ZBook Ultra G1a 14
AMD Ryzen AI Max+ PRO 395
2003 Points
Przeciętny AMD Ryzen AI Max+ PRO 395
  (n=1)
2003 Points 0%
Asus VivoBook S 14 OLED M5406WA
AMD Ryzen AI 9 HX 370
2001 Points 0%
Lenovo Yoga Pro 7 14ASP G9
AMD Ryzen AI 9 365
1992 Points -1%
Lenovo ThinkPad X1 Carbon Gen 13 21NS0010GE
Intel Core Ultra 7 258V
1918 Points -4%
Asus ExpertBook P5 P5405-NZ0102X
Intel Core Ultra 7 258V
1773 Points -11%
Dell Precision 5000 5490
Intel Core Ultra 9 185H
1770 Points -12%
HP ZBook Firefly 14 G11
Intel Core Ultra 7 165H
1766 Points -12%
Asus Zenbook 14 OLED UM3406HA
AMD Ryzen 7 8840HS
1746 Points -13%
Lenovo Yoga 7 2-in-1 14AHP9 Arctic Grey
AMD Ryzen 5 8640HS
1711 Points -15%
Cinebench R20 / CPU (Multi Core)
HP ZBook Ultra G1a 14
AMD Ryzen AI Max+ PRO 395
11816 Points
Przeciętny AMD Ryzen AI Max+ PRO 395
  (n=1)
11816 Points 0%
Asus ROG Flow Z13 GZ302EA-RU073W
AMD Ryzen AI Max+ 395
11357 Points -4%
Asus VivoBook S 14 OLED M5406WA
AMD Ryzen AI 9 HX 370
8233 Points -30%
Xiaomi RedmiBook Pro 14 2025
Intel Core Ultra 7 255H
7884 Points -33%
Lenovo Yoga Pro 7 14ASP G9
AMD Ryzen AI 9 365
7346 Points -38%
Dell Precision 5000 5490
Intel Core Ultra 9 185H
6407 Points -46%
HP ZBook Firefly 14 G11
Intel Core Ultra 7 165H
5471 Points -54%
Asus Zenbook 14 OLED UM3406HA
AMD Ryzen 7 8840HS
5414 Points -54%
Lenovo Yoga 7 2-in-1 14AHP9 Arctic Grey
AMD Ryzen 5 8640HS
4475 Points -62%
Asus ExpertBook P5 P5405-NZ0102X
Intel Core Ultra 7 258V
4273 Points -64%
Lenovo ThinkPad X1 Carbon Gen 13 21NS0010GE
Intel Core Ultra 7 258V
4072 Points -66%
Cinebench R20 / CPU (Single Core)
Xiaomi RedmiBook Pro 14 2025
Intel Core Ultra 7 255H
826 Points +5%
Asus ROG Flow Z13 GZ302EA-RU073W
AMD Ryzen AI Max+ 395
791 Points +1%
Asus VivoBook S 14 OLED M5406WA
AMD Ryzen AI 9 HX 370
790 Points +1%
HP ZBook Ultra G1a 14
AMD Ryzen AI Max+ PRO 395
783 Points
Przeciętny AMD Ryzen AI Max+ PRO 395
  (n=1)
783 Points 0%
Lenovo Yoga Pro 7 14ASP G9
AMD Ryzen AI 9 365
782 Points 0%
Lenovo ThinkPad X1 Carbon Gen 13 21NS0010GE
Intel Core Ultra 7 258V
734 Points -6%
Asus ExpertBook P5 P5405-NZ0102X
Intel Core Ultra 7 258V
684 Points -13%
Dell Precision 5000 5490
Intel Core Ultra 9 185H
680 Points -13%
Asus Zenbook 14 OLED UM3406HA
AMD Ryzen 7 8840HS
679 Points -13%
HP ZBook Firefly 14 G11
Intel Core Ultra 7 165H
674 Points -14%
Lenovo Yoga 7 2-in-1 14AHP9 Arctic Grey
AMD Ryzen 5 8640HS
664 Points -15%
Cinebench R15 / CPU Multi 64Bit
Asus ROG Flow Z13 GZ302EA-RU073W
AMD Ryzen AI Max+ 395
4830 (4665.27min - 4830.33max) Points +1%
HP ZBook Ultra G1a 14
AMD Ryzen AI Max+ PRO 395
4784 (4586.1min - 4783.54max) Points
Przeciętny AMD Ryzen AI Max+ PRO 395
  (n=1)
4784 Points 0%
Asus VivoBook S 14 OLED M5406WA
AMD Ryzen AI 9 HX 370
3345 (2602.98min - 3345.04max) Points -30%
Xiaomi RedmiBook Pro 14 2025
Intel Core Ultra 7 255H
3291 (2606.37min - 3290.83max) Points -31%
Apple MacBook Pro 14 2024 M4 Pro
Apple M4 Pro (14 cores)
3031 (2989.31min, 2989.42P1 - 3216.21max) Points -37%
Lenovo Yoga Pro 7 14ASP G9
AMD Ryzen AI 9 365
2855 (2802.49min - 2855.31max) Points -40%
Dell Precision 5000 5490
Intel Core Ultra 9 185H
2809 (2141.1min - 2808.99max) Points -41%
HP ZBook Firefly 14 G11
Intel Core Ultra 7 165H
2641 (1519.58min - 2641.31max) Points -45%
Asus Zenbook 14 OLED UM3406HA
AMD Ryzen 7 8840HS
2176 (2149.96min - 2176.16max) Points -55%
Lenovo Yoga 7 2-in-1 14AHP9 Arctic Grey
AMD Ryzen 5 8640HS
1845 (1802.86min - 1845.44max) Points -61%
Asus ExpertBook P5 P5405-NZ0102X
Intel Core Ultra 7 258V
1635 (1441.91min - 1634.86max) Points -66%
Lenovo ThinkPad X1 Carbon Gen 13 21NS0010GE
Intel Core Ultra 7 258V
1571 (1177.47min - 1571.22max) Points -67%
Cinebench R15 / CPU Single 64Bit
Xiaomi RedmiBook Pro 14 2025
Intel Core Ultra 7 255H
322 Points +5%
Asus ROG Flow Z13 GZ302EA-RU073W
AMD Ryzen AI Max+ 395
317 Points +3%
Asus VivoBook S 14 OLED M5406WA
AMD Ryzen AI 9 HX 370
307 Points 0%
HP ZBook Ultra G1a 14
AMD Ryzen AI Max+ PRO 395
307 Points
Przeciętny AMD Ryzen AI Max+ PRO 395
  (n=1)
307 Points 0%
Lenovo Yoga Pro 7 14ASP G9
AMD Ryzen AI 9 365
303 Points -1%
Lenovo ThinkPad X1 Carbon Gen 13 21NS0010GE
Intel Core Ultra 7 258V
294 Points -4%
Asus ExpertBook P5 P5405-NZ0102X
Intel Core Ultra 7 258V
282 Points -8%
Asus Zenbook 14 OLED UM3406HA
AMD Ryzen 7 8840HS
268 Points -13%
Lenovo Yoga 7 2-in-1 14AHP9 Arctic Grey
AMD Ryzen 5 8640HS
268 Points -13%
HP ZBook Firefly 14 G11
Intel Core Ultra 7 165H
260 Points -15%
Dell Precision 5000 5490
Intel Core Ultra 9 185H
257 Points -16%
Blender / v2.79 BMW27 CPU
Lenovo ThinkPad X1 Carbon Gen 13 21NS0010GE
Intel Core Ultra 7 258V
366 Seconds * -259%
Asus ExpertBook P5 P5405-NZ0102X
Intel Core Ultra 7 258V
333 Seconds * -226%
Lenovo Yoga 7 2-in-1 14AHP9 Arctic Grey
AMD Ryzen 5 8640HS
276 Seconds * -171%
HP ZBook Firefly 14 G11
Intel Core Ultra 7 165H
261 Seconds * -156%
Asus Zenbook 14 OLED UM3406HA
AMD Ryzen 7 8840HS
226 Seconds * -122%
Dell Precision 5000 5490
Intel Core Ultra 9 185H
202 Seconds * -98%
Lenovo Yoga Pro 7 14ASP G9
AMD Ryzen AI 9 365
194 Seconds * -90%
Xiaomi RedmiBook Pro 14 2025
Intel Core Ultra 7 255H
178 Seconds * -75%
Asus VivoBook S 14 OLED M5406WA
AMD Ryzen AI 9 HX 370
163 Seconds * -60%
Asus ROG Flow Z13 GZ302EA-RU073W
AMD Ryzen AI Max+ 395
107 Seconds * -5%
HP ZBook Ultra G1a 14
AMD Ryzen AI Max+ PRO 395
102 Seconds *
Przeciętny AMD Ryzen AI Max+ PRO 395
  (n=1)
102 Seconds * -0%
7-Zip 18.03 / 7z b 4
Asus ROG Flow Z13 GZ302EA-RU073W
AMD Ryzen AI Max+ 395
121368 MIPS +11%
HP ZBook Ultra G1a 14
AMD Ryzen AI Max+ PRO 395
109760 MIPS
Przeciętny AMD Ryzen AI Max+ PRO 395
  (n=1)
109760 MIPS 0%
Asus VivoBook S 14 OLED M5406WA
AMD Ryzen AI 9 HX 370
75402 MIPS -31%
Dell Precision 5000 5490
Intel Core Ultra 9 185H
67914 MIPS -38%
Xiaomi RedmiBook Pro 14 2025
Intel Core Ultra 7 255H
66152 MIPS -40%
Lenovo Yoga Pro 7 14ASP G9
AMD Ryzen AI 9 365
65071 MIPS -41%
Asus Zenbook 14 OLED UM3406HA
AMD Ryzen 7 8840HS
61047 MIPS -44%
HP ZBook Firefly 14 G11
Intel Core Ultra 7 165H
54741 MIPS -50%
Lenovo Yoga 7 2-in-1 14AHP9 Arctic Grey
AMD Ryzen 5 8640HS
49939 MIPS -55%
Lenovo ThinkPad X1 Carbon Gen 13 21NS0010GE
Intel Core Ultra 7 258V
36422 MIPS -67%
Asus ExpertBook P5 P5405-NZ0102X
Intel Core Ultra 7 258V
36311 MIPS -67%
7-Zip 18.03 / 7z b 4 -mmt1
Asus ROG Flow Z13 GZ302EA-RU073W
AMD Ryzen AI Max+ 395
6540 MIPS +17%
Asus Zenbook 14 OLED UM3406HA
AMD Ryzen 7 8840HS
6205 MIPS +11%
Xiaomi RedmiBook Pro 14 2025
Intel Core Ultra 7 255H
6169 MIPS +10%
Asus VivoBook S 14 OLED M5406WA
AMD Ryzen AI 9 HX 370
6077 MIPS +8%
Lenovo Yoga 7 2-in-1 14AHP9 Arctic Grey
AMD Ryzen 5 8640HS
5975 MIPS +6%
Lenovo Yoga Pro 7 14ASP G9
AMD Ryzen AI 9 365
5928 MIPS +6%
Lenovo ThinkPad X1 Carbon Gen 13 21NS0010GE
Intel Core Ultra 7 258V
5865 MIPS +4%
Asus ExpertBook P5 P5405-NZ0102X
Intel Core Ultra 7 258V
5789 MIPS +3%
HP ZBook Ultra G1a 14
AMD Ryzen AI Max+ PRO 395
5613 MIPS
Przeciętny AMD Ryzen AI Max+ PRO 395
  (n=1)
5613 MIPS 0%
Dell Precision 5000 5490
Intel Core Ultra 9 185H
5489 MIPS -2%
HP ZBook Firefly 14 G11
Intel Core Ultra 7 165H
5387 MIPS -4%
Geekbench 6.4 / Multi-Core
Apple MacBook Pro 14 2024 M4 Pro
Apple M4 Pro (14 cores)
22544 Points +34%
Asus ROG Flow Z13 GZ302EA-RU073W
AMD Ryzen AI Max+ 395
21269 Points +26%
Xiaomi RedmiBook Pro 14 2025
Intel Core Ultra 7 255H
17489 Points +4%
HP ZBook Ultra G1a 14
AMD Ryzen AI Max+ PRO 395
16855 Points
Przeciętny AMD Ryzen AI Max+ PRO 395
  (n=1)
16855 Points 0%
Asus VivoBook S 14 OLED M5406WA
AMD Ryzen AI 9 HX 370
15059 Points -11%
Lenovo Yoga Pro 7 14ASP G9
AMD Ryzen AI 9 365
14118 Points -16%
Dell Precision 5000 5490
Intel Core Ultra 9 185H
13972 Points -17%
HP ZBook Firefly 14 G11
Intel Core Ultra 7 165H
12196 Points -28%
Asus Zenbook 14 OLED UM3406HA
AMD Ryzen 7 8840HS
11279 Points -33%
Lenovo ThinkPad X1 Carbon Gen 13 21NS0010GE
Intel Core Ultra 7 258V
11102 Points -34%
Asus ExpertBook P5 P5405-NZ0102X
Intel Core Ultra 7 258V
10942 Points -35%
Lenovo Yoga 7 2-in-1 14AHP9 Arctic Grey
AMD Ryzen 5 8640HS
10338 Points -39%
Geekbench 6.4 / Single-Core
Apple MacBook Pro 14 2024 M4 Pro
Apple M4 Pro (14 cores)
3927 Points +42%
Asus ROG Flow Z13 GZ302EA-RU073W
AMD Ryzen AI Max+ 395
2978 Points +8%
Xiaomi RedmiBook Pro 14 2025
Intel Core Ultra 7 255H
2923 Points +6%
Asus VivoBook S 14 OLED M5406WA
AMD Ryzen AI 9 HX 370
2884 Points +5%
Lenovo Yoga Pro 7 14ASP G9
AMD Ryzen AI 9 365
2815 Points +2%
Asus ExpertBook P5 P5405-NZ0102X
Intel Core Ultra 7 258V
2757 Points 0%
HP ZBook Ultra G1a 14
AMD Ryzen AI Max+ PRO 395
2756 Points
Przeciętny AMD Ryzen AI Max+ PRO 395
  (n=1)
2756 Points 0%
Lenovo ThinkPad X1 Carbon Gen 13 21NS0010GE
Intel Core Ultra 7 258V
2730 Points -1%
Asus Zenbook 14 OLED UM3406HA
AMD Ryzen 7 8840HS
2552 Points -7%
Lenovo Yoga 7 2-in-1 14AHP9 Arctic Grey
AMD Ryzen 5 8640HS
2497 Points -9%
HP ZBook Firefly 14 G11
Intel Core Ultra 7 165H
2406 Points -13%
Dell Precision 5000 5490
Intel Core Ultra 9 185H
2384 Points -13%
Geekbench 5.5 / Multi-Core
Asus ROG Flow Z13 GZ302EA-RU073W
AMD Ryzen AI Max+ 395
22023 Points +21%
HP ZBook Ultra G1a 14
AMD Ryzen AI Max+ PRO 395
18251 Points
Przeciętny AMD Ryzen AI Max+ PRO 395
  (n=1)
18251 Points 0%
Xiaomi RedmiBook Pro 14 2025
Intel Core Ultra 7 255H
17218 Points -6%
Asus VivoBook S 14 OLED M5406WA
AMD Ryzen AI 9 HX 370
14608 Points -20%
Lenovo Yoga Pro 7 14ASP G9
AMD Ryzen AI 9 365
13009 Points -29%
Dell Precision 5000 5490
Intel Core Ultra 9 185H
12826 Points -30%
HP ZBook Firefly 14 G11
Intel Core Ultra 7 165H
12123 Points -34%
Asus Zenbook 14 OLED UM3406HA
AMD Ryzen 7 8840HS
9897 Points -46%
Asus ExpertBook P5 P5405-NZ0102X
Intel Core Ultra 7 258V
9750 Points -47%
Lenovo ThinkPad X1 Carbon Gen 13 21NS0010GE
Intel Core Ultra 7 258V
9743 Points -47%
Lenovo Yoga 7 2-in-1 14AHP9 Arctic Grey
AMD Ryzen 5 8640HS
9060 Points -50%
Geekbench 5.5 / Single-Core
Asus ROG Flow Z13 GZ302EA-RU073W
AMD Ryzen AI Max+ 395
2275 Points +10%
Xiaomi RedmiBook Pro 14 2025
Intel Core Ultra 7 255H
2112 Points +2%
Asus VivoBook S 14 OLED M5406WA
AMD Ryzen AI 9 HX 370
2108 Points +2%
Lenovo Yoga Pro 7 14ASP G9
AMD Ryzen AI 9 365
2095 Points +1%
HP ZBook Ultra G1a 14
AMD Ryzen AI Max+ PRO 395
2071 Points
Przeciętny AMD Ryzen AI Max+ PRO 395
  (n=1)
2071 Points 0%
Lenovo ThinkPad X1 Carbon Gen 13 21NS0010GE
Intel Core Ultra 7 258V
2046 Points -1%
Asus ExpertBook P5 P5405-NZ0102X
Intel Core Ultra 7 258V
1989 Points -4%
Asus Zenbook 14 OLED UM3406HA
AMD Ryzen 7 8840HS
1942 Points -6%
Lenovo Yoga 7 2-in-1 14AHP9 Arctic Grey
AMD Ryzen 5 8640HS
1877 Points -9%
HP ZBook Firefly 14 G11
Intel Core Ultra 7 165H
1781 Points -14%
Dell Precision 5000 5490
Intel Core Ultra 9 185H
1759 Points -15%
HWBOT x265 Benchmark v2.2 / 4k Preset
Asus ROG Flow Z13 GZ302EA-RU073W
AMD Ryzen AI Max+ 395
36.2 fps +10%
HP ZBook Ultra G1a 14
AMD Ryzen AI Max+ PRO 395
33 fps
Przeciętny AMD Ryzen AI Max+ PRO 395
  (n=1)
33 fps 0%
Xiaomi RedmiBook Pro 14 2025
Intel Core Ultra 7 255H
23.2 fps -30%
Asus VivoBook S 14 OLED M5406WA
AMD Ryzen AI 9 HX 370
21.3 fps -35%
Lenovo Yoga Pro 7 14ASP G9
AMD Ryzen AI 9 365
20.5 fps -38%
Dell Precision 5000 5490
Intel Core Ultra 9 185H
17.2 fps -48%
Asus Zenbook 14 OLED UM3406HA
AMD Ryzen 7 8840HS
17 fps -48%
Lenovo Yoga 7 2-in-1 14AHP9 Arctic Grey
AMD Ryzen 5 8640HS
14.5 fps -56%
HP ZBook Firefly 14 G11
Intel Core Ultra 7 165H
14.4 fps -56%
Asus ExpertBook P5 P5405-NZ0102X
Intel Core Ultra 7 258V
13.1 fps -60%
Lenovo ThinkPad X1 Carbon Gen 13 21NS0010GE
Intel Core Ultra 7 258V
12.6 fps -62%
LibreOffice / 20 Documents To PDF
Lenovo Yoga 7 2-in-1 14AHP9 Arctic Grey
AMD Ryzen 5 8640HS
69.6 s * -30%
Asus ExpertBook P5 P5405-NZ0102X
Intel Core Ultra 7 258V
56.4 s * -6%
HP ZBook Ultra G1a 14
AMD Ryzen AI Max+ PRO 395
53.4 s *
Przeciętny AMD Ryzen AI Max+ PRO 395
  (n=1)
53.4 s * -0%
Asus VivoBook S 14 OLED M5406WA
AMD Ryzen AI 9 HX 370
53.1 s * +1%
HP ZBook Firefly 14 G11
Intel Core Ultra 7 165H
51.2 s * +4%
Lenovo Yoga Pro 7 14ASP G9
AMD Ryzen AI 9 365
50.8 s * +5%
Asus Zenbook 14 OLED UM3406HA
AMD Ryzen 7 8840HS
47.8 s * +10%
Xiaomi RedmiBook Pro 14 2025
Intel Core Ultra 7 255H
47.7 s * +11%
Asus ROG Flow Z13 GZ302EA-RU073W
AMD Ryzen AI Max+ 395
45.8 s * +14%
Lenovo ThinkPad X1 Carbon Gen 13 21NS0010GE
Intel Core Ultra 7 258V
44.9 s * +16%
Dell Precision 5000 5490
Intel Core Ultra 9 185H
42.7 s * +20%
R Benchmark 2.5 / Overall mean
Lenovo Yoga 7 2-in-1 14AHP9 Arctic Grey
AMD Ryzen 5 8640HS
0.503 sec * -22%
Dell Precision 5000 5490
Intel Core Ultra 9 185H
0.4757 sec * -15%
HP ZBook Firefly 14 G11
Intel Core Ultra 7 165H
0.4565 sec * -11%
Asus Zenbook 14 OLED UM3406HA
AMD Ryzen 7 8840HS
0.4521 sec * -10%
Asus ExpertBook P5 P5405-NZ0102X
Intel Core Ultra 7 258V
0.4515 sec * -9%
Lenovo ThinkPad X1 Carbon Gen 13 21NS0010GE
Intel Core Ultra 7 258V
0.4457 sec * -8%
Xiaomi RedmiBook Pro 14 2025
Intel Core Ultra 7 255H
0.4378 sec * -6%
Lenovo Yoga Pro 7 14ASP G9
AMD Ryzen AI 9 365
0.4201 sec * -2%
Asus VivoBook S 14 OLED M5406WA
AMD Ryzen AI 9 HX 370
0.413 sec * -0%
HP ZBook Ultra G1a 14
AMD Ryzen AI Max+ PRO 395
0.4127 sec *
Przeciętny AMD Ryzen AI Max+ PRO 395
  (n=1)
0.4127 sec * -0%
Asus ROG Flow Z13 GZ302EA-RU073W
AMD Ryzen AI Max+ 395
0.3985 sec * +3%
CPU Performance Rating: Percent
Cinebench 2024: CPU Multi Core | CPU Single Core
Cinebench R23: Multi Core | Single Core
Cinebench R20: CPU (Multi Core) | CPU (Single Core)
Cinebench R15: CPU Multi 64Bit | CPU Single 64Bit
Blender: v2.79 BMW27 CPU
7-Zip 18.03: 7z b 4 | 7z b 4 -mmt1
Geekbench 6.4: Multi-Core | Single-Core
Geekbench 5.5: Multi-Core | Single-Core
HWBOT x265 Benchmark v2.2: 4k Preset
LibreOffice : 20 Documents To PDF
R Benchmark 2.5: Overall mean

* ... im mniej tym lepiej

Cinebench R15 CPU Multi 64Bit
4784 Points
Cinebench R15 OpenGL 64Bit
381 fps
Cinebench R15 Ref. Match 64Bit
97.9 %
Cinebench R15 CPU Single 64Bit
307 Points
Cinebench R20 CPU (Single Core)
783 Points
Cinebench R20 CPU (Multi Core)
11816 Points
Cinebench R23 Single Core
2003 Points
Cinebench R23 Multi Core
30706 Points
Cinebench 2024 CPU Single Core
112.2 Points
Cinebench 2024 CPU Multi Core
1643 Points
Pomoc
Performance Rating
HP ZBook Ultra G1a 14
AMD Ryzen AI Max+ PRO 395, Radeon RX 8060S
100 pt
Przeciętny AMD Ryzen AI Max+ PRO 395
 
100 pt
Dell Precision 5000 5490
Intel Core Ultra 9 185H, NVIDIA RTX 3000 Ada Generation Laptop GPU
43.5 pt
HP ZBook Firefly 14 G11
Intel Core Ultra 7 165H, RTX A500 Laptop GPU
34.2 pt
Asus ExpertBook P5 P5405-NZ0102X
Intel Core Ultra 7 258V, Arc 140V
31 pt
Lenovo ThinkPad X1 Carbon Gen 13 21NS0010GE
Intel Core Ultra 7 258V, Arc 140V
29.3 pt
AIDA64 / FP32 Ray-Trace
HP ZBook Ultra G1a 14
AMD Ryzen AI Max+ PRO 395, Radeon RX 8060S
61611 KRay/s
Przeciętny AMD Ryzen AI Max+ PRO 395
  (n=1)
61611 KRay/s 0%
Dell Precision 5000 5490
Intel Core Ultra 9 185H, NVIDIA RTX 3000 Ada Generation Laptop GPU
14212 KRay/s -77%
Asus ExpertBook P5 P5405-NZ0102X
Intel Core Ultra 7 258V, Arc 140V
12385 KRay/s -80%
HP ZBook Firefly 14 G11
Intel Core Ultra 7 165H, RTX A500 Laptop GPU
10658 KRay/s -83%
Lenovo ThinkPad X1 Carbon Gen 13 21NS0010GE
Intel Core Ultra 7 258V, Arc 140V
9391 KRay/s -85%
AIDA64 / FPU Julia
HP ZBook Ultra G1a 14
AMD Ryzen AI Max+ PRO 395, Radeon RX 8060S
183843 Points
Przeciętny AMD Ryzen AI Max+ PRO 395
  (n=1)
183843 Points 0%
Dell Precision 5000 5490
Intel Core Ultra 9 185H, NVIDIA RTX 3000 Ada Generation Laptop GPU
78977 Points -57%
Asus ExpertBook P5 P5405-NZ0102X
Intel Core Ultra 7 258V, Arc 140V
61997 Points -66%
Lenovo ThinkPad X1 Carbon Gen 13 21NS0010GE
Intel Core Ultra 7 258V, Arc 140V
59962 Points -67%
HP ZBook Firefly 14 G11
Intel Core Ultra 7 165H, RTX A500 Laptop GPU
56664 Points -69%
AIDA64 / CPU SHA3
HP ZBook Ultra G1a 14
AMD Ryzen AI Max+ PRO 395, Radeon RX 8060S
8341 MB/s
Przeciętny AMD Ryzen AI Max+ PRO 395
  (n=1)
8341 MB/s 0%
Dell Precision 5000 5490
Intel Core Ultra 9 185H, NVIDIA RTX 3000 Ada Generation Laptop GPU
3897 MB/s -53%
Asus ExpertBook P5 P5405-NZ0102X
Intel Core Ultra 7 258V, Arc 140V
2744 MB/s -67%
Lenovo ThinkPad X1 Carbon Gen 13 21NS0010GE
Intel Core Ultra 7 258V, Arc 140V
2673 MB/s -68%
HP ZBook Firefly 14 G11
Intel Core Ultra 7 165H, RTX A500 Laptop GPU
2608 MB/s -69%
AIDA64 / CPU Queen
HP ZBook Ultra G1a 14
AMD Ryzen AI Max+ PRO 395, Radeon RX 8060S
114210 Points
Przeciętny AMD Ryzen AI Max+ PRO 395
  (n=1)
114210 Points 0%
Dell Precision 5000 5490
Intel Core Ultra 9 185H, NVIDIA RTX 3000 Ada Generation Laptop GPU
94589 Points -17%
HP ZBook Firefly 14 G11
Intel Core Ultra 7 165H, RTX A500 Laptop GPU
85477 Points -25%
Asus ExpertBook P5 P5405-NZ0102X
Intel Core Ultra 7 258V, Arc 140V
49796 Points -56%
Lenovo ThinkPad X1 Carbon Gen 13 21NS0010GE
Intel Core Ultra 7 258V, Arc 140V
49773 Points -56%
AIDA64 / FPU SinJulia
HP ZBook Ultra G1a 14
AMD Ryzen AI Max+ PRO 395, Radeon RX 8060S
29343 Points
Przeciętny AMD Ryzen AI Max+ PRO 395
  (n=1)
29343 Points 0%
Dell Precision 5000 5490
Intel Core Ultra 9 185H, NVIDIA RTX 3000 Ada Generation Laptop GPU
10059 Points -66%
HP ZBook Firefly 14 G11
Intel Core Ultra 7 165H, RTX A500 Laptop GPU
8232 Points -72%
Asus ExpertBook P5 P5405-NZ0102X
Intel Core Ultra 7 258V, Arc 140V
4426 Points -85%
Lenovo ThinkPad X1 Carbon Gen 13 21NS0010GE
Intel Core Ultra 7 258V, Arc 140V
4103 Points -86%
AIDA64 / FPU Mandel
HP ZBook Ultra G1a 14
AMD Ryzen AI Max+ PRO 395, Radeon RX 8060S
97385 Points
Przeciętny AMD Ryzen AI Max+ PRO 395
  (n=1)
97385 Points 0%
Dell Precision 5000 5490
Intel Core Ultra 9 185H, NVIDIA RTX 3000 Ada Generation Laptop GPU
35965 Points -63%
Asus ExpertBook P5 P5405-NZ0102X
Intel Core Ultra 7 258V, Arc 140V
32495 Points -67%
Lenovo ThinkPad X1 Carbon Gen 13 21NS0010GE
Intel Core Ultra 7 258V, Arc 140V
31105 Points -68%
HP ZBook Firefly 14 G11
Intel Core Ultra 7 165H, RTX A500 Laptop GPU
27301 Points -72%
AIDA64 / CPU AES
HP ZBook Ultra G1a 14
AMD Ryzen AI Max+ PRO 395, Radeon RX 8060S
187841 MB/s
Przeciętny AMD Ryzen AI Max+ PRO 395
  (n=1)
187841 MB/s 0%
Dell Precision 5000 5490
Intel Core Ultra 9 185H, NVIDIA RTX 3000 Ada Generation Laptop GPU
75997 MB/s -60%
HP ZBook Firefly 14 G11
Intel Core Ultra 7 165H, RTX A500 Laptop GPU
56077 MB/s -70%
Asus ExpertBook P5 P5405-NZ0102X
Intel Core Ultra 7 258V, Arc 140V
40591 MB/s -78%
Lenovo ThinkPad X1 Carbon Gen 13 21NS0010GE
Intel Core Ultra 7 258V, Arc 140V
38451 MB/s -80%
AIDA64 / CPU ZLib
HP ZBook Ultra G1a 14
AMD Ryzen AI Max+ PRO 395, Radeon RX 8060S
2057 MB/s
Przeciętny AMD Ryzen AI Max+ PRO 395
  (n=1)
2057 MB/s 0%
Dell Precision 5000 5490
Intel Core Ultra 9 185H, NVIDIA RTX 3000 Ada Generation Laptop GPU
1036 MB/s -50%
HP ZBook Firefly 14 G11
Intel Core Ultra 7 165H, RTX A500 Laptop GPU
742 MB/s -64%
Asus ExpertBook P5 P5405-NZ0102X
Intel Core Ultra 7 258V, Arc 140V
625 MB/s -70%
Lenovo ThinkPad X1 Carbon Gen 13 21NS0010GE
Intel Core Ultra 7 258V, Arc 140V
618 MB/s -70%
AIDA64 / FP64 Ray-Trace
HP ZBook Ultra G1a 14
AMD Ryzen AI Max+ PRO 395, Radeon RX 8060S
32891 KRay/s
Przeciętny AMD Ryzen AI Max+ PRO 395
  (n=1)
32891 KRay/s 0%
Dell Precision 5000 5490
Intel Core Ultra 9 185H, NVIDIA RTX 3000 Ada Generation Laptop GPU
7430 KRay/s -77%
Asus ExpertBook P5 P5405-NZ0102X
Intel Core Ultra 7 258V, Arc 140V
6733 KRay/s -80%
HP ZBook Firefly 14 G11
Intel Core Ultra 7 165H, RTX A500 Laptop GPU
5580 KRay/s -83%
Lenovo ThinkPad X1 Carbon Gen 13 21NS0010GE
Intel Core Ultra 7 258V, Arc 140V
5039 KRay/s -85%
AIDA64 / CPU PhotoWorxx
HP ZBook Ultra G1a 14
AMD Ryzen AI Max+ PRO 395, Radeon RX 8060S
93684 MPixel/s
Przeciętny AMD Ryzen AI Max+ PRO 395
  (n=1)
93684 MPixel/s 0%
Asus ExpertBook P5 P5405-NZ0102X
Intel Core Ultra 7 258V, Arc 140V
54971 MPixel/s -41%
Lenovo ThinkPad X1 Carbon Gen 13 21NS0010GE
Intel Core Ultra 7 258V, Arc 140V
54425 MPixel/s -42%
Dell Precision 5000 5490
Intel Core Ultra 9 185H, NVIDIA RTX 3000 Ada Generation Laptop GPU
51637 MPixel/s -45%
HP ZBook Firefly 14 G11
Intel Core Ultra 7 165H, RTX A500 Laptop GPU
45710 MPixel/s -51%

Test warunków skrajnych

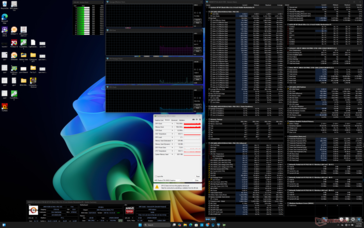
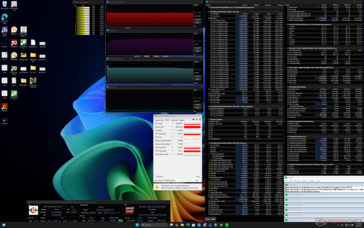
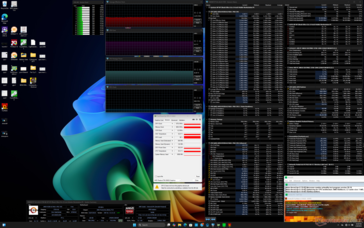
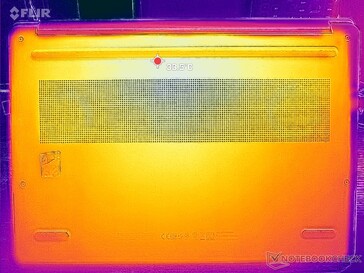
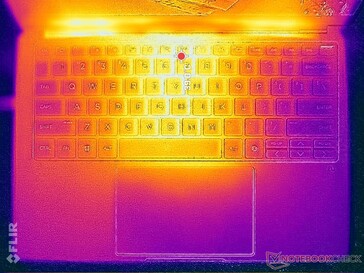
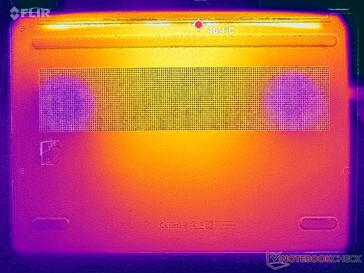
Podczas inicjowania obciążenia Prime95, procesor zwiększał taktowanie do 3,3 GHz i 81 W przez zaledwie kilka sekund, po czym spadał i stabilizował się na poziomie 3,1 GHz, 66 W i 71 C. Temperatura rdzenia osiągała szczyt na poziomie ~70 C podczas uruchamiania wymagających obciążeń, co jest niższe niż oczekiwano, biorąc pod uwagę stosunkowo wysoki pobór mocy i szybką wydajność w stosunku do rozmiaru.

System bezczynny
System bezczynny
Cyberpunk 2077 - stres
Stres Prime95
Stres Prime95
Stres Prime95+FurMark
Średnie taktowanie CPU (GHz) Taktowanie GPU (MHz) Średnia temperatura CPU (°C)
System bezczynności -- -- 37
Prime95 Stress 3.1 -- 71
Prime95 + FurMark Stress 2.2 670 61
Cyberpunk 2077 Stress 0.9 2107 64

Wydajność systemu

PCMark 10 Standard
PCMark 10 Standard
PCMark 10 / Score
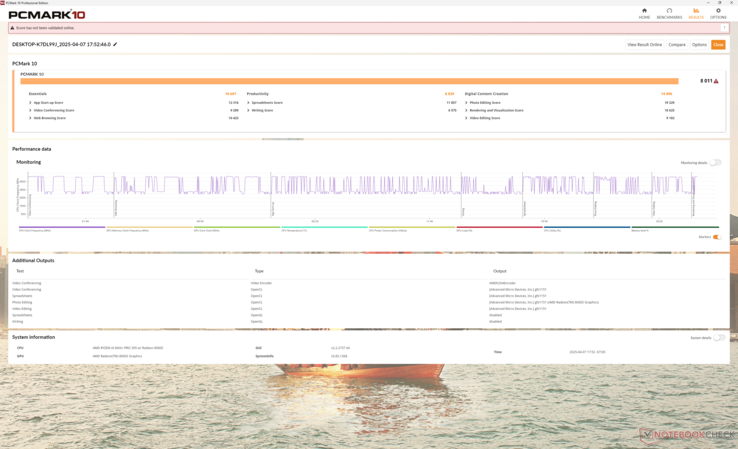
HP ZBook Ultra G1a 14
Radeon RX 8060S, Ryzen AI Max+ PRO 395, WDC PC SN810 2TB
8011 Points
Przeciętny AMD Ryzen AI Max+ PRO 395, AMD Radeon RX 8060S
  (n=1)
8011 Points 0%
Dell Precision 5000 5490
NVIDIA RTX 3000 Ada Generation Laptop GPU, Ultra 9 185H, Kioxia XG8 KXG80ZNV1T02
7383 Points -8%
Lenovo ThinkPad X1 Carbon Gen 13 21NS0010GE
Arc 140V, Core Ultra 7 258V, SK hynix PCB01 HFS001TFM9X179N GL
7066 Points -12%
Asus ExpertBook P5 P5405-NZ0102X
Arc 140V, Core Ultra 7 258V, Western Digital PC SN5000S SDEQNSJ-1T00
6737 Points -16%
HP ZBook Firefly 14 G11
RTX A500 Laptop GPU, Ultra 7 165H, Kioxia XG8 KXG80ZNV512G
6436 Points -20%
PCMark 10 / Essentials
Dell Precision 5000 5490
NVIDIA RTX 3000 Ada Generation Laptop GPU, Ultra 9 185H, Kioxia XG8 KXG80ZNV1T02
11137 Points +5%
HP ZBook Ultra G1a 14
Radeon RX 8060S, Ryzen AI Max+ PRO 395, WDC PC SN810 2TB
10607 Points
Przeciętny AMD Ryzen AI Max+ PRO 395, AMD Radeon RX 8060S
  (n=1)
10607 Points 0%
Lenovo ThinkPad X1 Carbon Gen 13 21NS0010GE
Arc 140V, Core Ultra 7 258V, SK hynix PCB01 HFS001TFM9X179N GL
10538 Points -1%
HP ZBook Firefly 14 G11
RTX A500 Laptop GPU, Ultra 7 165H, Kioxia XG8 KXG80ZNV512G
9883 Points -7%
Asus ExpertBook P5 P5405-NZ0102X
Arc 140V, Core Ultra 7 258V, Western Digital PC SN5000S SDEQNSJ-1T00
9568 Points -10%
PCMark 10 / Productivity
HP ZBook Firefly 14 G11
RTX A500 Laptop GPU, Ultra 7 165H, Kioxia XG8 KXG80ZNV512G
9453 Points +7%
Dell Precision 5000 5490
NVIDIA RTX 3000 Ada Generation Laptop GPU, Ultra 9 185H, Kioxia XG8 KXG80ZNV1T02
9153 Points +4%
Lenovo ThinkPad X1 Carbon Gen 13 21NS0010GE
Arc 140V, Core Ultra 7 258V, SK hynix PCB01 HFS001TFM9X179N GL
9079 Points +3%
Asus ExpertBook P5 P5405-NZ0102X
Arc 140V, Core Ultra 7 258V, Western Digital PC SN5000S SDEQNSJ-1T00
8876 Points +1%
HP ZBook Ultra G1a 14
Radeon RX 8060S, Ryzen AI Max+ PRO 395, WDC PC SN810 2TB
8829 Points
Przeciętny AMD Ryzen AI Max+ PRO 395, AMD Radeon RX 8060S
  (n=1)
8829 Points 0%
PCMark 10 / Digital Content Creation
HP ZBook Ultra G1a 14
Radeon RX 8060S, Ryzen AI Max+ PRO 395, WDC PC SN810 2TB
14896 Points
Przeciętny AMD Ryzen AI Max+ PRO 395, AMD Radeon RX 8060S
  (n=1)
14896 Points 0%
Dell Precision 5000 5490
NVIDIA RTX 3000 Ada Generation Laptop GPU, Ultra 9 185H, Kioxia XG8 KXG80ZNV1T02
10716 Points -28%
Lenovo ThinkPad X1 Carbon Gen 13 21NS0010GE
Arc 140V, Core Ultra 7 258V, SK hynix PCB01 HFS001TFM9X179N GL
10008 Points -33%
Asus ExpertBook P5 P5405-NZ0102X
Arc 140V, Core Ultra 7 258V, Western Digital PC SN5000S SDEQNSJ-1T00
9773 Points -34%
HP ZBook Firefly 14 G11
RTX A500 Laptop GPU, Ultra 7 165H, Kioxia XG8 KXG80ZNV512G
7744 Points -48%
CrossMark / Overall
Apple MacBook Pro 14 2024 M4 Pro
M4 Pro 20-Core GPU, M4 Pro (14 cores), Apple SSD AP2048Z
2162 Points +14%
HP ZBook Ultra G1a 14
Radeon RX 8060S, Ryzen AI Max+ PRO 395, WDC PC SN810 2TB
1892 Points
Przeciętny AMD Ryzen AI Max+ PRO 395, AMD Radeon RX 8060S
  (n=1)
1892 Points 0%
Dell Precision 5000 5490
NVIDIA RTX 3000 Ada Generation Laptop GPU, Ultra 9 185H, Kioxia XG8 KXG80ZNV1T02
1754 Points -7%
Lenovo ThinkPad X1 Carbon Gen 13 21NS0010GE
Arc 140V, Core Ultra 7 258V, SK hynix PCB01 HFS001TFM9X179N GL
1737 Points -8%
HP ZBook Firefly 14 G11
RTX A500 Laptop GPU, Ultra 7 165H, Kioxia XG8 KXG80ZNV512G
1692 Points -11%
Asus ExpertBook P5 P5405-NZ0102X
Arc 140V, Core Ultra 7 258V, Western Digital PC SN5000S SDEQNSJ-1T00
1670 Points -12%
CrossMark / Productivity
Apple MacBook Pro 14 2024 M4 Pro
M4 Pro 20-Core GPU, M4 Pro (14 cores), Apple SSD AP2048Z
2010 Points +24%
Lenovo ThinkPad X1 Carbon Gen 13 21NS0010GE
Arc 140V, Core Ultra 7 258V, SK hynix PCB01 HFS001TFM9X179N GL
1670 Points +3%
Dell Precision 5000 5490
NVIDIA RTX 3000 Ada Generation Laptop GPU, Ultra 9 185H, Kioxia XG8 KXG80ZNV1T02
1643 Points +1%
HP ZBook Ultra G1a 14
Radeon RX 8060S, Ryzen AI Max+ PRO 395, WDC PC SN810 2TB
1620 Points
Przeciętny AMD Ryzen AI Max+ PRO 395, AMD Radeon RX 8060S
  (n=1)
1620 Points 0%
Asus ExpertBook P5 P5405-NZ0102X
Arc 140V, Core Ultra 7 258V, Western Digital PC SN5000S SDEQNSJ-1T00
1615 Points 0%
HP ZBook Firefly 14 G11
RTX A500 Laptop GPU, Ultra 7 165H, Kioxia XG8 KXG80ZNV512G
1613 Points 0%
CrossMark / Creativity
Apple MacBook Pro 14 2024 M4 Pro
M4 Pro 20-Core GPU, M4 Pro (14 cores), Apple SSD AP2048Z
2594 Points +8%
HP ZBook Ultra G1a 14
Radeon RX 8060S, Ryzen AI Max+ PRO 395, WDC PC SN810 2TB
2412 Points
Przeciętny AMD Ryzen AI Max+ PRO 395, AMD Radeon RX 8060S
  (n=1)
2412 Points 0%
Dell Precision 5000 5490
NVIDIA RTX 3000 Ada Generation Laptop GPU, Ultra 9 185H, Kioxia XG8 KXG80ZNV1T02
2001 Points -17%
Lenovo ThinkPad X1 Carbon Gen 13 21NS0010GE
Arc 140V, Core Ultra 7 258V, SK hynix PCB01 HFS001TFM9X179N GL
1971 Points -18%
HP ZBook Firefly 14 G11
RTX A500 Laptop GPU, Ultra 7 165H, Kioxia XG8 KXG80ZNV512G
1905 Points -21%
Asus ExpertBook P5 P5405-NZ0102X
Arc 140V, Core Ultra 7 258V, Western Digital PC SN5000S SDEQNSJ-1T00
1876 Points -22%
CrossMark / Responsiveness
Apple MacBook Pro 14 2024 M4 Pro
M4 Pro 20-Core GPU, M4 Pro (14 cores), Apple SSD AP2048Z
1556 Points +7%
HP ZBook Ultra G1a 14
Radeon RX 8060S, Ryzen AI Max+ PRO 395, WDC PC SN810 2TB
1455 Points
Przeciętny AMD Ryzen AI Max+ PRO 395, AMD Radeon RX 8060S
  (n=1)
1455 Points 0%
Dell Precision 5000 5490
NVIDIA RTX 3000 Ada Generation Laptop GPU, Ultra 9 185H, Kioxia XG8 KXG80ZNV1T02
1438 Points -1%
HP ZBook Firefly 14 G11
RTX A500 Laptop GPU, Ultra 7 165H, Kioxia XG8 KXG80ZNV512G
1369 Points -6%
Lenovo ThinkPad X1 Carbon Gen 13 21NS0010GE
Arc 140V, Core Ultra 7 258V, SK hynix PCB01 HFS001TFM9X179N GL
1338 Points -8%
Asus ExpertBook P5 P5405-NZ0102X
Arc 140V, Core Ultra 7 258V, Western Digital PC SN5000S SDEQNSJ-1T00
1302 Points -11%
WebXPRT 3 / Overall
Apple MacBook Pro 14 2024 M4 Pro
M4 Pro 20-Core GPU, M4 Pro (14 cores), Apple SSD AP2048Z
545 Points +98%
HP ZBook Firefly 14 G11
RTX A500 Laptop GPU, Ultra 7 165H, Kioxia XG8 KXG80ZNV512G
291 Points +6%
Dell Precision 5000 5490
NVIDIA RTX 3000 Ada Generation Laptop GPU, Ultra 9 185H, Kioxia XG8 KXG80ZNV1T02
286 Points +4%
Asus ExpertBook P5 P5405-NZ0102X
Arc 140V, Core Ultra 7 258V, Western Digital PC SN5000S SDEQNSJ-1T00
279 Points +1%
HP ZBook Ultra G1a 14
Radeon RX 8060S, Ryzen AI Max+ PRO 395, WDC PC SN810 2TB
275 Points
Przeciętny AMD Ryzen AI Max+ PRO 395, AMD Radeon RX 8060S
  (n=1)
275 Points 0%
WebXPRT 4 / Overall
Apple MacBook Pro 14 2024 M4 Pro
M4 Pro 20-Core GPU, M4 Pro (14 cores), Apple SSD AP2048Z
353 Points +57%
Lenovo ThinkPad X1 Carbon Gen 13 21NS0010GE
Arc 140V, Core Ultra 7 258V, SK hynix PCB01 HFS001TFM9X179N GL
286 Points +27%
Dell Precision 5000 5490
NVIDIA RTX 3000 Ada Generation Laptop GPU, Ultra 9 185H, Kioxia XG8 KXG80ZNV1T02
268 Points +19%
Asus ExpertBook P5 P5405-NZ0102X
Arc 140V, Core Ultra 7 258V, Western Digital PC SN5000S SDEQNSJ-1T00
264 Points +17%
HP ZBook Firefly 14 G11
RTX A500 Laptop GPU, Ultra 7 165H, Kioxia XG8 KXG80ZNV512G
259 Points +15%
HP ZBook Ultra G1a 14
Radeon RX 8060S, Ryzen AI Max+ PRO 395, WDC PC SN810 2TB
225 Points
Przeciętny AMD Ryzen AI Max+ PRO 395, AMD Radeon RX 8060S
  (n=1)
225 Points 0%
Mozilla Kraken 1.1 / Total
Dell Precision 5000 5490
NVIDIA RTX 3000 Ada Generation Laptop GPU, Ultra 9 185H, Kioxia XG8 KXG80ZNV1T02
522 ms * -21%
HP ZBook Firefly 14 G11
RTX A500 Laptop GPU, Ultra 7 165H, Kioxia XG8 KXG80ZNV512G
521 ms * -20%
Asus ExpertBook P5 P5405-NZ0102X
Arc 140V, Core Ultra 7 258V, Western Digital PC SN5000S SDEQNSJ-1T00
516 ms * -19%
Lenovo ThinkPad X1 Carbon Gen 13 21NS0010GE
Arc 140V, Core Ultra 7 258V, SK hynix PCB01 HFS001TFM9X179N GL
468 ms * -8%
HP ZBook Ultra G1a 14
Radeon RX 8060S, Ryzen AI Max+ PRO 395, WDC PC SN810 2TB
433 ms *
Przeciętny AMD Ryzen AI Max+ PRO 395, AMD Radeon RX 8060S
  (n=1)
433 ms * -0%
Apple MacBook Pro 14 2024 M4 Pro
M4 Pro 20-Core GPU, M4 Pro (14 cores), Apple SSD AP2048Z
254.5 ms * +41%

* ... im mniej tym lepiej

PCMark 10 Score
8011 pkt.
Pomoc
AIDA64 / Memory Copy
HP ZBook Ultra G1a 14
AMD Ryzen AI Max+ PRO 395, Radeon RX 8060S
158632 MB/s
Przeciętny AMD Ryzen AI Max+ PRO 395
  (n=1)
158632 MB/s 0%
Asus ExpertBook P5 P5405-NZ0102X
Intel Core Ultra 7 258V, Arc 140V
108783 MB/s -31%
Lenovo ThinkPad X1 Carbon Gen 13 21NS0010GE
Intel Core Ultra 7 258V, Arc 140V
108487 MB/s -32%
Dell Precision 5000 5490
Intel Core Ultra 9 185H, NVIDIA RTX 3000 Ada Generation Laptop GPU
95718 MB/s -40%
HP ZBook Firefly 14 G11
Intel Core Ultra 7 165H, RTX A500 Laptop GPU
72539 MB/s -54%
AIDA64 / Memory Read
HP ZBook Ultra G1a 14
AMD Ryzen AI Max+ PRO 395, Radeon RX 8060S
121177 MB/s
Przeciętny AMD Ryzen AI Max+ PRO 395
  (n=1)
121177 MB/s 0%
Asus ExpertBook P5 P5405-NZ0102X
Intel Core Ultra 7 258V, Arc 140V
89204 MB/s -26%
Lenovo ThinkPad X1 Carbon Gen 13 21NS0010GE
Intel Core Ultra 7 258V, Arc 140V
87564 MB/s -28%
Dell Precision 5000 5490
Intel Core Ultra 9 185H, NVIDIA RTX 3000 Ada Generation Laptop GPU
85570 MB/s -29%
HP ZBook Firefly 14 G11
Intel Core Ultra 7 165H, RTX A500 Laptop GPU
76520 MB/s -37%
AIDA64 / Memory Write
HP ZBook Ultra G1a 14
AMD Ryzen AI Max+ PRO 395, Radeon RX 8060S
212172 MB/s
Przeciętny AMD Ryzen AI Max+ PRO 395
  (n=1)
212172 MB/s 0%
Asus ExpertBook P5 P5405-NZ0102X
Intel Core Ultra 7 258V, Arc 140V
117935 MB/s -44%
Lenovo ThinkPad X1 Carbon Gen 13 21NS0010GE
Intel Core Ultra 7 258V, Arc 140V
117898 MB/s -44%
Dell Precision 5000 5490
Intel Core Ultra 9 185H, NVIDIA RTX 3000 Ada Generation Laptop GPU
93871 MB/s -56%
HP ZBook Firefly 14 G11
Intel Core Ultra 7 165H, RTX A500 Laptop GPU
72057 MB/s -66%
AIDA64 / Memory Latency
HP ZBook Ultra G1a 14
AMD Ryzen AI Max+ PRO 395, Radeon RX 8060S
165.2 ns *
Przeciętny AMD Ryzen AI Max+ PRO 395
  (n=1)
165.2 ns * -0%
Dell Precision 5000 5490
Intel Core Ultra 9 185H, NVIDIA RTX 3000 Ada Generation Laptop GPU
139.3 ns * +16%
HP ZBook Firefly 14 G11
Intel Core Ultra 7 165H, RTX A500 Laptop GPU
120.8 ns * +27%
Lenovo ThinkPad X1 Carbon Gen 13 21NS0010GE
Intel Core Ultra 7 258V, Arc 140V
96.4 ns * +42%
Asus ExpertBook P5 P5405-NZ0102X
Intel Core Ultra 7 258V, Arc 140V
95.2 ns * +42%

* ... im mniej tym lepiej

Opóźnienie DPC

LatencyMon pokazuje tylko niewielkie problemy z DPC podczas otwierania wielu kart przeglądarki na naszej stronie głównej. odtwarzanie wideo 4K przy 60 FPS jest płynne i nie odnotowano żadnych spadków klatek.

Co ciekawe, problem pojawia się podczas odtwarzania treści 4K60, gdy jednocześnie uruchomiony jest LatencyMon. Liczba spadających klatek gwałtownie wzrosła, a system stał się powolny, pozornie bez powodu. Zatrzymanie LatencyMon rozwiązuje ten problem. Program zgłasza potencjalny problem związany z jądrem DirectX, gdy zaczynają się zacinać.

Urządzenia pamięci masowej

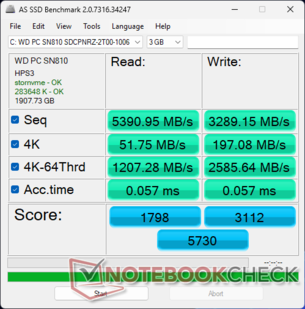
WD SN810 WD SN810 PCIe4 NVMe SSD w ZBook Ultra G1a 14 nie cierpi na żadne z tych samych problemów z dławieniem wydajności, które zaobserwowaliśmy w HP ZBook Firefly 14 G11.

CDM 8
CDM 8
AS SSD
AS SSD
WDC PC SN810 2TB
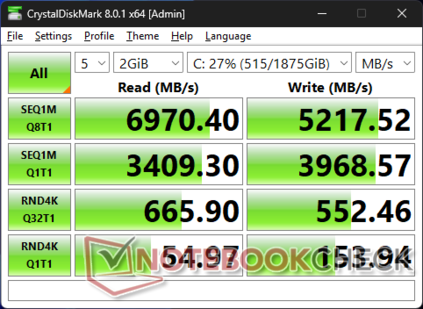
CDM 5/6 Read Seq Q32T1: 6956 MB/s
CDM 5/6 Write Seq Q32T1: 5232 MB/s
CDM 5/6 Read 4K Q32T1: 664.5 MB/s
CDM 5/6 Write 4K Q32T1: 546.6 MB/s
CDM 5 Read Seq: 3382 MB/s
CDM 5 Write Seq: 3966 MB/s
CDM 5/6 Read 4K: 55.06 MB/s
CDM 5/6 Write 4K: 152.4 MB/s
Drive Performance Rating - Percent
HP ZBook Ultra G1a 14
WDC PC SN810 2TB
81.2 pt
Lenovo ThinkPad X1 Carbon Gen 13 21NS0010GE
SK hynix PCB01 HFS001TFM9X179N GL
76.7 pt
Dell Precision 5000 5490
Kioxia XG8 KXG80ZNV1T02
66.8 pt
HP ZBook Firefly 14 G11
Kioxia XG8 KXG80ZNV512G
60.3 pt
Asus ExpertBook P5 P5405-NZ0102X
Western Digital PC SN5000S SDEQNSJ-1T00
59.3 pt
DiskSpd
seq read
Lenovo ThinkPad X1 Carbon Gen 13 21NS0010GE
SK hynix PCB01 HFS001TFM9X179N GL
4852 (4741.87min - 4852.18max) MB/s +45%
Dell Precision 5000 5490
Kioxia XG8 KXG80ZNV1T02
3464 (3418.44min - 3463.86max) MB/s +3%
HP ZBook Ultra G1a 14
WDC PC SN810 2TB
3352 (3235.49min - 3352.09max) MB/s
HP ZBook Firefly 14 G11
Kioxia XG8 KXG80ZNV512G
3274 (3257.69min - 3274.12max) MB/s -2%
Asus ExpertBook P5 P5405-NZ0102X
Western Digital PC SN5000S SDEQNSJ-1T00
2314 (2161.53min - 2314.19max) MB/s -31%
seq write
HP ZBook Ultra G1a 14
WDC PC SN810 2TB
3998 (3691.2min - 3997.57max) MB/s
Dell Precision 5000 5490
Kioxia XG8 KXG80ZNV1T02
3307 (3062.26min - 3306.79max) MB/s -17%
HP ZBook Firefly 14 G11
Kioxia XG8 KXG80ZNV512G
3180 (3105.96min - 3180.05max) MB/s -20%
Lenovo ThinkPad X1 Carbon Gen 13 21NS0010GE
SK hynix PCB01 HFS001TFM9X179N GL
2903 (2667.07min - 2902.53max) MB/s -27%
Asus ExpertBook P5 P5405-NZ0102X
Western Digital PC SN5000S SDEQNSJ-1T00
2590 (842.64min - 2590.19max) MB/s -35%
seq q8 t1 read
Lenovo ThinkPad X1 Carbon Gen 13 21NS0010GE
SK hynix PCB01 HFS001TFM9X179N GL
13544 (11522.4min - 13543.6max) MB/s +94%
HP ZBook Ultra G1a 14
WDC PC SN810 2TB
6974 (6195.18min - 6973.56max) MB/s
Dell Precision 5000 5490
Kioxia XG8 KXG80ZNV1T02
6958 (5976.88min - 6957.93max) MB/s 0%
HP ZBook Firefly 14 G11
Kioxia XG8 KXG80ZNV512G
6727 (5879.79min - 6727.24max) MB/s -4%
Asus ExpertBook P5 P5405-NZ0102X
Western Digital PC SN5000S SDEQNSJ-1T00
6295 (5433.68min - 6295.02max) MB/s -10%
seq q8 t1 write
Lenovo ThinkPad X1 Carbon Gen 13 21NS0010GE
SK hynix PCB01 HFS001TFM9X179N GL
9702 (9619.22min - 9702.05max) MB/s +93%
Dell Precision 5000 5490
Kioxia XG8 KXG80ZNV1T02
5528 (5383.39min - 5527.88max) MB/s +10%
Asus ExpertBook P5 P5405-NZ0102X
Western Digital PC SN5000S SDEQNSJ-1T00
5192 (219.34min - 5191.71max) MB/s +3%
HP ZBook Ultra G1a 14
WDC PC SN810 2TB
5025 (4956.2min - 5024.78max) MB/s
HP ZBook Firefly 14 G11
Kioxia XG8 KXG80ZNV512G
4479 (4223.19min - 4479.16max) MB/s -11%
4k q1 t1 read
Lenovo ThinkPad X1 Carbon Gen 13 21NS0010GE
SK hynix PCB01 HFS001TFM9X179N GL
75.4 (65.76min - 75.41max) MB/s +28%
Asus ExpertBook P5 P5405-NZ0102X
Western Digital PC SN5000S SDEQNSJ-1T00
68.2 (55.96min - 68.23max) MB/s +16%
HP ZBook Ultra G1a 14
WDC PC SN810 2TB
58.7 (56.42min - 58.7max) MB/s
HP ZBook Firefly 14 G11
Kioxia XG8 KXG80ZNV512G
55.6 (54.58min - 55.62max) MB/s -5%
Dell Precision 5000 5490
Kioxia XG8 KXG80ZNV1T02
54.9 (54.52min - 54.94max) MB/s -6%
4k q1 t1 write
HP ZBook Ultra G1a 14
WDC PC SN810 2TB
165.1 (140.72min - 165.08max) MB/s
Lenovo ThinkPad X1 Carbon Gen 13 21NS0010GE
SK hynix PCB01 HFS001TFM9X179N GL
131 (107.88min - 130.98max) MB/s -21%
HP ZBook Firefly 14 G11
Kioxia XG8 KXG80ZNV512G
127.5 (126.25min - 127.51max) MB/s -23%
Dell Precision 5000 5490
Kioxia XG8 KXG80ZNV1T02
126.2 (123.81min - 126.16max) MB/s -24%
Asus ExpertBook P5 P5405-NZ0102X
Western Digital PC SN5000S SDEQNSJ-1T00
116.6 (111.93min - 116.57max) MB/s -29%
4k q32 t16 read
HP ZBook Ultra G1a 14
WDC PC SN810 2TB
1247 (1208.78min - 1246.91max) MB/s
HP ZBook Firefly 14 G11
Kioxia XG8 KXG80ZNV512G
792 (667.35min - 791.92max) MB/s -36%
Asus ExpertBook P5 P5405-NZ0102X
Western Digital PC SN5000S SDEQNSJ-1T00
731 (706.41min - 730.68max) MB/s -41%
Lenovo ThinkPad X1 Carbon Gen 13 21NS0010GE
SK hynix PCB01 HFS001TFM9X179N GL
636 (594.4min - 636.18max) MB/s -49%
Dell Precision 5000 5490
Kioxia XG8 KXG80ZNV1T02
561 (558.39min - 560.89max) MB/s -55%
4k q32 t16 write
HP ZBook Ultra G1a 14
WDC PC SN810 2TB
561 (514.69min - 560.6max) MB/s
Dell Precision 5000 5490
Kioxia XG8 KXG80ZNV1T02
402 (391.12min - 401.87max) MB/s -28%
HP ZBook Firefly 14 G11
Kioxia XG8 KXG80ZNV512G
401 (385.71min - 401.18max) MB/s -29%
Lenovo ThinkPad X1 Carbon Gen 13 21NS0010GE
SK hynix PCB01 HFS001TFM9X179N GL
398 (374.24min - 397.8max) MB/s -29%
Asus ExpertBook P5 P5405-NZ0102X
Western Digital PC SN5000S SDEQNSJ-1T00
378 (330.07min - 378.23max) MB/s -33%
AS SSD
Score Total
HP ZBook Ultra G1a 14
WDC PC SN810 2TB
5730 Points
Dell Precision 5000 5490
Kioxia XG8 KXG80ZNV1T02
4800 Points -16%
Lenovo ThinkPad X1 Carbon Gen 13 21NS0010GE
SK hynix PCB01 HFS001TFM9X179N GL
4024 Points -30%
HP ZBook Firefly 14 G11
Kioxia XG8 KXG80ZNV512G
3541 Points -38%
Asus ExpertBook P5 P5405-NZ0102X
Western Digital PC SN5000S SDEQNSJ-1T00
3428 Points -40%
Score Read
HP ZBook Ultra G1a 14
WDC PC SN810 2TB
1798 Points
Lenovo ThinkPad X1 Carbon Gen 13 21NS0010GE
SK hynix PCB01 HFS001TFM9X179N GL
1476 Points -18%
HP ZBook Firefly 14 G11
Kioxia XG8 KXG80ZNV512G
1383 Points -23%
Dell Precision 5000 5490
Kioxia XG8 KXG80ZNV1T02
1368 Points -24%
Asus ExpertBook P5 P5405-NZ0102X
Western Digital PC SN5000S SDEQNSJ-1T00
1227 Points -32%
Score Write
HP ZBook Ultra G1a 14
WDC PC SN810 2TB
3112 Points
Dell Precision 5000 5490
Kioxia XG8 KXG80ZNV1T02
2830 Points -9%
Lenovo ThinkPad X1 Carbon Gen 13 21NS0010GE
SK hynix PCB01 HFS001TFM9X179N GL
1926 Points -38%
Asus ExpertBook P5 P5405-NZ0102X
Western Digital PC SN5000S SDEQNSJ-1T00
1628 Points -48%
HP ZBook Firefly 14 G11
Kioxia XG8 KXG80ZNV512G
1585 Points -49%
Seq Read
Lenovo ThinkPad X1 Carbon Gen 13 21NS0010GE
SK hynix PCB01 HFS001TFM9X179N GL
8075 MB/s +50%
HP ZBook Firefly 14 G11
Kioxia XG8 KXG80ZNV512G
6478.84 MB/s +20%
HP ZBook Ultra G1a 14
WDC PC SN810 2TB
5390.95 MB/s
Dell Precision 5000 5490
Kioxia XG8 KXG80ZNV1T02
5384.34 MB/s 0%
Asus ExpertBook P5 P5405-NZ0102X
Western Digital PC SN5000S SDEQNSJ-1T00
4862 MB/s -10%
Seq Write
Lenovo ThinkPad X1 Carbon Gen 13 21NS0010GE
SK hynix PCB01 HFS001TFM9X179N GL
5120 MB/s +56%
Asus ExpertBook P5 P5405-NZ0102X
Western Digital PC SN5000S SDEQNSJ-1T00
3434 MB/s +4%
HP ZBook Ultra G1a 14
WDC PC SN810 2TB
3289.15 MB/s
Dell Precision 5000 5490
Kioxia XG8 KXG80ZNV1T02
3168.84 MB/s -4%
HP ZBook Firefly 14 G11
Kioxia XG8 KXG80ZNV512G
2556.96 MB/s -22%
4K Read
Lenovo ThinkPad X1 Carbon Gen 13 21NS0010GE
SK hynix PCB01 HFS001TFM9X179N GL
66.1 MB/s +28%
Asus ExpertBook P5 P5405-NZ0102X
Western Digital PC SN5000S SDEQNSJ-1T00
61.6 MB/s +19%
Dell Precision 5000 5490
Kioxia XG8 KXG80ZNV1T02
56.84 MB/s +10%
HP ZBook Firefly 14 G11
Kioxia XG8 KXG80ZNV512G
53.62 MB/s +4%
HP ZBook Ultra G1a 14
WDC PC SN810 2TB
51.75 MB/s
4K Write
HP ZBook Ultra G1a 14
WDC PC SN810 2TB
197.08 MB/s
Dell Precision 5000 5490
Kioxia XG8 KXG80ZNV1T02
164.98 MB/s -16%
HP ZBook Firefly 14 G11
Kioxia XG8 KXG80ZNV512G
156.47 MB/s -21%
Lenovo ThinkPad X1 Carbon Gen 13 21NS0010GE
SK hynix PCB01 HFS001TFM9X179N GL
130.5 MB/s -34%
Asus ExpertBook P5 P5405-NZ0102X
Western Digital PC SN5000S SDEQNSJ-1T00
123.4 MB/s -37%
4K-64 Read
HP ZBook Ultra G1a 14
WDC PC SN810 2TB
1207.28 MB/s
HP ZBook Firefly 14 G11
Kioxia XG8 KXG80ZNV512G
781.85 MB/s -35%
Dell Precision 5000 5490
Kioxia XG8 KXG80ZNV1T02
772.81 MB/s -36%
Asus ExpertBook P5 P5405-NZ0102X
Western Digital PC SN5000S SDEQNSJ-1T00
679 MB/s -44%
Lenovo ThinkPad X1 Carbon Gen 13 21NS0010GE
SK hynix PCB01 HFS001TFM9X179N GL
602 MB/s -50%
4K-64 Write
HP ZBook Ultra G1a 14
WDC PC SN810 2TB
2585.64 MB/s
Dell Precision 5000 5490
Kioxia XG8 KXG80ZNV1T02
2347.92 MB/s -9%
Lenovo ThinkPad X1 Carbon Gen 13 21NS0010GE
SK hynix PCB01 HFS001TFM9X179N GL
1283 MB/s -50%
HP ZBook Firefly 14 G11
Kioxia XG8 KXG80ZNV512G
1173.04 MB/s -55%
Asus ExpertBook P5 P5405-NZ0102X
Western Digital PC SN5000S SDEQNSJ-1T00
1162 MB/s -55%
Access Time Read
Asus ExpertBook P5 P5405-NZ0102X
Western Digital PC SN5000S SDEQNSJ-1T00
0.121 ms * -112%
Dell Precision 5000 5490
Kioxia XG8 KXG80ZNV1T02
0.092 ms * -61%
HP ZBook Firefly 14 G11
Kioxia XG8 KXG80ZNV512G
0.09 ms * -58%
Lenovo ThinkPad X1 Carbon Gen 13 21NS0010GE
SK hynix PCB01 HFS001TFM9X179N GL
0.072 ms * -26%
HP ZBook Ultra G1a 14
WDC PC SN810 2TB
0.057 ms *
Access Time Write
HP ZBook Firefly 14 G11
Kioxia XG8 KXG80ZNV512G
0.082 ms * -44%
Dell Precision 5000 5490
Kioxia XG8 KXG80ZNV1T02
0.071 ms * -25%
HP ZBook Ultra G1a 14
WDC PC SN810 2TB
0.057 ms *
Asus ExpertBook P5 P5405-NZ0102X
Western Digital PC SN5000S SDEQNSJ-1T00
0.031 ms * +46%
Lenovo ThinkPad X1 Carbon Gen 13 21NS0010GE
SK hynix PCB01 HFS001TFM9X179N GL
0.03 ms * +47%

* ... im mniej tym lepiej

Disk Throttling: DiskSpd Read Loop, Queue Depth 8

035070010501400175021002450280031503500385042004550490052505600595063006650Tooltip
HP ZBook Ultra G1a 14 WDC PC SN810 2TB; diskspd 2.0.17 f: Ø6956 (6211.18-6975.13)
HP ZBook Firefly 14 G11 Kioxia XG8 KXG80ZNV512G; diskspd 2.0.17 f: Ø4138 (3670.23-6579.76)

Wydajność GPU

Karta graficzna Radeon RX 8060S plasuje się pomiędzy dyskretnymi RTX 3000 Ada i RTX 4000 Ada pod względem surowego potencjału graficznego. Biorąc pod uwagę, że rozwiązanie AMD jest zintegrowane, jest to spore osiągnięcie, zwłaszcza z perspektywy wydajności na objętość lub wydajności na wat. O ile nam wiadomo, obecnie nie ma większych 14-calowych stacji roboczych z opcjami RTX 4000 Ada, co potwierdza twierdzenie HP o "najszybszej na świecie 14-calowej stacji roboczej".

Profil zasilaniaWynik grafikiWynik fizykiŁączny wynik
Tryb wydajności276593255910555
Tryb zrównoważony25972 (-6%)31510 (-3%)9739 (-8%)
Zasilanie bateryjne20915 (-24%)25705 (-21%)6915 (-35%)

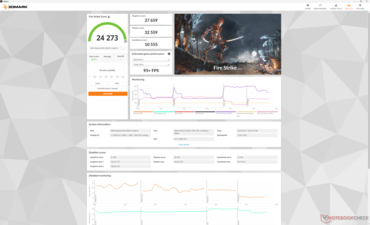
Niestety, wydajność spada nawet o 25 do 35 procent w przypadku pracy na zasilaniu bateryjnym, nawet przy ustawieniu trybu wysokiej wydajności, zgodnie z naszymi wynikami Fire Strike w powyższej tabeli.

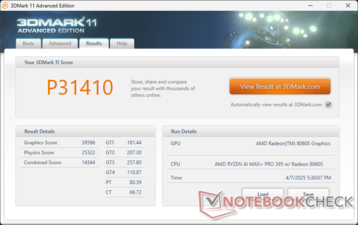
3DMark 11
3DMark 11
Fire Strike
Fire Strike
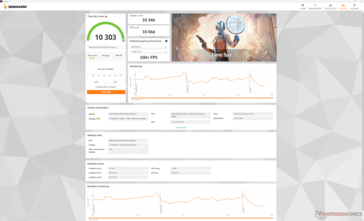
Time Spy
Time Spy
Speed Way
Speed Way
3DMark Performance Rating - Percent
Lenovo ThinkPad P16 Gen 2 -1!
NVIDIA RTX 4000 Ada Generation Laptop GPU, Intel Core i7-14700HX
96.8 pt
HP ZBook Ultra G1a 14
AMD Radeon RX 8060S, AMD Ryzen AI Max+ PRO 395
75.2 pt
Przeciętny AMD Radeon RX 8060S
 
75.1 pt
Asus ROG Flow Z13 GZ302EA-RU073W -26!
AMD Radeon RX 8060S, AMD Ryzen AI Max+ 395
67.2 pt
Dell Precision 5000 5490
NVIDIA RTX 3000 Ada Generation Laptop GPU, Intel Core Ultra 9 185H
56.1 pt
Asus VivoBook S 14 OLED M5406WA -25!
AMD Radeon 890M, AMD Ryzen AI 9 HX 370
28.5 pt
Lenovo Yoga Pro 7 14ASP G9 -25!
AMD Radeon 880M, AMD Ryzen AI 9 365
27.5 pt
HP ZBook Firefly 14 G11
NVIDIA RTX A500 Laptop GPU, Intel Core Ultra 7 165H
25.7 pt
HP EliteBook x360 1040 G11 -25!
Intel Arc 8-Core iGPU, Intel Core Ultra 7 165H
24.2 pt
Xiaomi RedmiBook Pro 14 2025 -26!
Intel Arc Graphics 140T, Intel Core Ultra 7 255H
24 pt
Lenovo ThinkPad X1 Carbon Gen 13 21NS0010GE -26!
Intel Arc Graphics 140V, Intel Core Ultra 7 258V
23.4 pt
Asus ExpertBook P5 P5405-NZ0102X -26!
Intel Arc Graphics 140V, Intel Core Ultra 7 258V
22.7 pt
Asus Zenbook 14 OLED UM3406HA -26!
AMD Radeon 780M, AMD Ryzen 7 8840HS
20.8 pt
Lenovo Yoga 7 2-in-1 14AHP9 Arctic Grey -25!
AMD Radeon 760M, AMD Ryzen 5 8640HS
19.8 pt
3DMark 11 - 1280x720 Performance GPU
Lenovo ThinkPad P16 Gen 2
NVIDIA RTX 4000 Ada Generation Laptop GPU, Intel Core i7-14700HX
54921 Points +39%
Asus ROG Flow Z13 GZ302EA-RU073W
AMD Radeon RX 8060S, AMD Ryzen AI Max+ 395
40732 Points +3%
Przeciętny AMD Radeon RX 8060S
  (39596 - 40732, n=2)
40164 Points +1%
HP ZBook Ultra G1a 14
AMD Radeon RX 8060S, AMD Ryzen AI Max+ PRO 395
39596 Points
Dell Precision 5000 5490
NVIDIA RTX 3000 Ada Generation Laptop GPU, Intel Core Ultra 9 185H
28283 Points -29%
Asus VivoBook S 14 OLED M5406WA
AMD Radeon 890M, AMD Ryzen AI 9 HX 370
16296 Points -59%
Lenovo Yoga Pro 7 14ASP G9
AMD Radeon 880M, AMD Ryzen AI 9 365
15589 Points -61%
Asus Zenbook 14 OLED UM3406HA
AMD Radeon 780M, AMD Ryzen 7 8840HS
12999 Points -67%
Xiaomi RedmiBook Pro 14 2025
Intel Arc Graphics 140T, Intel Core Ultra 7 255H
12566 Points -68%
HP EliteBook x360 1040 G11
Intel Arc 8-Core iGPU, Intel Core Ultra 7 165H
12457 Points -69%
Lenovo ThinkPad X1 Carbon Gen 13 21NS0010GE
Intel Arc Graphics 140V, Intel Core Ultra 7 258V
11335 Points -71%
HP ZBook Firefly 14 G11
NVIDIA RTX A500 Laptop GPU, Intel Core Ultra 7 165H
10888 Points -73%
Asus ExpertBook P5 P5405-NZ0102X
Intel Arc Graphics 140V, Intel Core Ultra 7 258V
10688 Points -73%
Lenovo Yoga 7 2-in-1 14AHP9 Arctic Grey
AMD Radeon 760M, AMD Ryzen 5 8640HS
10436 Points -74%
3DMark
1280x720 Cloud Gate Standard Graphics
Lenovo ThinkPad P16 Gen 2
NVIDIA RTX 4000 Ada Generation Laptop GPU, Intel Core i7-14700HX
152418 Points +3%
HP ZBook Ultra G1a 14
AMD Radeon RX 8060S, AMD Ryzen AI Max+ PRO 395
148182 Points
Przeciętny AMD Radeon RX 8060S
  (n=1)
148182 Points 0%
Dell Precision 5000 5490
NVIDIA RTX 3000 Ada Generation Laptop GPU, Intel Core Ultra 9 185H
82612 Points -44%
Asus VivoBook S 14 OLED M5406WA
AMD Radeon 890M, AMD Ryzen AI 9 HX 370
58319 Points -61%
Lenovo Yoga Pro 7 14ASP G9
AMD Radeon 880M, AMD Ryzen AI 9 365
56969 Points -62%
HP ZBook Firefly 14 G11
NVIDIA RTX A500 Laptop GPU, Intel Core Ultra 7 165H
46927 Points -68%
HP EliteBook x360 1040 G11
Intel Arc 8-Core iGPU, Intel Core Ultra 7 165H
46871 Points -68%
Lenovo Yoga 7 2-in-1 14AHP9 Arctic Grey
AMD Radeon 760M, AMD Ryzen 5 8640HS
41859 Points -72%
1920x1080 Fire Strike Graphics
Lenovo ThinkPad P16 Gen 2
NVIDIA RTX 4000 Ada Generation Laptop GPU, Intel Core i7-14700HX
40179 Points +45%
HP ZBook Ultra G1a 14
AMD Radeon RX 8060S, AMD Ryzen AI Max+ PRO 395
27659 Points
Przeciętny AMD Radeon RX 8060S
  (25992 - 27659, n=2)
26826 Points -3%
Asus ROG Flow Z13 GZ302EA-RU073W
AMD Radeon RX 8060S, AMD Ryzen AI Max+ 395
25992 Points -6%
Dell Precision 5000 5490
NVIDIA RTX 3000 Ada Generation Laptop GPU, Intel Core Ultra 9 185H
20233 Points -27%
Lenovo ThinkPad X1 Carbon Gen 13 21NS0010GE
Intel Arc Graphics 140V, Intel Core Ultra 7 258V
9930 Points -64%
Asus VivoBook S 14 OLED M5406WA
AMD Radeon 890M, AMD Ryzen AI 9 HX 370
9524 Points -66%
Lenovo Yoga Pro 7 14ASP G9
AMD Radeon 880M, AMD Ryzen AI 9 365
9388 Points -66%
Asus ExpertBook P5 P5405-NZ0102X
Intel Arc Graphics 140V, Intel Core Ultra 7 258V
9375 Points -66%
Xiaomi RedmiBook Pro 14 2025
Intel Arc Graphics 140T, Intel Core Ultra 7 255H
9328 Points -66%
HP EliteBook x360 1040 G11
Intel Arc 8-Core iGPU, Intel Core Ultra 7 165H
8961 Points -68%
Asus Zenbook 14 OLED UM3406HA
AMD Radeon 780M, AMD Ryzen 7 8840HS
8441 Points -69%
HP ZBook Firefly 14 G11
NVIDIA RTX A500 Laptop GPU, Intel Core Ultra 7 165H
7578 Points -73%
Lenovo Yoga 7 2-in-1 14AHP9 Arctic Grey
AMD Radeon 760M, AMD Ryzen 5 8640HS
7004 Points -75%
2560x1440 Time Spy Graphics
Lenovo ThinkPad P16 Gen 2
NVIDIA RTX 4000 Ada Generation Laptop GPU, Intel Core i7-14700HX
16308 Points +58%
HP ZBook Ultra G1a 14
AMD Radeon RX 8060S, AMD Ryzen AI Max+ PRO 395
10346 Points
Przeciętny AMD Radeon RX 8060S
  (10224 - 10346, n=2)
10285 Points -1%
Asus ROG Flow Z13 GZ302EA-RU073W
AMD Radeon RX 8060S, AMD Ryzen AI Max+ 395
10224 Points -1%
Dell Precision 5000 5490
NVIDIA RTX 3000 Ada Generation Laptop GPU, Intel Core Ultra 9 185H
7959 Points -23%
Xiaomi RedmiBook Pro 14 2025
Intel Arc Graphics 140T, Intel Core Ultra 7 255H
4212 Points -59%
Asus ExpertBook P5 P5405-NZ0102X
Intel Arc Graphics 140V, Intel Core Ultra 7 258V
4109 Points -60%
Lenovo ThinkPad X1 Carbon Gen 13 21NS0010GE
Intel Arc Graphics 140V, Intel Core Ultra 7 258V
4028 Points -61%
Asus VivoBook S 14 OLED M5406WA
AMD Radeon 890M, AMD Ryzen AI 9 HX 370
3676 Points -64%
HP EliteBook x360 1040 G11
Intel Arc 8-Core iGPU, Intel Core Ultra 7 165H
3458 Points -67%
Lenovo Yoga Pro 7 14ASP G9
AMD Radeon 880M, AMD Ryzen AI 9 365
3423 Points -67%
HP ZBook Firefly 14 G11
NVIDIA RTX A500 Laptop GPU, Intel Core Ultra 7 165H
3116 Points -70%
Asus Zenbook 14 OLED UM3406HA
AMD Radeon 780M, AMD Ryzen 7 8840HS
2876 Points -72%
Lenovo Yoga 7 2-in-1 14AHP9 Arctic Grey
AMD Radeon 760M, AMD Ryzen 5 8640HS
2495 Points -76%
SPECviewperf 13
3ds Max (3dsmax-06)
Lenovo ThinkPad P16 Gen 2
NVIDIA RTX 4000 Ada Generation Laptop GPU, Intel Core i7-14700HX
287.6 fps +27%
Przeciętny AMD Radeon RX 8060S
  (n=1)
227 fps 0%
HP ZBook Ultra G1a 14
AMD Radeon RX 8060S, AMD Ryzen AI Max+ PRO 395
226.84 fps
Dell Precision 5000 5490
NVIDIA RTX 3000 Ada Generation Laptop GPU, Intel Core Ultra 9 185H
189.32 fps -17%
HP ZBook Firefly 14 G11
NVIDIA RTX A500 Laptop GPU, Intel Core Ultra 7 165H
80.81 fps -64%
Catia (catia-05)
Lenovo ThinkPad P16 Gen 2
NVIDIA RTX 4000 Ada Generation Laptop GPU, Intel Core i7-14700HX
417.57 fps +32%
HP ZBook Ultra G1a 14
AMD Radeon RX 8060S, AMD Ryzen AI Max+ PRO 395
317.33 fps
Przeciętny AMD Radeon RX 8060S
  (n=1)
317 fps 0%
Dell Precision 5000 5490
NVIDIA RTX 3000 Ada Generation Laptop GPU, Intel Core Ultra 9 185H
273.29 fps -14%
HP ZBook Firefly 14 G11
NVIDIA RTX A500 Laptop GPU, Intel Core Ultra 7 165H
162.65 fps -49%
Creo (creo-02)
Lenovo ThinkPad P16 Gen 2
NVIDIA RTX 4000 Ada Generation Laptop GPU, Intel Core i7-14700HX
424.69 fps +59%
HP ZBook Ultra G1a 14
AMD Radeon RX 8060S, AMD Ryzen AI Max+ PRO 395
266.46 fps
Przeciętny AMD Radeon RX 8060S
  (n=1)
266 fps 0%
Dell Precision 5000 5490
NVIDIA RTX 3000 Ada Generation Laptop GPU, Intel Core Ultra 9 185H
245.25 fps -8%
HP ZBook Firefly 14 G11
NVIDIA RTX A500 Laptop GPU, Intel Core Ultra 7 165H
120.07 fps -55%
Energy (energy-02)
Lenovo ThinkPad P16 Gen 2
NVIDIA RTX 4000 Ada Generation Laptop GPU, Intel Core i7-14700HX
106.79 fps +42%
HP ZBook Ultra G1a 14
AMD Radeon RX 8060S, AMD Ryzen AI Max+ PRO 395
75.34 fps
Przeciętny AMD Radeon RX 8060S
  (n=1)
75.3 fps 0%
Dell Precision 5000 5490
NVIDIA RTX 3000 Ada Generation Laptop GPU, Intel Core Ultra 9 185H
56.97 fps -24%
HP ZBook Firefly 14 G11
NVIDIA RTX A500 Laptop GPU, Intel Core Ultra 7 165H
22.26 fps -70%
Maya (maya-05)
Lenovo ThinkPad P16 Gen 2
NVIDIA RTX 4000 Ada Generation Laptop GPU, Intel Core i7-14700HX
447.52 fps +51%
Przeciętny AMD Radeon RX 8060S
  (n=1)
297 fps 0%
HP ZBook Ultra G1a 14
AMD Radeon RX 8060S, AMD Ryzen AI Max+ PRO 395
296.56 fps
Dell Precision 5000 5490
NVIDIA RTX 3000 Ada Generation Laptop GPU, Intel Core Ultra 9 185H
260.1 fps -12%
HP ZBook Firefly 14 G11
NVIDIA RTX A500 Laptop GPU, Intel Core Ultra 7 165H
125.67 fps -58%
Medical (medical-02)
Przeciętny AMD Radeon RX 8060S
  (n=1)
339 fps 0%
HP ZBook Ultra G1a 14
AMD Radeon RX 8060S, AMD Ryzen AI Max+ PRO 395
338.6 fps
Lenovo ThinkPad P16 Gen 2
NVIDIA RTX 4000 Ada Generation Laptop GPU, Intel Core i7-14700HX
272.02 fps -20%
Dell Precision 5000 5490
NVIDIA RTX 3000 Ada Generation Laptop GPU, Intel Core Ultra 9 185H
168.45 fps -50%
HP ZBook Firefly 14 G11
NVIDIA RTX A500 Laptop GPU, Intel Core Ultra 7 165H
82.72 fps -76%
Showcase (showcase-02)
Lenovo ThinkPad P16 Gen 2
NVIDIA RTX 4000 Ada Generation Laptop GPU, Intel Core i7-14700HX
155.82 fps +31%
HP ZBook Ultra G1a 14
AMD Radeon RX 8060S, AMD Ryzen AI Max+ PRO 395
118.84 fps
Przeciętny AMD Radeon RX 8060S
  (n=1)
118.8 fps 0%
Dell Precision 5000 5490
NVIDIA RTX 3000 Ada Generation Laptop GPU, Intel Core Ultra 9 185H
88.94 fps -25%
HP ZBook Firefly 14 G11
NVIDIA RTX A500 Laptop GPU, Intel Core Ultra 7 165H
31.69 fps -73%
Siemens NX (snx-03)
Lenovo ThinkPad P16 Gen 2
NVIDIA RTX 4000 Ada Generation Laptop GPU, Intel Core i7-14700HX
555.09 fps +60%
Przeciętny AMD Radeon RX 8060S
  (n=1)
348 fps 0%
HP ZBook Ultra G1a 14
AMD Radeon RX 8060S, AMD Ryzen AI Max+ PRO 395
347.62 fps
Dell Precision 5000 5490
NVIDIA RTX 3000 Ada Generation Laptop GPU, Intel Core Ultra 9 185H
312.07 fps -10%
HP ZBook Firefly 14 G11
NVIDIA RTX A500 Laptop GPU, Intel Core Ultra 7 165H
160.83 fps -54%
Solidworks (sw-04)
Lenovo ThinkPad P16 Gen 2
NVIDIA RTX 4000 Ada Generation Laptop GPU, Intel Core i7-14700HX
230.39 fps +26%
HP ZBook Ultra G1a 14
AMD Radeon RX 8060S, AMD Ryzen AI Max+ PRO 395
182.5 fps
Przeciętny AMD Radeon RX 8060S
  (n=1)
182.5 fps 0%
Dell Precision 5000 5490
NVIDIA RTX 3000 Ada Generation Laptop GPU, Intel Core Ultra 9 185H
162.23 fps -11%
HP ZBook Firefly 14 G11
NVIDIA RTX A500 Laptop GPU, Intel Core Ultra 7 165H
131.64 fps -28%
SPECviewperf 2020
3840x2160 3ds Max (3dsmax-07)
Lenovo ThinkPad P16 Gen 2
NVIDIA RTX 4000 Ada Generation Laptop GPU, Intel Core i7-14700HX
114.49 fps +68%
Przeciętny AMD Radeon RX 8060S
  (n=1)
68.2 fps 0%
HP ZBook Ultra G1a 14
AMD Radeon RX 8060S, AMD Ryzen AI Max+ PRO 395
68.19 fps
Dell Precision 5000 5490
NVIDIA RTX 3000 Ada Generation Laptop GPU, Intel Core Ultra 9 185H
53 fps -22%
HP ZBook Firefly 14 G11
NVIDIA RTX A500 Laptop GPU, Intel Core Ultra 7 165H
17.09 fps -75%
3840x2160 CATIA (catia-06)
Lenovo ThinkPad P16 Gen 2
NVIDIA RTX 4000 Ada Generation Laptop GPU, Intel Core i7-14700HX
80.89 fps +27%
HP ZBook Ultra G1a 14
AMD Radeon RX 8060S, AMD Ryzen AI Max+ PRO 395
63.6 fps
Przeciętny AMD Radeon RX 8060S
  (n=1)
63.6 fps 0%
Dell Precision 5000 5490
NVIDIA RTX 3000 Ada Generation Laptop GPU, Intel Core Ultra 9 185H
45.26 fps -29%
HP ZBook Firefly 14 G11
NVIDIA RTX A500 Laptop GPU, Intel Core Ultra 7 165H
12.85 fps -80%
3840x2160 Creo (creo-03)
Lenovo ThinkPad P16 Gen 2
NVIDIA RTX 4000 Ada Generation Laptop GPU, Intel Core i7-14700HX
144.91 fps +63%
Przeciętny AMD Radeon RX 8060S
  (n=1)
88.8 fps 0%
HP ZBook Ultra G1a 14
AMD Radeon RX 8060S, AMD Ryzen AI Max+ PRO 395
88.78 fps
Dell Precision 5000 5490
NVIDIA RTX 3000 Ada Generation Laptop GPU, Intel Core Ultra 9 185H
74.79 fps -16%
HP ZBook Firefly 14 G11
NVIDIA RTX A500 Laptop GPU, Intel Core Ultra 7 165H
37.55 fps -58%
3840x2160 Energy (energy-03)
Lenovo ThinkPad P16 Gen 2
NVIDIA RTX 4000 Ada Generation Laptop GPU, Intel Core i7-14700HX
708.83 fps +2219%
HP ZBook Firefly 14 G11
NVIDIA RTX A500 Laptop GPU, Intel Core Ultra 7 165H
143.29 fps +369%
Przeciętny AMD Radeon RX 8060S
  (n=1)
30.6 fps 0%
HP ZBook Ultra G1a 14
AMD Radeon RX 8060S, AMD Ryzen AI Max+ PRO 395
30.56 fps
Dell Precision 5000 5490
NVIDIA RTX 3000 Ada Generation Laptop GPU, Intel Core Ultra 9 185H
20 fps -35%
3840x2160 Maya (maya-06)
Lenovo ThinkPad P16 Gen 2
NVIDIA RTX 4000 Ada Generation Laptop GPU, Intel Core i7-14700HX
299.26 fps +68%
HP ZBook Ultra G1a 14
AMD Radeon RX 8060S, AMD Ryzen AI Max+ PRO 395
177.63 fps
Przeciętny AMD Radeon RX 8060S
  (n=1)
177.6 fps 0%
Dell Precision 5000 5490
NVIDIA RTX 3000 Ada Generation Laptop GPU, Intel Core Ultra 9 185H
138.82 fps -22%
HP ZBook Firefly 14 G11
NVIDIA RTX A500 Laptop GPU, Intel Core Ultra 7 165H
66.68 fps -62%
3840x2160 Medical (medical-03)
Przeciętny AMD Radeon RX 8060S
  (n=1)
73.8 fps 0%
HP ZBook Ultra G1a 14
AMD Radeon RX 8060S, AMD Ryzen AI Max+ PRO 395
73.78 fps
Lenovo ThinkPad P16 Gen 2
NVIDIA RTX 4000 Ada Generation Laptop GPU, Intel Core i7-14700HX
69.52 fps -6%
Dell Precision 5000 5490
NVIDIA RTX 3000 Ada Generation Laptop GPU, Intel Core Ultra 9 185H
36.49 fps -51%
HP ZBook Firefly 14 G11
NVIDIA RTX A500 Laptop GPU, Intel Core Ultra 7 165H
11.93 fps -84%
3840x2160 Siemens NX (snx-04)
Przeciętny AMD Radeon RX 8060S
  (n=1)
220 fps 0%
HP ZBook Ultra G1a 14
AMD Radeon RX 8060S, AMD Ryzen AI Max+ PRO 395
219.76 fps
Dell Precision 5000 5490
NVIDIA RTX 3000 Ada Generation Laptop GPU, Intel Core Ultra 9 185H
191.49 fps -13%
HP ZBook Firefly 14 G11
NVIDIA RTX A500 Laptop GPU, Intel Core Ultra 7 165H
98.16 fps -55%
1920x1080 3ds Max (3dsmax-07)
Lenovo ThinkPad P16 Gen 2
NVIDIA RTX 4000 Ada Generation Laptop GPU, Intel Core i7-14700HX
174.89 fps +45%
HP ZBook Ultra G1a 14
AMD Radeon RX 8060S, AMD Ryzen AI Max+ PRO 395
121.01 fps
Przeciętny AMD Radeon RX 8060S
  (n=1)
121 fps 0%
Dell Precision 5000 5490
NVIDIA RTX 3000 Ada Generation Laptop GPU, Intel Core Ultra 9 185H
80.93 fps -33%
HP ZBook Firefly 14 G11
NVIDIA RTX A500 Laptop GPU, Intel Core Ultra 7 165H
32.99 fps -73%
1920x1080 CATIA (catia-06)
Lenovo ThinkPad P16 Gen 2
NVIDIA RTX 4000 Ada Generation Laptop GPU, Intel Core i7-14700HX
131.44 fps +37%
HP ZBook Ultra G1a 14
AMD Radeon RX 8060S, AMD Ryzen AI Max+ PRO 395
96.03 fps
Przeciętny AMD Radeon RX 8060S
  (n=1)
96 fps 0%
Dell Precision 5000 5490
NVIDIA RTX 3000 Ada Generation Laptop GPU, Intel Core Ultra 9 185H
78.93 fps -18%
HP ZBook Firefly 14 G11
NVIDIA RTX A500 Laptop GPU, Intel Core Ultra 7 165H
39.09 fps -59%
1920x1080 Creo (creo-03)
Przeciętny AMD Radeon RX 8060S
  (n=1)
139.9 fps 0%
HP ZBook Ultra G1a 14
AMD Radeon RX 8060S, AMD Ryzen AI Max+ PRO 395
139.87 fps
Lenovo ThinkPad P16 Gen 2
NVIDIA RTX 4000 Ada Generation Laptop GPU, Intel Core i7-14700HX
138.71 fps -1%
Dell Precision 5000 5490
NVIDIA RTX 3000 Ada Generation Laptop GPU, Intel Core Ultra 9 185H
113.79 fps -19%
HP ZBook Firefly 14 G11
NVIDIA RTX A500 Laptop GPU, Intel Core Ultra 7 165H
50.44 fps -64%
1920x1080 Energy (energy-03)
Przeciętny AMD Radeon RX 8060S
  (n=1)
73.9 fps 0%
HP ZBook Ultra G1a 14
AMD Radeon RX 8060S, AMD Ryzen AI Max+ PRO 395
73.87 fps
Dell Precision 5000 5490
NVIDIA RTX 3000 Ada Generation Laptop GPU, Intel Core Ultra 9 185H
57.2 fps -23%
Lenovo ThinkPad P16 Gen 2
NVIDIA RTX 4000 Ada Generation Laptop GPU, Intel Core i7-14700HX
38.6 fps -48%
HP ZBook Firefly 14 G11
NVIDIA RTX A500 Laptop GPU, Intel Core Ultra 7 165H
22.29 fps -70%
1920x1080 Maya (maya-06)
Lenovo ThinkPad P16 Gen 2
NVIDIA RTX 4000 Ada Generation Laptop GPU, Intel Core i7-14700HX
478.6 fps +6%
Przeciętny AMD Radeon RX 8060S
  (n=1)
452 fps 0%
HP ZBook Ultra G1a 14
AMD Radeon RX 8060S, AMD Ryzen AI Max+ PRO 395
451.54 fps
Dell Precision 5000 5490
NVIDIA RTX 3000 Ada Generation Laptop GPU, Intel Core Ultra 9 185H
310.86 fps -31%
HP ZBook Firefly 14 G11
NVIDIA RTX A500 Laptop GPU, Intel Core Ultra 7 165H
144.17 fps -68%
1920x1080 Medical (medical-03)
HP ZBook Ultra G1a 14
AMD Radeon RX 8060S, AMD Ryzen AI Max+ PRO 395
179.43 fps
Przeciętny AMD Radeon RX 8060S
  (n=1)
179.4 fps 0%
Lenovo ThinkPad P16 Gen 2
NVIDIA RTX 4000 Ada Generation Laptop GPU, Intel Core i7-14700HX
152.04 fps -15%
Dell Precision 5000 5490
NVIDIA RTX 3000 Ada Generation Laptop GPU, Intel Core Ultra 9 185H
96.95 fps -46%
HP ZBook Firefly 14 G11
NVIDIA RTX A500 Laptop GPU, Intel Core Ultra 7 165H
28.96 fps -84%
1920x1080 Siemens NX (snx-04)
Lenovo ThinkPad P16 Gen 2
NVIDIA RTX 4000 Ada Generation Laptop GPU, Intel Core i7-14700HX
550.21 fps +59%
HP ZBook Ultra G1a 14
AMD Radeon RX 8060S, AMD Ryzen AI Max+ PRO 395
347.04 fps
Przeciętny AMD Radeon RX 8060S
  (n=1)
347 fps 0%
Dell Precision 5000 5490
NVIDIA RTX 3000 Ada Generation Laptop GPU, Intel Core Ultra 9 185H
314.39 fps -9%
HP ZBook Firefly 14 G11
NVIDIA RTX A500 Laptop GPU, Intel Core Ultra 7 165H
157.04 fps -55%
1920x1080 Solidworks (solidworks-07)
Lenovo ThinkPad P16 Gen 2
NVIDIA RTX 4000 Ada Generation Laptop GPU, Intel Core i7-14700HX
340.81 fps +39%
Przeciętny AMD Radeon RX 8060S
  (n=1)
245 fps 0%
HP ZBook Ultra G1a 14
AMD Radeon RX 8060S, AMD Ryzen AI Max+ PRO 395
244.94 fps
Dell Precision 5000 5490
NVIDIA RTX 3000 Ada Generation Laptop GPU, Intel Core Ultra 9 185H
193.56 fps -21%
HP ZBook Firefly 14 G11
NVIDIA RTX A500 Laptop GPU, Intel Core Ultra 7 165H
88.5 fps -64%
3840x2160 Solidworks (solidworks-07) 4k
Lenovo ThinkPad P16 Gen 2
NVIDIA RTX 4000 Ada Generation Laptop GPU, Intel Core i7-14700HX
150.36 fps +40%
Przeciętny AMD Radeon RX 8060S
  (n=1)
107.7 fps 0%
HP ZBook Ultra G1a 14
AMD Radeon RX 8060S, AMD Ryzen AI Max+ PRO 395
107.66 fps
Dell Precision 5000 5490
NVIDIA RTX 3000 Ada Generation Laptop GPU, Intel Core Ultra 9 185H
77.86 fps -28%
HP ZBook Firefly 14 G11
NVIDIA RTX A500 Laptop GPU, Intel Core Ultra 7 165H
10.81 fps -90%
3DMark 11 Performance
31410 pkt.
3DMark Cloud Gate Standard Score
66462 pkt.
3DMark Fire Strike Score
24273 pkt.
3DMark Time Spy Score
10303 pkt.
Pomoc
Blender
v3.3 Classroom OPTIX/RTX
HP ZBook Firefly 14 G11
NVIDIA RTX A500 Laptop GPU, Intel Core Ultra 7 165H
95 Seconds *
Dell Precision 5000 5490
NVIDIA RTX 3000 Ada Generation Laptop GPU, Intel Core Ultra 9 185H
27 Seconds *
v3.3 Classroom CUDA
HP ZBook Firefly 14 G11
NVIDIA RTX A500 Laptop GPU, Intel Core Ultra 7 165H
142 Seconds *
Dell Precision 5000 5490
NVIDIA RTX 3000 Ada Generation Laptop GPU, Intel Core Ultra 9 185H
44 Seconds *
v3.3 Classroom CPU
Lenovo ThinkPad X1 Carbon Gen 13 21NS0010GE
Intel Arc Graphics 140V, Intel Core Ultra 7 258V
630 Seconds * -296%
Asus ExpertBook P5 P5405-NZ0102X
Intel Arc Graphics 140V, Intel Core Ultra 7 258V
565 Seconds * -255%
HP ZBook Firefly 14 G11
NVIDIA RTX A500 Laptop GPU, Intel Core Ultra 7 165H
464 Seconds * -192%
Lenovo Yoga 7 2-in-1 14AHP9 Arctic Grey
AMD Radeon 760M, AMD Ryzen 5 8640HS
452 Seconds * -184%
HP EliteBook x360 1040 G11
Intel Arc 8-Core iGPU, Intel Core Ultra 7 165H
406 Seconds * -155%
Asus Zenbook 14 OLED UM3406HA
AMD Radeon 780M, AMD Ryzen 7 8840HS
369 Seconds * -132%
Dell Precision 5000 5490
NVIDIA RTX 3000 Ada Generation Laptop GPU, Intel Core Ultra 9 185H
350 Seconds * -120%
Lenovo Yoga Pro 7 14ASP G9
AMD Radeon 880M, AMD Ryzen AI 9 365
300 Seconds * -89%
Xiaomi RedmiBook Pro 14 2025
Intel Arc Graphics 140T, Intel Core Ultra 7 255H
295 Seconds * -86%
Asus VivoBook S 14 OLED M5406WA
AMD Radeon 890M, AMD Ryzen AI 9 HX 370
256 Seconds * -61%
Przeciętny AMD Radeon RX 8060S
  (159 - 163, n=2)
161 Seconds * -1%
HP ZBook Ultra G1a 14
AMD Radeon RX 8060S, AMD Ryzen AI Max+ PRO 395
159 Seconds *
v3.3 Classroom oneAPI/Intel
Lenovo ThinkPad X1 Carbon Gen 13 21NS0010GE
Intel Arc Graphics 140V, Intel Core Ultra 7 258V
217 Seconds *
HP EliteBook x360 1040 G11
Intel Arc 8-Core iGPU, Intel Core Ultra 7 165H
213 Seconds *

* ... im mniej tym lepiej

Wydajność w grach

Zintegrowany Radeon 8060S najbardziej przypomina dyskretnego GeForce RTX 4050 jeśli chodzi o uruchamianie gier. Proszę pamiętać, że gaming nie jest podstawową funkcją ZBooka.

F1 22
1280x720 Ultra Low Preset AA:T AF:16x
HP ZBook Ultra G1a 14
AMD Ryzen AI Max+ PRO 395, AMD Radeon RX 8060S
374 (271min, 228P1) fps
Przeciętny AMD Radeon RX 8060S
  (n=1)
374 fps 0%
Dell Precision 5000 5490
Intel Core Ultra 9 185H, NVIDIA RTX 3000 Ada Generation Laptop GPU
244 (187min, 144P1) fps -35%
HP ZBook Firefly 14 G11
Intel Core Ultra 7 165H, NVIDIA RTX A500 Laptop GPU
157.6 (124min, 104P1) fps -58%
HP EliteBook x360 1040 G11
Intel Core Ultra 7 165H, Intel Arc 8-Core iGPU
104.5 (86min, 78P1) fps -72%
1920x1080 Low Preset AA:T AF:16x
HP ZBook Ultra G1a 14
AMD Ryzen AI Max+ PRO 395, AMD Radeon RX 8060S
250 (194min, 150P1) fps
Przeciętny AMD Radeon RX 8060S
  (n=1)
250 fps 0%
Dell Precision 5000 5490
Intel Core Ultra 9 185H, NVIDIA RTX 3000 Ada Generation Laptop GPU
183.6 (149min, 100P1) fps -27%
HP ZBook Firefly 14 G11
Intel Core Ultra 7 165H, NVIDIA RTX A500 Laptop GPU
92.5 (62min, 60P1) fps -63%
HP EliteBook x360 1040 G11
Intel Core Ultra 7 165H, Intel Arc 8-Core iGPU
71 (57min, 52P1) fps -72%
1920x1080 Medium Preset AA:T AF:16x
HP ZBook Ultra G1a 14
AMD Ryzen AI Max+ PRO 395, AMD Radeon RX 8060S
239 (170min, 140P1) fps
Przeciętny AMD Radeon RX 8060S
  (n=1)
239 fps 0%
Dell Precision 5000 5490
Intel Core Ultra 9 185H, NVIDIA RTX 3000 Ada Generation Laptop GPU
168 (145min, 96P1) fps -30%
HP ZBook Firefly 14 G11
Intel Core Ultra 7 165H, NVIDIA RTX A500 Laptop GPU
85.2 (63min, 56P1) fps -64%
HP EliteBook x360 1040 G11
Intel Core Ultra 7 165H, Intel Arc 8-Core iGPU
57.5 (49min, 37P1) fps -76%
1920x1080 High Preset AA:T AF:16x
HP ZBook Ultra G1a 14
AMD Ryzen AI Max+ PRO 395, AMD Radeon RX 8060S
185.1 (148min, 115P1) fps
Przeciętny AMD Radeon RX 8060S
  (n=1)
185.1 fps 0%
Dell Precision 5000 5490
Intel Core Ultra 9 185H, NVIDIA RTX 3000 Ada Generation Laptop GPU
127.5 (113min, 80P1) fps -31%
HP ZBook Firefly 14 G11
Intel Core Ultra 7 165H, NVIDIA RTX A500 Laptop GPU
57.8 (45min, 40P1) fps -69%
HP EliteBook x360 1040 G11
Intel Core Ultra 7 165H, Intel Arc 8-Core iGPU
43.5 (30min, 27P1) fps -76%
1920x1080 Ultra High Preset AA:T AF:16x
HP ZBook Ultra G1a 14
AMD Ryzen AI Max+ PRO 395, AMD Radeon RX 8060S
57.4 (40min, 38P1) fps
Przeciętny AMD Radeon RX 8060S
  (n=1)
57.4 fps 0%
Dell Precision 5000 5490
Intel Core Ultra 9 185H, NVIDIA RTX 3000 Ada Generation Laptop GPU
50.4 (43min, 40P1) fps -12%
HP ZBook Firefly 14 G11
Intel Core Ultra 7 165H, NVIDIA RTX A500 Laptop GPU
16.9 (12min, 12P1) fps -71%
GTA V
1024x768 Lowest Settings possible
HP ZBook Ultra G1a 14
AMD Ryzen AI Max+ PRO 395, AMD Radeon RX 8060S
184.4 (2.65min, 100P1) fps
Przeciętny AMD Radeon RX 8060S
  (n=1)
184.4 fps 0%
Xiaomi RedmiBook Pro 14 2025
Intel Core Ultra 7 255H, Intel Arc Graphics 140T
176.5 (3.81min, 125P1) fps -4%
Asus VivoBook S 14 OLED M5406WA
AMD Ryzen AI 9 HX 370, AMD Radeon 890M
174.3 (5.31min, 125P1) fps -5%
Lenovo Yoga Pro 7 14ASP G9
AMD Ryzen AI 9 365, AMD Radeon 880M
173.3 (3.94min, 111.1P1) fps -6%
HP EliteBook x360 1040 G11
Intel Core Ultra 7 165H, Intel Arc 8-Core iGPU
162.9 (4.68min, 83.3P1) fps -12%
Asus Zenbook 14 OLED UM3406HA
AMD Ryzen 7 8840HS, AMD Radeon 780M
155.3 (2.67min, 90.9P1) fps -16%
Asus ExpertBook P5 P5405-NZ0102X
Intel Core Ultra 7 258V, Intel Arc Graphics 140V
149.9 (4.34min, 83.3P1) fps -19%
Asus ExpertBook P5 P5405-NZ0102X
Intel Core Ultra 7 258V, Intel Arc Graphics 140V
149.9 (4.34min, 83.3P1) fps -19%
Lenovo ThinkPad X1 Carbon Gen 13 21NS0010GE
Intel Core Ultra 7 258V, Intel Arc Graphics 140V
149.3 (2.93min, 76.9P1) fps -19%
Lenovo Yoga 7 2-in-1 14AHP9 Arctic Grey
AMD Ryzen 5 8640HS, AMD Radeon 760M
147.6 (5.01min, 90.9P1) fps -20%
1920x1080 Lowest Settings possible
HP ZBook Ultra G1a 14
AMD Ryzen AI Max+ PRO 395, AMD Radeon RX 8060S
183.1 (2.44min, 125P1) fps
Przeciętny AMD Radeon RX 8060S
  (n=1)
183.1 fps 0%
Asus VivoBook S 14 OLED M5406WA
AMD Ryzen AI 9 HX 370, AMD Radeon 890M
150.4 (5.05min, 100P1) fps -18%
HP EliteBook x360 1040 G11
Intel Core Ultra 7 165H, Intel Arc 8-Core iGPU
142.8 (5.23min, 76.9P1) fps -22%
Lenovo ThinkPad X1 Carbon Gen 13 21NS0010GE
Intel Core Ultra 7 258V, Intel Arc Graphics 140V
142.7 (4.29min, 50P1) fps -22%
Asus ExpertBook P5 P5405-NZ0102X
Intel Core Ultra 7 258V, Intel Arc Graphics 140V
135.2 (4.94min, 71.4P1) fps -26%
1366x768 Normal/Off AF:4x
HP ZBook Ultra G1a 14
AMD Ryzen AI Max+ PRO 395, AMD Radeon RX 8060S
177.7 (3.69min, 125P1) fps
Przeciętny AMD Radeon RX 8060S
  (n=1)
177.7 fps 0%
Xiaomi RedmiBook Pro 14 2025
Intel Core Ultra 7 255H, Intel Arc Graphics 140T
165.2 (5.6min, 111.1P1) fps -7%
Lenovo Yoga Pro 7 14ASP G9
AMD Ryzen AI 9 365, AMD Radeon 880M
165 (4.09min, 100P1) fps -7%
Asus VivoBook S 14 OLED M5406WA
AMD Ryzen AI 9 HX 370, AMD Radeon 890M
161.5 (4.13min, 100P1) fps -9%
HP EliteBook x360 1040 G11
Intel Core Ultra 7 165H, Intel Arc 8-Core iGPU
151.9 (4.24min, 71.4P1) fps -15%
Lenovo ThinkPad X1 Carbon Gen 13 21NS0010GE
Intel Core Ultra 7 258V, Intel Arc Graphics 140V
143.9 (4.06min, 71.4P1) fps -19%
Asus Zenbook 14 OLED UM3406HA
AMD Ryzen 7 8840HS, AMD Radeon 780M
143.7 (6.3min, 90.9P1) fps -19%
Lenovo Yoga 7 2-in-1 14AHP9 Arctic Grey
AMD Ryzen 5 8640HS, AMD Radeon 760M
133.8 (6.05min, 83.3P1) fps -25%
Asus ExpertBook P5 P5405-NZ0102X
Intel Core Ultra 7 258V, Intel Arc Graphics 140V
111.3 (11.9min, 66.7P1) fps -37%
1920x1080 Normal/Off AF:4x
HP ZBook Ultra G1a 14
AMD Ryzen AI Max+ PRO 395, AMD Radeon RX 8060S
175.5 (3.69min, 111.1P1) fps
Przeciętny AMD Radeon RX 8060S
  (n=1)
175.5 fps 0%
Asus VivoBook S 14 OLED M5406WA
AMD Ryzen AI 9 HX 370, AMD Radeon 890M
146.1 (5.08min, 100P1) fps -17%
Lenovo ThinkPad X1 Carbon Gen 13 21NS0010GE
Intel Core Ultra 7 258V, Intel Arc Graphics 140V
139.1 (4.05min, 55.6P1) fps -21%
HP EliteBook x360 1040 G11
Intel Core Ultra 7 165H, Intel Arc 8-Core iGPU
124.3 (10.4min, 58.8P1) fps -29%
Asus ExpertBook P5 P5405-NZ0102X
Intel Core Ultra 7 258V, Intel Arc Graphics 140V
120.6 (5.87min, 58.8P1) fps -31%
1920x1080 High/On (Advanced Graphics Off) AA:2xMSAA + FX AF:8x
Przeciętny AMD Radeon RX 8060S
  (164.3 - 166.9, n=2)
165.6 fps +1%
HP ZBook Ultra G1a 14
AMD Ryzen AI Max+ PRO 395, AMD Radeon RX 8060S
164.3 (4.24min, 100P1) fps
Lenovo Yoga Pro 7 14ASP G9
AMD Ryzen AI 9 365, AMD Radeon 880M
81.6 (3.51min, 55.6P1) fps -50%
Asus VivoBook S 14 OLED M5406WA
AMD Ryzen AI 9 HX 370, AMD Radeon 890M
79.1 (3.03min, 52.6P1) fps -52%
Asus Zenbook 14 OLED UM3406HA
AMD Ryzen 7 8840HS, AMD Radeon 780M
64.2 (2.24min, 40P1) fps -61%
Lenovo ThinkPad X1 Carbon Gen 13 21NS0010GE
Intel Core Ultra 7 258V, Intel Arc Graphics 140V
62 (3.74min, 37P1) fps -62%
Asus ExpertBook P5 P5405-NZ0102X
Intel Core Ultra 7 258V, Intel Arc Graphics 140V
59.4 (3.41min, 25P1) fps -64%
Lenovo Yoga 7 2-in-1 14AHP9 Arctic Grey
AMD Ryzen 5 8640HS, AMD Radeon 760M
57.3 (5.67min, 37P1) fps -65%
HP EliteBook x360 1040 G11
Intel Core Ultra 7 165H, Intel Arc 8-Core iGPU
43.2 (2.29min, 25.6P1) fps -74%
Xiaomi RedmiBook Pro 14 2025
Intel Core Ultra 7 255H, Intel Arc Graphics 140T
41.2 (4.51min, 34.5P1) fps -75%
1920x1080 Highest Settings possible AA:4xMSAA + FX AF:16x
HP ZBook Ultra G1a 14
AMD Ryzen AI Max+ PRO 395, AMD Radeon RX 8060S
86.6 (9.6min, 62.5P1) fps
Przeciętny AMD Radeon RX 8060S
  (83.5 - 86.6, n=2)
85.1 fps -2%
Lenovo Yoga Pro 7 14ASP G9
AMD Ryzen AI 9 365, AMD Radeon 880M
32.7 (2.22min, 22.7P1) fps -62%
Asus VivoBook S 14 OLED M5406WA
AMD Ryzen AI 9 HX 370, AMD Radeon 890M
32.4 (3.71min, 23.8P1) fps -63%
Asus ExpertBook P5 P5405-NZ0102X
Intel Core Ultra 7 258V, Intel Arc Graphics 140V
26.3 (2.94min, 18.2P1) fps -70%
Asus Zenbook 14 OLED UM3406HA
AMD Ryzen 7 8840HS, AMD Radeon 780M
25.7 (2.69min, 16.4P1) fps -70%
Lenovo ThinkPad X1 Carbon Gen 13 21NS0010GE
Intel Core Ultra 7 258V, Intel Arc Graphics 140V
24.6 (2.96min, 18.5P1) fps -72%
Lenovo Yoga 7 2-in-1 14AHP9 Arctic Grey
AMD Ryzen 5 8640HS, AMD Radeon 760M
23.2 (2.94min, 15.6P1) fps -73%
HP EliteBook x360 1040 G11
Intel Core Ultra 7 165H, Intel Arc 8-Core iGPU
17.1 (1.72min, 12.3P1) fps -80%
Xiaomi RedmiBook Pro 14 2025
Intel Core Ultra 7 255H, Intel Arc Graphics 140T
17.1 (7.56min, 13.3P1) fps -80%
Final Fantasy XV Benchmark
1280x720 Lite Quality
HP ZBook Ultra G1a 14
AMD Ryzen AI Max+ PRO 395, AMD Radeon RX 8060S
192.9 fps
Przeciętny AMD Radeon RX 8060S
  (182.7 - 192.9, n=2)
187.8 fps -3%
Dell Precision 5000 5490
Intel Core Ultra 9 185H, NVIDIA RTX 3000 Ada Generation Laptop GPU
128.8 fps -33%
Lenovo Yoga Pro 7 14ASP G9
AMD Ryzen AI 9 365, AMD Radeon 880M
90.5 fps -53%
Asus ExpertBook P5 P5405-NZ0102X
Intel Core Ultra 7 258V, Intel Arc Graphics 140V
86.1 fps -55%
Lenovo ThinkPad X1 Carbon Gen 13 21NS0010GE
Intel Core Ultra 7 258V, Intel Arc Graphics 140V
84.8 fps -56%
Xiaomi RedmiBook Pro 14 2025
Intel Core Ultra 7 255H, Intel Arc Graphics 140T
80.1 fps -58%
Asus VivoBook S 14 OLED M5406WA
AMD Ryzen AI 9 HX 370, AMD Radeon 890M
78.9 fps -59%
HP ZBook Firefly 14 G11
Intel Core Ultra 7 165H, NVIDIA RTX A500 Laptop GPU
78.6 fps -59%
Asus Zenbook 14 OLED UM3406HA
AMD Ryzen 7 8840HS, AMD Radeon 780M
73.6 fps -62%
HP EliteBook x360 1040 G11
Intel Core Ultra 7 165H, Intel Arc 8-Core iGPU
73.6 fps -62%
Lenovo Yoga 7 2-in-1 14AHP9 Arctic Grey
AMD Ryzen 5 8640HS, AMD Radeon 760M
69.9 fps -64%
1920x1080 Standard Quality
HP ZBook Ultra G1a 14
AMD Ryzen AI Max+ PRO 395, AMD Radeon RX 8060S
122.6 fps
Przeciętny AMD Radeon RX 8060S
  (117.6 - 122.6, n=2)
120.1 fps -2%
Dell Precision 5000 5490
Intel Core Ultra 9 185H, NVIDIA RTX 3000 Ada Generation Laptop GPU
91.9 fps -25%
Lenovo ThinkPad X1 Carbon Gen 13 21NS0010GE
Intel Core Ultra 7 258V, Intel Arc Graphics 140V
47.9 fps -61%
Asus ExpertBook P5 P5405-NZ0102X
Intel Core Ultra 7 258V, Intel Arc Graphics 140V
46.7 fps -62%
Asus ExpertBook P5 P5405-NZ0102X
Intel Core Ultra 7 258V, Intel Arc Graphics 140V
37.9 fps -69%
Lenovo Yoga Pro 7 14ASP G9
AMD Ryzen AI 9 365, AMD Radeon 880M
46.4 fps -62%
HP ZBook Firefly 14 G11
Intel Core Ultra 7 165H, NVIDIA RTX A500 Laptop GPU
44.2 fps -64%
Xiaomi RedmiBook Pro 14 2025
Intel Core Ultra 7 255H, Intel Arc Graphics 140T
44.2 fps -64%
Asus VivoBook S 14 OLED M5406WA
AMD Ryzen AI 9 HX 370, AMD Radeon 890M
44 fps -64%
HP EliteBook x360 1040 G11
Intel Core Ultra 7 165H, Intel Arc 8-Core iGPU
40.3 fps -67%
Asus Zenbook 14 OLED UM3406HA
AMD Ryzen 7 8840HS, AMD Radeon 780M
36.9 fps -70%
Lenovo Yoga 7 2-in-1 14AHP9 Arctic Grey
AMD Ryzen 5 8640HS, AMD Radeon 760M
32.7 fps -73%
1920x1080 High Quality
Przeciętny AMD Radeon RX 8060S
  (84.8 - 86.6, n=2)
85.7 fps +1%
HP ZBook Ultra G1a 14
AMD Ryzen AI Max+ PRO 395, AMD Radeon RX 8060S
84.8 fps
Dell Precision 5000 5490
Intel Core Ultra 9 185H, NVIDIA RTX 3000 Ada Generation Laptop GPU
72.9 fps -14%
Lenovo ThinkPad X1 Carbon Gen 13 21NS0010GE
Intel Core Ultra 7 258V, Intel Arc Graphics 140V
34 fps -60%
Asus ExpertBook P5 P5405-NZ0102X
Intel Core Ultra 7 258V, Intel Arc Graphics 140V
32.4 fps -62%
Lenovo Yoga Pro 7 14ASP G9
AMD Ryzen AI 9 365, AMD Radeon 880M
32 fps -62%
HP ZBook Firefly 14 G11
Intel Core Ultra 7 165H, NVIDIA RTX A500 Laptop GPU
31.4 fps -63%
Xiaomi RedmiBook Pro 14 2025
Intel Core Ultra 7 255H, Intel Arc Graphics 140T
31.4 fps -63%
Asus VivoBook S 14 OLED M5406WA
AMD Ryzen AI 9 HX 370, AMD Radeon 890M
31.2 fps -63%
Asus Zenbook 14 OLED UM3406HA
AMD Ryzen 7 8840HS, AMD Radeon 780M
27.6 fps -67%
HP EliteBook x360 1040 G11
Intel Core Ultra 7 165H, Intel Arc 8-Core iGPU
27.5 fps -68%
Lenovo Yoga 7 2-in-1 14AHP9 Arctic Grey
AMD Ryzen 5 8640HS, AMD Radeon 760M
24.1 fps -72%
X-Plane 11.11
1280x720 low (fps_test=1)
Przeciętny AMD Radeon RX 8060S
  (109.5 - 138.8, n=2)
124.2 fps +13%
HP ZBook Firefly 14 G11
Intel Core Ultra 7 165H, NVIDIA RTX A500 Laptop GPU
113.3 fps +3%
Dell Precision 5000 5490
Intel Core Ultra 9 185H, NVIDIA RTX 3000 Ada Generation Laptop GPU
109.9 fps 0%
HP ZBook Ultra G1a 14
AMD Ryzen AI Max+ PRO 395, AMD Radeon RX 8060S
109.5 fps
Lenovo Yoga Pro 7 14ASP G9
AMD Ryzen AI 9 365, AMD Radeon 880M
82.5 fps -25%
Asus VivoBook S 14 OLED M5406WA
AMD Ryzen AI 9 HX 370, AMD Radeon 890M
78.2 fps -29%
HP EliteBook x360 1040 G11
Intel Core Ultra 7 165H, Intel Arc 8-Core iGPU
58.7 fps -46%
Xiaomi RedmiBook Pro 14 2025
Intel Core Ultra 7 255H, Intel Arc Graphics 140T
56.4 fps -48%
Asus ExpertBook P5 P5405-NZ0102X
Intel Core Ultra 7 258V, Intel Arc Graphics 140V
51.9 fps -53%
Asus Zenbook 14 OLED UM3406HA
AMD Ryzen 7 8840HS, AMD Radeon 780M
51.2 fps -53%
Lenovo Yoga 7 2-in-1 14AHP9 Arctic Grey
AMD Ryzen 5 8640HS, AMD Radeon 760M
44.6 fps -59%
Lenovo ThinkPad X1 Carbon Gen 13 21NS0010GE
Intel Core Ultra 7 258V, Intel Arc Graphics 140V
42.4 fps -61%
1920x1080 med (fps_test=2)
Dell Precision 5000 5490
Intel Core Ultra 9 185H, NVIDIA RTX 3000 Ada Generation Laptop GPU
102.1 fps +54%
HP ZBook Firefly 14 G11
Intel Core Ultra 7 165H, NVIDIA RTX A500 Laptop GPU
98 fps +48%
Przeciętny AMD Radeon RX 8060S
  (66.4 - 104.9, n=2)
85.7 fps +29%
HP ZBook Ultra G1a 14
AMD Ryzen AI Max+ PRO 395, AMD Radeon RX 8060S
66.4 fps
Lenovo Yoga Pro 7 14ASP G9
AMD Ryzen AI 9 365, AMD Radeon 880M
65.9 fps -1%
Asus VivoBook S 14 OLED M5406WA
AMD Ryzen AI 9 HX 370, AMD Radeon 890M
58.6 fps -12%
HP EliteBook x360 1040 G11
Intel Core Ultra 7 165H, Intel Arc 8-Core iGPU
47.6 fps -28%
Xiaomi RedmiBook Pro 14 2025
Intel Core Ultra 7 255H, Intel Arc Graphics 140T
47.3 fps -29%
Asus ExpertBook P5 P5405-NZ0102X
Intel Core Ultra 7 258V, Intel Arc Graphics 140V
40.1 fps -40%
Asus Zenbook 14 OLED UM3406HA
AMD Ryzen 7 8840HS, AMD Radeon 780M
39 fps -41%
Lenovo ThinkPad X1 Carbon Gen 13 21NS0010GE
Intel Core Ultra 7 258V, Intel Arc Graphics 140V
37.4 fps -44%
Lenovo Yoga 7 2-in-1 14AHP9 Arctic Grey
AMD Ryzen 5 8640HS, AMD Radeon 760M
31.5 fps -53%
1920x1080 high (fps_test=3)
HP ZBook Firefly 14 G11
Intel Core Ultra 7 165H, NVIDIA RTX A500 Laptop GPU
81.6 fps +43%
Dell Precision 5000 5490
Intel Core Ultra 9 185H, NVIDIA RTX 3000 Ada Generation Laptop GPU
76.7 fps +34%
Przeciętny AMD Radeon RX 8060S
  (57.2 - 76.7, n=2)
67 fps +17%
HP ZBook Ultra G1a 14
AMD Ryzen AI Max+ PRO 395, AMD Radeon RX 8060S
57.2 fps
Lenovo Yoga Pro 7 14ASP G9
AMD Ryzen AI 9 365, AMD Radeon 880M
49.5 fps -13%
Asus VivoBook S 14 OLED M5406WA
AMD Ryzen AI 9 HX 370, AMD Radeon 890M
46.2 fps -19%
HP EliteBook x360 1040 G11
Intel Core Ultra 7 165H, Intel Arc 8-Core iGPU
40.5 fps -29%
Xiaomi RedmiBook Pro 14 2025
Intel Core Ultra 7 255H, Intel Arc Graphics 140T
37.7 fps -34%
Asus ExpertBook P5 P5405-NZ0102X
Intel Core Ultra 7 258V, Intel Arc Graphics 140V
34.6 fps -40%
Asus Zenbook 14 OLED UM3406HA
AMD Ryzen 7 8840HS, AMD Radeon 780M
32.3 fps -44%
Lenovo ThinkPad X1 Carbon Gen 13 21NS0010GE
Intel Core Ultra 7 258V, Intel Arc Graphics 140V
31.3 fps -45%
Lenovo Yoga 7 2-in-1 14AHP9 Arctic Grey
AMD Ryzen 5 8640HS, AMD Radeon 760M
27.3 fps -52%
Strange Brigade
1280x720 lowest AF:1
HP ZBook Ultra G1a 14
AMD Ryzen AI Max+ PRO 395, AMD Radeon RX 8060S
491 (62.7min, 309P1) fps
Przeciętny AMD Radeon RX 8060S
  (453 - 491, n=2)
472 fps -4%
Dell Precision 5000 5490
Intel Core Ultra 9 185H, NVIDIA RTX 3000 Ada Generation Laptop GPU
282 (84.5min, 161.1P1) fps -43%
Xiaomi RedmiBook Pro 14 2025
Intel Core Ultra 7 255H, Intel Arc Graphics 140T
208 (53.4min, 96.8P1) fps -58%
Lenovo Yoga Pro 7 14ASP G9
AMD Ryzen AI 9 365, AMD Radeon 880M
191.4 (106.2min, 166.3P1) fps -61%
Asus VivoBook S 14 OLED M5406WA
AMD Ryzen AI 9 HX 370, AMD Radeon 890M
186.7 (73.5min, 160.6P1) fps -62%
HP EliteBook x360 1040 G11
Intel Core Ultra 7 165H, Intel Arc 8-Core iGPU
178 (42.7min, 127.4P1) fps -64%
HP ZBook Firefly 14 G11
Intel Core Ultra 7 165H, NVIDIA RTX A500 Laptop GPU
168.9 (94.1min, 130.4P1) fps -66%
Asus Zenbook 14 OLED UM3406HA
AMD Ryzen 7 8840HS, AMD Radeon 780M
164 fps -67%
Lenovo Yoga 7 2-in-1 14AHP9 Arctic Grey
AMD Ryzen 5 8640HS, AMD Radeon 760M
139.4 (47.2min, 113.8P1) fps -72%
1920x1080 medium AA:medium AF:4
Przeciętny AMD Radeon RX 8060S
  (218 - 221, n=2)
220 fps +1%
HP ZBook Ultra G1a 14
AMD Ryzen AI Max+ PRO 395, AMD Radeon RX 8060S
218 (100.9min, 160.3P1) fps
Dell Precision 5000 5490
Intel Core Ultra 9 185H, NVIDIA RTX 3000 Ada Generation Laptop GPU
182.4 (41.6min, 133.4P1) fps -16%
Xiaomi RedmiBook Pro 14 2025
Intel Core Ultra 7 255H, Intel Arc Graphics 140T
83.6 (36.5min, 67.5P1) fps -62%
HP EliteBook x360 1040 G11
Intel Core Ultra 7 165H, Intel Arc 8-Core iGPU
77.4 (25.7min, 64.2P1) fps -64%
Lenovo Yoga Pro 7 14ASP G9
AMD Ryzen AI 9 365, AMD Radeon 880M
77.4 (61.9min, 66.4P1) fps -64%
Asus VivoBook S 14 OLED M5406WA
AMD Ryzen AI 9 HX 370, AMD Radeon 890M
76.3 (34.7min, 64.8P1) fps -65%
HP ZBook Firefly 14 G11
Intel Core Ultra 7 165H, NVIDIA RTX A500 Laptop GPU
74.9 (39.5min, 61.2P1) fps -66%
Asus Zenbook 14 OLED UM3406HA
AMD Ryzen 7 8840HS, AMD Radeon 780M
69 fps -68%
Lenovo Yoga 7 2-in-1 14AHP9 Arctic Grey
AMD Ryzen 5 8640HS, AMD Radeon 760M
57.4 (16.5min, 49P1) fps -74%
1920x1080 high AA:high AF:8
Przeciętny AMD Radeon RX 8060S
  (188.6 - 192.7, n=2)
190.7 fps +1%
HP ZBook Ultra G1a 14
AMD Ryzen AI Max+ PRO 395, AMD Radeon RX 8060S
188.6 (82.9min, 136.6P1) fps
Dell Precision 5000 5490
Intel Core Ultra 9 185H, NVIDIA RTX 3000 Ada Generation Laptop GPU
151.4 (78.4min, 114.6P1) fps -20%
Xiaomi RedmiBook Pro 14 2025
Intel Core Ultra 7 255H, Intel Arc Graphics 140T
71.2 (31.4min, 53P1) fps -62%
Lenovo Yoga Pro 7 14ASP G9
AMD Ryzen AI 9 365, AMD Radeon 880M
66 (47.7min, 51.3P1) fps -65%
Asus VivoBook S 14 OLED M5406WA
AMD Ryzen AI 9 HX 370, AMD Radeon 890M
63.8 (36.4min, 46.9P1) fps -66%
HP ZBook Firefly 14 G11
Intel Core Ultra 7 165H, NVIDIA RTX A500 Laptop GPU
62.5 (34.6min, 49.8P1) fps -67%
HP EliteBook x360 1040 G11
Intel Core Ultra 7 165H, Intel Arc 8-Core iGPU
61.7 (7min, 34.8P1) fps -67%
Asus Zenbook 14 OLED UM3406HA
AMD Ryzen 7 8840HS, AMD Radeon 780M
58 fps -69%
Lenovo Yoga 7 2-in-1 14AHP9 Arctic Grey
AMD Ryzen 5 8640HS, AMD Radeon 760M
47.5 (14.2min, 20.5P1) fps -75%
1920x1080 ultra AA:ultra AF:16
HP ZBook Ultra G1a 14
AMD Ryzen AI Max+ PRO 395, AMD Radeon RX 8060S
171 (69.6min, 110.3P1) fps
Przeciętny AMD Radeon RX 8060S
  (167.9 - 171, n=2)
169.5 fps -1%
Dell Precision 5000 5490
Intel Core Ultra 9 185H, NVIDIA RTX 3000 Ada Generation Laptop GPU
132.5 (69.9min, 101.5P1) fps -23%
Xiaomi RedmiBook Pro 14 2025
Intel Core Ultra 7 255H, Intel Arc Graphics 140T
59 (27.8min, 32.1P1) fps -65%
Lenovo Yoga Pro 7 14ASP G9
AMD Ryzen AI 9 365, AMD Radeon 880M
55.7 (40.1min, 43.3P1) fps -67%
HP ZBook Firefly 14 G11
Intel Core Ultra 7 165H, NVIDIA RTX A500 Laptop GPU
54.5 (29min, 43.2P1) fps -68%
Asus VivoBook S 14 OLED M5406WA
AMD Ryzen AI 9 HX 370, AMD Radeon 890M
54.2 (16.1min, 20.1P1) fps -68%
Asus Zenbook 14 OLED UM3406HA
AMD Ryzen 7 8840HS, AMD Radeon 780M
49 fps -71%
HP EliteBook x360 1040 G11
Intel Core Ultra 7 165H, Intel Arc 8-Core iGPU
47.3 (5.3min, 10.1P1) fps -72%
Lenovo Yoga 7 2-in-1 14AHP9 Arctic Grey
AMD Ryzen 5 8640HS, AMD Radeon 760M
39.6 (11.1min, 14.2P1) fps -77%
Baldur's Gate 3
1280x720 Low Preset
HP ZBook Ultra G1a 14
AMD Ryzen AI Max+ PRO 395, AMD Radeon RX 8060S
177.8 fps
Przeciętny AMD Radeon RX 8060S
  (n=1)
177.8 fps 0%
Asus ExpertBook P5 P5405-NZ0102X
Intel Core Ultra 7 258V, Intel Arc Graphics 140V
66.4 (48.2min, 50.8P0.1, 55.8P1) fps -63%
HP EliteBook x360 1040 G11
Intel Core Ultra 7 165H, Intel Arc 8-Core iGPU
42.2 fps -76%
1920x1080 Low Preset
HP ZBook Ultra G1a 14
AMD Ryzen AI Max+ PRO 395, AMD Radeon RX 8060S
139.6 fps
Przeciętny AMD Radeon RX 8060S
  (128.8 - 139.6, n=2)
134.2 fps -4%
Dell Precision 5000 5490
Intel Core Ultra 9 185H, NVIDIA RTX 3000 Ada Generation Laptop GPU
92 fps -34%
Apple MacBook Pro 14 2024 M4 Pro
Apple M4 Pro (14 cores), Apple M4 Pro 20-Core GPU
89 fps -36%
Asus VivoBook S 14 OLED M5406WA
AMD Ryzen AI 9 HX 370, AMD Radeon 890M
43.7 (23.4min, 27.3P0.1, 36P1) fps -69%
Asus ExpertBook P5 P5405-NZ0102X
Intel Core Ultra 7 258V, Intel Arc Graphics 140V
43 (30.8min, 31.5P0.1, 32.8P1) fps -69%
Lenovo Yoga Pro 7 14ASP G9
AMD Ryzen AI 9 365, AMD Radeon 880M
41.1 fps -71%
HP ZBook Firefly 14 G11
Intel Core Ultra 7 165H, NVIDIA RTX A500 Laptop GPU
39.9 fps -71%
Xiaomi RedmiBook Pro 14 2025
Intel Core Ultra 7 255H, Intel Arc Graphics 140T
39.1 fps -72%
Lenovo ThinkPad X1 Carbon Gen 13 21NS0010GE
Intel Core Ultra 7 258V, Intel Arc Graphics 140V
38.2 (15min, 17.7P0.1, 29.7P1) fps -73%
Lenovo Yoga 7 2-in-1 14AHP9 Arctic Grey
AMD Ryzen 5 8640HS, AMD Radeon 760M
29.5 (21.6min, 22.7P0.1, 26.6P1) fps -79%
HP EliteBook x360 1040 G11
Intel Core Ultra 7 165H, Intel Arc 8-Core iGPU
29.3 fps -79%
1920x1080 Medium Preset
HP ZBook Ultra G1a 14
AMD Ryzen AI Max+ PRO 395, AMD Radeon RX 8060S
118.3 fps
Przeciętny AMD Radeon RX 8060S
  (100.9 - 118.3, n=2)
109.6 fps -7%
Dell Precision 5000 5490
Intel Core Ultra 9 185H, NVIDIA RTX 3000 Ada Generation Laptop GPU
78.8 fps -33%
Apple MacBook Pro 14 2024 M4 Pro
Apple M4 Pro (14 cores), Apple M4 Pro 20-Core GPU
77 fps -35%
Asus VivoBook S 14 OLED M5406WA
AMD Ryzen AI 9 HX 370, AMD Radeon 890M
35.4 (26.6min, 26.6P0.1, 30P1) fps -70%
HP ZBook Firefly 14 G11
Intel Core Ultra 7 165H, NVIDIA RTX A500 Laptop GPU
34.5 fps -71%
Asus ExpertBook P5 P5405-NZ0102X
Intel Core Ultra 7 258V, Intel Arc Graphics 140V
33.6 (21.6min, 25.5P0.1, 27.2P1) fps -72%
Lenovo Yoga Pro 7 14ASP G9
AMD Ryzen AI 9 365, AMD Radeon 880M
32.7 fps -72%
Lenovo ThinkPad X1 Carbon Gen 13 21NS0010GE
Intel Core Ultra 7 258V, Intel Arc Graphics 140V
31.5 (23.5min, 24.2P0.1, 26.1P1) fps -73%
Xiaomi RedmiBook Pro 14 2025
Intel Core Ultra 7 255H, Intel Arc Graphics 140T
30 fps -75%
HP EliteBook x360 1040 G11
Intel Core Ultra 7 165H, Intel Arc 8-Core iGPU
24.2 fps -80%
Lenovo Yoga 7 2-in-1 14AHP9 Arctic Grey
AMD Ryzen 5 8640HS, AMD Radeon 760M
23.7 (15.9min, 16.7P0.1, 19.3P1) fps -80%
1920x1080 High Preset
HP ZBook Ultra G1a 14
AMD Ryzen AI Max+ PRO 395, AMD Radeon RX 8060S
101.2 fps
Przeciętny AMD Radeon RX 8060S
  (87.9 - 101.2, n=2)
94.6 fps -7%
Dell Precision 5000 5490
Intel Core Ultra 9 185H, NVIDIA RTX 3000 Ada Generation Laptop GPU
70.1 fps -31%
Apple MacBook Pro 14 2024 M4 Pro
Apple M4 Pro (14 cores), Apple M4 Pro 20-Core GPU
63 fps -38%
HP ZBook Firefly 14 G11
Intel Core Ultra 7 165H, NVIDIA RTX A500 Laptop GPU
31.2 fps -69%
Asus ExpertBook P5 P5405-NZ0102X
Intel Core Ultra 7 258V, Intel Arc Graphics 140V
29.9 (19.7min, 20P0.1, 25.6P1) fps -70%
Asus VivoBook S 14 OLED M5406WA
AMD Ryzen AI 9 HX 370, AMD Radeon 890M
28.9 (21.9min, 23.1P0.1, 24.6P1) fps -71%
Lenovo ThinkPad X1 Carbon Gen 13 21NS0010GE
Intel Core Ultra 7 258V, Intel Arc Graphics 140V
28.4 (21.7min, 22.2P0.1, 23.5P1) fps -72%
Lenovo Yoga Pro 7 14ASP G9
AMD Ryzen AI 9 365, AMD Radeon 880M
27.2 fps -73%
Xiaomi RedmiBook Pro 14 2025
Intel Core Ultra 7 255H, Intel Arc Graphics 140T
25.1 fps -75%
HP EliteBook x360 1040 G11
Intel Core Ultra 7 165H, Intel Arc 8-Core iGPU
21.4 fps -79%
Lenovo Yoga 7 2-in-1 14AHP9 Arctic Grey
AMD Ryzen 5 8640HS, AMD Radeon 760M
19.8 (15.2min, 15.6P0.1, 17.1P1) fps -80%
1920x1080 Ultra Preset
HP ZBook Ultra G1a 14
AMD Ryzen AI Max+ PRO 395, AMD Radeon RX 8060S
99.4 fps
Przeciętny AMD Radeon RX 8060S
  (85.3 - 99.4, n=2)
92.4 fps -7%
Dell Precision 5000 5490
Intel Core Ultra 9 185H, NVIDIA RTX 3000 Ada Generation Laptop GPU
68.8 fps -31%
Apple MacBook Pro 14 2024 M4 Pro
Apple M4 Pro (14 cores), Apple M4 Pro 20-Core GPU
61 fps -39%
HP ZBook Firefly 14 G11
Intel Core Ultra 7 165H, NVIDIA RTX A500 Laptop GPU
30.2 fps -70%
Asus ExpertBook P5 P5405-NZ0102X
Intel Core Ultra 7 258V, Intel Arc Graphics 140V
28.9 (23min, 23.3P0.1, 25.3P1) fps -71%
Asus VivoBook S 14 OLED M5406WA
AMD Ryzen AI 9 HX 370, AMD Radeon 890M
28.4 (19.8min, 22.1P0.1, 23.8P1) fps -71%
Lenovo ThinkPad X1 Carbon Gen 13 21NS0010GE
Intel Core Ultra 7 258V, Intel Arc Graphics 140V
28 (22.1min, 22.5P0.1, 23.8P1) fps -72%
Lenovo Yoga Pro 7 14ASP G9
AMD Ryzen AI 9 365, AMD Radeon 880M
26.6 fps -73%
Xiaomi RedmiBook Pro 14 2025
Intel Core Ultra 7 255H, Intel Arc Graphics 140T
24.7 fps -75%
HP EliteBook x360 1040 G11
Intel Core Ultra 7 165H, Intel Arc 8-Core iGPU
20.4 fps -79%
Lenovo Yoga 7 2-in-1 14AHP9 Arctic Grey
AMD Ryzen 5 8640HS, AMD Radeon 760M
18.9 (14.6min, 14.8P0.1, 15.4P1) fps -81%
Tiny Tina's Wonderlands
1280x720 Lowest Preset (DX12)
HP ZBook Ultra G1a 14
AMD Ryzen AI Max+ PRO 395, AMD Radeon RX 8060S
282.1 fps
Przeciętny AMD Radeon RX 8060S
  (n=1)
282 fps 0%
HP ZBook Firefly 14 G11
Intel Core Ultra 7 165H, NVIDIA RTX A500 Laptop GPU
107.6 fps -62%
HP EliteBook x360 1040 G11
Intel Core Ultra 7 165H, Intel Arc 8-Core iGPU
80 fps -72%
1920x1080 Low Preset (DX12)
Przeciętny AMD Radeon RX 8060S
  (n=1)
221 fps 0%
HP ZBook Ultra G1a 14
AMD Ryzen AI Max+ PRO 395, AMD Radeon RX 8060S
220.5 fps
Dell Precision 5000 5490
Intel Core Ultra 9 185H, NVIDIA RTX 3000 Ada Generation Laptop GPU
153.9 fps -30%
HP ZBook Firefly 14 G11
Intel Core Ultra 7 165H, NVIDIA RTX A500 Laptop GPU
66.2 fps -70%
HP EliteBook x360 1040 G11
Intel Core Ultra 7 165H, Intel Arc 8-Core iGPU
49 fps -78%
1920x1080 Medium Preset (DX12)
HP ZBook Ultra G1a 14
AMD Ryzen AI Max+ PRO 395, AMD Radeon RX 8060S
162.3 fps
Przeciętny AMD Radeon RX 8060S
  (n=1)
162.3 fps 0%
Dell Precision 5000 5490
Intel Core Ultra 9 185H, NVIDIA RTX 3000 Ada Generation Laptop GPU
125.4 fps -23%
HP ZBook Firefly 14 G11
Intel Core Ultra 7 165H, NVIDIA RTX A500 Laptop GPU
53.5 fps -67%
HP EliteBook x360 1040 G11
Intel Core Ultra 7 165H, Intel Arc 8-Core iGPU
39.5 fps -76%
1920x1080 High Preset (DX12)
HP ZBook Ultra G1a 14
AMD Ryzen AI Max+ PRO 395, AMD Radeon RX 8060S
110.2 fps
Przeciętny AMD Radeon RX 8060S
  (n=1)
110.2 fps 0%
Dell Precision 5000 5490
Intel Core Ultra 9 185H, NVIDIA RTX 3000 Ada Generation Laptop GPU
88.5 fps -20%
HP ZBook Firefly 14 G11
Intel Core Ultra 7 165H, NVIDIA RTX A500 Laptop GPU
36.2 fps -67%
HP EliteBook x360 1040 G11
Intel Core Ultra 7 165H, Intel Arc 8-Core iGPU
27 fps -75%
1920x1080 Badass Preset (DX12)
HP ZBook Ultra G1a 14
AMD Ryzen AI Max+ PRO 395, AMD Radeon RX 8060S
90 fps
Przeciętny AMD Radeon RX 8060S
  (n=1)
90 fps 0%
Dell Precision 5000 5490
Intel Core Ultra 9 185H, NVIDIA RTX 3000 Ada Generation Laptop GPU
70.2 fps -22%
HP ZBook Firefly 14 G11
Intel Core Ultra 7 165H, NVIDIA RTX A500 Laptop GPU
27.6 fps -69%
HP EliteBook x360 1040 G11
Intel Core Ultra 7 165H, Intel Arc 8-Core iGPU
21.9 fps -76%
Cyberpunk 2077 2.2 Phantom Liberty
1280x720 Low Preset (FSR off)
HP ZBook Ultra G1a 14
AMD Ryzen AI Max+ PRO 395, AMD Radeon RX 8060S
160.6 (121.1min, 103.8P1) fps
Przeciętny AMD Radeon RX 8060S
  (n=1)
160.6 fps 0%
Dell Precision 5000 5490
Intel Core Ultra 9 185H, NVIDIA RTX 3000 Ada Generation Laptop GPU
112 (51.2min) fps -30%
Asus ExpertBook P5 P5405-NZ0102X
Intel Core Ultra 7 258V, Intel Arc Graphics 140V
67.7 (51.7min) fps -58%
HP ZBook Firefly 14 G11
Intel Core Ultra 7 165H, NVIDIA RTX A500 Laptop GPU
60.2 (44.7min) fps -63%
HP EliteBook x360 1040 G11
Intel Core Ultra 7 165H, Intel Arc 8-Core iGPU
48.9 (41min) fps -70%
1920x1080 Low Preset (FSR off)
HP ZBook Ultra G1a 14
AMD Ryzen AI Max+ PRO 395, AMD Radeon RX 8060S
135.4 (106min, 92.7P1) fps
Przeciętny AMD Radeon RX 8060S
  (124.8 - 135.4, n=2)
130.1 fps -4%
Dell Precision 5000 5490
Intel Core Ultra 9 185H, NVIDIA RTX 3000 Ada Generation Laptop GPU
87.2 (14.3min) fps -36%
Apple MacBook Pro 14 2024 M4 Pro
Apple M4 Pro (14 cores), Apple M4 Pro 20-Core GPU
50.1 fps -63%
Asus VivoBook S 14 OLED M5406WA
AMD Ryzen AI 9 HX 370, AMD Radeon 890M
46 (38min) fps -66%
Lenovo ThinkPad X1 Carbon Gen 13 21NS0010GE
Intel Core Ultra 7 258V, Intel Arc Graphics 140V
45.4 (37.1min) fps -66%
Asus ExpertBook P5 P5405-NZ0102X
Intel Core Ultra 7 258V, Intel Arc Graphics 140V
43.8 (34.4min) fps -68%
Lenovo Yoga Pro 7 14ASP G9
AMD Ryzen AI 9 365, AMD Radeon 880M
41.4 (34.3min) fps -69%
Xiaomi RedmiBook Pro 14 2025
Intel Core Ultra 7 255H, Intel Arc Graphics 140T
40.8 (35.5min) fps -70%
HP ZBook Firefly 14 G11
Intel Core Ultra 7 165H, NVIDIA RTX A500 Laptop GPU
39.8 (31.2min) fps -71%
Asus Zenbook 14 OLED UM3406HA
AMD Ryzen 7 8840HS, AMD Radeon 780M
37.3 (31.4min) fps -72%
HP EliteBook x360 1040 G11
Intel Core Ultra 7 165H, Intel Arc 8-Core iGPU
31.5 (26.7min) fps -77%
Lenovo Yoga 7 2-in-1 14AHP9 Arctic Grey
AMD Ryzen 5 8640HS, AMD Radeon 760M
29.7 (24min) fps -78%
1920x1080 Medium Preset (FSR off)
HP ZBook Ultra G1a 14
AMD Ryzen AI Max+ PRO 395, AMD Radeon RX 8060S
111.5 (93.3min, 81.8P1) fps
Przeciętny AMD Radeon RX 8060S
  (105.3 - 111.5, n=2)
108.4 fps -3%
Dell Precision 5000 5490
Intel Core Ultra 9 185H, NVIDIA RTX 3000 Ada Generation Laptop GPU
72.7 (45.2min) fps -35%
Apple MacBook Pro 14 2024 M4 Pro
Apple M4 Pro (14 cores), Apple M4 Pro 20-Core GPU
48 fps -57%
Asus ExpertBook P5 P5405-NZ0102X
Intel Core Ultra 7 258V, Intel Arc Graphics 140V
36.5 (30min) fps -67%
Asus VivoBook S 14 OLED M5406WA
AMD Ryzen AI 9 HX 370, AMD Radeon 890M
36.3 (30min) fps -67%
Lenovo ThinkPad X1 Carbon Gen 13 21NS0010GE
Intel Core Ultra 7 258V, Intel Arc Graphics 140V
36.2 (30.5min) fps -68%
Xiaomi RedmiBook Pro 14 2025
Intel Core Ultra 7 255H, Intel Arc Graphics 140T
33.5 (29.3min) fps -70%
Lenovo Yoga Pro 7 14ASP G9
AMD Ryzen AI 9 365, AMD Radeon 880M
32.4 (27.8min) fps -71%
HP ZBook Firefly 14 G11
Intel Core Ultra 7 165H, NVIDIA RTX A500 Laptop GPU
31.1 (25.6min) fps -72%
Asus Zenbook 14 OLED UM3406HA
AMD Ryzen 7 8840HS, AMD Radeon 780M
28.6 (24.8min) fps -74%
HP EliteBook x360 1040 G11
Intel Core Ultra 7 165H, Intel Arc 8-Core iGPU
25.7 (22.2min) fps -77%
Lenovo Yoga 7 2-in-1 14AHP9 Arctic Grey
AMD Ryzen 5 8640HS, AMD Radeon 760M
23.9 (21min) fps -79%
1920x1080 High Preset (FSR off)
HP ZBook Ultra G1a 14
AMD Ryzen AI Max+ PRO 395, AMD Radeon RX 8060S
90.2 (75min, 69P1) fps
Przeciętny AMD Radeon RX 8060S
  (85 - 90.2, n=2)
87.6 fps -3%
Dell Precision 5000 5490
Intel Core Ultra 9 185H, NVIDIA RTX 3000 Ada Generation Laptop GPU
60.7 (35.1min) fps -33%
Apple MacBook Pro 14 2024 M4 Pro
Apple M4 Pro (14 cores), Apple M4 Pro 20-Core GPU
44.6 fps -51%
Asus ExpertBook P5 P5405-NZ0102X
Intel Core Ultra 7 258V, Intel Arc Graphics 140V
30.7 (24.5min) fps -66%
Lenovo ThinkPad X1 Carbon Gen 13 21NS0010GE
Intel Core Ultra 7 258V, Intel Arc Graphics 140V
29.7 (25.4min) fps -67%
Asus VivoBook S 14 OLED M5406WA
AMD Ryzen AI 9 HX 370, AMD Radeon 890M
29.3 (24min) fps -68%
Xiaomi RedmiBook Pro 14 2025
Intel Core Ultra 7 255H, Intel Arc Graphics 140T
28.7 (24.8min) fps -68%
Lenovo Yoga Pro 7 14ASP G9
AMD Ryzen AI 9 365, AMD Radeon 880M
24.2 (20.4min) fps -73%
HP EliteBook x360 1040 G11
Intel Core Ultra 7 165H, Intel Arc 8-Core iGPU
23.9 (20.8min) fps -74%
Asus Zenbook 14 OLED UM3406HA
AMD Ryzen 7 8840HS, AMD Radeon 780M
23.7 (19.9min) fps -74%
HP ZBook Firefly 14 G11
Intel Core Ultra 7 165H, NVIDIA RTX A500 Laptop GPU
23.6 (17.9min) fps -74%
Lenovo Yoga 7 2-in-1 14AHP9 Arctic Grey
AMD Ryzen 5 8640HS, AMD Radeon 760M
20.5 (17min) fps -77%
1920x1080 Ultra Preset (FSR off)
HP ZBook Ultra G1a 14
AMD Ryzen AI Max+ PRO 395, AMD Radeon RX 8060S
80.7 (65.3min, 60.6P1) fps
Przeciętny AMD Radeon RX 8060S
  (75.6 - 80.7, n=2)
78.2 fps -3%
Dell Precision 5000 5490
Intel Core Ultra 9 185H, NVIDIA RTX 3000 Ada Generation Laptop GPU
52.1 (35.5min) fps -35%
Apple MacBook Pro 14 2024 M4 Pro
Apple M4 Pro (14 cores), Apple M4 Pro 20-Core GPU
39.6 fps -51%
Xiaomi RedmiBook Pro 14 2025
Intel Core Ultra 7 255H, Intel Arc Graphics 140T
26.5 (22.8min) fps -67%
Asus ExpertBook P5 P5405-NZ0102X
Intel Core Ultra 7 258V, Intel Arc Graphics 140V
26.4 (20.3min) fps -67%
Lenovo ThinkPad X1 Carbon Gen 13 21NS0010GE
Intel Core Ultra 7 258V, Intel Arc Graphics 140V
26.2 (20.1min) fps -68%
Asus VivoBook S 14 OLED M5406WA
AMD Ryzen AI 9 HX 370, AMD Radeon 890M
25.4 (21min) fps -69%
HP EliteBook x360 1040 G11
Intel Core Ultra 7 165H, Intel Arc 8-Core iGPU
21.6 (18.5min) fps -73%
Lenovo Yoga Pro 7 14ASP G9
AMD Ryzen AI 9 365, AMD Radeon 880M
21 (17.6min) fps -74%
Asus Zenbook 14 OLED UM3406HA
AMD Ryzen 7 8840HS, AMD Radeon 780M
19.8 (16.4min) fps -75%
HP ZBook Firefly 14 G11
Intel Core Ultra 7 165H, NVIDIA RTX A500 Laptop GPU
19.6 (15.1min) fps -76%
Lenovo Yoga 7 2-in-1 14AHP9 Arctic Grey
AMD Ryzen 5 8640HS, AMD Radeon 760M
18 (15min) fps -78%
Far Cry 5
1280x720 Low Preset AA:T
HP ZBook Ultra G1a 14
AMD Ryzen AI Max+ PRO 395, AMD Radeon RX 8060S
116 (90min) fps
Przeciętny AMD Radeon RX 8060S
  (n=1)
116 fps 0%
Dell Precision 5000 5490
Intel Core Ultra 9 185H, NVIDIA RTX 3000 Ada Generation Laptop GPU
115 (81min) fps -1%
Asus ExpertBook P5 P5405-NZ0102X
Intel Core Ultra 7 258V, Intel Arc Graphics 140V
99 (62min) fps -15%
Asus VivoBook S 14 OLED M5406WA
AMD Ryzen AI 9 HX 370, AMD Radeon 890M
98 (53min) fps -16%
Lenovo Yoga Pro 7 14ASP G9
AMD Ryzen AI 9 365, AMD Radeon 880M
95 fps -18%
Lenovo ThinkPad X1 Carbon Gen 13 21NS0010GE
Intel Core Ultra 7 258V, Intel Arc Graphics 140V
83 (48min) fps -28%
HP ZBook Firefly 14 G11
Intel Core Ultra 7 165H, NVIDIA RTX A500 Laptop GPU
81 (68min) fps -30%
Asus Zenbook 14 OLED UM3406HA
AMD Ryzen 7 8840HS, AMD Radeon 780M
75 fps -35%
HP EliteBook x360 1040 G11
Intel Core Ultra 7 165H, Intel Arc 8-Core iGPU
51 (17min) fps -56%
1920x1080 Medium Preset AA:T
Dell Precision 5000 5490
Intel Core Ultra 9 185H, NVIDIA RTX 3000 Ada Generation Laptop GPU
105 (76min) fps +9%
HP ZBook Ultra G1a 14
AMD Ryzen AI Max+ PRO 395, AMD Radeon RX 8060S
96 (66min) fps
Przeciętny AMD Radeon RX 8060S
  (n=1)
96 fps 0%
Lenovo Yoga Pro 7 14ASP G9
AMD Ryzen AI 9 365, AMD Radeon 880M
58 fps -40%
Asus VivoBook S 14 OLED M5406WA
AMD Ryzen AI 9 HX 370, AMD Radeon 890M
57 (51min) fps -41%
Asus ExpertBook P5 P5405-NZ0102X
Intel Core Ultra 7 258V, Intel Arc Graphics 140V
57 (47min) fps -41%
Lenovo ThinkPad X1 Carbon Gen 13 21NS0010GE
Intel Core Ultra 7 258V, Intel Arc Graphics 140V
52 (37min) fps -46%
HP ZBook Firefly 14 G11
Intel Core Ultra 7 165H, NVIDIA RTX A500 Laptop GPU
51 (40min) fps -47%
Asus Zenbook 14 OLED UM3406HA
AMD Ryzen 7 8840HS, AMD Radeon 780M
40 fps -58%
HP EliteBook x360 1040 G11
Intel Core Ultra 7 165H, Intel Arc 8-Core iGPU
36 (2min) fps -62%
1920x1080 High Preset AA:T
Dell Precision 5000 5490
Intel Core Ultra 9 185H, NVIDIA RTX 3000 Ada Generation Laptop GPU
104 (74min) fps +9%
HP ZBook Ultra G1a 14
AMD Ryzen AI Max+ PRO 395, AMD Radeon RX 8060S
95 (71min) fps
Przeciętny AMD Radeon RX 8060S
  (n=1)
95 fps 0%
Asus VivoBook S 14 OLED M5406WA
AMD Ryzen AI 9 HX 370, AMD Radeon 890M
53 (46min) fps -44%
Lenovo Yoga Pro 7 14ASP G9
AMD Ryzen AI 9 365, AMD Radeon 880M
53 fps -44%
Asus ExpertBook P5 P5405-NZ0102X
Intel Core Ultra 7 258V, Intel Arc Graphics 140V
52 (43min) fps -45%
Lenovo ThinkPad X1 Carbon Gen 13 21NS0010GE
Intel Core Ultra 7 258V, Intel Arc Graphics 140V
48 (39min) fps -49%
HP ZBook Firefly 14 G11
Intel Core Ultra 7 165H, NVIDIA RTX A500 Laptop GPU
46 (42min) fps -52%
Asus Zenbook 14 OLED UM3406HA
AMD Ryzen 7 8840HS, AMD Radeon 780M
35 fps -63%
HP EliteBook x360 1040 G11
Intel Core Ultra 7 165H, Intel Arc 8-Core iGPU
34 (14min) fps -64%
1920x1080 Ultra Preset AA:T
Dell Precision 5000 5490
Intel Core Ultra 9 185H, NVIDIA RTX 3000 Ada Generation Laptop GPU
96 (69min) fps +4%
HP ZBook Ultra G1a 14
AMD Ryzen AI Max+ PRO 395, AMD Radeon RX 8060S
92 (72min) fps
Przeciętny AMD Radeon RX 8060S
  (n=1)
92 fps 0%
Asus VivoBook S 14 OLED M5406WA
AMD Ryzen AI 9 HX 370, AMD Radeon 890M
50 (42min) fps -46%
Lenovo Yoga Pro 7 14ASP G9
AMD Ryzen AI 9 365, AMD Radeon 880M
50 fps -46%
Asus ExpertBook P5 P5405-NZ0102X
Intel Core Ultra 7 258V, Intel Arc Graphics 140V
48 (39min) fps -48%
HP ZBook Firefly 14 G11
Intel Core Ultra 7 165H, NVIDIA RTX A500 Laptop GPU
44 (38min) fps -52%
Lenovo ThinkPad X1 Carbon Gen 13 21NS0010GE
Intel Core Ultra 7 258V, Intel Arc Graphics 140V
43 (37min) fps -53%
Asus Zenbook 14 OLED UM3406HA
AMD Ryzen 7 8840HS, AMD Radeon 780M
33 fps -64%
HP EliteBook x360 1040 G11
Intel Core Ultra 7 165H, Intel Arc 8-Core iGPU
32 (16min) fps -65%
Dota 2 Reborn
1280x720 min (0/3) fastest
Przeciętny AMD Radeon RX 8060S
  (210 - 223, n=2)
217 fps +3%
HP ZBook Ultra G1a 14
AMD Ryzen AI Max+ PRO 395, AMD Radeon RX 8060S
210 (165.9min) fps
Asus VivoBook S 14 OLED M5406WA
AMD Ryzen AI 9 HX 370, AMD Radeon 890M
171.8 (146.7min) fps -18%
Dell Precision 5000 5490
Intel Core Ultra 9 185H, NVIDIA RTX 3000 Ada Generation Laptop GPU
168 (146.2min) fps -20%
Lenovo Yoga Pro 7 14ASP G9
AMD Ryzen AI 9 365, AMD Radeon 880M
164.8 (138.6min) fps -22%
HP ZBook Firefly 14 G11
Intel Core Ultra 7 165H, NVIDIA RTX A500 Laptop GPU
160.4 (140min) fps -24%
Asus Zenbook 14 OLED UM3406HA
AMD Ryzen 7 8840HS, AMD Radeon 780M
136.1 (116.3min) fps -35%
Lenovo Yoga 7 2-in-1 14AHP9 Arctic Grey
AMD Ryzen 5 8640HS, AMD Radeon 760M
122.6 (109.9min) fps -42%
Xiaomi RedmiBook Pro 14 2025
Intel Core Ultra 7 255H, Intel Arc Graphics 140T
109.1 (55.9min) fps -48%
HP EliteBook x360 1040 G11
Intel Core Ultra 7 165H, Intel Arc 8-Core iGPU
100.3 (58.7min) fps -52%
Asus ExpertBook P5 P5405-NZ0102X
Intel Core Ultra 7 258V, Intel Arc Graphics 140V
98.4 (62.5min) fps -53%
Lenovo ThinkPad X1 Carbon Gen 13 21NS0010GE
Intel Core Ultra 7 258V, Intel Arc Graphics 140V
97.5 (53.5min) fps -54%
1366x768 med (1/3)
Przeciętny AMD Radeon RX 8060S
  (177.2 - 192.3, n=2)
184.8 fps +4%
HP ZBook Ultra G1a 14
AMD Ryzen AI Max+ PRO 395, AMD Radeon RX 8060S
177.2 (149.1min) fps
Dell Precision 5000 5490
Intel Core Ultra 9 185H, NVIDIA RTX 3000 Ada Generation Laptop GPU
151.3 (116.2min) fps -15%
Lenovo Yoga Pro 7 14ASP G9
AMD Ryzen AI 9 365, AMD Radeon 880M
137.4 (113.8min) fps -22%
Asus VivoBook S 14 OLED M5406WA
AMD Ryzen AI 9 HX 370, AMD Radeon 890M
135.7 (116min) fps -23%
HP ZBook Firefly 14 G11
Intel Core Ultra 7 165H, NVIDIA RTX A500 Laptop GPU
130.5 (91.6min) fps -26%
Asus Zenbook 14 OLED UM3406HA
AMD Ryzen 7 8840HS, AMD Radeon 780M
111.7 (94min) fps -37%
Lenovo Yoga 7 2-in-1 14AHP9 Arctic Grey
AMD Ryzen 5 8640HS, AMD Radeon 760M
105.3 (88.2min) fps -41%
HP EliteBook x360 1040 G11
Intel Core Ultra 7 165H, Intel Arc 8-Core iGPU
94 (34.1min) fps -47%
Asus ExpertBook P5 P5405-NZ0102X
Intel Core Ultra 7 258V, Intel Arc Graphics 140V
88.8 (56.3min) fps -50%
Xiaomi RedmiBook Pro 14 2025
Intel Core Ultra 7 255H, Intel Arc Graphics 140T
78.3 (41.8min) fps -56%
Lenovo ThinkPad X1 Carbon Gen 13 21NS0010GE
Intel Core Ultra 7 258V, Intel Arc Graphics 140V
58 (29.6min) fps -67%
1920x1080 high (2/3)
Przeciętny AMD Radeon RX 8060S
  (147.7 - 164.4, n=2)
156.1 fps +6%
HP ZBook Ultra G1a 14
AMD Ryzen AI Max+ PRO 395, AMD Radeon RX 8060S
147.7 (129.4min) fps
Dell Precision 5000 5490
Intel Core Ultra 9 185H, NVIDIA RTX 3000 Ada Generation Laptop GPU
136 (107.4min) fps -8%
Lenovo Yoga Pro 7 14ASP G9
AMD Ryzen AI 9 365, AMD Radeon 880M
101.2 (91min) fps -31%
HP ZBook Firefly 14 G11
Intel Core Ultra 7 165H, NVIDIA RTX A500 Laptop GPU
96.2 (79.8min) fps -35%
Xiaomi RedmiBook Pro 14 2025
Intel Core Ultra 7 255H, Intel Arc Graphics 140T
88.1 (46min) fps -40%
Asus Zenbook 14 OLED UM3406HA
AMD Ryzen 7 8840HS, AMD Radeon 780M
80.6 (66.3min) fps -45%
Lenovo Yoga 7 2-in-1 14AHP9 Arctic Grey
AMD Ryzen 5 8640HS, AMD Radeon 760M
79.9 (71.1min) fps -46%
Lenovo ThinkPad X1 Carbon Gen 13 21NS0010GE
Intel Core Ultra 7 258V, Intel Arc Graphics 140V
78.6 (22.7min) fps -47%
HP EliteBook x360 1040 G11
Intel Core Ultra 7 165H, Intel Arc 8-Core iGPU
77.9 (45min) fps -47%
Asus ExpertBook P5 P5405-NZ0102X
Intel Core Ultra 7 258V, Intel Arc Graphics 140V
74.2 (42.1min) fps -50%
Asus VivoBook S 14 OLED M5406WA
AMD Ryzen AI 9 HX 370, AMD Radeon 890M
35.8 (16.9min) fps -76%
1920x1080 ultra (3/3) best looking
Przeciętny AMD Radeon RX 8060S
  (133.1 - 142, n=2)
137.6 fps +3%
HP ZBook Ultra G1a 14
AMD Ryzen AI Max+ PRO 395, AMD Radeon RX 8060S
133.1 (112.2min) fps
Dell Precision 5000 5490
Intel Core Ultra 9 185H, NVIDIA RTX 3000 Ada Generation Laptop GPU
123.3 (100.7min) fps -7%
Xiaomi RedmiBook Pro 14 2025
Intel Core Ultra 7 255H, Intel Arc Graphics 140T
94.9 (59.6min) fps -29%
HP ZBook Firefly 14 G11
Intel Core Ultra 7 165H, NVIDIA RTX A500 Laptop GPU
91.6 (73.4min) fps -31%
Lenovo Yoga Pro 7 14ASP G9
AMD Ryzen AI 9 365, AMD Radeon 880M
90.5 (80.2min) fps -32%
Asus ExpertBook P5 P5405-NZ0102X
Intel Core Ultra 7 258V, Intel Arc Graphics 140V
79.7 (52.9min) fps -40%
Asus Zenbook 14 OLED UM3406HA
AMD Ryzen 7 8840HS, AMD Radeon 780M
75 (63.4min) fps -44%
HP EliteBook x360 1040 G11
Intel Core Ultra 7 165H, Intel Arc 8-Core iGPU
74.4 (47.1min) fps -44%
Lenovo Yoga 7 2-in-1 14AHP9 Arctic Grey
AMD Ryzen 5 8640HS, AMD Radeon 760M
72.4 (62.2min) fps -46%
Lenovo ThinkPad X1 Carbon Gen 13 21NS0010GE
Intel Core Ultra 7 258V, Intel Arc Graphics 140V
65.6 (37.1min) fps -51%
Asus VivoBook S 14 OLED M5406WA
AMD Ryzen AI 9 HX 370, AMD Radeon 890M
33.6 (17.1min) fps -75%

Cyberpunk 2077 ultra FPS Chart

0510152025303540455055606570Tooltip
HP ZBook Ultra G1a 14 Ryzen AI Max+ PRO 395, Radeon RX 8060S: Ø72.6 (68.7-74)
lowmed.highultra
GTA V (2015) 184.4 177.7 164.3 86.6
Dota 2 Reborn (2015) 210 177.2 147.7 133.1
Final Fantasy XV Benchmark (2018) 192.9 122.6 84.8
X-Plane 11.11 (2018) 109.5 66.4 57.2
Far Cry 5 (2018) 116 96 95 92
Strange Brigade (2018) 491 218 188.6 171
Tiny Tina's Wonderlands (2022) 220.5 162.3 110.2 90
F1 22 (2022) 250 239 185.1 57.4
Baldur's Gate 3 (2023) 139.6 118.3 101.2 99.4
Cyberpunk 2077 2.2 Phantom Liberty (2023) 135.4 111.5 90.2 80.7
Monster Hunter Wilds (2025) 55.8 47 34.5

Emisje

Hałas systemowy

Wentylatory pozostają ciche na poziomie około 28 dB(A) na tle 24 dB(A) podczas uruchamiania niewymagających obciążeń, takich jak Excel lub przeglądarki. Jednak stosunkowo szybko wzrastają, gdy wprowadzane są wyższe obciążenia, aby być tak głośne, jak Precision 5490 przy prawie 50 dB (A).

Profil hałasu wentylatora (Biały: Tło, Czerwony: System bezczynny, Niebieski: 3DMark 06, Pomarańczowy: Cyberpunk 2077, Zielony: Prime95+FurMark stress)

Hałas

luz
23.9 / 23.9 / 26.8 dB
obciążenie
42.2 / 49.2 dB
  red to green bar
 
 
30 dB
cichy
40 dB(A)
słyszalny
50 dB(A)
irytujący
 
min: dark, med: mid, max: light   Earthworks M23R, Arta (odległość 15 cm)   hałas otoczenia: 23.9 dB(A)
dB(A) 0102030405060708090Deep BassMiddle BassHigh BassLower RangeMidsHigher MidsLower HighsMid HighsUpper HighsSuper Highs2037.138.338.638.935.62527.428.828.931.327.13126.326.227.929.625.74022.221.622.925.322.35028302930.726.76327.527.626.529.527.98029.626.724.629.729.510029.628.92727.828.912534.833.731.732.233.816028.524.218.219.129.4200272314.415.227.525029.82512.414.630.731531.426.11313.731.240033.32811.711.933.150033.529.311.712.333.763034.728.39.29.534.88003426.89.69.734.1100034.228.39.59.334.5125034.628.49.69.634.4160035.429.79.89.435.4200036.931.19.91036.8250037.631.610.310.237.4315039.133.110.810.839.440004133.911.31141.2500039.329.811.711.439.4630038.228.71211.538.1800034.724.712.211.634.91000032.522.412.212.532.6125002920.612.41229.11600025.318.212.11125.1SPL49.142.223.823.949.2N6.740.60.66.8median 34.2median 28.3median 11.7median 11.5median 34.1Delta3.42.82.22.23.6hearing rangehide median Fan NoiseHP ZBook Ultra G1a 14
HP ZBook Ultra G1a 14
Radeon RX 8060S, Ryzen AI Max+ PRO 395, WDC PC SN810 2TB
HP ZBook Firefly 14 G11
RTX A500 Laptop GPU, Ultra 7 165H, Kioxia XG8 KXG80ZNV512G
Lenovo ThinkPad X1 Carbon Gen 13 21NS0010GE
Arc 140V, Core Ultra 7 258V, SK hynix PCB01 HFS001TFM9X179N GL
Dell Precision 5000 5490
NVIDIA RTX 3000 Ada Generation Laptop GPU, Ultra 9 185H, Kioxia XG8 KXG80ZNV1T02
Asus ExpertBook P5 P5405-NZ0102X
Arc 140V, Core Ultra 7 258V, Western Digital PC SN5000S SDEQNSJ-1T00
Apple MacBook Pro 14 2024 M4 Pro
M4 Pro 20-Core GPU, M4 Pro (14 cores), Apple SSD AP2048Z
Noise
3%
12%
3%
15%
8%
wyłączone / środowisko *
23.9
24.3
-2%
23.2
3%
22.8
5%
24.1
-1%
23.9
-0%
Idle Minimum *
23.9
24.6
-3%
23.2
3%
23.8
-0%
24.1
-1%
23.9
-0%
Idle Average *
23.9
25.2
-5%
23.2
3%
23.8
-0%
24.1
-1%
23.9
-0%
Idle Maximum *
26.8
26.8
-0%
23.2
13%
24.7
8%
24.1
10%
23.9
11%
Load Average *
42.2
38.9
8%
29.9
29%
38.9
8%
31.2
26%
30.2
28%
Cyberpunk 2077 ultra *
49.1
41.8
15%
43.3
12%
31.7
35%
44.5
9%
Load Maximum *
49.2
45.8
7%
40.5
18%
51.4
-4%
31.2
37%
44.5
10%
Witcher 3 ultra *
49.9

* ... im mniej tym lepiej

Temperatura

Średnie temperatury powierzchni podczas pracy z wymagającymi obciążeniami są wyższe niż na Dell Precision 5490 ale chłodniejsze niż w MacBooku Pro 14. Podczas gdy gorące punkty znajdują się w kierunku środka klawiatury, podpórki pod nadgarstki mogą również stać się zauważalnie cieplejsze ze względu na gęsto upakowane elementy wewnętrzne i niewielką obudowę.

Podwójny tylny układ wydechowy
Zasilacz AC osiąga ponad 48 C podczas pracy z wymagającymi obciążeniami
w stresie
 35 °C41.4 °C34.2 °C 
 35.6 °C40 °C33.4 °C 
 30.6 °C31.6 °C28.2 °C 
maks. w ogóle: 41.4 °C
średnia: 34.4 °C
33.4 °C36.6 °C34.4 °C
32.6 °C35.8 °C32.6 °C
31.2 °C33 °C31.6 °C
maks. w ogóle: 36.6 °C
średnia: 33.5 °C
zasilacz  50 °C | temperatura otoczenia 20 °C | Fluke 62 Mini IR Thermometer
(±) Średnia temperatura górnej części przy maksymalnym obciążeniu wynosi 34.4 °C / 94 F, w porównaniu do średniej 32 °C / ###class_avg_f# ## F dla urządzeń w klasie Workstation.
(±) Maksymalna temperatura w górnej części wynosi 41.4 °C / 107 F, w porównaniu do średniej 38.2 °C / 101 F , począwszy od 22.2 do 69.8 °C dla klasy Workstation.
(+) Dno nagrzewa się maksymalnie do 36.6 °C / 98 F, w porównaniu do średniej 41.2 °C / 106 F
(±) W stanie bezczynności średnia temperatura górnej części wynosi 32.5 °C / 91 F, w porównaniu ze średnią temperaturą urządzenia wynoszącą 32 °C / ### class_avg_f### F.
(+) Podparcia dłoni i touchpad osiągają maksymalną temperaturę skóry (32 °C / 89.6 F) i dlatego nie są gorące.
(-) Średnia temperatura obszaru podparcia dłoni w podobnych urządzeniach wynosiła 27.8 °C / 82 F (-4.2 °C / -7.6 F).
System bezczynny (pokrywa C)
System bezczynny (pokrywa D)
Prime95+FurMark stress (okładka C)
Prime95+FurMark stres (okładka D)
HP ZBook Ultra G1a 14
AMD Ryzen AI Max+ PRO 395, AMD Radeon RX 8060S
HP ZBook Firefly 14 G11
Intel Core Ultra 7 165H, NVIDIA RTX A500 Laptop GPU
Lenovo ThinkPad X1 Carbon Gen 13 21NS0010GE
Intel Core Ultra 7 258V, Intel Arc Graphics 140V
Dell Precision 5000 5490
Intel Core Ultra 9 185H, NVIDIA RTX 3000 Ada Generation Laptop GPU
Asus ExpertBook P5 P5405-NZ0102X
Intel Core Ultra 7 258V, Intel Arc Graphics 140V
Apple MacBook Pro 14 2024 M4 Pro
Apple M4 Pro (14 cores), Apple M4 Pro 20-Core GPU
Heat
-2%
6%
2%
8%
9%
Maximum Upper Side *
41.4
42.8
-3%
42.3
-2%
43.2
-4%
41.6
-0%
47.3
-14%
Maximum Bottom *
36.6
44
-20%
40.1
-10%
38.4
-5%
43.2
-18%
44.2
-21%
Idle Upper Side *
34
30.6
10%
27.3
20%
31.6
7%
25.7
24%
22.1
35%
Idle Bottom *
33.6
31.4
7%
28.3
16%
30.6
9%
25.3
25%
22.1
34%

* ... im mniej tym lepiej

Głośniki

Głośniki są bardzo głośne i świetnie wyważone jak na 14-calową obudowę
dB(A) 0102030405060708090Deep BassMiddle BassHigh BassLower RangeMidsHigher MidsLower HighsMid HighsUpper HighsSuper Highs2037.138.637.12529.128.929.13128.127.928.14026.722.926.75030.82930.86330.526.530.58034.324.634.310044.22744.212552.631.752.616062.318.262.320065.214.465.225068.412.468.431574.21374.240075.311.775.350072.311.772.363070.39.270.380074.79.674.71000789.578125078.59.678.5160080.29.880.2200080.89.980.8250079.110.379.1315077.210.877.2400070.411.370.4500070.711.770.7630072.81272.8800067.912.267.91000068.512.268.51250071.312.471.31600067.812.167.8SPL88.723.888.7N78.30.678.3median 72.3median 11.7median 72.3Delta4.22.24.226.325.821.422.12624.925.127.622.532.523.448.72655.818.860.922.167.2267019.372.317.674.217.774.319.575.31571.711.871.311.27410.574.21072.710.17210.67210.97511.374.811.671.71269.71269.612.371.112.669.61270.111.269.824.784.70.666.6median 12median 71.73.42.2hearing rangehide median Pink NoiseHP ZBook Ultra G1a 14Apple MacBook Pro 16 2021 M1 Pro
Wykres częstotliwości (pola wyboru można zaznaczyć i odznaczyć, aby porównać urządzenia)
HP ZBook Ultra G1a 14 analiza dźwięku

(+) | głośniki mogą odtwarzać stosunkowo głośno (88.7 dB)
Bas 100 - 315 Hz
(±) | zredukowany bas - średnio 11.8% niższy od mediany
(±) | liniowość basu jest średnia (11% delta do poprzedniej częstotliwości)
Średnie 400 - 2000 Hz
(+) | zbalansowane środki średnie - tylko 4.5% od mediany
(+) | średnie są liniowe (3.4% delta do poprzedniej częstotliwości)
Wysokie 2–16 kHz
(+) | zrównoważone maksima - tylko 3.4% od mediany
(+) | wzloty są liniowe (4.3% delta do poprzedniej częstotliwości)
Ogólnie 100 - 16.000 Hz
(+) | ogólny dźwięk jest liniowy (10.4% różnicy w stosunku do mediany)
W porównaniu do tej samej klasy
» 6% wszystkich testowanych urządzeń w tej klasie było lepszych, 4% podobnych, 90% gorszych
» Najlepszy miał deltę 7%, średnia wynosiła ###średnia###%, najgorsza wynosiła 35%
W porównaniu do wszystkich testowanych urządzeń
» 4% wszystkich testowanych urządzeń było lepszych, 1% podobnych, 94% gorszych
» Najlepszy miał deltę 4%, średnia wynosiła ###średnia###%, najgorsza wynosiła 134%

Apple MacBook Pro 16 2021 M1 Pro analiza dźwięku

(+) | głośniki mogą odtwarzać stosunkowo głośno (84.7 dB)
Bas 100 - 315 Hz
(+) | dobry bas - tylko 3.8% od mediany
(+) | bas jest liniowy (5.2% delta do poprzedniej częstotliwości)
Średnie 400 - 2000 Hz
(+) | zbalansowane środki średnie - tylko 1.3% od mediany
(+) | średnie są liniowe (2.1% delta do poprzedniej częstotliwości)
Wysokie 2–16 kHz
(+) | zrównoważone maksima - tylko 1.9% od mediany
(+) | wzloty są liniowe (2.7% delta do poprzedniej częstotliwości)
Ogólnie 100 - 16.000 Hz
(+) | ogólny dźwięk jest liniowy (4.6% różnicy w stosunku do mediany)
W porównaniu do tej samej klasy
» 0% wszystkich testowanych urządzeń w tej klasie było lepszych, 0% podobnych, 100% gorszych
» Najlepszy miał deltę 5%, średnia wynosiła ###średnia###%, najgorsza wynosiła 45%
W porównaniu do wszystkich testowanych urządzeń
» 0% wszystkich testowanych urządzeń było lepszych, 0% podobnych, 100% gorszych
» Najlepszy miał deltę 4%, średnia wynosiła ###średnia###%, najgorsza wynosiła 134%

Zarządzanie energią

Zużycie energii

Szybka wydajność nie jest darmowa, ponieważ HP może być dość wymagający jak na 14-calową obudowę, czego przykładem są nasze wykresy porównawcze poniżej. Jest to również widoczne w przypadku masywnego (~14 x 6,5 x 2,8 cm) zasilacza sieciowego USB-C o mocy 140 W, podczas gdy większość 14-calowych laptopów jest dostarczana z mniejszymi i lżejszymi zasilaczami.

zużycie 3DMark 06
zużycie 3DMark 06
Cyberpunk 2077 1080p Ultra zużycie
Zużycie energii wzrosło do 128 W podczas inicjowania stresu Prime95, a następnie spadło do 118 W dziesięć sekund później
Prime95+FurMark stres zainicjowany w 10s mark
Pobór mocy
wyłączony / stan wstrzymaniadarklight 0.35 / 0.98 W
luzdarkmidlight 6.9 / 7.7 / 14.7 W
obciążenie midlight 83.3 / 126.3 W
 color bar
Legenda: min: dark, med: mid, max: light        Metrahit Energy
HP ZBook Ultra G1a 14
Ryzen AI Max+ PRO 395, Radeon RX 8060S, WDC PC SN810 2TB, OLED, 2880x1800, 14"
HP ZBook Firefly 14 G11
Ultra 7 165H, RTX A500 Laptop GPU, Kioxia XG8 KXG80ZNV512G, IPS, 2560x1600, 14"
Lenovo ThinkPad X1 Carbon Gen 13 21NS0010GE
Core Ultra 7 258V, Arc 140V, SK hynix PCB01 HFS001TFM9X179N GL, OLED, 2880x1800, 14"
Dell Precision 5000 5490
Ultra 9 185H, NVIDIA RTX 3000 Ada Generation Laptop GPU, Kioxia XG8 KXG80ZNV1T02, IPS, 2560x1600, 14"
Asus ExpertBook P5 P5405-NZ0102X
Core Ultra 7 258V, Arc 140V, Western Digital PC SN5000S SDEQNSJ-1T00, IPS LED, 2560x1600, 14"
Apple MacBook Pro 14 2024 M4 Pro
M4 Pro (14 cores), M4 Pro 20-Core GPU, Apple SSD AP2048Z, MiniLED, 3024x1964, 14.2"
Power Consumption
12%
53%
-32%
40%
19%
Idle Minimum *
6.9
6.6
4%
4.7
32%
11.1
-61%
3.9
43%
2.17
69%
Idle Average *
7.7
12.7
-65%
5.7
26%
14.8
-92%
8.9
-16%
10.9
-42%
Idle Maximum *
14.7
13.3
10%
6.1
59%
16.5
-12%
9.6
35%
11
25%
Load Average *
83.3
67
20%
29.8
64%
70.1
16%
43.4
48%
74.3
11%
Cyberpunk 2077 ultra external monitor *
110.5
58.1
47%
34.1
69%
41.8
62%
80.5
27%
Cyberpunk 2077 ultra *
110.9
63.4
43%
35.3
68%
42.8
61%
Load Maximum *
126.3
94.9
25%
60.1
52%
137.5
-9%
64.1
49%
98.1
22%
Witcher 3 ultra *
93.1

* ... im mniej tym lepiej

Power Consumption Cyberpunk / Stress Test

0102030405060708090100110120130Tooltip
HP ZBook Ultra G1a 14 Ryzen AI Max+ PRO 395, Radeon RX 8060S; 1280x720 Prime95 28.10 and Furmark 1.25: Ø114.6 (108.7-126.3)
Dell Precision 5000 5470 i9-12900H, RTX A1000 Laptop GPU; 1280x720 Prime95 28.10 and Furmark 1.25: Ø91.7 (82.8-137.5)
HP ZBook Ultra G1a 14 Ryzen AI Max+ PRO 395, Radeon RX 8060S; Idle 150cd/m2: Ø7.15 (6.18-10.1)
HP ZBook Ultra G1a 14 Ryzen AI Max+ PRO 395, Radeon RX 8060S; Cyberpunk 2077 FHD ultra no FSR 150cd: Ø110.9 (109.4-112.3)

Power Consumption external Monitor

0102030405060708090100110120130Tooltip
HP ZBook Ultra G1a 14 Ryzen AI Max+ PRO 395, Radeon RX 8060S; Prime95 V2810 Stress (external Monitor): Ø116.5 (109.1-127.5)
Dell Precision 5000 5470 i9-12900H, RTX A1000 Laptop GPU; Prime95 V2810 Stress (external Monitor): Ø52 (41-137.5)
HP ZBook Ultra G1a 14 Ryzen AI Max+ PRO 395, Radeon RX 8060S; Cinebench R15 Multi (external Monitor): Ø115.3 (111.6-122.6)
Dell Precision 5000 5470 i9-12900H, RTX A1000 Laptop GPU; Cinebench R15 Multi (external Monitor): Ø100.6 (86.1-124)
HP ZBook Ultra G1a 14 Ryzen AI Max+ PRO 395, Radeon RX 8060S; 1280x720 FurMark 1.19 GPU Stress Test (external Monitor): Ø110.3 (105.7-122.5)
Dell Precision 5000 5470 i9-12900H, RTX A1000 Laptop GPU; 1280x720 FurMark 1.19 GPU Stress Test (external Monitor): Ø63.9 (57.8-69.7)
HP ZBook Ultra G1a 14 Ryzen AI Max+ PRO 395, Radeon RX 8060S; Idle 1min (external Monitor): Ø7.45 (5.94-18.1)
HP ZBook Ultra G1a 14 Ryzen AI Max+ PRO 395, Radeon RX 8060S; Cyberpunk 2077 FHD ultra no FSR (external Monitor): Ø110.5 (106.7-112.9)

Żywotność baterii

Ogólny czas pracy jest krótszy niż w przypadku wielu 14-calowych laptopów, częściowo ze względu na ogólnie wyższy poziom zużycia, jak wspomniano powyżej.

Wydajność akumulatora
WiFi Websurfing
7h 01min
HP ZBook Ultra G1a 14
Ryzen AI Max+ PRO 395, Radeon RX 8060S, 74.5 Wh
HP ZBook Firefly 14 G11
Ultra 7 165H, RTX A500 Laptop GPU, 56 Wh
Lenovo ThinkPad X1 Carbon Gen 13 21NS0010GE
Core Ultra 7 258V, Arc 140V, 57 Wh
Dell Precision 5000 5490
Ultra 9 185H, NVIDIA RTX 3000 Ada Generation Laptop GPU, 72 Wh
Asus ExpertBook P5 P5405-NZ0102X
Core Ultra 7 258V, Arc 140V, 63 Wh
Apple MacBook Pro 14 2024 M4 Pro
M4 Pro (14 cores), M4 Pro 20-Core GPU, 72.6 Wh
Czasy pracy
23%
56%
56%
131%
125%
WiFi v1.3
421
517
23%
658
56%
658
56%
973
131%
947
125%
Cyberpunk 2077 ultra 150cd
94
Load
86
173
H.264
1186

Ocena Notebookcheck

HP ZBook Ultra G1a 14 - 11/04/2025 v8
Allen Ngo

Wykonanie
91 / 98 → 93%
Klawiatura
95%
Myszka
92%
Komunikacja
72 / 80 → 89%
Waga
68 / 10-66 → 100%
Akumulator
74 / 95 → 78%
Wyświetlacz
79%
Wydajność w grach
79%
Wydajność w programach użytkowych
88%
Workstation
88%
AI Performance
95%
Temperatura
90 / 95 → 95%
Hałas
78 / 90 → 87%
Głośniki
85%
Kamerka
46 / 75 → 61%
Średnio
72%
87%
Workstation - Ważona średnia
CO2 Emissions
No Data
Materials
75%
Packaging
75%
Power Use
79.8%
Repairability
50%
Software Updates
22.3%
Recycle Logo Total Sustainability Score: 50.4%

Potential Competitors in Comparison

Obraz
Model / recenzja
Cena
Waga
Wysokość
Ekran
1.
87.4%
HP ZBook Ultra G1a 14
AMD Ryzen AI Max+ PRO 395 ⎘
AMD Radeon RX 8060S ⎘
128 GB Pamięć, 2048 GB SSD
Amazon:
1. $1,099.00
HP ZBook 14 Firefly G11 (Lat...
2. $1,049.00
HP ZBook Firefly G11 14” A...
3. $1,249.99
HP ZBook Firefly G11 Mobile ...
Cena katalogowa: 4000 USD
1.6 kg18.5 mm14.00"
2880x1800
243 PPI
OLED

Przezroczystość

Wyboru urządzeń do recenzji dokonuje nasza redakcja. Próbka testowa została udostępniona autorowi jako pożyczka od producenta lub sprzedawcy detalicznego na potrzeby tej recenzji. Pożyczkodawca nie miał wpływu na tę recenzję, producent nie otrzymał też kopii tej recenzji przed publikacją. Nie było obowiązku publikowania tej recenzji. Nigdy nie przyjmujemy rekompensaty ani płatności w zamian za nasze recenzje. Jako niezależna firma medialna, Notebookcheck nie podlega władzy producentów, sprzedawców detalicznych ani wydawców.

Tak testuje Notebookcheck

Każdego roku Notebookcheck niezależnie sprawdza setki laptopów i smartfonów, stosując standardowe procedury, aby zapewnić porównywalność wszystkich wyników. Od około 20 lat stale rozwijamy nasze metody badawcze, ustanawiając przy tym standardy branżowe. W naszych laboratoriach testowych doświadczeni technicy i redaktorzy korzystają z wysokiej jakości sprzętu pomiarowego. Testy te obejmują wieloetapowy proces walidacji. Nasz kompleksowy system ocen opiera się na setkach uzasadnionych pomiarów i benchmarków, co pozwala zachować obiektywizm.
Please share our article, every link counts!
Mail Logo
> laptopy testy i recenzje notebooki > Laptopy > Recenzja HP ZBook Ultra G1a 14: Wydajna alternatywa dla MacBooka Pro do pracy i gier
Allen Ngo, 2025-04-15 (Update: 2025-04-15)