Notebookcheck Logo
Teaser

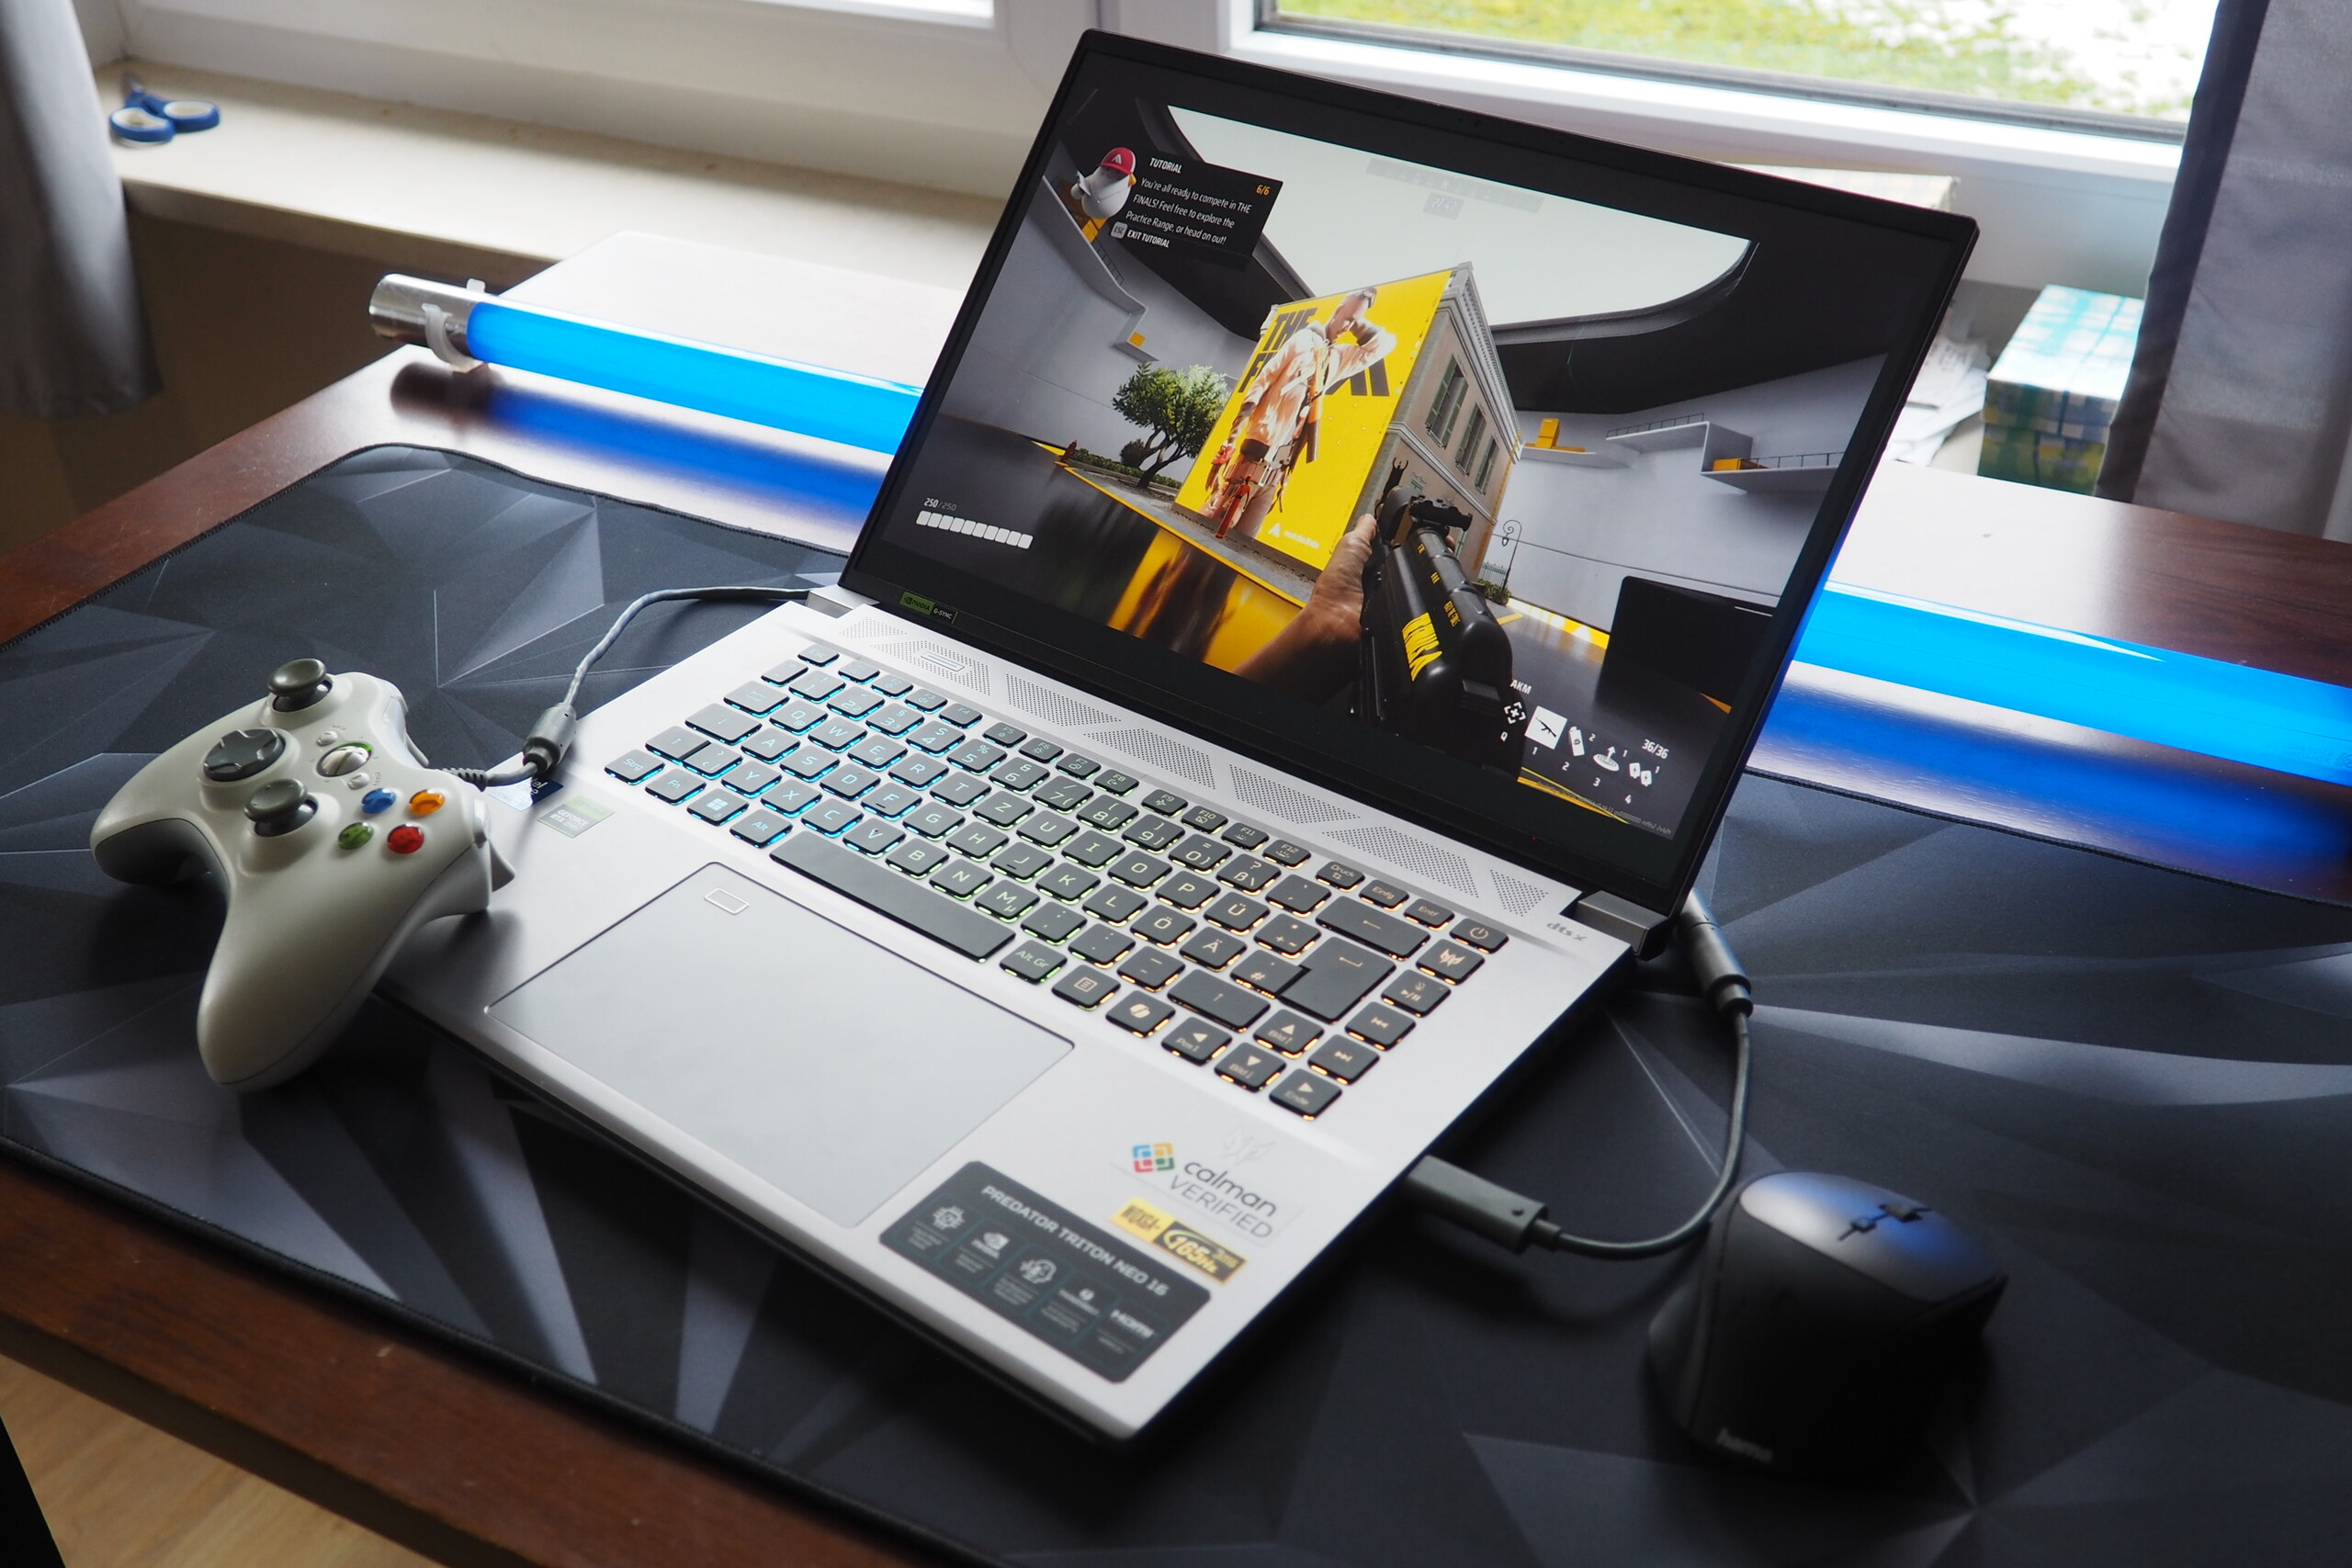
Recenzja Acer Predator Triton Neo 16: Laptop premium z RTX 4070 dla graczy i twórców

Doskonały wyświetlacz.

Podczas gdy Nitro V 16, który niedawno testowaliśmy, zrobił na nas ograniczone wrażenie ze względu na słaby wyświetlacz, Predator Triton Neo 16 wypadł znacznie lepiej. Przetestowaliśmy 16-calowego gracza z procesorem Meteor Lake i kartą graficzną GeForce RTX 4070.
Florian Glaser, 👁 Florian Glaser (tłumaczenie DeepL / Ninh Duy) Published 🇺🇸 🇩🇪 ...
Intel Meteor Lake Arc Nvidia Geforce Gaming Laptop / Notebook

Werdykt - Cukierki dla oczu od Acer

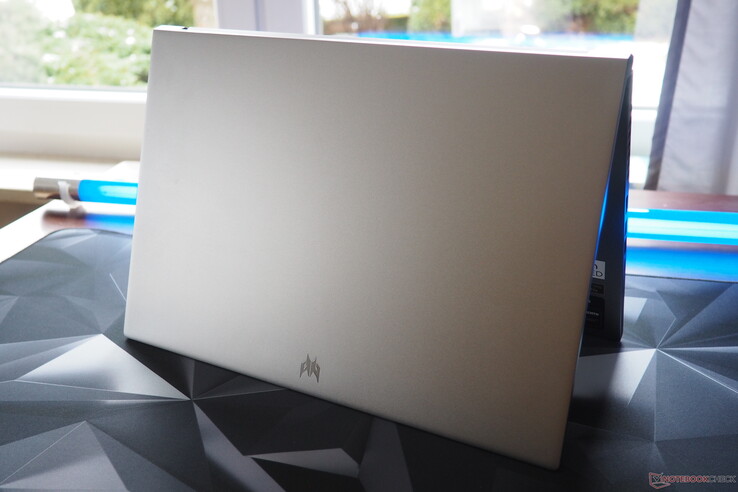
Jeśli szukają Państwo wysokiej jakości i eleganckiego laptopa do gier i tworzenia, to Predator Triton Neo 16 może być właśnie dla Państwa. Acer nie tylko nadał temu 16-calowemu urządzeniu absurdalnie długą nazwę, ale także stabilną metalową obudowę, której srebrnoszare powierzchnie ledwo przyciągają ślady odcisków palców. Jego opcje łączności również nie są zbyt kiepskie dzięki obsłudze USB 4. Ponadto, jakość obrazu Neo 16 jest równie imponująca. Jego 165-Hz ekran oparty na technologii IPS zapewnia dobre poziomy jasności, wysoką rozdzielczość (3200 x 2000 pikseli), duże pokrycie przestrzeni kolorów i, dzięki certyfikatowi Calman, przyzwoitą dokładność kolorów.

Z drugiej strony, wydajność GPU nie jest tak imponująca. Karta GeForce RTX 4070 może rozwinąć tylko ograniczoną część swojej potencjalnej wydajności i balansuje poniżej naszej wcześniej ustalonej średniej. Co więcej, nie ma zbyt wielu opcji konserwacji i aktualizacji. Chociaż 16-calowe urządzenie ma dwa gniazda M.2 (z których jedno jest nadal wolne), jego pamięć RAM została przylutowana - 32 GB, które posiada nasze urządzenie testowe, prawdopodobnie powinno wystarczyć większości użytkowników na razie. Podsumowując, oceniamy Predator Triton Neo 16 jako dobry, ale nie wybitny laptop do gier i tworzenia.

Konkurencja obejmuje inne 16-calowe urządzenia z RTX 4070, takie jak Asus ProArt P16 H7606WI, Lenovo Yoga Pro 9 16IMH9, Asus ROG Zephyrus G16 GU605M i Alienware m16 R2, które są jednak generalnie droższe.

Za

+ elegancka i wysokiej jakości obudowa
+ jasny i żywy wyświetlacz
+ dwa gniazda M.2 (jedno niezajęte)
+ solidna żywotność baterii
+ dobre urządzenia wejściowe
+ USB 4

Przeciw

- RTX 4070 działa poniżej swoich możliwości
- kontrola wentylatorów mogłaby być lepsza
- Pamięci RAM nie można wymienić
- przeciętny dźwięk
- Dysk SSD jest dławiony

Cena i dostępność

Obecnie Acer Predator Triton Neo 16 PTN16-51-978P jest dostępny za pośrednictwem głównych sklepów internetowych, takich jak Amazon, gdzie kosztuje 1399 USD.

Porównanie możliwych alternatyw

Image
Model / Review
Price
Weight
Height
Display
1.
81.1%
Acer Predator Triton Neo 16 PTN16-51-978P
Intel Core Ultra 9 185H ⎘
NVIDIA GeForce RTX 4070 Laptop GPU ⎘
32 GB Pamięć, 1024 GB SSD
Amazon:
1. $1,088.49
Acer Predator Triton Neo 16 ...
2. $1,089.00
Acer Predator Triton Neo 16 ...
3. $2,058.01
acer Predator Triton Neo 16 ...
List Price: 1900 EUR
2 kg21 mm16.00"
3200x2000
236 PPI
IPS
2.
87.8%
Asus ProArt P16 H7606WI
AMD Ryzen AI 9 HX 370 ⎘
NVIDIA GeForce RTX 4070 Laptop GPU ⎘
64 GB Pamięć, 1024 GB SSD
Amazon:
1. $2,879.00
HIDevolution [2024] ASUS Pro...
2. $2,239.00
ASUS ProArt P16 Laptop, AMD ...
3. $93.99
20V 10A 200W Laptop Charger ...
List Price: 4000€
1.8 kg17.3 mm16.00"
3840x2400
283 PPI
OLED
3.
88.7% v7 (old)
Lenovo Yoga Pro 9 16IMH9
Intel Core Ultra 9 185H ⎘
NVIDIA GeForce RTX 4070 Laptop GPU ⎘
32 GB Pamięć, 1024 GB SSD
Amazon:
1. $2,099.99
Lenovo Yoga Pro 9i 16"" Lapt...
2. $38.99
170W Charger Fit for Lenovo ...
3. $38.00
Laptop Keyboard for Lenovo Y...
List Price: 2700€
2.1 kg18.3 mm16.00"
3200x2000
236 PPI
Mini-LED
4.
92.3% v7 (old)
Asus ROG Zephyrus G16 2024 GU605M
Intel Core Ultra 7 155H ⎘
NVIDIA GeForce RTX 4070 Laptop GPU ⎘
16 GB Pamięć, 1024 GB SSD
Amazon: $1,888.86
List Price: 3000€
1.8 kg16.4 mm16.00"
2560x1600
189 PPI
OLED
5.
90.2% v7 (old)
Alienware m16 R2
Alienware m16 R2
Intel Core Ultra 7 155H ⎘
NVIDIA GeForce RTX 4070 Laptop GPU ⎘
16 GB Pamięć, 1024 GB SSD
Amazon: $1,899.00
List Price: 1850 USD
2.5 kg23.5 mm16.00"
2560x1600
189 PPI
IPS

Acer wyposażył naszą testową konfigurację w Core Ultra 9 185H z serii Meteor Lake oraz - jak wspomniano wcześniej - w kartę graficzną GeForce RTX 4070. Posiada również imponujące 32 GB pamięci RAM LPDDR5X. Zainstalowany dysk SSD NVMe ma pojemność 1 TB. Ekran laptopa ma proporcje 16:10, a jego system operacyjny to Windows 11 Home. Pojemność baterii wynosząca 76 Wh nie jest ani niska, ani szczególnie hojna.

Specyfikacje

Acer Predator Triton Neo 16 PTN16-51-978P (Predator Triton Neo 16 Rodzina)
Procesor
Intel Core Ultra 9 185H 16 x 3.8 - 5.1 GHz, 85 W PL2 / Short Burst, 65 W PL1 / Sustained, Meteor Lake-H
Karta grafiki
NVIDIA GeForce RTX 4070 Laptop GPU - 8 GB VRAM, rdzeń: 1695 MHz, pamięć: 1975 MHz, 110 W TDP, GDDR6, ForceWare 566.36, Optimus
Pamięć
32 GB 
, LPDDR5X soldered (no expansion)
Matryca
16.00 cali 16:10, 3200 x 2000 pikseli 236 PPI, AU Optronics B160QAN04.S, IPS, Calman Verified, refleksująca: nie, 165 Hz, Adaptive Sync
Chipset
Intel Meteor Lake-U/P/H PCH
Dysk twardy
SK Hynix PC801 HFS001TEJ9X125N, 1024 GB 
, NVMe-SSD, two M.2 slots (one empty)
Karta dźwiękowa
Intel Meteor Lake-U/P/H PCH - cAVS (Audio, Voice, Speech)
Złącza
3 USB 3.1 Gen2, 1 USB 4.0 40 Gbps, 1 Thunderbolt, USB-C Power Delivery (PD), 1 HDMI, 1 DisplayPort, gniazda audio: Combined (Line-In/Out), czytnik kart: microSD, 1 czytnik linii papilarnych
Łączność
Intel Killer Wi-Fi 6E AX1675x (210NGW) (b/g/n = Wi-Fi 4/ac = Wi-Fi 5/ax = Wi-Fi 6/ Wi-Fi 6E 6 GHz), Bluetooth 5.3
Gabaryty
wysokość x szerokość x głębokość (mm): 21 x 356 x 249
Akumulator
76 Wh
System operacyjny
Microsoft Windows 11 Home
Camera
kamerka: 2 MP
Inne
głośniki: 2.0, klawiatura: Chiclet RGB, podświetlanie klawiatury: tak, 230 W Power Supply, Predator Sense, 24 miesiące(y) gwarancji
Waga
2.032 kg, zasilacz: 795 g
Cena
1900 EUR
Note: The manufacturer may use components from different suppliers including display panels, drives or memory sticks with similar specifications.


Sprawa

Jedną z największych zalet Predator Triton jest jego elegancka i ładnie wyglądająca obudowa. Jej metalowe powierzchnie pozostawiają wrażenie wysokiej jakości, a dzięki jasnemu kolorowi prawie nie przyciągają odcisków palców. Stabilność obudowy jest równie dobra, z wyjątkiem kilku szczegółów (touchpad ustępuje dość mocno w niektórych miejscach). Acer zasługuje również na pochwałę za dobrze działające zawiasy urządzenia, choć ich maksymalny kąt otwarcia wynoszący ok. 135° mógłby być nieco szerszy. Z drugiej strony, nie mamy nic do zarzucenia jakości wykonania.

Acer Predator Triton Neo 16

Przy wadze około 2 kg, 16-calowe urządzenie plasuje się pomiędzy swoimi konkurentami, którzy ważą od 1,8 do 2,5 kg. Ich wysokość i podstawowe wymiary są podobne: również tutaj laptop Acer zapewnia wygodę w środku pola.

Porównanie rozmiarów

363.9 mm 249.4 mm 23.5 mm 2.5 kg362.72 mm 253.69 mm 18.3 mm 2.1 kg356 mm 249 mm 21 mm 2 kg354.9 mm 246.9 mm 17.3 mm 1.8 kg354 mm 246 mm 16.4 mm 1.8 kg297 mm 210 mm 1 mm 5.7 g

Łączność

Porty

Neo 16 oferuje szeroką gamę portów. Podczas gdy po lewej stronie znajduje się złącze zasilania, gniazdo audio i dwa porty USB-C (1x USB 4 z DisplayPort 1.4 i PowerDelivery), prawa strona jest wyposażona w czytnik kart micro SD, dwa porty USB-A (3.1 Gen 2), HDMI 2.1 i otwór na blokady Kensington. Mimo to, Acer powinien był dodać port RJ45 do urządzenia, aby zapewnić mu bardzo dobrą ocenę łączności.

Lewa strona: Zasilanie, USB-C 4 (w tym DisplayPort 1.4 i PowerDelivery), USB-C 3.1 Gen 2, audio
Prawa strona: microSD, 2x USB-A 3.1 Gen 2, HDMI 2.1, Kensington Lock

Czytnik kart SD

Czytnik kart w laptopie osiągnął podczas naszego testu przeciętną prędkość około 90 MB/s. Czytnik Alienware m16 i Asus ProArt P16 wypadły znacznie lepiej, jeśli chodzi o odczyt sekwencyjny.

SD Card Reader
average JPG Copy Test (av. of 3 runs)
Asus ProArt P16 H7606WI
AMD Ryzen AI 9 HX 370 (Angelbird AV Pro V60)
127 MB/s +46%
Average of class Gaming
  (19 - 202, n=87, last 2 years)
96 MB/s +10%
Acer Predator Triton Neo 16 PTN16-51-978P
Intel Core Ultra 9 185H (AV PRO microSD 128 GB V60)
87 MB/s
Asus ROG Zephyrus G16 2024 GU605M
Intel Core Ultra 7 155H
78.7 MB/s -10%
Lenovo Yoga Pro 9 16IMH9
Intel Core Ultra 9 185H (Angelbird AV Pro V60)
78.3 MB/s -10%
Alienware m16 R2
Intel Core Ultra 7 155H (AV PRO microSD 128 GB V60)
75.3 MB/s -13%
maximum AS SSD Seq Read Test (1GB)
Asus ProArt P16 H7606WI
AMD Ryzen AI 9 HX 370 (Angelbird AV Pro V60)
254.4 MB/s +183%
Alienware m16 R2
Intel Core Ultra 7 155H (AV PRO microSD 128 GB V60)
205.32 MB/s +128%
Average of class Gaming
  (25.8 - 269, n=87, last 2 years)
120.4 MB/s +34%
Acer Predator Triton Neo 16 PTN16-51-978P
Intel Core Ultra 9 185H (AV PRO microSD 128 GB V60)
90 MB/s
Asus ROG Zephyrus G16 2024 GU605M
Intel Core Ultra 7 155H
89.9 MB/s 0%
Lenovo Yoga Pro 9 16IMH9
Intel Core Ultra 9 185H (Angelbird AV Pro V60)
89.9 MB/s 0%

Komunikacja

Jego moduł bezprzewodowy nosi nazwę Killer Wi-Fi 6E AX1675x i działał solidnie (nadawanie) do bardzo dobrze (odbiór) podczas naszego testu zasięgu w odległości 1 metra od routera referencyjnego.

Networking
iperf3 transmit AXE11000
Asus ProArt P16 H7606WI
Mediatek Wi-Fi 7 MT7925 Wireless LAN Card
1788 (1649min - 1890max) MBit/s +108%
Asus ROG Zephyrus G16 2024 GU605M
Intel Wi-Fi 6E AX211
1654 (1599min, 1600.16P1 - 1713max) MBit/s +93%
Lenovo Yoga Pro 9 16IMH9
Intel Wi-Fi 6E AX211
1650 (1445min - 1723max) MBit/s +92%
Average of class Gaming
  (469 - 1843, n=147, last 2 years)
1228 MBit/s +43%
Alienware m16 R2
Intel Wi-Fi 7 BE202
1205 (875min - 1438max) MBit/s +40%
Acer Predator Triton Neo 16 PTN16-51-978P
Intel Killer Wi-Fi 6E AX1675x (210NGW)
859 (707min - 1085max) MBit/s
Average Intel Killer Wi-Fi 6E AX1675x (210NGW)
  (703 - 859, n=5)
779 MBit/s -9%
iperf3 receive AXE11000
Acer Predator Triton Neo 16 PTN16-51-978P
Intel Killer Wi-Fi 6E AX1675x (210NGW)
1711 (1658min - 1732max) MBit/s
Asus ProArt P16 H7606WI
Mediatek Wi-Fi 7 MT7925 Wireless LAN Card
1699 (1607min - 1729max) MBit/s -1%
Lenovo Yoga Pro 9 16IMH9
Intel Wi-Fi 6E AX211
1654 (1568min - 1702max) MBit/s -3%
Asus ROG Zephyrus G16 2024 GU605M
Intel Wi-Fi 6E AX211
1600 (1564min, 1564.87P1 - 1627max) MBit/s -6%
Average of class Gaming
  (680 - 1890, n=147, last 2 years)
1397 MBit/s -18%
Alienware m16 R2
Intel Wi-Fi 7 BE202
1227 (1074min - 1317max) MBit/s -28%
Average Intel Killer Wi-Fi 6E AX1675x (210NGW)
  (774 - 1711, n=5)
1021 MBit/s -40%
050100150200250300350400450500550600650700750800850900950100010501100115012001250130013501400145015001550160016501700175018001850Tooltip
Acer Predator Triton Neo 16 PTN16-51-978P Intel Killer Wi-Fi 6E AX1675x (210NGW); iperf3 transmit AXE11000; iperf 3.1.3: Ø859 (707-1085)
Asus ProArt P16 H7606WI Mediatek Wi-Fi 7 MT7925 Wireless LAN Card; iperf3 transmit AXE11000; iperf 3.1.3: Ø1788 (1649-1890)
Lenovo Yoga Pro 9 16IMH9 Intel Wi-Fi 6E AX211; iperf3 transmit AXE11000; iperf 3.1.3: Ø1650 (1445-1723)
Asus ROG Zephyrus G16 2024 GU605M Intel Wi-Fi 6E AX211; iperf3 transmit AXE11000: Ø1654 (1599-1713)
Alienware m16 R2 Intel Wi-Fi 7 BE202; iperf3 transmit AXE11000; iperf 3.1.3: Ø1205 (875-1438)
Acer Predator Triton Neo 16 PTN16-51-978P Intel Killer Wi-Fi 6E AX1675x (210NGW); iperf3 receive AXE11000; iperf 3.1.3: Ø1711 (1658-1732)
Asus ProArt P16 H7606WI Mediatek Wi-Fi 7 MT7925 Wireless LAN Card; iperf3 receive AXE11000; iperf 3.1.3: Ø1698 (1607-1729)
Lenovo Yoga Pro 9 16IMH9 Intel Wi-Fi 6E AX211; iperf3 receive AXE11000; iperf 3.1.3: Ø1654 (1568-1702)
Asus ROG Zephyrus G16 2024 GU605M Intel Wi-Fi 6E AX211; iperf3 receive AXE11000: Ø1600 (1564-1627)
Alienware m16 R2 Intel Wi-Fi 7 BE202; iperf3 receive AXE11000; iperf 3.1.3: Ø1227 (1074-1317)

Kamera internetowa

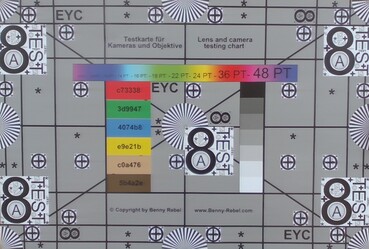
Kamera internetowa urządzenia o rozdzielczości 2 MP jest nieco ostrzejsza i dokładniej odwzorowuje kolory niż w większości laptopów do gier, ale nie można oczekiwać cudów. Nie ma osłony zapewniającej dodatkową prywatność.
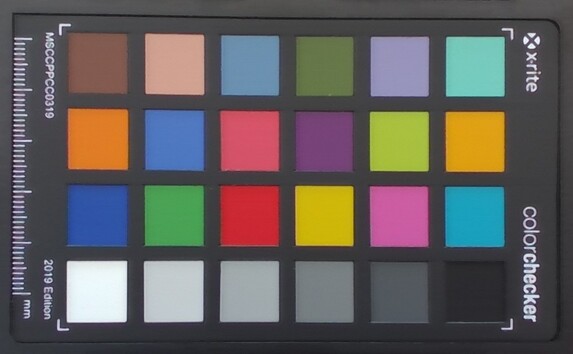
ColorChecker
4.8 ∆E
3.7 ∆E
8.2 ∆E
5.2 ∆E
6.9 ∆E
4.7 ∆E
2.4 ∆E
10.7 ∆E
4.2 ∆E
6.2 ∆E
2.6 ∆E
1.8 ∆E
8 ∆E
4.7 ∆E
6 ∆E
5.2 ∆E
4.1 ∆E
9.5 ∆E
4.8 ∆E
3.9 ∆E
5.4 ∆E
5 ∆E
4 ∆E
5.2 ∆E
ColorChecker Acer Predator Triton Neo 16 PTN16-51-978P: 5.29 ∆E min: 1.77 - max: 10.67 ∆E

Akcesoria

Laptop Acer jest dostarczany z 230-watowym zasilaczem i wieloma ulotkami informacyjnymi.

Konserwacja

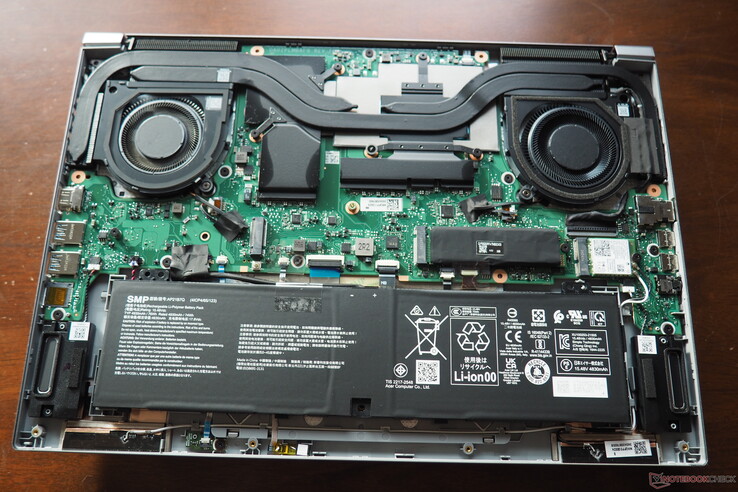
Dość ciasno przylegająca płyta bazowa jest zabezpieczona 11 śrubami Torx. Wewnątrz obraz jest dość schludny i prosty. Oprócz modułu bezprzewodowego, można wyjąć tylko dysk SSD i baterię. System chłodzenia laptopa (który według Acer wykorzystuje ciekły metal) składa się z dwóch wentylatorów i kilku rurek cieplnych.

Acer Predator Triton Neo 16

Zrównoważony rozwój

Acer odnosi się do "Post Consumer Recycled" na jednej z naklejek na obudowie. Opakowanie składa się głównie z kartonu. Laptop jest zapakowany w płócienną torbę, a zasilacz w plastikową folię (każdy typ jest oznaczony).

Gwarancja

Laptop jest objęty standardową 12-miesięczną gwarancją w USA.

Urządzenia wejściowe

Klawiatura

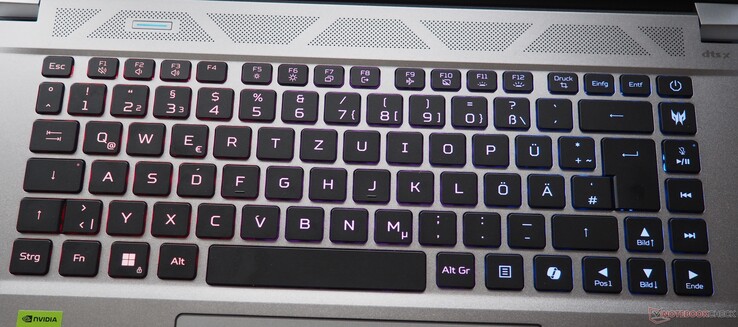
Jak na model z gumową kopułką, klawiatura zapewnia więcej niż przyzwoite sprzężenie zwrotne i wyczucie pisania. Acer wybrał dość klasyczny układ, w którym producent zrezygnował z klawiatury numerycznej i ograniczył się do jednej kolumny po prawej stronie "głównego bloku", który jest przeznaczony do sterowania multimediami i otwierania oprogramowania systemowego Predator Sense. Z wyjątkiem wiersza funkcyjnego, wszystkie klawisze są rozsądnej wielkości - w tym strzałki kierunkowe. Gracze mogą liczyć na wielopoziomowe, regulowane podświetlenie RGB podzielone na trzy strefy.

Acer Predator Triton Neo 16

Panel dotykowy

Przy rozmiarze 15 x 9 cm, touchpad urządzenia jest wyjątkowo duży, ale naszym zdaniem mógłby być nieco bardziej stabilny, ponieważ kliknięcia w lewo w szczególności prowadzą do zauważalnego ugięcia. Jego powierzchnię opisalibyśmy jako przyjemną i gładką. Nie mamy również nic do zarzucenia obsłudze gestów i wielodotyku.

Wyświetlacz

W przeciwieństwie do Nitro V 16który musi zadowolić się ograniczoną przestrzenią kolorów i stosunkowo niską jasnością, Predator Triton Neo 16 może pochwalić się wysokiej jakości panelem IPS.

483
cd/m²
475
cd/m²
439
cd/m²
455
cd/m²
458
cd/m²
437
cd/m²
438
cd/m²
442
cd/m²
452
cd/m²
podświetlenie ekranu
AU Optronics B160QAN04.S tested with X-Rite i1Pro 2
maksimum: 483 cd/m² (Nits) średnia: 453.2 cd/m² Minimum: 20 cd/m²
rozświetlenie: 90 %
na akumulatorze: 458 cd/m²
kontrast: 1090:1 (czerń: 0.42 cd/m²)
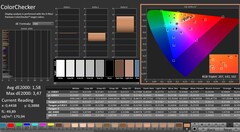
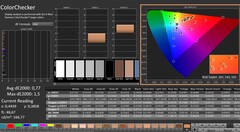
ΔE Color 1.58 | 0.5-29.43 Ø4.91, calibrated: 0.77
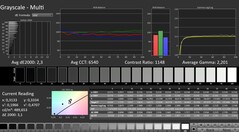
ΔE Greyscale 2.3 | 0.5-98 Ø5.2
85.3% AdobeRGB 1998 (Argyll 2.2.0 3D)
99.7% sRGB (Argyll 2.2.0 3D)
94.2% Display P3 (Argyll 2.2.0 3D)
Gamma: 2.201
Acer Predator Triton Neo 16 PTN16-51-978P
AU Optronics B160QAN04.S, IPS, 3200x2000, 16", 165 Hz
Asus ProArt P16 H7606WI
ATNA60YV02-0, OLED, 3840x2400, 16", 60 Hz
Lenovo Yoga Pro 9 16IMH9
LEN160-3.2K, Mini-LED, 3200x2000, 16", 165 Hz
Asus ROG Zephyrus G16 2024 GU605M
ATNA60DL01-0, OLED, 2560x1600, 16", 240 Hz
Alienware m16 R2
BOE NE16NYH, IPS, 2560x1600, 16", 240 Hz
Display
7%
2%
7%
-14%
Display P3 Coverage
94.2
99.9
6%
97
3%
99.9
6%
71
-25%
sRGB Coverage
99.7
100
0%
99.9
0%
100
0%
100
0%
AdobeRGB 1998 Coverage
85.3
99.1
16%
86.6
2%
96.9
14%
71.4
-16%
Response Times
83%
-137%
97%
2%
Response Time Grey 50% / Grey 80% *
12.3 ?(5.9, 6.4)
1.58 ?(0.84, 0.74)
87%
22.2 ?(9.6, 12.6)
-80%
0.22 ?(0.11, 0.11)
98%
5.7 ?(2.6, 3.1)
54%
Response Time Black / White *
5.8 ?(2.2, 3.6)
1.25 ?(0.67, 0.58)
78%
17 ?(8.2, 8.8)
-193%
0.25 ?(0.13, 0.12)
96%
8.7 ?(4.6, 4.1)
-50%
PWM Frequency
240 ?(52, 93)
4840 ?(100)
960 ?(60)
Screen
11%
29%
2%
-2%
Brightness middle
458
355
-22%
651
42%
416
-9%
345.8
-24%
Brightness
453
360
-21%
673
49%
418
-8%
337
-26%
Brightness Distribution
90
98
9%
93
3%
96
7%
87
-3%
Black Level *
0.42
0.22
48%
0.3
29%
Contrast
1090
2959
171%
1153
6%
Colorchecker dE 2000 *
1.58
1.2
24%
1.9
-20%
1.6
-1%
1.99
-26%
Colorchecker dE 2000 max. *
3.47
2.6
25%
4.2
-21%
2.1
39%
3.52
-1%
Colorchecker dE 2000 calibrated *
0.77
0.6
22%
0.62
19%
Greyscale dE 2000 *
2.3
1.2
48%
3
-30%
2.7
-17%
2.1
9%
Gamma
2.201 100%
2.14 103%
2.18 101%
2.16 102%
2.32 95%
CCT
6540 99%
6526 100%
6738 96%
6331 103%
6369 102%
Total Average (Program / Settings)
34% / 23%
-35% / -0%
35% / 20%
-5% / -4%

* ... im mniej tym lepiej

Średnia jasność 453 cd/m² jest nie tylko wystarczająca do użytku w pomieszczeniach, ale - w zależności od warunków oświetleniowych - również do użytku na zewnątrz. Tymczasem jego współczynnik kontrastu jest tylko solidny i wynosi nieco poniżej 1100:1, co wynika ze słabego poziomu czerni (0,42 cd/m²). Tutaj panele OLED niektórych konkurentów pokazują, że można to zrobić lepiej, a to samo można powiedzieć o czasach reakcji (choć są one całkiem dobre jak na panel IPS).

CalMAN: Skala szarości
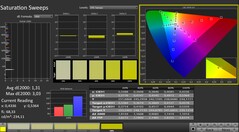
CalMAN: Nasycenie kolorów
CalMAN: ColorChecker
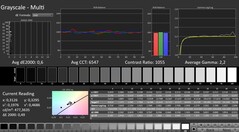
CalMAN: Skala szarości (skalibrowana)
CalMAN: Nasycenie kolorów (skalibrowane)
CalMAN: ColorChecker (skalibrowany)

Z drugiej strony, laptop Acer ma powierzchnię o niskim współczynniku odbicia światła i nie doświadcza migotania na żadnym poziomie jasności.

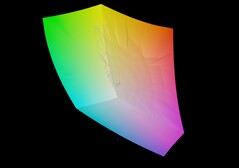
Acer Predator Triton Neo 16 vs sRGB
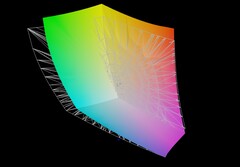
Acer Predator Triton Neo 16 vs AdobeRGB
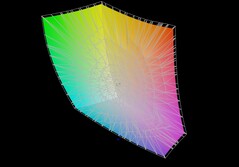
Acer Predator Triton Neo 16 vs DCI-P3

Neo 16 ma na celu przyciągnięcie profesjonalnych użytkowników dzięki dużej przestrzeni barw: Prawie 100% pokrycia sRGB, 94% DCI-P3 i 85% AdobeRGB sprawiają, że 16-calowy monitor jest prawdziwym produktem dla twórców. Dzięki weryfikacji Calman, kolory wyglądają całkiem naturalnie już po wyjęciu z pudełka. Całość dopełniają rozsądne kąty widzenia.

Światło dzienne
Światło dzienne
Subpiksele
Subpiksele
Kąty widzenia
Kąty widzenia

Display Response Times

Display response times show how fast the screen is able to change from one color to the next. Slow response times can lead to afterimages and can cause moving objects to appear blurry (ghosting). Gamers of fast-paced 3D titles should pay special attention to fast response times.
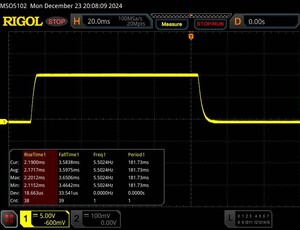
       Response Time Black to White
5.8 ms ... rise ↗ and fall ↘ combined↗ 2.2 ms rise
↘ 3.6 ms fall
The screen shows very fast response rates in our tests and should be very well suited for fast-paced gaming.
In comparison, all tested devices range from 0.1 (minimum) to 240 (maximum) ms. » 15 % of all devices are better.
This means that the measured response time is better than the average of all tested devices (20.9 ms).
       Response Time 50% Grey to 80% Grey
12.3 ms ... rise ↗ and fall ↘ combined↗ 5.9 ms rise
↘ 6.4 ms fall
The screen shows good response rates in our tests, but may be too slow for competitive gamers.
In comparison, all tested devices range from 0.165 (minimum) to 636 (maximum) ms. » 22 % of all devices are better.
This means that the measured response time is better than the average of all tested devices (32.8 ms).

Screen Flickering / PWM (Pulse-Width Modulation)

To dim the screen, some notebooks will simply cycle the backlight on and off in rapid succession - a method called Pulse Width Modulation (PWM) . This cycling frequency should ideally be undetectable to the human eye. If said frequency is too low, users with sensitive eyes may experience strain or headaches or even notice the flickering altogether.
Screen flickering / PWM not detected

In comparison: 53 % of all tested devices do not use PWM to dim the display. If PWM was detected, an average of 8702 (minimum: 5 - maximum: 343500) Hz was measured.

100 % jasności
100 % jasności
75 % jasności
75 % jasności
50 % jasności
50 % jasności
25 % jasności
25 % jasności
0 % jasności
0 % jasności

Wydajność

Wydajność naszej testowej wersji PTN16-51-978P mieści się w (górnym) średnim zakresie. Predator Triton Neo 16 zaczyna się od nieco poniżej 1200 USD. Podstawowy model wyposażony jest w wyświetlacz WQXGA (2560 x 1600 pikseli, 240 Hz), procesor Core Ultra 7 155H, a GeForce RTX 406016 GB pamięci RAM i dysk SSD o pojemności 1 TB.

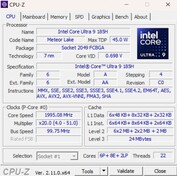
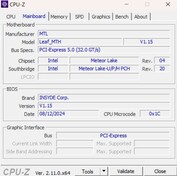
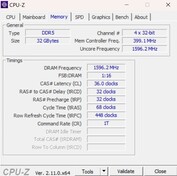
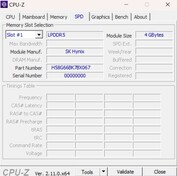
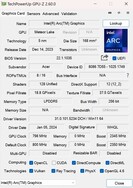
CPU-Z
CPU-Z
CPU-Z
CPU-Z
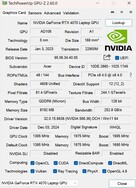
GPU-Z
GPU-Z
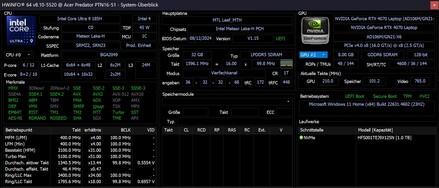
HWiNFO
 

Warunki testowania

Użytkownicy mogą wybierać spośród czterech różnych profili, z których niektóre różnią się znacznie pod względem wydajności i generowanego hałasu. Ponieważ tryb Turbo jest bardzo głośny w trybie 3D (prawie 58 dB), podczas naszych testów zdecydowaliśmy się na tryb Performance, który oferuje nieco mniejszą wydajność, ale także zapewnia znacznie niższy (choć nadal wysoki) hałas podczas pracy.

Predator Sense
Predator Sense
Predator Sense
Predator Sense
Predator Sense
Predator Sense
Predator Sense
Predator Sense
Predator Sense
Predator Sense
Cyberpunk 2077 Sekwencja pętli (FHD/Ultra) Cichy Zrównoważony Wydajność Turbo
Hałas 39 dB(A) 47 dB(A) 50 dB(A) 58 dB(A)
Wydajność 32 fps 62 fps 66 fps 74 fps
Pobór mocy karty graficznej maks. 53 W maks. 66 W maks. 76 W maks. 116 W

Procesor

Core Ultra 9 185H to wydajny procesor do laptopów z 16 rdzeniami (trzy różne typy rdzeni), które mogą przetwarzać do 22 wątków jednocześnie za pośrednictwem hiperwątkowości. W naszym benchmarku wydajność CPU uplasowała się mniej więcej na poziomie naszej wcześniej ustalonej średniej dla Ultra 9 185H. Jednak Ultra 7 155H, który można znaleźć u niektórych konkurentów, często był niewiele wolniejszy (Alienware m16 nawet nieznacznie wyprzedził w ogólnej ocenie). Pętla Cinebench pokazała również, że wyniki laptopa Acer nie były szczególnie stałe, ale raczej wykazywały pewne wahania. Żaden z modeli Intela nie miał jednak szans w starciu z układami AMD Ryzen AI 9 HX 370.

Cinebench R15 Multi continuous test

017535052570087510501225140015751750192521002275245026252800297531503325Tooltip
Acer Predator Triton Neo 16 PTN16-51-978P Intel Core Ultra 9 185H: Ø2755 (2385.5-2930.83)
Asus ProArt P16 H7606WI AMD Ryzen AI 9 HX 370: Ø3476 (3466.5-3497.73)
Lenovo Yoga Pro 9 16IMH9 Intel Core Ultra 9 185H: Ø2931 (2869.44-3004.58)
Asus ROG Zephyrus G16 2024 GU605M Intel Core Ultra 7 155H: Ø2533 (2383.65-2679.17)
Alienware m16 R2 Intel Core Ultra 7 155H: Ø2777 (2743.86-2839.9)
CPU Performance Rating - Percent
Asus ProArt P16 H7606WI
AMD Ryzen AI 9 HX 370
85.1 pt
Average of class Gaming
 
80.2 pt
Lenovo Yoga Pro 9 16IMH9
Intel Core Ultra 9 185H
77.2 pt
Alienware m16 R2 -1!
Intel Core Ultra 7 155H
73 pt
Acer Predator Triton Neo 16 PTN16-51-978P
Intel Core Ultra 9 185H
70.5 pt
Average Intel Core Ultra 9 185H
 
70.1 pt
Asus ROG Zephyrus G16 2024 GU605M
Intel Core Ultra 7 155H
68.7 pt
Cinebench R23
Multi Core
Asus ProArt P16 H7606WI
AMD Ryzen AI 9 HX 370
23750 Points +23%
Average of class Gaming
  (5668 - 36249, n=189, last 2 years)
22015 Points +14%
Lenovo Yoga Pro 9 16IMH9
Intel Core Ultra 9 185H
19851 Points +3%
Acer Predator Triton Neo 16 PTN16-51-978P
Intel Core Ultra 9 185H
19248 Points
Alienware m16 R2
Intel Core Ultra 7 155H
18419 (18019.3min - 18419.5max) Points -4%
Average Intel Core Ultra 9 185H
  (12688 - 19851, n=19)
17767 Points -8%
Asus ROG Zephyrus G16 2024 GU605M
Intel Core Ultra 7 155H
17267 Points -10%
Single Core
Asus ProArt P16 H7606WI
AMD Ryzen AI 9 HX 370
2044 Points +17%
Lenovo Yoga Pro 9 16IMH9
Intel Core Ultra 9 185H
1906 Points +9%
Average of class Gaming
  (1136 - 2235, n=188, last 2 years)
1894 Points +8%
Average Intel Core Ultra 9 185H
  (1166 - 1912, n=19)
1787 Points +2%
Acer Predator Triton Neo 16 PTN16-51-978P
Intel Core Ultra 9 185H
1754 Points
Alienware m16 R2
Intel Core Ultra 7 155H
1749 Points 0%
Asus ROG Zephyrus G16 2024 GU605M
Intel Core Ultra 7 155H
1681 Points -4%
Cinebench R20
CPU (Multi Core)
Asus ProArt P16 H7606WI
AMD Ryzen AI 9 HX 370
9246 Points +23%
Average of class Gaming
  (2179 - 13832, n=186, last 2 years)
8361 Points +11%
Lenovo Yoga Pro 9 16IMH9
Intel Core Ultra 9 185H
7651 Points +1%
Acer Predator Triton Neo 16 PTN16-51-978P
Intel Core Ultra 9 185H
7546 Points
Alienware m16 R2
Intel Core Ultra 7 155H
7050 Points -7%
Average Intel Core Ultra 9 185H
  (4843 - 7651, n=19)
6862 Points -9%
Asus ROG Zephyrus G16 2024 GU605M
Intel Core Ultra 7 155H
6682 Points -11%
CPU (Single Core)
Asus ProArt P16 H7606WI
AMD Ryzen AI 9 HX 370
804 Points +21%
Lenovo Yoga Pro 9 16IMH9
Intel Core Ultra 9 185H
735 Points +10%
Average of class Gaming
  (439 - 856, n=186, last 2 years)
727 Points +9%
Asus ROG Zephyrus G16 2024 GU605M
Intel Core Ultra 7 155H
693 Points +4%
Average Intel Core Ultra 9 185H
  (442 - 735, n=19)
689 Points +3%
Alienware m16 R2
Intel Core Ultra 7 155H
674 Points +1%
Acer Predator Triton Neo 16 PTN16-51-978P
Intel Core Ultra 9 185H
666 Points
Cinebench R15
CPU Multi 64Bit
Asus ProArt P16 H7606WI
AMD Ryzen AI 9 HX 370
3498 (3466.5min - 3497.73max) Points +19%
Average of class Gaming
  (905 - 5663, n=193, last 2 years)
3441 Points +17%
Lenovo Yoga Pro 9 16IMH9
Intel Core Ultra 9 185H
3005 (2869.44min - 3004.58max) Points +3%
Acer Predator Triton Neo 16 PTN16-51-978P
Intel Core Ultra 9 185H
2931 (2385.5min - 2930.83max) Points
Alienware m16 R2
Intel Core Ultra 7 155H
2840 (2743.86min - 2839.9max) Points -3%
Average Intel Core Ultra 9 185H
  (1582 - 3165, n=21)
2729 Points -7%
Asus ROG Zephyrus G16 2024 GU605M
Intel Core Ultra 7 155H
2679 (2383.65min - 2679.17max) Points -9%
CPU Single 64Bit
Asus ProArt P16 H7606WI
AMD Ryzen AI 9 HX 370
310 Points +12%
Lenovo Yoga Pro 9 16IMH9
Intel Core Ultra 9 185H
280 Points +1%
Average of class Gaming
  (191.9 - 318, n=190, last 2 years)
278 Points +1%
Acer Predator Triton Neo 16 PTN16-51-978P
Intel Core Ultra 9 185H
276 Points
Asus ROG Zephyrus G16 2024 GU605M
Intel Core Ultra 7 155H
264 Points -4%
Average Intel Core Ultra 9 185H
  (191.9 - 281, n=19)
264 Points -4%
Alienware m16 R2
Intel Core Ultra 7 155H
256 Points -7%
Blender - v2.79 BMW27 CPU
Asus ROG Zephyrus G16 2024 GU605M
Intel Core Ultra 7 155H
193 Seconds * -9%
Average Intel Core Ultra 9 185H
  (163 - 285, n=19)
191.1 Seconds * -8%
Acer Predator Triton Neo 16 PTN16-51-978P
Intel Core Ultra 9 185H
177 Seconds *
Average of class Gaming
  (87 - 555, n=181, last 2 years)
169.1 Seconds * +4%
Lenovo Yoga Pro 9 16IMH9
Intel Core Ultra 9 185H
163 Seconds * +8%
Asus ProArt P16 H7606WI
AMD Ryzen AI 9 HX 370
140 Seconds * +21%
7-Zip 18.03
7z b 4
Average of class Gaming
  (23795 - 140932, n=185, last 2 years)
85859 MIPS +17%
Asus ProArt P16 H7606WI
AMD Ryzen AI 9 HX 370
83354 MIPS +14%
Lenovo Yoga Pro 9 16IMH9
Intel Core Ultra 9 185H
76331 MIPS +4%
Acer Predator Triton Neo 16 PTN16-51-978P
Intel Core Ultra 9 185H
73378 MIPS
Average Intel Core Ultra 9 185H
  (51738 - 76331, n=19)
69330 MIPS -6%
Asus ROG Zephyrus G16 2024 GU605M
Intel Core Ultra 7 155H
68500 MIPS -7%
Alienware m16 R2
Intel Core Ultra 7 155H
67581 MIPS -8%
7z b 4 -mmt1
Average of class Gaming
  (4199 - 7581, n=185, last 2 years)
6320 MIPS +13%
Asus ProArt P16 H7606WI
AMD Ryzen AI 9 HX 370
6179 MIPS +10%
Lenovo Yoga Pro 9 16IMH9
Intel Core Ultra 9 185H
5781 MIPS +3%
Acer Predator Triton Neo 16 PTN16-51-978P
Intel Core Ultra 9 185H
5594 MIPS
Asus ROG Zephyrus G16 2024 GU605M
Intel Core Ultra 7 155H
5439 MIPS -3%
Average Intel Core Ultra 9 185H
  (4199 - 5781, n=19)
5427 MIPS -3%
Alienware m16 R2
Intel Core Ultra 7 155H
5037 MIPS -10%
Geekbench 6.3
Multi-Core
Asus ProArt P16 H7606WI
AMD Ryzen AI 9 HX 370
15367 Points +10%
Average of class Gaming
  (5340 - 19665, n=113, last 2 years)
14205 Points +1%
Lenovo Yoga Pro 9 16IMH9
Intel Core Ultra 9 185H
14031 Points 0%
Acer Predator Triton Neo 16 PTN16-51-978P
Intel Core Ultra 9 185H
14001 Points
Average Intel Core Ultra 9 185H
  (9140 - 14540, n=19)
13602 Points -3%
Asus ROG Zephyrus G16 2024 GU605M
Intel Core Ultra 7 155H
13323 Points -5%
Alienware m16 R2
Intel Core Ultra 7 155H
12670 Points -10%
Single-Core
Asus ProArt P16 H7606WI
AMD Ryzen AI 9 HX 370
2877 Points +20%
Average of class Gaming
  (1490 - 3129, n=113, last 2 years)
2649 Points +10%
Lenovo Yoga Pro 9 16IMH9
Intel Core Ultra 9 185H
2570 Points +7%
Average Intel Core Ultra 9 185H
  (1490 - 2573, n=19)
2430 Points +1%
Asus ROG Zephyrus G16 2024 GU605M
Intel Core Ultra 7 155H
2410 Points 0%
Acer Predator Triton Neo 16 PTN16-51-978P
Intel Core Ultra 9 185H
2399 Points
Alienware m16 R2
Intel Core Ultra 7 155H
2383 Points -1%
Geekbench 5.5
Multi-Core
Average of class Gaming
  (4557 - 23194, n=186, last 2 years)
15118 Points +7%
Asus ProArt P16 H7606WI
AMD Ryzen AI 9 HX 370
15012 Points +7%
Acer Predator Triton Neo 16 PTN16-51-978P
Intel Core Ultra 9 185H
14072 Points
Lenovo Yoga Pro 9 16IMH9
Intel Core Ultra 9 185H
13936 Points -1%
Average Intel Core Ultra 9 185H
  (9330 - 14230, n=19)
13179 Points -6%
Asus ROG Zephyrus G16 2024 GU605M
Intel Core Ultra 7 155H
12905 Points -8%
Alienware m16 R2
Intel Core Ultra 7 155H
12328 Points -12%
Single-Core
Asus ProArt P16 H7606WI
AMD Ryzen AI 9 HX 370
2066 Points +20%
Lenovo Yoga Pro 9 16IMH9
Intel Core Ultra 9 185H
1902 Points +10%
Average of class Gaming
  (986 - 2210, n=186, last 2 years)
1898 Points +10%
Average Intel Core Ultra 9 185H
  (986 - 1902, n=19)
1779 Points +3%
Asus ROG Zephyrus G16 2024 GU605M
Intel Core Ultra 7 155H
1755 Points +2%
Alienware m16 R2
Intel Core Ultra 7 155H
1741 Points +1%
Acer Predator Triton Neo 16 PTN16-51-978P
Intel Core Ultra 9 185H
1726 Points
HWBOT x265 Benchmark v2.2 - 4k Preset
Asus ProArt P16 H7606WI
AMD Ryzen AI 9 HX 370
24.6 fps +21%
Average of class Gaming
  (6.72 - 38.9, n=185, last 2 years)
23.6 fps +16%
Lenovo Yoga Pro 9 16IMH9
Intel Core Ultra 9 185H
22.7 fps +12%
Alienware m16 R2
Intel Core Ultra 7 155H
21.2 fps +4%
Acer Predator Triton Neo 16 PTN16-51-978P
Intel Core Ultra 9 185H
20.3 fps
Asus ROG Zephyrus G16 2024 GU605M
Intel Core Ultra 7 155H
19.9 fps -2%
Average Intel Core Ultra 9 185H
  (14.1 - 22.7, n=19)
19.9 fps -2%
LibreOffice - 20 Documents To PDF
Acer Predator Triton Neo 16 PTN16-51-978P
Intel Core Ultra 9 185H
73.5 s *
Asus ProArt P16 H7606WI
AMD Ryzen AI 9 HX 370
56.1 s * +24%
Alienware m16 R2
Intel Core Ultra 7 155H
49.8 s * +32%
Asus ROG Zephyrus G16 2024 GU605M
Intel Core Ultra 7 155H
49.6 s * +33%
Average of class Gaming
  (31.4 - 199, n=182, last 2 years)
48.2 s * +34%
Average Intel Core Ultra 9 185H
  (34.5 - 73.5, n=19)
46.1 s * +37%
Lenovo Yoga Pro 9 16IMH9
Intel Core Ultra 9 185H
39.7 s * +46%
R Benchmark 2.5 - Overall mean
Alienware m16 R2
Intel Core Ultra 7 155H
0.487 sec * -9%
Average Intel Core Ultra 9 185H
  (0.4313 - 0.759, n=20)
0.47 sec * -5%
Asus ROG Zephyrus G16 2024 GU605M
Intel Core Ultra 7 155H
0.4654 sec * -4%
Acer Predator Triton Neo 16 PTN16-51-978P
Intel Core Ultra 9 185H
0.4486 sec *
Lenovo Yoga Pro 9 16IMH9
Intel Core Ultra 9 185H
0.4457 sec * +1%
Average of class Gaming
  (0.3609 - 0.759, n=186, last 2 years)
0.4364 sec * +3%
Asus ProArt P16 H7606WI
AMD Ryzen AI 9 HX 370
0.4041 sec * +10%

* ... im mniej tym lepiej

Cinebench R15 CPU Multi 64Bit
2931 Points
Cinebench R15 OpenGL 64Bit
177.2 fps
Cinebench R15 Ref. Match 64Bit
99.6 %
Cinebench R15 CPU Single 64Bit
276 Points
Cinebench R20 CPU (Single Core)
666 Points
Cinebench R20 CPU (Multi Core)
7546 Points
Cinebench R23 Multi Core
19248 Points
Cinebench R23 Single Core
1754 Points
Cinebench 2024 CPU Single Core
111 Points
Cinebench 2024 CPU Multi Core
1027 Points
Pomoc
Performance Rating
Asus ProArt P16 H7606WI -2!
AMD Ryzen AI 9 HX 370, NVIDIA GeForce RTX 4070 Laptop GPU
93.1 pt
Average of class Gaming
 
85 pt
Lenovo Yoga Pro 9 16IMH9
Intel Core Ultra 9 185H, NVIDIA GeForce RTX 4070 Laptop GPU
76.9 pt
Acer Predator Triton Neo 16 PTN16-51-978P
Intel Core Ultra 9 185H, NVIDIA GeForce RTX 4070 Laptop GPU
74.7 pt
Alienware m16 R2
Intel Core Ultra 7 155H, NVIDIA GeForce RTX 4070 Laptop GPU
71.3 pt
Average Intel Core Ultra 9 185H
 
70.2 pt
Asus ROG Zephyrus G16 2024 GU605M
Intel Core Ultra 7 155H, NVIDIA GeForce RTX 4070 Laptop GPU
68.8 pt
AIDA64 / FP32 Ray-Trace
Average of class Gaming
  (4986 - 60169, n=182, last 2 years)
21996 KRay/s +18%
Acer Predator Triton Neo 16 PTN16-51-978P
Intel Core Ultra 9 185H, NVIDIA GeForce RTX 4070 Laptop GPU
18621 KRay/s
Alienware m16 R2
Intel Core Ultra 7 155H, NVIDIA GeForce RTX 4070 Laptop GPU
18470 KRay/s -1%
Lenovo Yoga Pro 9 16IMH9
Intel Core Ultra 9 185H, NVIDIA GeForce RTX 4070 Laptop GPU
18446 KRay/s -1%
Asus ROG Zephyrus G16 2024 GU605M
Intel Core Ultra 7 155H, NVIDIA GeForce RTX 4070 Laptop GPU
16431 KRay/s -12%
Average Intel Core Ultra 9 185H
  (9220 - 18676, n=19)
16396 KRay/s -12%
AIDA64 / FPU Julia
Asus ProArt P16 H7606WI
AMD Ryzen AI 9 HX 370, NVIDIA GeForce RTX 4070 Laptop GPU
147248 Points +54%
Average of class Gaming
  (25360 - 252486, n=182, last 2 years)
107132 Points +12%
Acer Predator Triton Neo 16 PTN16-51-978P
Intel Core Ultra 9 185H, NVIDIA GeForce RTX 4070 Laptop GPU
95572 Points
Lenovo Yoga Pro 9 16IMH9
Intel Core Ultra 9 185H, NVIDIA GeForce RTX 4070 Laptop GPU
95213 Points 0%
Alienware m16 R2
Intel Core Ultra 7 155H, NVIDIA GeForce RTX 4070 Laptop GPU
92996 Points -3%
Asus ROG Zephyrus G16 2024 GU605M
Intel Core Ultra 7 155H, NVIDIA GeForce RTX 4070 Laptop GPU
85461 Points -11%
Average Intel Core Ultra 9 185H
  (48865 - 96463, n=19)
85141 Points -11%
AIDA64 / CPU SHA3
Asus ProArt P16 H7606WI
AMD Ryzen AI 9 HX 370, NVIDIA GeForce RTX 4070 Laptop GPU
5843 MB/s +36%
Average of class Gaming
  (1339 - 10389, n=182, last 2 years)
4927 MB/s +15%
Acer Predator Triton Neo 16 PTN16-51-978P
Intel Core Ultra 9 185H, NVIDIA GeForce RTX 4070 Laptop GPU
4296 MB/s
Lenovo Yoga Pro 9 16IMH9
Intel Core Ultra 9 185H, NVIDIA GeForce RTX 4070 Laptop GPU
4278 MB/s 0%
Alienware m16 R2
Intel Core Ultra 7 155H, NVIDIA GeForce RTX 4070 Laptop GPU
4242 MB/s -1%
Average Intel Core Ultra 9 185H
  (2394 - 4534, n=19)
3982 MB/s -7%
Asus ROG Zephyrus G16 2024 GU605M
Intel Core Ultra 7 155H, NVIDIA GeForce RTX 4070 Laptop GPU
3814 MB/s -11%
AIDA64 / CPU Queen
Average of class Gaming
  (50699 - 200651, n=182, last 2 years)
117304 Points +24%
Asus ProArt P16 H7606WI
AMD Ryzen AI 9 HX 370, NVIDIA GeForce RTX 4070 Laptop GPU
94661 Points 0%
Acer Predator Triton Neo 16 PTN16-51-978P
Intel Core Ultra 9 185H, NVIDIA GeForce RTX 4070 Laptop GPU
94527 Points
Lenovo Yoga Pro 9 16IMH9
Intel Core Ultra 9 185H, NVIDIA GeForce RTX 4070 Laptop GPU
94395 Points 0%
Asus ROG Zephyrus G16 2024 GU605M
Intel Core Ultra 7 155H, NVIDIA GeForce RTX 4070 Laptop GPU
90347 Points -4%
Average Intel Core Ultra 9 185H
  (66785 - 95241, n=19)
89708 Points -5%
Alienware m16 R2
Intel Core Ultra 7 155H, NVIDIA GeForce RTX 4070 Laptop GPU
84180 Points -11%
AIDA64 / FPU SinJulia
Asus ProArt P16 H7606WI
AMD Ryzen AI 9 HX 370, NVIDIA GeForce RTX 4070 Laptop GPU
19021 Points +68%
Average of class Gaming
  (4800 - 32988, n=182, last 2 years)
13306 Points +18%
Lenovo Yoga Pro 9 16IMH9
Intel Core Ultra 9 185H, NVIDIA GeForce RTX 4070 Laptop GPU
11392 Points +1%
Acer Predator Triton Neo 16 PTN16-51-978P
Intel Core Ultra 9 185H, NVIDIA GeForce RTX 4070 Laptop GPU
11312 Points
Asus ROG Zephyrus G16 2024 GU605M
Intel Core Ultra 7 155H, NVIDIA GeForce RTX 4070 Laptop GPU
10641 Points -6%
Alienware m16 R2
Intel Core Ultra 7 155H, NVIDIA GeForce RTX 4070 Laptop GPU
10617 Points -6%
Average Intel Core Ultra 9 185H
  (7255 - 11392, n=19)
10546 Points -7%
AIDA64 / FPU Mandel
Average of class Gaming
  (12321 - 134044, n=182, last 2 years)
53901 Points +16%
Alienware m16 R2
Intel Core Ultra 7 155H, NVIDIA GeForce RTX 4070 Laptop GPU
47685 Points +3%
Lenovo Yoga Pro 9 16IMH9
Intel Core Ultra 9 185H, NVIDIA GeForce RTX 4070 Laptop GPU
47315 Points +2%
Acer Predator Triton Neo 16 PTN16-51-978P
Intel Core Ultra 9 185H, NVIDIA GeForce RTX 4070 Laptop GPU
46435 Points
Asus ROG Zephyrus G16 2024 GU605M
Intel Core Ultra 7 155H, NVIDIA GeForce RTX 4070 Laptop GPU
41806 Points -10%
Average Intel Core Ultra 9 185H
  (24004 - 48020, n=19)
41756 Points -10%
AIDA64 / CPU AES
Average of class Gaming
  (19065 - 328679, n=182, last 2 years)
109375 MB/s +20%
Lenovo Yoga Pro 9 16IMH9
Intel Core Ultra 9 185H, NVIDIA GeForce RTX 4070 Laptop GPU
94250 MB/s +4%
Average Intel Core Ultra 9 185H
  (53116 - 154066, n=19)
91381 MB/s +1%
Acer Predator Triton Neo 16 PTN16-51-978P
Intel Core Ultra 9 185H, NVIDIA GeForce RTX 4070 Laptop GPU
90860 MB/s
Alienware m16 R2
Intel Core Ultra 7 155H, NVIDIA GeForce RTX 4070 Laptop GPU
82757 MB/s -9%
Asus ProArt P16 H7606WI
AMD Ryzen AI 9 HX 370, NVIDIA GeForce RTX 4070 Laptop GPU
81929 MB/s -10%
Asus ROG Zephyrus G16 2024 GU605M
Intel Core Ultra 7 155H, NVIDIA GeForce RTX 4070 Laptop GPU
79475 MB/s -13%
AIDA64 / CPU ZLib
Asus ProArt P16 H7606WI
AMD Ryzen AI 9 HX 370, NVIDIA GeForce RTX 4070 Laptop GPU
1520 MB/s +17%
Average of class Gaming
  (373 - 2409, n=182, last 2 years)
1372 MB/s +6%
Lenovo Yoga Pro 9 16IMH9
Intel Core Ultra 9 185H, NVIDIA GeForce RTX 4070 Laptop GPU
1297 MB/s 0%
Acer Predator Triton Neo 16 PTN16-51-978P
Intel Core Ultra 9 185H, NVIDIA GeForce RTX 4070 Laptop GPU
1295 MB/s
Alienware m16 R2
Intel Core Ultra 7 155H, NVIDIA GeForce RTX 4070 Laptop GPU
1219 MB/s -6%
Average Intel Core Ultra 9 185H
  (678 - 1341, n=19)
1163 MB/s -10%
Asus ROG Zephyrus G16 2024 GU605M
Intel Core Ultra 7 155H, NVIDIA GeForce RTX 4070 Laptop GPU
1128 MB/s -13%
AIDA64 / FP64 Ray-Trace
Asus ProArt P16 H7606WI
AMD Ryzen AI 9 HX 370, NVIDIA GeForce RTX 4070 Laptop GPU
20608 KRay/s +114%
Average of class Gaming
  (2540 - 31796, n=182, last 2 years)
11845 KRay/s +23%
Alienware m16 R2
Intel Core Ultra 7 155H, NVIDIA GeForce RTX 4070 Laptop GPU
9802 KRay/s +2%
Lenovo Yoga Pro 9 16IMH9
Intel Core Ultra 9 185H, NVIDIA GeForce RTX 4070 Laptop GPU
9768 KRay/s +1%
Acer Predator Triton Neo 16 PTN16-51-978P
Intel Core Ultra 9 185H, NVIDIA GeForce RTX 4070 Laptop GPU
9631 KRay/s
Average Intel Core Ultra 9 185H
  (4428 - 10078, n=19)
8582 KRay/s -11%
Asus ROG Zephyrus G16 2024 GU605M
Intel Core Ultra 7 155H, NVIDIA GeForce RTX 4070 Laptop GPU
8449 KRay/s -12%
AIDA64 / CPU PhotoWorxx
Lenovo Yoga Pro 9 16IMH9
Intel Core Ultra 9 185H, NVIDIA GeForce RTX 4070 Laptop GPU
53918 MPixel/s +21%
Asus ROG Zephyrus G16 2024 GU605M
Intel Core Ultra 7 155H, NVIDIA GeForce RTX 4070 Laptop GPU
49238 MPixel/s +11%
Average Intel Core Ultra 9 185H
  (44547 - 53918, n=19)
48798 MPixel/s +10%
Asus ProArt P16 H7606WI
AMD Ryzen AI 9 HX 370, NVIDIA GeForce RTX 4070 Laptop GPU
48273 MPixel/s +8%
Acer Predator Triton Neo 16 PTN16-51-978P
Intel Core Ultra 9 185H, NVIDIA GeForce RTX 4070 Laptop GPU
44547 MPixel/s
Average of class Gaming
  (10805 - 60161, n=183, last 2 years)
40439 MPixel/s -9%
Alienware m16 R2
Intel Core Ultra 7 155H, NVIDIA GeForce RTX 4070 Laptop GPU
39532 MPixel/s -11%

Wydajność systemu

Nie było niespodzianek, jeśli chodzi o wydajność systemu. 7 443 punkty w PCMark 10 to wynik typowy dla urządzenia z takimi podzespołami lub w tej klasie wydajności.

PCMark 10 / Score
Average of class Gaming
  (5776 - 9852, n=163, last 2 years)
7817 Points +5%
Alienware m16 R2
NVIDIA GeForce RTX 4070 Laptop GPU, Ultra 7 155H, Samsung PM9A1 MZVL21T0HCLR
7761 Points +4%
Asus ProArt P16 H7606WI
NVIDIA GeForce RTX 4070 Laptop GPU, Ryzen AI 9 HX 370, Micron 2400 MTFDKBA1T0QFM
7752 Points +4%
Average Intel Core Ultra 9 185H, NVIDIA GeForce RTX 4070 Laptop GPU
  (7443 - 7761, n=4)
7560 Points +2%
Lenovo Yoga Pro 9 16IMH9
NVIDIA GeForce RTX 4070 Laptop GPU, Ultra 9 185H, SK Hynix HFS001TEJ9X115N
7547 Points +1%
Acer Predator Triton Neo 16 PTN16-51-978P
NVIDIA GeForce RTX 4070 Laptop GPU, Ultra 9 185H, SK Hynix PC801 HFS001TEJ9X125N
7443 Points
Asus ROG Zephyrus G16 2024 GU605M
NVIDIA GeForce RTX 4070 Laptop GPU, Ultra 7 155H, WD PC SN560 SDDPNQE-1T00
7123 Points -4%
PCMark 10 / Essentials
Lenovo Yoga Pro 9 16IMH9
NVIDIA GeForce RTX 4070 Laptop GPU, Ultra 9 185H, SK Hynix HFS001TEJ9X115N
11133 Points +14%
Average of class Gaming
  (9057 - 12334, n=162, last 2 years)
10832 Points +11%
Average Intel Core Ultra 9 185H, NVIDIA GeForce RTX 4070 Laptop GPU
  (9728 - 11133, n=4)
10451 Points +7%
Alienware m16 R2
NVIDIA GeForce RTX 4070 Laptop GPU, Ultra 7 155H, Samsung PM9A1 MZVL21T0HCLR
10330 Points +6%
Asus ROG Zephyrus G16 2024 GU605M
NVIDIA GeForce RTX 4070 Laptop GPU, Ultra 7 155H, WD PC SN560 SDDPNQE-1T00
10038 Points +3%
Asus ProArt P16 H7606WI
NVIDIA GeForce RTX 4070 Laptop GPU, Ryzen AI 9 HX 370, Micron 2400 MTFDKBA1T0QFM
10009 Points +3%
Acer Predator Triton Neo 16 PTN16-51-978P
NVIDIA GeForce RTX 4070 Laptop GPU, Ultra 9 185H, SK Hynix PC801 HFS001TEJ9X125N
9728 Points
PCMark 10 / Productivity
Average of class Gaming
  (6662 - 14612, n=162, last 2 years)
9912 Points +4%
Asus ProArt P16 H7606WI
NVIDIA GeForce RTX 4070 Laptop GPU, Ryzen AI 9 HX 370, Micron 2400 MTFDKBA1T0QFM
9891 Points +4%
Acer Predator Triton Neo 16 PTN16-51-978P
NVIDIA GeForce RTX 4070 Laptop GPU, Ultra 9 185H, SK Hynix PC801 HFS001TEJ9X125N
9555 Points
Alienware m16 R2
NVIDIA GeForce RTX 4070 Laptop GPU, Ultra 7 155H, Samsung PM9A1 MZVL21T0HCLR
9422 Points -1%
Average Intel Core Ultra 9 185H, NVIDIA GeForce RTX 4070 Laptop GPU
  (9067 - 9555, n=4)
9347 Points -2%
Asus ROG Zephyrus G16 2024 GU605M
NVIDIA GeForce RTX 4070 Laptop GPU, Ultra 7 155H, WD PC SN560 SDDPNQE-1T00
9208 Points -4%
Lenovo Yoga Pro 9 16IMH9
NVIDIA GeForce RTX 4070 Laptop GPU, Ultra 9 185H, SK Hynix HFS001TEJ9X115N
9067 Points -5%
PCMark 10 / Digital Content Creation
Alienware m16 R2
NVIDIA GeForce RTX 4070 Laptop GPU, Ultra 7 155H, Samsung PM9A1 MZVL21T0HCLR
13035 Points +8%
Asus ProArt P16 H7606WI
NVIDIA GeForce RTX 4070 Laptop GPU, Ryzen AI 9 HX 370, Micron 2400 MTFDKBA1T0QFM
12771 Points +6%
Average of class Gaming
  (6807 - 18475, n=162, last 2 years)
12183 Points +1%
Average Intel Core Ultra 9 185H, NVIDIA GeForce RTX 4070 Laptop GPU
  (11369 - 13194, n=4)
12039 Points 0%
Acer Predator Triton Neo 16 PTN16-51-978P
NVIDIA GeForce RTX 4070 Laptop GPU, Ultra 9 185H, SK Hynix PC801 HFS001TEJ9X125N
12037 Points
Lenovo Yoga Pro 9 16IMH9
NVIDIA GeForce RTX 4070 Laptop GPU, Ultra 9 185H, SK Hynix HFS001TEJ9X115N
11554 Points -4%
Asus ROG Zephyrus G16 2024 GU605M
NVIDIA GeForce RTX 4070 Laptop GPU, Ultra 7 155H, WD PC SN560 SDDPNQE-1T00
10612 Points -12%
CrossMark / Overall
Average of class Gaming
  (1247 - 2344, n=143, last 2 years)
1912 Points
Asus ProArt P16 H7606WI
NVIDIA GeForce RTX 4070 Laptop GPU, Ryzen AI 9 HX 370, Micron 2400 MTFDKBA1T0QFM
1794 Points
Average Intel Core Ultra 9 185H, NVIDIA GeForce RTX 4070 Laptop GPU
  (1663 - 1917, n=3)
1766 Points
Alienware m16 R2
NVIDIA GeForce RTX 4070 Laptop GPU, Ultra 7 155H, Samsung PM9A1 MZVL21T0HCLR
1762 Points
Asus ROG Zephyrus G16 2024 GU605M
NVIDIA GeForce RTX 4070 Laptop GPU, Ultra 7 155H, WD PC SN560 SDDPNQE-1T00
1721 Points
Lenovo Yoga Pro 9 16IMH9
NVIDIA GeForce RTX 4070 Laptop GPU, Ultra 9 185H, SK Hynix HFS001TEJ9X115N
1719 Points
CrossMark / Productivity
Average of class Gaming
  (1299 - 2204, n=143, last 2 years)
1811 Points
Alienware m16 R2
NVIDIA GeForce RTX 4070 Laptop GPU, Ultra 7 155H, Samsung PM9A1 MZVL21T0HCLR
1684 Points
Average Intel Core Ultra 9 185H, NVIDIA GeForce RTX 4070 Laptop GPU
  (1573 - 1849, n=3)
1678 Points
Asus ROG Zephyrus G16 2024 GU605M
NVIDIA GeForce RTX 4070 Laptop GPU, Ultra 7 155H, WD PC SN560 SDDPNQE-1T00
1624 Points
Lenovo Yoga Pro 9 16IMH9
NVIDIA GeForce RTX 4070 Laptop GPU, Ultra 9 185H, SK Hynix HFS001TEJ9X115N
1611 Points
Asus ProArt P16 H7606WI
NVIDIA GeForce RTX 4070 Laptop GPU, Ryzen AI 9 HX 370, Micron 2400 MTFDKBA1T0QFM
1611 Points
CrossMark / Creativity
Asus ProArt P16 H7606WI
NVIDIA GeForce RTX 4070 Laptop GPU, Ryzen AI 9 HX 370, Micron 2400 MTFDKBA1T0QFM
2270 Points
Average of class Gaming
  (1275 - 2660, n=143, last 2 years)
2101 Points
Lenovo Yoga Pro 9 16IMH9
NVIDIA GeForce RTX 4070 Laptop GPU, Ultra 9 185H, SK Hynix HFS001TEJ9X115N
1993 Points
Average Intel Core Ultra 9 185H, NVIDIA GeForce RTX 4070 Laptop GPU
  (1872 - 2008, n=3)
1958 Points
Asus ROG Zephyrus G16 2024 GU605M
NVIDIA GeForce RTX 4070 Laptop GPU, Ultra 7 155H, WD PC SN560 SDDPNQE-1T00
1942 Points
Alienware m16 R2
NVIDIA GeForce RTX 4070 Laptop GPU, Ultra 7 155H, Samsung PM9A1 MZVL21T0HCLR
1913 Points
CrossMark / Responsiveness
Average of class Gaming
  (1030 - 2330, n=143, last 2 years)
1709 Points
Alienware m16 R2
NVIDIA GeForce RTX 4070 Laptop GPU, Ultra 7 155H, Samsung PM9A1 MZVL21T0HCLR
1576 Points
Average Intel Core Ultra 9 185H, NVIDIA GeForce RTX 4070 Laptop GPU
  (1338 - 1856, n=3)
1525 Points
Asus ROG Zephyrus G16 2024 GU605M
NVIDIA GeForce RTX 4070 Laptop GPU, Ultra 7 155H, WD PC SN560 SDDPNQE-1T00
1424 Points
Lenovo Yoga Pro 9 16IMH9
NVIDIA GeForce RTX 4070 Laptop GPU, Ultra 9 185H, SK Hynix HFS001TEJ9X115N
1338 Points
Asus ProArt P16 H7606WI
NVIDIA GeForce RTX 4070 Laptop GPU, Ryzen AI 9 HX 370, Micron 2400 MTFDKBA1T0QFM
1225 Points
WebXPRT 3 / Overall
Average of class Gaming
  (215 - 480, n=161, last 2 years)
304 Points +13%
Asus ProArt P16 H7606WI
NVIDIA GeForce RTX 4070 Laptop GPU, Ryzen AI 9 HX 370, Micron 2400 MTFDKBA1T0QFM
298 Points +10%
Lenovo Yoga Pro 9 16IMH9
NVIDIA GeForce RTX 4070 Laptop GPU, Ultra 9 185H, SK Hynix HFS001TEJ9X115N
295 Points +9%
Alienware m16 R2
NVIDIA GeForce RTX 4070 Laptop GPU, Ultra 7 155H, Samsung PM9A1 MZVL21T0HCLR
294 Points +9%
Asus ROG Zephyrus G16 2024 GU605M
NVIDIA GeForce RTX 4070 Laptop GPU, Ultra 7 155H, WD PC SN560 SDDPNQE-1T00
283 Points +5%
Average Intel Core Ultra 9 185H, NVIDIA GeForce RTX 4070 Laptop GPU
  (240 - 295, n=5)
272 Points +1%
Acer Predator Triton Neo 16 PTN16-51-978P
NVIDIA GeForce RTX 4070 Laptop GPU, Ultra 9 185H, SK Hynix PC801 HFS001TEJ9X125N
270 Points
Acer Predator Triton Neo 16 PTN16-51-978P
NVIDIA GeForce RTX 4070 Laptop GPU, Ultra 9 185H, SK Hynix PC801 HFS001TEJ9X125N
270 Points 0%
WebXPRT 4 / Overall
Lenovo Yoga Pro 9 16IMH9
NVIDIA GeForce RTX 4070 Laptop GPU, Ultra 9 185H, SK Hynix HFS001TEJ9X115N
268 Points +8%
Average of class Gaming
  (176.4 - 328, n=150, last 2 years)
267 Points +7%
Alienware m16 R2
NVIDIA GeForce RTX 4070 Laptop GPU, Ultra 7 155H, Samsung PM9A1 MZVL21T0HCLR
257 Points +3%
Asus ROG Zephyrus G16 2024 GU605M
NVIDIA GeForce RTX 4070 Laptop GPU, Ultra 7 155H, WD PC SN560 SDDPNQE-1T00
256 Points +3%
Average Intel Core Ultra 9 185H, NVIDIA GeForce RTX 4070 Laptop GPU
  (248 - 268, n=5)
255 Points +2%
Acer Predator Triton Neo 16 PTN16-51-978P
NVIDIA GeForce RTX 4070 Laptop GPU, Ultra 9 185H, SK Hynix PC801 HFS001TEJ9X125N
249 Points
Acer Predator Triton Neo 16 PTN16-51-978P
NVIDIA GeForce RTX 4070 Laptop GPU, Ultra 9 185H, SK Hynix PC801 HFS001TEJ9X125N
249 Points 0%
Asus ProArt P16 H7606WI
NVIDIA GeForce RTX 4070 Laptop GPU, Ryzen AI 9 HX 370, Micron 2400 MTFDKBA1T0QFM
244 Points -2%
Mozilla Kraken 1.1 / Total
Acer Predator Triton Neo 16 PTN16-51-978P
NVIDIA GeForce RTX 4070 Laptop GPU, Ultra 9 185H, SK Hynix PC801 HFS001TEJ9X125N
549 ms *
Acer Predator Triton Neo 16 PTN16-51-978P
NVIDIA GeForce RTX 4070 Laptop GPU, Ultra 9 185H, SK Hynix PC801 HFS001TEJ9X125N
549 ms * -0%
Asus ROG Zephyrus G16 2024 GU605M
NVIDIA GeForce RTX 4070 Laptop GPU, Ultra 7 155H, WD PC SN560 SDDPNQE-1T00
548 ms * -0%
Alienware m16 R2
NVIDIA GeForce RTX 4070 Laptop GPU, Ultra 7 155H, Samsung PM9A1 MZVL21T0HCLR
546 ms * +1%
Average Intel Core Ultra 9 185H, NVIDIA GeForce RTX 4070 Laptop GPU
  (494 - 549, n=5)
525 ms * +4%
Average of class Gaming
  (421 - 674, n=176, last 2 years)
502 ms * +9%
Lenovo Yoga Pro 9 16IMH9
NVIDIA GeForce RTX 4070 Laptop GPU, Ultra 9 185H, SK Hynix HFS001TEJ9X115N
494 ms * +10%
Asus ProArt P16 H7606WI
NVIDIA GeForce RTX 4070 Laptop GPU, Ryzen AI 9 HX 370, Micron 2400 MTFDKBA1T0QFM
439 ms * +20%

* ... im mniej tym lepiej

PCMark 10 Score
7443 pkt.
Pomoc
AIDA64 / Memory Copy
Lenovo Yoga Pro 9 16IMH9
Intel Core Ultra 9 185H, NVIDIA GeForce RTX 4070 Laptop GPU
94254 MB/s +19%
Asus ProArt P16 H7606WI
AMD Ryzen AI 9 HX 370, NVIDIA GeForce RTX 4070 Laptop GPU
89675 MB/s +13%
Asus ROG Zephyrus G16 2024 GU605M
Intel Core Ultra 7 155H, NVIDIA GeForce RTX 4070 Laptop GPU
89414 MB/s +12%
Average Intel Core Ultra 9 185H
  (69929 - 95718, n=19)
84413 MB/s +6%
Acer Predator Triton Neo 16 PTN16-51-978P
Intel Core Ultra 9 185H, NVIDIA GeForce RTX 4070 Laptop GPU
79538 MB/s
Average of class Gaming
  (21842 - 94222, n=182, last 2 years)
65752 MB/s -17%
Alienware m16 R2
Intel Core Ultra 7 155H, NVIDIA GeForce RTX 4070 Laptop GPU
63008 MB/s -21%
AIDA64 / Memory Read
Asus ProArt P16 H7606WI
AMD Ryzen AI 9 HX 370, NVIDIA GeForce RTX 4070 Laptop GPU
100415 MB/s +39%
Lenovo Yoga Pro 9 16IMH9
Intel Core Ultra 9 185H, NVIDIA GeForce RTX 4070 Laptop GPU
87768 MB/s +21%
Asus ROG Zephyrus G16 2024 GU605M
Intel Core Ultra 7 155H, NVIDIA GeForce RTX 4070 Laptop GPU
86576 MB/s +20%
Average Intel Core Ultra 9 185H
  (64619 - 87768, n=19)
79657 MB/s +10%
Alienware m16 R2
Intel Core Ultra 7 155H, NVIDIA GeForce RTX 4070 Laptop GPU
76370 MB/s +5%
Acer Predator Triton Neo 16 PTN16-51-978P
Intel Core Ultra 9 185H, NVIDIA GeForce RTX 4070 Laptop GPU
72422 MB/s
Average of class Gaming
  (23681 - 99713, n=182, last 2 years)
69626 MB/s -4%
AIDA64 / Memory Write
Asus ProArt P16 H7606WI
AMD Ryzen AI 9 HX 370, NVIDIA GeForce RTX 4070 Laptop GPU
100176 MB/s +35%
Lenovo Yoga Pro 9 16IMH9
Intel Core Ultra 9 185H, NVIDIA GeForce RTX 4070 Laptop GPU
75773 MB/s +2%
Acer Predator Triton Neo 16 PTN16-51-978P
Intel Core Ultra 9 185H, NVIDIA GeForce RTX 4070 Laptop GPU
74436 MB/s
Asus ROG Zephyrus G16 2024 GU605M
Intel Core Ultra 7 155H, NVIDIA GeForce RTX 4070 Laptop GPU
73337 MB/s -1%
Average Intel Core Ultra 9 185H
  (51114 - 93871, n=19)
72498 MB/s -3%
Average of class Gaming
  (22986 - 108954, n=182, last 2 years)
67472 MB/s -9%
Alienware m16 R2
Intel Core Ultra 7 155H, NVIDIA GeForce RTX 4070 Laptop GPU
66009 MB/s -11%
AIDA64 / Memory Latency
Average Intel Core Ultra 9 185H
  (121.4 - 259, n=19)
145.5 ns * -3%
Acer Predator Triton Neo 16 PTN16-51-978P
Intel Core Ultra 9 185H, NVIDIA GeForce RTX 4070 Laptop GPU
141.5 ns *
Asus ROG Zephyrus G16 2024 GU605M
Intel Core Ultra 7 155H, NVIDIA GeForce RTX 4070 Laptop GPU
140 ns * +1%
Lenovo Yoga Pro 9 16IMH9
Intel Core Ultra 9 185H, NVIDIA GeForce RTX 4070 Laptop GPU
129.6 ns * +8%
Alienware m16 R2
Intel Core Ultra 7 155H, NVIDIA GeForce RTX 4070 Laptop GPU
126.2 ns * +11%
Asus ProArt P16 H7606WI
AMD Ryzen AI 9 HX 370, NVIDIA GeForce RTX 4070 Laptop GPU
113.2 ns * +20%
Average of class Gaming
  (59.5 - 259, n=182, last 2 years)
94.1 ns * +33%

* ... im mniej tym lepiej

Opóźnienia DPC

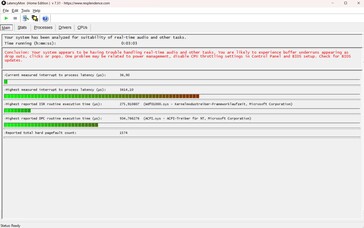
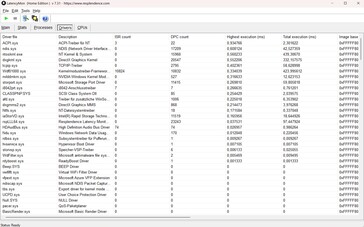
Acer mógłby poprawić swoje opóźnienia. Narzędzie LatencyMon ujawniło dość wysokie wartości, ale to samo można powiedzieć o niektórych konkurentach. Tylko Lenovo Yoga Pro 9 16 pozostał poniżej granicy 1000 µs.

LatencyMon
LatencyMon
DPC Latencies / LatencyMon - interrupt to process latency (max), Web, Youtube, Prime95
Acer Predator Triton Neo 16 PTN16-51-978P
NVIDIA GeForce RTX 4070 Laptop GPU, Ultra 9 185H, SK Hynix PC801 HFS001TEJ9X125N
3414 μs *
Asus ROG Zephyrus G16 2024 GU605M
NVIDIA GeForce RTX 4070 Laptop GPU, Ultra 7 155H, WD PC SN560 SDDPNQE-1T00
2484.4 μs * +27%
Alienware m16 R2
NVIDIA GeForce RTX 4070 Laptop GPU, Ultra 7 155H, Samsung PM9A1 MZVL21T0HCLR
2037.7 μs * +40%
Lenovo Yoga Pro 9 16IMH9
NVIDIA GeForce RTX 4070 Laptop GPU, Ultra 9 185H, SK Hynix HFS001TEJ9X115N
464.1 μs * +86%

* ... im mniej tym lepiej

Urządzenie pamięci masowej

Z drugiej strony, Predator Triton zaimponował superszybkim dyskiem SSD o pojemności 1 TB (SK Hynix PC801). Według naszej oceny wydajności, laptop Acer zajął najwyższą pozycję wśród porównywanych urządzeń. Należy jednak wspomnieć, że występowały silne wahania wydajności przy długotrwałym obciążeniu, co nie miało miejsca w przypadku konkurencji (patrz pętla DiskSpd).

SK Hynix PC801 HFS001TEJ9X125N
CDM 5/6 Read Seq Q32T1: 7052 MB/s
CDM 5/6 Write Seq Q32T1: 976.3 MB/s
CDM 5/6 Read 4K Q32T1: 608.2 MB/s
CDM 5/6 Write 4K Q32T1: 397.3 MB/s
CDM 5 Read Seq: 2957 MB/s
CDM 5 Write Seq: 976.6 MB/s
CDM 5/6 Read 4K: 59.48 MB/s
CDM 5/6 Write 4K: 228.6 MB/s
Drive Performance Rating - Percent
Acer Predator Triton Neo 16 PTN16-51-978P
SK Hynix PC801 HFS001TEJ9X125N
94.1 pt
Average SK Hynix PC801 HFS001TEJ9X125N
 
93.9 pt
Alienware m16 R2
Samsung PM9A1 MZVL21T0HCLR
82.3 pt
Average of class Gaming
 
71.9 pt
Lenovo Yoga Pro 9 16IMH9
SK Hynix HFS001TEJ9X115N
63.8 pt
Asus ROG Zephyrus G16 2024 GU605M
WD PC SN560 SDDPNQE-1T00
47.3 pt
Asus ProArt P16 H7606WI
Micron 2400 MTFDKBA1T0QFM
40.9 pt
DiskSpd
seq read
Average SK Hynix PC801 HFS001TEJ9X125N
  (3772 - 5314, n=2)
4543 MB/s +20%
Alienware m16 R2
Samsung PM9A1 MZVL21T0HCLR
4480 (4426.62min - 4479.73max) MB/s +19%
Acer Predator Triton Neo 16 PTN16-51-978P
SK Hynix PC801 HFS001TEJ9X125N
3772 (3723.81min - 3772.36max) MB/s
Average of class Gaming
  (1319 - 7045, n=164, last 2 years)
3478 MB/s -8%
Asus ROG Zephyrus G16 2024 GU605M
WD PC SN560 SDDPNQE-1T00
3202 (3129.61min - 3201.93max) MB/s -15%
Lenovo Yoga Pro 9 16IMH9
SK Hynix HFS001TEJ9X115N
2757 (2720.02min - 2757.13max) MB/s -27%
Asus ProArt P16 H7606WI
Micron 2400 MTFDKBA1T0QFM
2119 (2090.65min - 2119.22max) MB/s -44%
seq write
Average SK Hynix PC801 HFS001TEJ9X125N
  (5276 - 5300, n=2)
5288 MB/s 0%
Acer Predator Triton Neo 16 PTN16-51-978P
SK Hynix PC801 HFS001TEJ9X125N
5276 (5235.14min - 5275.95max) MB/s
Alienware m16 R2
Samsung PM9A1 MZVL21T0HCLR
4371 (4342.15min - 4371.09max) MB/s -17%
Average of class Gaming
  (535 - 9307, n=164, last 2 years)
3831 MB/s -27%
Lenovo Yoga Pro 9 16IMH9
SK Hynix HFS001TEJ9X115N
3474 (3404.52min - 3474.32max) MB/s -34%
Asus ROG Zephyrus G16 2024 GU605M
WD PC SN560 SDDPNQE-1T00
2526 (2498.97min - 2525.81max) MB/s -52%
Asus ProArt P16 H7606WI
Micron 2400 MTFDKBA1T0QFM
2138 (1936.3min - 2137.63max) MB/s -59%
seq q8 t1 read
Alienware m16 R2
Samsung PM9A1 MZVL21T0HCLR
7079 (6575.14min - 7078.73max) MB/s +3%
Average SK Hynix PC801 HFS001TEJ9X125N
  (6856 - 7150, n=2)
7003 MB/s +2%
Acer Predator Triton Neo 16 PTN16-51-978P
SK Hynix PC801 HFS001TEJ9X125N
6856 (6264.4min - 6855.93max) MB/s
Average of class Gaming
  (2594 - 16089, n=164, last 2 years)
6319 MB/s -8%
Lenovo Yoga Pro 9 16IMH9
SK Hynix HFS001TEJ9X115N
6257 (5307.47min - 6256.78max) MB/s -9%
Asus ROG Zephyrus G16 2024 GU605M
WD PC SN560 SDDPNQE-1T00
5008 (4421.01min - 5007.74max) MB/s -27%
Asus ProArt P16 H7606WI
Micron 2400 MTFDKBA1T0QFM
4785 (3105.25min - 4784.86max) MB/s -30%
seq q8 t1 write
Average SK Hynix PC801 HFS001TEJ9X125N
  (6184 - 6519, n=2)
6352 MB/s +3%
Acer Predator Triton Neo 16 PTN16-51-978P
SK Hynix PC801 HFS001TEJ9X125N
6184 (6135.32min - 6183.67max) MB/s
Lenovo Yoga Pro 9 16IMH9
SK Hynix HFS001TEJ9X115N
6040 (5907.05min - 6040.01max) MB/s -2%
Alienware m16 R2
Samsung PM9A1 MZVL21T0HCLR
5250 (5191.5min - 5250.22max) MB/s -15%
Average of class Gaming
  (539 - 14571, n=164, last 2 years)
4867 MB/s -21%
Asus ROG Zephyrus G16 2024 GU605M
WD PC SN560 SDDPNQE-1T00
3230 (3169.22min - 3230.03max) MB/s -48%
Asus ProArt P16 H7606WI
Micron 2400 MTFDKBA1T0QFM
3109 (2917.35min - 3109.45max) MB/s -50%
4k q1 t1 read
Alienware m16 R2
Samsung PM9A1 MZVL21T0HCLR
83.5 (82.8min - 83.52max) MB/s +4%
Acer Predator Triton Neo 16 PTN16-51-978P
SK Hynix PC801 HFS001TEJ9X125N
80.3 (79.74min - 80.34max) MB/s
Average SK Hynix PC801 HFS001TEJ9X125N
  (78.3 - 80.3, n=2)
79.3 MB/s -1%
Average of class Gaming
  (30.6 - 95.9, n=164, last 2 years)
65.9 MB/s -18%
Lenovo Yoga Pro 9 16IMH9
SK Hynix HFS001TEJ9X115N
63.7 (63.29min - 63.65max) MB/s -21%
Asus ROG Zephyrus G16 2024 GU605M
WD PC SN560 SDDPNQE-1T00
52.9 (51.15min - 52.91max) MB/s -34%
Asus ProArt P16 H7606WI
Micron 2400 MTFDKBA1T0QFM
39.9 (39.46min - 39.9max) MB/s -50%
4k q1 t1 write
Average SK Hynix PC801 HFS001TEJ9X125N
  (253 - 268, n=2)
261 MB/s +3%
Acer Predator Triton Neo 16 PTN16-51-978P
SK Hynix PC801 HFS001TEJ9X125N
253 (248.67min - 252.62max) MB/s
Average of class Gaming
  (78 - 397, n=164, last 2 years)
224 MB/s -11%
Alienware m16 R2
Samsung PM9A1 MZVL21T0HCLR
198.1 (195.9min - 198.06max) MB/s -22%
Lenovo Yoga Pro 9 16IMH9
SK Hynix HFS001TEJ9X115N
139.8 (135.84min - 139.76max) MB/s -45%
Asus ROG Zephyrus G16 2024 GU605M
WD PC SN560 SDDPNQE-1T00
128.4 (126.56min - 128.36max) MB/s -49%
Asus ProArt P16 H7606WI
Micron 2400 MTFDKBA1T0QFM
75.9 (71.09min - 75.93max) MB/s -70%
4k q32 t16 read
Acer Predator Triton Neo 16 PTN16-51-978P
SK Hynix PC801 HFS001TEJ9X125N
4884 (4800.09min - 4884.18max) MB/s
Average SK Hynix PC801 HFS001TEJ9X125N
  (4820 - 4884, n=2)
4852 MB/s -1%
Alienware m16 R2
Samsung PM9A1 MZVL21T0HCLR
3630 (3471.35min - 3629.9max) MB/s -26%
Average of class Gaming
  (417 - 6172, n=164, last 2 years)
2589 MB/s -47%
Lenovo Yoga Pro 9 16IMH9
SK Hynix HFS001TEJ9X115N
859 (816.31min - 859.16max) MB/s -82%
Asus ROG Zephyrus G16 2024 GU605M
WD PC SN560 SDDPNQE-1T00
604 (565.74min - 603.6max) MB/s -88%
Asus ProArt P16 H7606WI
Micron 2400 MTFDKBA1T0QFM
548 (543.4min - 547.55max) MB/s -89%
4k q32 t16 write
Average SK Hynix PC801 HFS001TEJ9X125N
  (3073 - 3091, n=2)
3082 MB/s 0%
Acer Predator Triton Neo 16 PTN16-51-978P
SK Hynix PC801 HFS001TEJ9X125N
3073 (3055.16min - 3073.44max) MB/s
Alienware m16 R2
Samsung PM9A1 MZVL21T0HCLR
3003 (2991.33min - 3002.71max) MB/s -2%
Average of class Gaming
  (162.3 - 4869, n=164, last 2 years)
2144 MB/s -30%
Lenovo Yoga Pro 9 16IMH9
SK Hynix HFS001TEJ9X115N
439 (405.1min - 438.82max) MB/s -86%
Asus ROG Zephyrus G16 2024 GU605M
WD PC SN560 SDDPNQE-1T00
402 (389.17min - 402.07max) MB/s -87%
Asus ProArt P16 H7606WI
Micron 2400 MTFDKBA1T0QFM
231 (200.24min - 231.41max) MB/s -92%
AS SSD
Score Total
Acer Predator Triton Neo 16 PTN16-51-978P
SK Hynix PC801 HFS001TEJ9X125N
9306 Points
Average SK Hynix PC801 HFS001TEJ9X125N
  (8486 - 9306, n=2)
8896 Points -4%
Alienware m16 R2
Samsung PM9A1 MZVL21T0HCLR
8059 Points -13%
Average of class Gaming
  (2271 - 13854, n=155, last 2 years)
6759 Points -27%
Lenovo Yoga Pro 9 16IMH9
SK Hynix HFS001TEJ9X115N
5214 Points -44%
Asus ProArt P16 H7606WI
Micron 2400 MTFDKBA1T0QFM
3843 Points -59%
Asus ROG Zephyrus G16 2024 GU605M
WD PC SN560 SDDPNQE-1T00
3272 Points -65%
Score Read
Acer Predator Triton Neo 16 PTN16-51-978P
SK Hynix PC801 HFS001TEJ9X125N
3081 Points
Alienware m16 R2
Samsung PM9A1 MZVL21T0HCLR
3005 Points -2%
Average SK Hynix PC801 HFS001TEJ9X125N
  (2908 - 3081, n=2)
2995 Points -3%
Average of class Gaming
  (776 - 4721, n=155, last 2 years)
2451 Points -20%
Lenovo Yoga Pro 9 16IMH9
SK Hynix HFS001TEJ9X115N
1397 Points -55%
Asus ROG Zephyrus G16 2024 GU605M
WD PC SN560 SDDPNQE-1T00
1020 Points -67%
Asus ProArt P16 H7606WI
Micron 2400 MTFDKBA1T0QFM
962 Points -69%
Score Write
Acer Predator Triton Neo 16 PTN16-51-978P
SK Hynix PC801 HFS001TEJ9X125N
4656 Points
Average SK Hynix PC801 HFS001TEJ9X125N
  (4106 - 4656, n=2)
4381 Points -6%
Alienware m16 R2
Samsung PM9A1 MZVL21T0HCLR
3573 Points -23%
Lenovo Yoga Pro 9 16IMH9
SK Hynix HFS001TEJ9X115N
3190 Points -31%
Average of class Gaming
  (515 - 7208, n=155, last 2 years)
3117 Points -33%
Asus ProArt P16 H7606WI
Micron 2400 MTFDKBA1T0QFM
2455 Points -47%
Asus ROG Zephyrus G16 2024 GU605M
WD PC SN560 SDDPNQE-1T00
1808 Points -61%
Seq Read
Average SK Hynix PC801 HFS001TEJ9X125N
  (5653 - 5687, n=2)
5670 MB/s 0%
Acer Predator Triton Neo 16 PTN16-51-978P
SK Hynix PC801 HFS001TEJ9X125N
5653.46 MB/s
Alienware m16 R2
Samsung PM9A1 MZVL21T0HCLR
5592.15 MB/s -1%
Lenovo Yoga Pro 9 16IMH9
SK Hynix HFS001TEJ9X115N
5399 MB/s -5%
Average of class Gaming
  (2260 - 12763, n=155, last 2 years)
4958 MB/s -12%
Asus ProArt P16 H7606WI
Micron 2400 MTFDKBA1T0QFM
3776 MB/s -33%
Asus ROG Zephyrus G16 2024 GU605M
WD PC SN560 SDDPNQE-1T00
3662 MB/s -35%
Seq Write
Acer Predator Triton Neo 16 PTN16-51-978P
SK Hynix PC801 HFS001TEJ9X125N
5470.77 MB/s
Average SK Hynix PC801 HFS001TEJ9X125N
  (5335 - 5471, n=2)
5403 MB/s -1%
Alienware m16 R2
Samsung PM9A1 MZVL21T0HCLR
4431.18 MB/s -19%
Average of class Gaming
  (495 - 11316, n=155, last 2 years)
3780 MB/s -31%
Lenovo Yoga Pro 9 16IMH9
SK Hynix HFS001TEJ9X115N
3314 MB/s -39%
Asus ProArt P16 H7606WI
Micron 2400 MTFDKBA1T0QFM
2397 MB/s -56%
Asus ROG Zephyrus G16 2024 GU605M
WD PC SN560 SDDPNQE-1T00
1921 MB/s -65%
4K Read
Acer Predator Triton Neo 16 PTN16-51-978P
SK Hynix PC801 HFS001TEJ9X125N
74.63 MB/s
Average SK Hynix PC801 HFS001TEJ9X125N
  (70.3 - 74.6, n=2)
72.5 MB/s -3%
Alienware m16 R2
Samsung PM9A1 MZVL21T0HCLR
71.52 MB/s -4%
Average of class Gaming
  (27.8 - 112.1, n=155, last 2 years)
65 MB/s -13%
Lenovo Yoga Pro 9 16IMH9
SK Hynix HFS001TEJ9X115N
64.2 MB/s -14%
Asus ROG Zephyrus G16 2024 GU605M
WD PC SN560 SDDPNQE-1T00
42.2 MB/s -43%
Asus ProArt P16 H7606WI
Micron 2400 MTFDKBA1T0QFM
28.7 MB/s -62%
4K Write
Average SK Hynix PC801 HFS001TEJ9X125N
  (226 - 231, n=2)
229 MB/s +1%
Acer Predator Triton Neo 16 PTN16-51-978P
SK Hynix PC801 HFS001TEJ9X125N
225.97 MB/s
Average of class Gaming
  (108.8 - 512, n=155, last 2 years)
212 MB/s -6%
Lenovo Yoga Pro 9 16IMH9
SK Hynix HFS001TEJ9X115N
183.8 MB/s -19%
Alienware m16 R2
Samsung PM9A1 MZVL21T0HCLR
179.15 MB/s -21%
Asus ProArt P16 H7606WI
Micron 2400 MTFDKBA1T0QFM
178 MB/s -21%
Asus ROG Zephyrus G16 2024 GU605M
WD PC SN560 SDDPNQE-1T00
157.9 MB/s -30%
4K-64 Read
Acer Predator Triton Neo 16 PTN16-51-978P
SK Hynix PC801 HFS001TEJ9X125N
2441.35 MB/s
Alienware m16 R2
Samsung PM9A1 MZVL21T0HCLR
2374.63 MB/s -3%
Average SK Hynix PC801 HFS001TEJ9X125N
  (2269 - 2441, n=2)
2355 MB/s -4%
Average of class Gaming
  (451 - 3475, n=155, last 2 years)
1885 MB/s -23%
Lenovo Yoga Pro 9 16IMH9
SK Hynix HFS001TEJ9X115N
793 MB/s -68%
Asus ROG Zephyrus G16 2024 GU605M
WD PC SN560 SDDPNQE-1T00
612 MB/s -75%
Asus ProArt P16 H7606WI
Micron 2400 MTFDKBA1T0QFM
555 MB/s -77%
4K-64 Write
Acer Predator Triton Neo 16 PTN16-51-978P
SK Hynix PC801 HFS001TEJ9X125N
3882.49 MB/s
Average SK Hynix PC801 HFS001TEJ9X125N
  (3341 - 3882, n=2)
3612 MB/s -7%
Alienware m16 R2
Samsung PM9A1 MZVL21T0HCLR
2951.09 MB/s -24%
Lenovo Yoga Pro 9 16IMH9
SK Hynix HFS001TEJ9X115N
2675 MB/s -31%
Average of class Gaming
  (277 - 5909, n=155, last 2 years)
2530 MB/s -35%
Asus ProArt P16 H7606WI
Micron 2400 MTFDKBA1T0QFM
2038 MB/s -48%
Asus ROG Zephyrus G16 2024 GU605M
WD PC SN560 SDDPNQE-1T00
1458 MB/s -62%
Access Time Read
Average of class Gaming
  (0.016 - 0.379, n=154, last 2 years)
0.05545 ms * -50%
Alienware m16 R2
Samsung PM9A1 MZVL21T0HCLR
0.047 ms * -27%
Average SK Hynix PC801 HFS001TEJ9X125N
  (0.037 - 0.038, n=2)
0.0375 ms * -1%
Acer Predator Triton Neo 16 PTN16-51-978P
SK Hynix PC801 HFS001TEJ9X125N
0.037 ms *
Asus ROG Zephyrus G16 2024 GU605M
WD PC SN560 SDDPNQE-1T00
0.032 ms * +14%
Asus ProArt P16 H7606WI
Micron 2400 MTFDKBA1T0QFM
0.027 ms * +27%
Lenovo Yoga Pro 9 16IMH9
SK Hynix HFS001TEJ9X115N
0.021 ms * +43%
Access Time Write
Asus ProArt P16 H7606WI
Micron 2400 MTFDKBA1T0QFM
0.137 ms * -661%
Alienware m16 R2
Samsung PM9A1 MZVL21T0HCLR
0.07 ms * -289%
Average of class Gaming
  (0.011 - 1.028, n=155, last 2 years)
0.04715 ms * -162%
Asus ROG Zephyrus G16 2024 GU605M
WD PC SN560 SDDPNQE-1T00
0.023 ms * -28%
Lenovo Yoga Pro 9 16IMH9
SK Hynix HFS001TEJ9X115N
0.02 ms * -11%
Acer Predator Triton Neo 16 PTN16-51-978P
SK Hynix PC801 HFS001TEJ9X125N
0.018 ms *
Average SK Hynix PC801 HFS001TEJ9X125N
  (0.018 - 0.018, n=2)
0.018 ms * -0%

* ... im mniej tym lepiej

Reading continuous performance: DiskSpd Read Loop, Queue Depth 8

036072010801440180021602520288032403600396043204680504054005760612064806840Tooltip
Acer Predator Triton Neo 16 PTN16-51-978P SK Hynix PC801 HFS001TEJ9X125N; diskspd 2.0.17 f: Ø6191 (3458.63-7113.78)
Asus ProArt P16 H7606WI Micron 2400 MTFDKBA1T0QFM; diskspd 2.0.17 f: Ø4823 (4004.26-4857.63)
Lenovo Yoga Pro 9 16IMH9 SK Hynix HFS001TEJ9X115N; diskspd 2.0.17 f: Ø6232 (4915.93-6315.2)
Asus ROG Zephyrus G16 2024 GU605M WD PC SN560 SDDPNQE-1T00; diskspd 2.0.17 f: Ø4947 (4458.34-4961.59)
Alienware m16 R2 Samsung PM9A1 MZVL21T0HCLR; diskspd 2.0.17 f: Ø7063 (6446.85-7107.46)

Karta graficzna

Karta GeForce RTX 4070 budzi obecnie mieszane uczucia. Podczas gdy jego podstawowa wydajność jest całkiem przyzwoita, jego ograniczona pamięć VRAM wynosząca 8 GB staje się coraz większą przeszkodą podczas uruchamiania wymagających gier (weźmy na przykład Indiana Jones). Acer dodatkowo zdecydował się na raczej umiarkowane TGP wynoszące 110 watów, w tym Dynamic Boost dla Predator Triton Neo 16 (możliwe jest nawet 140 watów), co jest również widoczne w testach porównawczych. Podczas testu GPU wystarczyło to tylko do zapewnienia sobie ostatniego miejsca w polu testowym. Interesujące: Nawet Asus ROG Zephyrus G16który ma 80-watowy TGP, był szybszy (na przykład podczas grania w Cyberpunk 2077 pobór mocy RTX 4070 w Neo 16 był ograniczony do maksymalnie 76 watów w trybie wydajności ).
3DMark Performance Rating - Percent
Average of class Gaming
 
100 pt
Alienware m16 R2
NVIDIA GeForce RTX 4070 Laptop GPU, Intel Core Ultra 7 155H
97.7 pt
Asus ProArt P16 H7606WI
NVIDIA GeForce RTX 4070 Laptop GPU, AMD Ryzen AI 9 HX 370
94.5 pt
Lenovo Yoga Pro 9 16IMH9
NVIDIA GeForce RTX 4070 Laptop GPU, Intel Core Ultra 9 185H
94.3 pt
Average NVIDIA GeForce RTX 4070 Laptop GPU
 
90.7 pt
Asus ROG Zephyrus G16 2024 GU605M
NVIDIA GeForce RTX 4070 Laptop GPU, Intel Core Ultra 7 155H
84.2 pt
Acer Predator Triton Neo 16 PTN16-51-978P
NVIDIA GeForce RTX 4070 Laptop GPU, Intel Core Ultra 9 185H
82.6 pt
3DMark 11 - 1280x720 Performance GPU
Average of class Gaming
  (1029 - 72178, n=182, last 2 years)
43982 Points +22%
Asus ProArt P16 H7606WI
NVIDIA GeForce RTX 4070 Laptop GPU, AMD Ryzen AI 9 HX 370
42821 Points +19%
Alienware m16 R2
NVIDIA GeForce RTX 4070 Laptop GPU, Intel Core Ultra 7 155H
42296 Points +18%
Lenovo Yoga Pro 9 16IMH9
NVIDIA GeForce RTX 4070 Laptop GPU, Intel Core Ultra 9 185H
40646 Points +13%
Average NVIDIA GeForce RTX 4070 Laptop GPU
  (24229 - 46434, n=65)
40385 Points +12%
Asus ROG Zephyrus G16 2024 GU605M
NVIDIA GeForce RTX 4070 Laptop GPU, Intel Core Ultra 7 155H
37313 Points +4%
Acer Predator Triton Neo 16 PTN16-51-978P
NVIDIA GeForce RTX 4070 Laptop GPU, Intel Core Ultra 9 185H
35972 Points
3DMark
1920x1080 Fire Strike Graphics
Average of class Gaming
  (781 - 53059, n=193, last 2 years)
31524 Points +17%
Alienware m16 R2
NVIDIA GeForce RTX 4070 Laptop GPU, Intel Core Ultra 7 155H
30932 Points +15%
Lenovo Yoga Pro 9 16IMH9
NVIDIA GeForce RTX 4070 Laptop GPU, Intel Core Ultra 9 185H
30874 Points +15%
Asus ProArt P16 H7606WI
NVIDIA GeForce RTX 4070 Laptop GPU, AMD Ryzen AI 9 HX 370
30137 Points +12%
Average NVIDIA GeForce RTX 4070 Laptop GPU
  (12242 - 33451, n=69)
29068 Points +8%
Acer Predator Triton Neo 16 PTN16-51-978P
NVIDIA GeForce RTX 4070 Laptop GPU, Intel Core Ultra 9 185H
26898 Points
Asus ROG Zephyrus G16 2024 GU605M
NVIDIA GeForce RTX 4070 Laptop GPU, Intel Core Ultra 7 155H
26568 Points -1%
2560x1440 Time Spy Graphics
Average of class Gaming
  (224 - 22717, n=188, last 2 years)
13169 Points +24%
Alienware m16 R2
NVIDIA GeForce RTX 4070 Laptop GPU, Intel Core Ultra 7 155H
12997 Points +22%
Lenovo Yoga Pro 9 16IMH9
NVIDIA GeForce RTX 4070 Laptop GPU, Intel Core Ultra 9 185H
12181 Points +15%
Asus ProArt P16 H7606WI
NVIDIA GeForce RTX 4070 Laptop GPU, AMD Ryzen AI 9 HX 370
11941 Points +12%
Average NVIDIA GeForce RTX 4070 Laptop GPU
  (5012 - 13391, n=67)
11602 Points +9%
Asus ROG Zephyrus G16 2024 GU605M
NVIDIA GeForce RTX 4070 Laptop GPU, Intel Core Ultra 7 155H
10989 Points +3%
Acer Predator Triton Neo 16 PTN16-51-978P
NVIDIA GeForce RTX 4070 Laptop GPU, Intel Core Ultra 9 185H
10636 Points
3DMark 11 Performance
31196 pkt.
3DMark Ice Storm Standard Score
196686 pkt.
3DMark Cloud Gate Standard Score
58960 pkt.
3DMark Fire Strike Score
23102 pkt.
3DMark Time Spy Score
10712 pkt.
Pomoc
Blender
v3.3 Classroom OPTIX/RTX
Asus ROG Zephyrus G16 2024 GU605M
NVIDIA GeForce RTX 4070 Laptop GPU, Intel Core Ultra 7 155H
22 Seconds * -5%
Asus ProArt P16 H7606WI
NVIDIA GeForce RTX 4070 Laptop GPU, AMD Ryzen AI 9 HX 370
22 Seconds * -5%
Average NVIDIA GeForce RTX 4070 Laptop GPU
  (18 - 30, n=66)
21.5 Seconds * -2%
Acer Predator Triton Neo 16 PTN16-51-978P
NVIDIA GeForce RTX 4070 Laptop GPU, Intel Core Ultra 9 185H
21 Seconds *
Average of class Gaming
  (9 - 95, n=178, last 2 years)
20.7 Seconds * +1%
Alienware m16 R2
NVIDIA GeForce RTX 4070 Laptop GPU, Intel Core Ultra 7 155H
20 Seconds * +5%
Lenovo Yoga Pro 9 16IMH9
NVIDIA GeForce RTX 4070 Laptop GPU, Intel Core Ultra 9 185H
19 Seconds * +10%
v3.3 Classroom CUDA
Average NVIDIA GeForce RTX 4070 Laptop GPU
  (32 - 181, n=68)
40.1 Seconds * -11%
Average of class Gaming
  (16 - 175, n=184, last 2 years)
36.6 Seconds * -2%
Acer Predator Triton Neo 16 PTN16-51-978P
NVIDIA GeForce RTX 4070 Laptop GPU, Intel Core Ultra 9 185H
36 Seconds *
Asus ROG Zephyrus G16 2024 GU605M
NVIDIA GeForce RTX 4070 Laptop GPU, Intel Core Ultra 7 155H
34 Seconds * +6%
Asus ProArt P16 H7606WI
NVIDIA GeForce RTX 4070 Laptop GPU, AMD Ryzen AI 9 HX 370
34 Seconds * +6%
Alienware m16 R2
NVIDIA GeForce RTX 4070 Laptop GPU, Intel Core Ultra 7 155H
33 Seconds * +8%
Lenovo Yoga Pro 9 16IMH9
NVIDIA GeForce RTX 4070 Laptop GPU, Intel Core Ultra 9 185H
32 Seconds * +11%
v3.3 Classroom CPU
Asus ROG Zephyrus G16 2024 GU605M
NVIDIA GeForce RTX 4070 Laptop GPU, Intel Core Ultra 7 155H
330 Seconds * -7%
Acer Predator Triton Neo 16 PTN16-51-978P
NVIDIA GeForce RTX 4070 Laptop GPU, Intel Core Ultra 9 185H
309 Seconds *
Alienware m16 R2
NVIDIA GeForce RTX 4070 Laptop GPU, Intel Core Ultra 7 155H
296 Seconds * +4%
Average of class Gaming
  (138 - 962, n=187, last 2 years)
293 Seconds * +5%
Average NVIDIA GeForce RTX 4070 Laptop GPU
  (158 - 440, n=65)
289 Seconds * +6%
Lenovo Yoga Pro 9 16IMH9
NVIDIA GeForce RTX 4070 Laptop GPU, Intel Core Ultra 9 185H
285 Seconds * +8%
Asus ProArt P16 H7606WI
NVIDIA GeForce RTX 4070 Laptop GPU, AMD Ryzen AI 9 HX 370
214 Seconds * +31%

* ... im mniej tym lepiej

Wydajność w grach

Sprawy wyglądają nieco lepiej podczas codziennego grania. Tutaj laptop Acer wyprzedził o kilka procent swój odpowiednik Asusa, ale wciąż pozostaje w tyle za pozostałymi konkurentami. Ogólnie rzecz biorąc, RTX 4070 jest wystarczająco szybki, aby płynnie uruchamiać większość obecnych gier przy maksymalnych detalach w rozdzielczości Full HD (np. 1920 x 1080). W zakresie QHD (np. 2560 x 1440 pikseli) sytuacja nie wygląda już tak różowo. Gry wymagające dużej mocy obliczeniowej, takie jak Hellblade 2, Until Dawn i Stalker 2 wymagają obniżenia detali lub użycia DLSS (patrz tabela). Zalecamy korzystanie z natywnej rozdzielczości Neo 16 tylko w przypadku mniej wymagających gier. 3200 x 2000 pikseli to obecnie granica dla RTX 4070 (chyba że użyją Państwo zaawansowanych metod skalowania w górę).

Performance Rating - Percent
Average of class Gaming
 
97.2 pt
Alienware m16 R2 -1!
NVIDIA GeForce RTX 4070 Laptop GPU, Ultra 7 155H
94.4 pt
Lenovo Yoga Pro 9 16IMH9
NVIDIA GeForce RTX 4070 Laptop GPU, Ultra 9 185H
91.7 pt
Average NVIDIA GeForce RTX 4070 Laptop GPU
 
91.3 pt
Asus ProArt P16 H7606WI
NVIDIA GeForce RTX 4070 Laptop GPU, Ryzen AI 9 HX 370
85.9 pt
Acer Predator Triton Neo 16 PTN16-51-978P -1!
NVIDIA GeForce RTX 4070 Laptop GPU, Ultra 9 185H
83 pt
Asus ROG Zephyrus G16 2024 GU605M -1!
NVIDIA GeForce RTX 4070 Laptop GPU, Ultra 7 155H
78.1 pt
Cyberpunk 2077 2.1 Phantom Liberty - 1920x1080 Ultra Preset (FSR off)
Average of class Gaming
  (6.76 - 144.7, n=81, last 2 years)
86.3 fps +25%
Alienware m16 R2
NVIDIA GeForce RTX 4070 Laptop GPU, Ultra 7 155H
83.1 (28.4min) fps +20%
Asus ProArt P16 H7606WI
NVIDIA GeForce RTX 4070 Laptop GPU, Ryzen AI 9 HX 370
80.7 (65.3min) fps +17%
Average NVIDIA GeForce RTX 4070 Laptop GPU
  (30.7 - 90.7, n=36)
79.1 fps +14%
Lenovo Yoga Pro 9 16IMH9
NVIDIA GeForce RTX 4070 Laptop GPU, Ultra 9 185H
76.9 (18min) fps +11%
Acer Predator Triton Neo 16 PTN16-51-978P
NVIDIA GeForce RTX 4070 Laptop GPU, Ultra 9 185H
69.1 (56min) fps
Asus ROG Zephyrus G16 2024 GU605M
NVIDIA GeForce RTX 4070 Laptop GPU, Ultra 7 155H
69 fps 0%
Baldur's Gate 3 - 1920x1080 Ultra Preset
Alienware m16 R2
NVIDIA GeForce RTX 4070 Laptop GPU, Ultra 7 155H
128.5 fps +41%
Lenovo Yoga Pro 9 16IMH9
NVIDIA GeForce RTX 4070 Laptop GPU, Ultra 9 185H
117.7 fps +29%
Average of class Gaming
  (34.5 - 208, n=46, last 2 years)
103.2 fps +13%
Average NVIDIA GeForce RTX 4070 Laptop GPU
  (66.7 - 128.5, n=26)
101 fps +11%
Acer Predator Triton Neo 16 PTN16-51-978P
NVIDIA GeForce RTX 4070 Laptop GPU, Ultra 9 185H
91.1 (29.4min, 35.3P0.1, 60.7P1) fps
Asus ProArt P16 H7606WI
NVIDIA GeForce RTX 4070 Laptop GPU, Ryzen AI 9 HX 370
82.5 fps -9%
GTA V - 1920x1080 Highest Settings possible AA:4xMSAA + FX AF:16x
Average of class Gaming
  (12.1 - 167.7, n=169, last 2 years)
113.9 fps +9%
Asus ProArt P16 H7606WI
NVIDIA GeForce RTX 4070 Laptop GPU, Ryzen AI 9 HX 370
111.2 (9.03min, 76.9P1) fps +6%
Average NVIDIA GeForce RTX 4070 Laptop GPU
  (48.3 - 141.6, n=61)
111.1 fps +6%
Lenovo Yoga Pro 9 16IMH9
NVIDIA GeForce RTX 4070 Laptop GPU, Ultra 9 185H
110.9 (3.51min, 71.4P1) fps +6%
Acer Predator Triton Neo 16 PTN16-51-978P
NVIDIA GeForce RTX 4070 Laptop GPU, Ultra 9 185H
104.6 (4.27min, 55.6P1) fps
Asus ROG Zephyrus G16 2024 GU605M
NVIDIA GeForce RTX 4070 Laptop GPU, Ultra 7 155H
98.8 (3.78min, 58.8P1) fps -6%
Final Fantasy XV Benchmark - 1920x1080 High Quality
Average of class Gaming
  (19.2 - 201, n=181, last 2 years)
120.3 fps +21%
Alienware m16 R2
NVIDIA GeForce RTX 4070 Laptop GPU, Ultra 7 155H
119.3 fps +20%
Lenovo Yoga Pro 9 16IMH9
NVIDIA GeForce RTX 4070 Laptop GPU, Ultra 9 185H
115.7 fps +16%
Asus ProArt P16 H7606WI
NVIDIA GeForce RTX 4070 Laptop GPU, Ryzen AI 9 HX 370
115.3 fps +16%
Average NVIDIA GeForce RTX 4070 Laptop GPU
  (41 - 131.9, n=63)
110.9 fps +11%
Asus ROG Zephyrus G16 2024 GU605M
NVIDIA GeForce RTX 4070 Laptop GPU, Ultra 7 155H
100.8 fps +1%
Acer Predator Triton Neo 16 PTN16-51-978P
NVIDIA GeForce RTX 4070 Laptop GPU, Ultra 9 185H
99.7 fps
Strange Brigade - 1920x1080 ultra AA:ultra AF:16
Average of class Gaming
  (38.9 - 421, n=177, last 2 years)
230 fps
Alienware m16 R2
NVIDIA GeForce RTX 4070 Laptop GPU, Ultra 7 155H
219 (38.5min, 163.7P1) fps
Lenovo Yoga Pro 9 16IMH9
NVIDIA GeForce RTX 4070 Laptop GPU, Ultra 9 185H
213 fps
Asus ProArt P16 H7606WI
NVIDIA GeForce RTX 4070 Laptop GPU, Ryzen AI 9 HX 370
206 (86.5min, 156P1) fps
Average NVIDIA GeForce RTX 4070 Laptop GPU
  (76.3 - 234, n=62)
196.3 fps
Asus ROG Zephyrus G16 2024 GU605M
NVIDIA GeForce RTX 4070 Laptop GPU, Ultra 7 155H
129.3 (30.4min, 84.7P1) fps
Dota 2 Reborn - 1920x1080 ultra (3/3) best looking
Average of class Gaming
  (65.1 - 220, n=186, last 2 years)
151.3 fps +11%
Average NVIDIA GeForce RTX 4070 Laptop GPU
  (89.7 - 191.2, n=65)
147.9 fps +9%
Asus ProArt P16 H7606WI
NVIDIA GeForce RTX 4070 Laptop GPU, Ryzen AI 9 HX 370
141.6 (119.2min) fps +4%
Alienware m16 R2
NVIDIA GeForce RTX 4070 Laptop GPU, Ultra 7 155H
139.7 (120.9min) fps +3%
Lenovo Yoga Pro 9 16IMH9
NVIDIA GeForce RTX 4070 Laptop GPU, Ultra 9 185H
139 (119.7min) fps +2%
Acer Predator Triton Neo 16 PTN16-51-978P
NVIDIA GeForce RTX 4070 Laptop GPU, Ultra 9 185H
135.9 (115.5min) fps
Asus ROG Zephyrus G16 2024 GU605M
NVIDIA GeForce RTX 4070 Laptop GPU, Ultra 7 155H
131.6 (114.5min) fps -3%
X-Plane 11.11 - 1920x1080 high (fps_test=3)
Average of class Gaming
  (32.8 - 166.2, n=193, last 2 years)
108.5 fps +22%
Average NVIDIA GeForce RTX 4070 Laptop GPU
  (52.1 - 147.9, n=67)
104.4 fps +17%
Alienware m16 R2
NVIDIA GeForce RTX 4070 Laptop GPU, Ultra 7 155H
90.8 fps +2%
Lenovo Yoga Pro 9 16IMH9
NVIDIA GeForce RTX 4070 Laptop GPU, Ultra 9 185H
90.5 fps +1%
Acer Predator Triton Neo 16 PTN16-51-978P
NVIDIA GeForce RTX 4070 Laptop GPU, Ultra 9 185H
89.2 fps
Asus ROG Zephyrus G16 2024 GU605M
NVIDIA GeForce RTX 4070 Laptop GPU, Ultra 7 155H
81.2 fps -9%
Asus ProArt P16 H7606WI
NVIDIA GeForce RTX 4070 Laptop GPU, Ryzen AI 9 HX 370
72.3 fps -19%
lowmed.highultraQHD DLSSQHD
GTA V (2015) 173.4 166.4 104.6
Dota 2 Reborn (2015) 169.6 150.5 144.3 135.9
Final Fantasy XV Benchmark (2018) 132.4 99.7
X-Plane 11.11 (2018) 130.8 116.5 89.2
Baldur's Gate 3 (2023) 108.4 94.8 91.1 65
Cyberpunk 2077 2.1 Phantom Liberty (2023) 93.9 80.1 69.1 42.3
Senua's Saga Hellblade 2 (2024) 53.2 39.3 42.2 27.1
Star Wars Outlaws (2024) 44.9 40.8 34.4 34.1 23.3
Space Marine 2 (2024) 74.4 72.8 67.9 65.1 48.2
Final Fantasy XVI (2024) 68.2 59 54.3 53.9 37.6
Until Dawn (2024) 83.7 58.9 44.9 41.5 32.9
Call of Duty Black Ops 6 (2024) 105 81 76 65 60
Stalker 2 (2024) 57.1 49.7 42.3 58.3 31.7
Cyberpunk 2077 2.1 Phantom Liberty
1920x1080 High Preset (FSR off)
Alienware m16 R2
NVIDIA GeForce RTX 4070 Laptop GPU, Ultra 7 155H
95.6 (35.4min) fps +19%
Asus ProArt P16 H7606WI
NVIDIA GeForce RTX 4070 Laptop GPU, Ryzen AI 9 HX 370
94.1 (77.9min) fps +17%
Average NVIDIA GeForce RTX 4070 Laptop GPU
  (74.7 - 103.6, n=29)
92.1 fps +15%
Average of class Gaming
  (7.4 - 164.5, n=61, last 2 years)
92.1 fps +15%
Lenovo Yoga Pro 9 16IMH9
NVIDIA GeForce RTX 4070 Laptop GPU, Ultra 9 185H
90.5 (40.2min) fps +13%
Acer Predator Triton Neo 16 PTN16-51-978P
NVIDIA GeForce RTX 4070 Laptop GPU, Ultra 9 185H
80.1 (66min) fps
Asus ROG Zephyrus G16 2024 GU605M
NVIDIA GeForce RTX 4070 Laptop GPU, Ultra 7 155H
77 fps -4%
1920x1080 Ultra Preset (FSR off)
Average of class Gaming
  (6.76 - 144.7, n=81, last 2 years)
86.3 fps +25%
Alienware m16 R2
NVIDIA GeForce RTX 4070 Laptop GPU, Ultra 7 155H
83.1 (28.4min) fps +20%
Asus ProArt P16 H7606WI
NVIDIA GeForce RTX 4070 Laptop GPU, Ryzen AI 9 HX 370
80.7 (65.3min) fps +17%
Average NVIDIA GeForce RTX 4070 Laptop GPU
  (30.7 - 90.7, n=36)
79.1 fps +14%
Lenovo Yoga Pro 9 16IMH9
NVIDIA GeForce RTX 4070 Laptop GPU, Ultra 9 185H
76.9 (18min) fps +11%
Acer Predator Triton Neo 16 PTN16-51-978P
NVIDIA GeForce RTX 4070 Laptop GPU, Ultra 9 185H
69.1 (56min) fps
Asus ROG Zephyrus G16 2024 GU605M
NVIDIA GeForce RTX 4070 Laptop GPU, Ultra 7 155H
69 fps 0%
2560x1440 Ultra Preset (FSR off)
Average of class Gaming
  (24.8 - 110, n=72, last 2 years)
64.9 fps +53%
Alienware m16 R2
NVIDIA GeForce RTX 4070 Laptop GPU, Ultra 7 155H
52.7 (40.5min) fps +25%
Asus ProArt P16 H7606WI
NVIDIA GeForce RTX 4070 Laptop GPU, Ryzen AI 9 HX 370
49.4 (41.1min) fps +17%
Average NVIDIA GeForce RTX 4070 Laptop GPU
  (24.8 - 57.1, n=34)
49 fps +16%
Lenovo Yoga Pro 9 16IMH9
NVIDIA GeForce RTX 4070 Laptop GPU, Ultra 9 185H
47.8 (31.2min) fps +13%
Asus ROG Zephyrus G16 2024 GU605M
NVIDIA GeForce RTX 4070 Laptop GPU, Ultra 7 155H
43.7 fps +3%
Acer Predator Triton Neo 16 PTN16-51-978P
NVIDIA GeForce RTX 4070 Laptop GPU, Ultra 9 185H
42.3 (36min) fps

W przeciwieństwie do wydajności procesora i dysku SSD, szybkość GPU laptopa wydaje się pozostawać dość stabilna. Podczas naszego 30-minutowego testu przy użyciu Cyberpunk 2077nie odnotowaliśmy żadnych zauważalnych spadków FPS itp.

Cyberpunk 2077 ultra FPS diagram

051015202530354045505560657075Tooltip
Acer Predator Triton Neo 16 PTN16-51-978P Ultra 9 185H, NVIDIA GeForce RTX 4070 Laptop GPU: Ø65.8 (58.8-68.7)
Asus ProArt P16 H7606WI Ryzen AI 9 HX 370, NVIDIA GeForce RTX 4070 Laptop GPU: Ø60.7 (28.6-75.5)

Emisje

Emisja hałasu

Acer mógłby jeszcze poprawić sterowanie wentylatorem. W trybie wydajności Neo 16 jest czasami dość zauważalny nawet na biegu jałowym (32 do 34 dB) i czasami ma tendencję do zwiększania obrotów do 40 dB(A). Odpowiedniki zwykle pozostają znacznie cichsze. Odnotowaliśmy około 50 dB(A) pod obciążeniem, co jest bardzo obecne i może być irytujące bez zestawu słuchawkowego. Jednak konkurenci osiągają podobne lub nawet wyższe wartości w tym scenariuszu.

Hałas

luz
32 / 34 / 40 dB
obciążenie
48 / 51 dB
  red to green bar
 
 
30 dB
cichy
40 dB(A)
słyszalny
50 dB(A)
irytujący
 
min: dark, med: mid, max: light   Earthworks M23R, Arta (odległość 15 cm)   environment noise: 24 dB(A)
dB(A) 0102030405060708090Deep BassMiddle BassHigh BassLower RangeMidsHigher MidsLower HighsMid HighsUpper HighsSuper Highs2046.73838.737.438.643.52541.634.837.937.136.439.93145.342.44239.841.1464029.831.628.627.227.929503643.335.735.736.534.46329.924.52422.723.731.68022.327.317.116.718.423.610020.921.615.616.113.823.912528.227.226.333.914.627.916028.726.622.126.116.327.220030.32721.621.42028.925029.225.219.920.915.828.931528.824.818.719.513.529.540032.125.422.422.511.634.450034.832.423.323.711.336.763036.531.124.525.110.739.380038.831.825.125.910.741.5100038.130.322.623.710.941.312503830.622.724.111.440.9160038.930.422.123.311.541.9200038.529.220.921.711.441.3250036.426.71919.41239.8315035.325.720.721.212.338.6400035.525.916.116.512.838.8500034.221.414.915.313.237.7630029.917.11414.213.335.2800024.414.413.813.613.529.61000021.113.513.413.213.226.51250017.412.814.814.812.722.41600014.512.813.213.51216.8SPL48.140.132.833.724.551.2N63.21.71.90.67.5median 32.1median 25.9median 20.7median 21.2median 12.7median 35.2Delta5.56.33.74.11.56.3hearing rangehide median Fan NoiseAcer Predator Triton Neo 16 PTN16-51-978P
Acer Predator Triton Neo 16 PTN16-51-978P
Ultra 9 185H, NVIDIA GeForce RTX 4070 Laptop GPU
Asus ProArt P16 H7606WI
Ryzen AI 9 HX 370, NVIDIA GeForce RTX 4070 Laptop GPU
Lenovo Yoga Pro 9 16IMH9
Ultra 9 185H, NVIDIA GeForce RTX 4070 Laptop GPU
Asus ROG Zephyrus G16 2024 GU605M
Ultra 7 155H, NVIDIA GeForce RTX 4070 Laptop GPU
Alienware m16 R2
Ultra 7 155H, NVIDIA GeForce RTX 4070 Laptop GPU
Noise
9%
14%
18%
16%
off / environment *
24
24.4
-2%
24.3
-1%
23.9
-0%
24.7
-3%
Idle Minimum *
32
24.4
24%
24.3
24%
23.9
25%
25.3
21%
Idle Average *
34
27.7
19%
24.3
29%
27.8
18%
25.3
26%
Idle Maximum *
40
32.3
19%
25.8
35%
30.1
25%
25.3
37%
Load Average *
48
42.2
12%
48.1
-0%
34.2
29%
31.7
34%
Cyberpunk 2077 ultra *
50
53.2
-6%
Load Maximum *
51
53.2
-4%
53.9
-6%
46.4
9%
62
-22%
Witcher 3 ultra *
49.7
46.4
53.8

* ... im mniej tym lepiej

Temperatura

Jeśli chodzi o temperatury, odgałęzienie Acer wcale nie odbiega od normy. Maksymalnie 46 °C na górze i maksymalnie 48 °C na dole są typowe dla urządzenia RTX 4070. W trybie bezczynności obudowa utrzymuje się poniżej 30 °C, dzięki czemu pozostaje przyjemnie chłodna.

 45 °C46 °C45 °C 
 45 °C45 °C42 °C 
 34 °C33 °C32 °C 
maks. w ogóle: 46 °C
średnia: 40.8 °C
47 °C48 °C43 °C
42 °C44 °C39 °C
34 °C34 °C34 °C
maks. w ogóle: 48 °C
średnia: 40.6 °C
zasilacz  43 °C | temperatura otoczenia 21 °C | Fluke t3000FC (calibrated), Voltcraft IR-900
(-) The average temperature for the upper side under maximal load is 40.8 °C / 105 F, compared to the average of 33.9 °C / 93 F for the devices in the class Gaming.
(-) The maximum temperature on the upper side is 46 °C / 115 F, compared to the average of 40.5 °C / 105 F, ranging from 21.2 to 68.8 °C for the class Gaming.
(-) The bottom heats up to a maximum of 48 °C / 118 F, compared to the average of 43.2 °C / 110 F
(+) In idle usage, the average temperature for the upper side is 25.8 °C / 78 F, compared to the device average of 33.9 °C / 93 F.
(-) 3: The average temperature for the upper side is 39.3 °C / 103 F, compared to the average of 33.9 °C / 93 F for the class Gaming.
(+) The palmrests and touchpad are reaching skin temperature as a maximum (34 °C / 93.2 F) and are therefore not hot.
(-) The average temperature of the palmrest area of similar devices was 28.9 °C / 84 F (-5.1 °C / -9.2 F).
Acer Predator Triton Neo 16 PTN16-51-978P
Ultra 9 185H, NVIDIA GeForce RTX 4070 Laptop GPU
Asus ProArt P16 H7606WI
Ryzen AI 9 HX 370, NVIDIA GeForce RTX 4070 Laptop GPU
Lenovo Yoga Pro 9 16IMH9
Ultra 9 185H, NVIDIA GeForce RTX 4070 Laptop GPU
Asus ROG Zephyrus G16 2024 GU605M
Ultra 7 155H, NVIDIA GeForce RTX 4070 Laptop GPU
Alienware m16 R2
Ultra 7 155H, NVIDIA GeForce RTX 4070 Laptop GPU
Heat
-5%
6%
-5%
-20%
Maximum Upper Side *
46
46.9
-2%
41.7
9%
50.3
-9%
44.8
3%
Maximum Bottom *
48
50.9
-6%
46.3
4%
48
-0%
48
-0%
Idle Upper Side *
27
28.9
-7%
26.2
3%
28.8
-7%
37.2
-38%
Idle Bottom *
29
30
-3%
27.2
6%
29.8
-3%
42
-45%

* ... im mniej tym lepiej

Test warunków skrajnych

Zarówno w teście obciążeniowym przy użyciu narzędzi Furmark i Prime95, jak i podczas uruchamiania Cyberpunk 2077, CPU i GPU nagrzewały się do około 70 °C, co można sklasyfikować jako poziom umiarkowany.

Furmark & Prime95
Furmark & Prime95
Furmark & Prime95
Furmark & Prime95
Furmark & Prime95
Furmark & Prime95
Cyberpunk 2077
Cyberpunk 2077
Cyberpunk 2077
Cyberpunk 2077
Cyberpunk 2077
Cyberpunk 2077

Głośniki

Jakość dźwięku laptopa jest w średnim zakresie. Oprócz basów, średnie i wysokie tony mogłyby być mocniejsze i bardziej precyzyjne. Z drugiej strony, 16-calowe głośniki urządzenia mogą pochwalić się dobrą maksymalną głośnością 86 dB(A).

dB(A) 0102030405060708090Deep BassMiddle BassHigh BassLower RangeMidsHigher MidsLower HighsMid HighsUpper HighsSuper Highs2038.637.82536.434.83141.141.44027.927.45036.5366323.7268018.41910013.825.912514.642.116016.3462002051.125015.853.331513.555.440011.658.950011.362.263010.763.780010.768.4100010.973.4125011.474.6160011.577.1200011.475.325001268.5315012.366.3400012.876.4500013.275.4630013.378.7800013.574.21000013.2741250012.768.8160001267.8SPL24.586.2N0.664.9median 12.7median 68.4Delta1.59.635.641.331.233.642.933.838.540.426.435.225.539.728.148.120.960.820.265.217.961.719.46820.368.616.568.91471.111.771.711.174.410.974.410.571.910.77110.7691168.711.466.511.768.112.167.312.26412.563.612.365.212.460.812.259.411.65124.481.40.655.7median 12.2median 682.94hearing rangehide median Pink NoiseAcer Predator Triton Neo 16 PTN16-51-978PAsus ProArt P16 H7606WI
Frequency diagram (checkboxes can be checked and unchecked to compare devices)
Acer Predator Triton Neo 16 PTN16-51-978P audio analysis

(+) | speakers can play relatively loud (86 dB)
Bass 100 - 315 Hz
(-) | nearly no bass - on average 22.7% lower than median
(±) | linearity of bass is average (10.9% delta to prev. frequency)
Mids 400 - 2000 Hz
(±) | higher mids - on average 5.9% higher than median
(+) | mids are linear (5.3% delta to prev. frequency)
Highs 2 - 16 kHz
(±) | higher highs - on average 5.6% higher than median
(±) | linearity of highs is average (7.2% delta to prev. frequency)
Overall 100 - 16.000 Hz
(±) | linearity of overall sound is average (17.6% difference to median)
Compared to same class
» 48% of all tested devices in this class were better, 12% similar, 41% worse
» The best had a delta of 6%, average was 18%, worst was 132%
Compared to all devices tested
» 31% of all tested devices were better, 8% similar, 61% worse
» The best had a delta of 4%, average was 25%, worst was 134%

Asus ProArt P16 H7606WI audio analysis

(±) | speaker loudness is average but good (81.4 dB)
Bass 100 - 315 Hz
(+) | good bass - only 3% away from median
(±) | linearity of bass is average (8.3% delta to prev. frequency)
Mids 400 - 2000 Hz
(+) | balanced mids - only 3.5% away from median
(+) | mids are linear (2.5% delta to prev. frequency)
Highs 2 - 16 kHz
(+) | balanced highs - only 3% away from median
(+) | highs are linear (3.6% delta to prev. frequency)
Overall 100 - 16.000 Hz
(+) | overall sound is linear (8.5% difference to median)
Compared to same class
» 6% of all tested devices in this class were better, 2% similar, 91% worse
» The best had a delta of 5%, average was 18%, worst was 45%
Compared to all devices tested
» 2% of all tested devices were better, 1% similar, 98% worse
» The best had a delta of 4%, average was 25%, worst was 134%

Zarządzanie energią

Zużycie energii

Dzięki zintegrowanemu przełączaniu grafiki, Predator Triton jest dość oszczędny podczas bezczynności - zmierzyliśmy od 10 do 23 watów, więc znacznie poniżej średniej dla gier. Pod obciążeniem laptop Acer zużywa od 80 do 206 watów, co oznacza, że 230-watowy zasilacz nie jest przeciążony w żadnym momencie.

Pobór mocy
wyłączony / stan wstrzymaniadarklight 0.1 / 0.4 W
luzdarkmidlight 10 / 15 / 23 W
obciążenie midlight 80 / 206 W
 color bar
Legenda: min: dark, med: mid, max: light        Metrahit Energy
Acer Predator Triton Neo 16 PTN16-51-978P
Ultra 9 185H, NVIDIA GeForce RTX 4070 Laptop GPU
Asus ProArt P16 H7606WI
Ryzen AI 9 HX 370, NVIDIA GeForce RTX 4070 Laptop GPU
Lenovo Yoga Pro 9 16IMH9
Ultra 9 185H, NVIDIA GeForce RTX 4070 Laptop GPU
Asus ROG Zephyrus G16 2024 GU605M
Ultra 7 155H, NVIDIA GeForce RTX 4070 Laptop GPU
Alienware m16 R2
Ultra 7 155H, NVIDIA GeForce RTX 4070 Laptop GPU
Average of class Gaming
 
Power Consumption
6%
-10%
21%
-13%
-27%
Idle Minimum *
10
8
20%
10.3
-3%
8.3
17%
8.1
19%
Idle Average *
15
9.9
34%
21.9
-46%
12.5
17%
13
13%
Idle Maximum *
23
11.6
50%
22.4
3%
12.8
44%
40.3
-75%
Load Average *
80
76.9
4%
96.9
-21%
71.3
11%
79
1%
Cyberpunk 2077 ultra *
122
157.7
-29%
Cyberpunk 2077 ultra external monitor *
118.7
156.6
-32%
Load Maximum *
206
212.6
-3%
173.8
16%
169.1
18%
254.9
-24%
Witcher 3 ultra *
159.6
127.5
188.1

* ... im mniej tym lepiej

Power consumption Cyberpunk / stress test

0153045607590105120135150165180195Tooltip
Acer Predator Triton Neo 16 PTN16-51-978P; 1280x720 Prime95 28.10 and Furmark 1.25: Ø134.8 (117.1-206)
Acer Predator Triton Neo 16 PTN16-51-978P; Idle 150cd/m2: Ø15 (9.95-22.4)
Acer Predator Triton Neo 16 PTN16-51-978P; Cyberpunk 2077 FHD ultra no FSR 150cd: Ø122 (114.8-132.3)

Power consumption with external monitor

0102030405060708090100110120Tooltip
Acer Predator Triton Neo 16 PTN16-51-978P; Prime95 V2810 Stress (external Monitor): Ø75 (56.1-126)
Acer Predator Triton Neo 16 PTN16-51-978P; Cinebench R23 Multi (external Monitor): Ø121.1 (119.5-122.3)
Acer Predator Triton Neo 16 PTN16-51-978P; 1280x720 FurMark 1.19 GPU Stress Test (external Monitor): Ø109.1 (104-129.4)
Acer Predator Triton Neo 16 PTN16-51-978P; Idle 1min (external Monitor): Ø15.7 (8.37-23)
Acer Predator Triton Neo 16 PTN16-51-978P; Cyberpunk 2077 FHD ultra no FSR (external Monitor): Ø118.7 (111.6-124.9)

Czas trwania

Chociaż jego odpowiedniki mają nieco większe baterie (84 do 90 Wh zamiast 76 Wh), żywotność baterii Neo 16 nie ma nic do ukrycia. Około 7,5 godziny bezprzewodowego surfowania po sieci z jasnością zredukowaną do 150 cd/m² to przyzwoita wartość. Dla porównania: konkurencja osiąga od 7 do 9 godzin.

Wydajność akumulatora
WiFi Websurfing
7h 24min
Acer Predator Triton Neo 16 PTN16-51-978P
Ultra 9 185H, NVIDIA GeForce RTX 4070 Laptop GPU, 76 Wh
Asus ProArt P16 H7606WI
Ryzen AI 9 HX 370, NVIDIA GeForce RTX 4070 Laptop GPU, 90 Wh
Lenovo Yoga Pro 9 16IMH9
Ultra 9 185H, NVIDIA GeForce RTX 4070 Laptop GPU, 84 Wh
Asus ROG Zephyrus G16 2024 GU605M
Ultra 7 155H, NVIDIA GeForce RTX 4070 Laptop GPU, 90 Wh
Alienware m16 R2
Ultra 7 155H, NVIDIA GeForce RTX 4070 Laptop GPU, 90 Wh
Average of class Gaming
 
Czasy pracy
12%
18%
-2%
9%
-15%
WiFi v1.3
444
499
12%
526
18%
435
-2%
483
9%
H.264
1260
692
671
Load
116
73
71
60
Reader / Idle
758

Łączna ocena Notebookcheck

W przypadku Predator Triton Neo 16 nie można się pomylić, ponieważ 16-calowy model nie ma żadnych rażących słabości. Konkurencja ze strony innych producentów jest jednak silna i czasami wysuwa się na prowadzenie.

Acer Predator Triton Neo 16 PTN16-51-978P - 31/12/2024 v8
Florian Glaser

Wykonanie
83 / 98 → 85%
Klawiatura
83%
Myszka
83%
Komunikacja
66 / 80 → 83%
Waga
63 / 10-68 → 91%
Akumulator
76 / 95 → 80%
Wyświetlacz
86%
Wydajność w grach
80%
Wydajność w programach użytkowych
86%
AI Performance
86%
Temperatura
86 / 95 → 90%
Hałas
58 / 90 → 65%
Głośniki
69%
Kamerka
42 / 75 → 57%
Średnio
64%
81%
Gaming - Ważona średnia
CO2 Emissions
No Data
Materials
50%
Packaging
50%
Power Use
84.5%
Repairability
50%
Software Updates
22.3%
Recycle Logo Total Sustainability Score: 42.8%

Transparency

The selection of devices to be reviewed is made by our editorial team. The test sample was provided to the author as a loan by the manufacturer or retailer for the purpose of this review. The lender had no influence on this review, nor did the manufacturer receive a copy of this review before publication. There was no obligation to publish this review. We never accept compensation or payment in return for our reviews. As an independent media company, Notebookcheck is not subjected to the authority of manufacturers, retailers or publishers.

This is how Notebookcheck is testing

Every year, Notebookcheck independently reviews hundreds of laptops and smartphones using standardized procedures to ensure that all results are comparable. We have continuously developed our test methods for around 20 years and set industry standards in the process. In our test labs, high-quality measuring equipment is utilized by experienced technicians and editors. These tests involve a multi-stage validation process. Our complex rating system is based on hundreds of well-founded measurements and benchmarks, which maintains objectivity. Further information on our test methods can be found here.

Please share our article, every link counts!
Mail Logo
> laptopy testy i recenzje notebooki > Laptopy > Recenzja Acer Predator Triton Neo 16: Laptop premium z RTX 4070 dla graczy i twórców
Florian Glaser, 2024-12-31 (Update: 2024-12-31)