Notebookcheck Logo

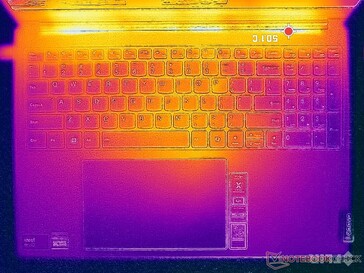
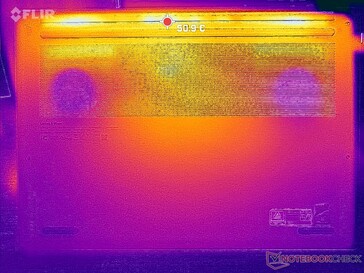
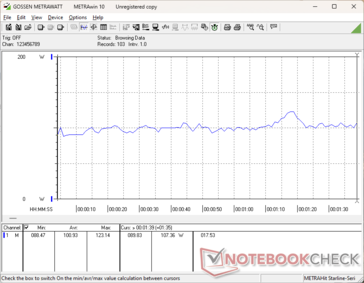
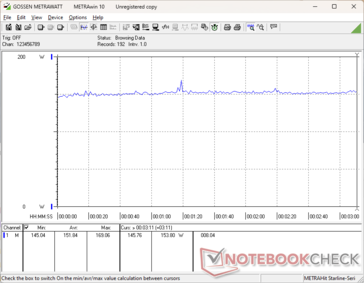
Recenzja laptopa Lenovo Yoga Pro 9 16IMH9: 75 W GeForce RTX 4050 osiąga ponadprzeciętne wyniki
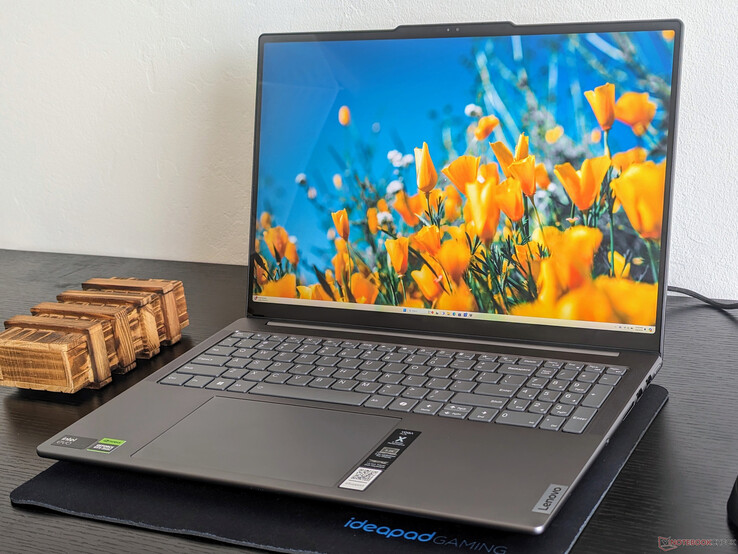
Nadal świetne bez Mini-LED.

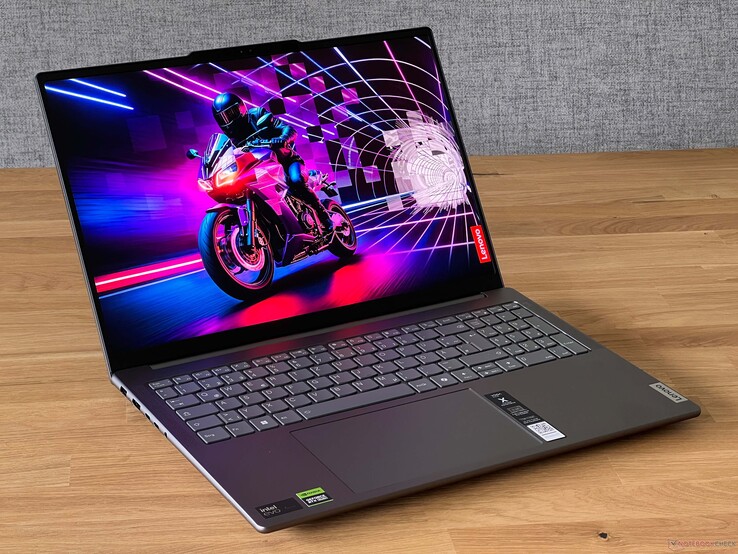
Flagowy model Lenovo i najbliższy konkurent MacBooka Pro 16 oferuje mnóstwo mocy w stosunku do rozmiaru, nawet w konfiguracji z niższej półki. Kosztując jednak znacznie ponad 1500 USD, jest to również jeden z droższych laptopów Lenovo Yoga.
Laptop / Notebook Meteor Lake Geforce Thunderbolt Intel Evo
Lenovo Yoga Pro 9 16IMH9 RTX 4050

Seria Yoga Pro 9 jest domem dla flagowej linii laptopów multimedialnych Lenovo powyżej wyższej klasy średniej Seria Yoga 7 16 i niższej klasy IdeaPad Pro 5 16. Niedawno odeszliśmy pod wrażeniem najwyższej klasy konfiguracji Yoga Pro 9 wyposażoną w mini-LED i grafikę GeForce RTX 4070. Tym razem sprawdzamy tańszą jednostkę SKU ze standardowym IPS i grafiką GeForce RTX 4050.

Naszą konfigurację można znaleźć w Internecie za około 1700 USD. Alternatywy obejmują inne 16-calowe laptopy multimedialne lub studyjne, takie jak MSI Stealth 16,HP Envy x360 2-w-1 16, Dell XPS 16 9640lub Samsung Galaxy Book4 Ultra.

Więcej recenzji Lenovo:

Lenovo Yoga Pro 9 16IMH9 RTX 4050 (Yoga Pro 9 16 Rodzina)
Procesor
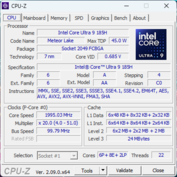
Intel Core Ultra 9 185H 16 x 3.8 - 5.1 GHz, 120 W PL2 / Short Burst, 83 W PL1 / Sustained, Meteor Lake-H
Karta grafiki
NVIDIA GeForce RTX 4050 Laptop GPU - 6 GB VRAM, rdzeń: 2055 MHz, pamięć: 2000 MHz, 100 W TDP, GDDR6, 555.85, Advanced Optimus
Pamięć
32 GB 
, LPDDR5x-7467, Dual-Channel
Matryca
16.00 cali 16:10, 3200 x 2000 pikseli 236 PPI, LEN160-3.2K, IPS, 10-point capacitive, refleksująca: tak, 165 Hz
Chipset
Intel Meteor Lake-U/P/H PCH
Dysk twardy
SK Hynix HFS001TEJ9X115N, 1024 GB 
Karta dźwiękowa
Intel Meteor Lake-U/P/H PCH - cAVS (Audio, Voice, Speech)
Złącza
2 USB 3.0, 1 USB 3.2 Gen 2x2 20Gbps, 1 USB 4.0 40 Gbps, 1 Thunderbolt, USB-C Power Delivery (PD), 1 HDMI, 2 DisplayPort, gniazda audio: 3.5 mm, czytnik kart: SDXC
Łączność
Intel Wi-Fi 6E AX211 (a/b/g/h/n = Wi-Fi 4/ac = Wi-Fi 5/ax = Wi-Fi 6/ Wi-Fi 6E 6 GHz), Bluetooth 5.3
Gabaryty
wysokość x szerokość x głębokość (mm): 18.3 x 362.72 x 253.69
Akumulator
84 Wh, 5285 mAh litowo-polimerowy
System operacyjny
Microsoft Windows 11 Home
Camera
kamerka: 5 MP + IR
Primary Camera: 5 MPix
Inne
głośniki: Six speakers, klawiatura: Chiclet, podświetlanie klawiatury: tak, Vantage, 12 miesiące(y) gwarancji
Waga
2.147 kg, zasilacz: 580 g
Cena
1900 USD
Note: The manufacturer may use components from different suppliers including display panels, drives or memory sticks with similar specifications.


Potencjalni konkurenci w porównaniu

Rating
Date
Model
Weight
Height
Size
Resolution
Price
91.7 %
v7 (old)
06/2024
Lenovo Yoga Pro 9 16IMH9 RTX 4050
Ultra 9 185H, NVIDIA GeForce RTX 4050 Laptop GPU
2.1 kg18.3 mm16.00"3200x2000
88.7 %
v7 (old)
04/2024
Lenovo Yoga Pro 9 16IMH9
Ultra 9 185H, NVIDIA GeForce RTX 4070 Laptop GPU
2.1 kg18.3 mm16.00"3200x2000
87.2 %
v7 (old)
05/2024
HP Envy x360 2-in-1 16-ad0097nr
R7 8840HS, Radeon 780M
1.8 kg18.3 mm16.00"2880x1800
88.6 %
v7 (old)
04/2024
Dell XPS 16 9640
Ultra 7 155H, NVIDIA GeForce RTX 4070 Laptop GPU
2.3 kg18.7 mm16.30"3840x2400
90.4 %
v7 (old)
03/2024
Samsung Galaxy Book4 Ultra
Ultra 7 155H, NVIDIA GeForce RTX 4050 Laptop GPU
1.8 kg17 mm16.00"2880x1800
87.6 %
v7 (old)
11/2023
Asus VivoBook Pro 16 K6602VU
i9-13900H, NVIDIA GeForce RTX 4050 Laptop GPU
1.9 kg19 mm16.00"3200x2000

Sprawa

Porównanie rozmiarów

362.72 mm 253.69 mm 18.3 mm 2.1 kg362.72 mm 253.69 mm 18.3 mm 2.1 kg358.18 mm 240 mm 18.7 mm 2.3 kg357 mm 246 mm 18.3 mm 1.8 kg355.3 mm 252 mm 19 mm 1.9 kg355 mm 250 mm 17 mm 1.8 kg297 mm 210 mm 1 mm 5.7 g

Łączność

Po lewej: port zasilania (SlimTip), HDMI 2.1, USB-C 3.2 Gen.2 (20 Gbit/s, DisplayPort ALT mode 1.4, Power Delivery 3.0), USB-C 4.0 z Thunderbolt 4 (40 GBit/s, DisplayPort Alt mode 2.1, Power Delivery 3.0), 3,5 mm audio
Po prawej: kamera internetowa eShutter, czytnik kart SD, 2x USB-A 3.2 Gen.1 (5 Gbit/s), przycisk zasilania

Czytnik kart SD

SD Card Reader
average JPG Copy Test (av. of 3 runs)
Asus VivoBook Pro 16 K6602VU
Intel Core i9-13900H (Angelbird AV Pro V60)
163.5 (157.23min - 168.58max) MB/s +90%
Dell XPS 16 9640
Intel Core Ultra 7 155H (Angelbird AV Pro V60)
148 MB/s +72%
Lenovo Yoga Pro 9 16IMH9 RTX 4050
Intel Core Ultra 9 185H (Angelbird AV Pro V60)
86.1 MB/s
Samsung Galaxy Book4 Ultra
Intel Core Ultra 7 155H (Angelbird AV Pro V60)
78.8 MB/s -8%
Lenovo Yoga Pro 9 16IMH9
Intel Core Ultra 9 185H (Angelbird AV Pro V60)
78.3 MB/s -9%
maximum AS SSD Seq Read Test (1GB)
Asus VivoBook Pro 16 K6602VU
Intel Core i9-13900H (Angelbird AV Pro V60)
232.36 MB/s +158%
Dell XPS 16 9640
Intel Core Ultra 7 155H (Angelbird AV Pro V60)
204.3 MB/s +126%
Lenovo Yoga Pro 9 16IMH9 RTX 4050
Intel Core Ultra 9 185H (Angelbird AV Pro V60)
90.2 MB/s
Lenovo Yoga Pro 9 16IMH9
Intel Core Ultra 9 185H (Angelbird AV Pro V60)
89.9 MB/s 0%
Samsung Galaxy Book4 Ultra
Intel Core Ultra 7 155H (Angelbird AV Pro V60)
87.2 MB/s -3%

Komunikacja

Networking
iperf3 transmit AXE11000
Lenovo Yoga Pro 9 16IMH9
Intel Wi-Fi 6E AX211
1650 (1445min - 1723max) MBit/s +124%
Samsung Galaxy Book4 Ultra
Intel Wi-Fi 6E AX211
1625 (1476min, 1476.87P1 - 1697max) MBit/s +120%
HP Envy x360 2-in-1 16-ad0097nr
MediaTek Wi-Fi 6E MT7922 160MHz Wireless LAN Card
1608 (1424min - 1752max) MBit/s +118%
Asus VivoBook Pro 16 K6602VU
Intel Wi-Fi 6E AX211
1606 (1503min - 1654max) MBit/s +118%
Dell XPS 16 9640
Intel Wi-Fi 7 BE200 320MHz
1580 (1483min - 1663max) MBit/s +114%
Lenovo Yoga Pro 9 16IMH9 RTX 4050
Intel Wi-Fi 6E AX211
737 (581min - 806max) MBit/s
iperf3 receive AXE11000
Samsung Galaxy Book4 Ultra
Intel Wi-Fi 6E AX211
1715 (1675min, 1683.7P1 - 1731max) MBit/s +113%
Asus VivoBook Pro 16 K6602VU
Intel Wi-Fi 6E AX211
1701 (1196min - 1751max) MBit/s +111%
Lenovo Yoga Pro 9 16IMH9
Intel Wi-Fi 6E AX211
1654 (1568min - 1702max) MBit/s +105%
Dell XPS 16 9640
Intel Wi-Fi 7 BE200 320MHz
1591 (1476min - 1622max) MBit/s +98%
HP Envy x360 2-in-1 16-ad0097nr
MediaTek Wi-Fi 6E MT7922 160MHz Wireless LAN Card
1551 (1450min - 1626max) MBit/s +93%
Lenovo Yoga Pro 9 16IMH9 RTX 4050
Intel Wi-Fi 6E AX211
805 (713min - 855max) MBit/s
iperf3 transmit AXE11000 6GHz
HP Envy x360 2-in-1 16-ad0097nr
MediaTek Wi-Fi 6E MT7922 160MHz Wireless LAN Card
1626 (1381min - 1818max) MBit/s +51%
Asus VivoBook Pro 16 K6602VU
Intel Wi-Fi 6E AX211
1381 (1289min - 1536max) MBit/s +28%
Lenovo Yoga Pro 9 16IMH9 RTX 4050
Intel Wi-Fi 6E AX211
1078 (1020min - 1139max) MBit/s
iperf3 receive AXE11000 6GHz
HP Envy x360 2-in-1 16-ad0097nr
MediaTek Wi-Fi 6E MT7922 160MHz Wireless LAN Card
1639 (1591min - 1742max) MBit/s +30%
Asus VivoBook Pro 16 K6602VU
Intel Wi-Fi 6E AX211
1628 (1393min - 1717max) MBit/s +29%
Lenovo Yoga Pro 9 16IMH9 RTX 4050
Intel Wi-Fi 6E AX211
1262 (1155min - 1336max) MBit/s
0501001502002503003504004505005506006507007508008509009501000105011001150120012501300Tooltip
Lenovo Yoga Pro 9 16IMH9 RTX 4050; iperf3 transmit AXE11000 6GHz; iperf 3.1.3: Ø1078 (1020-1139)
Lenovo Yoga Pro 9 16IMH9 RTX 4050; iperf3 receive AXE11000 6GHz; iperf 3.1.3: Ø1262 (1155-1336)

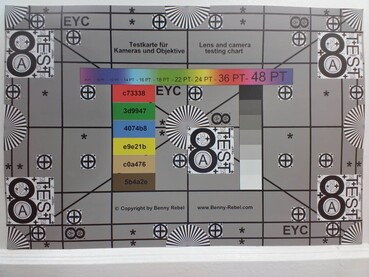
Kamera internetowa

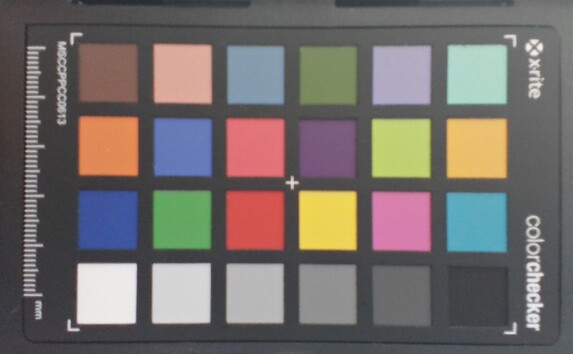
ColorChecker
6.8 ∆E
6.7 ∆E
13.3 ∆E
13.2 ∆E
15.2 ∆E
12.2 ∆E
7.5 ∆E
11.1 ∆E
9.4 ∆E
11.1 ∆E
7.7 ∆E
8.8 ∆E
8.1 ∆E
7.3 ∆E
11.9 ∆E
4.6 ∆E
12.3 ∆E
13 ∆E
3 ∆E
2.7 ∆E
6.9 ∆E
8.5 ∆E
8.9 ∆E
5.2 ∆E
ColorChecker Lenovo Yoga Pro 9 16IMH9 RTX 4050: 8.97 ∆E min: 2.68 - max: 15.16 ∆E

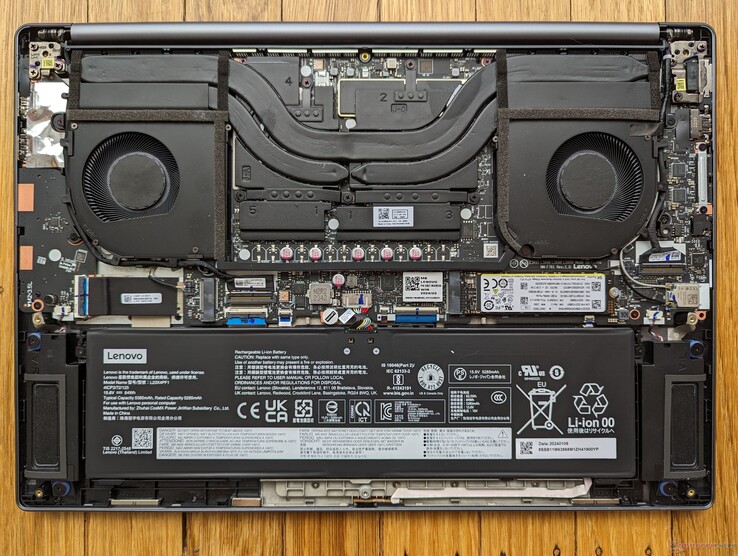
Konserwacja

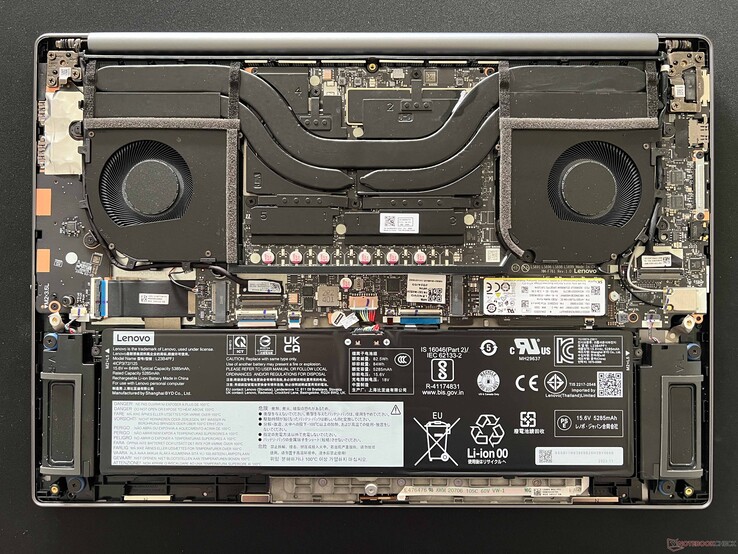
Yoga Pro 9 16IMH9 RTX 4050
Yoga Pro 9 16IMH9 RTX 4070 dla porównania, aby pokazać brak większych różnic wewnętrznych

Wyświetlacz - opcje 3,2K IPS i mini-LED

Lenovo oferuje trzy następujące opcje wyświetlaczy. Wszystkie panele mają tę samą rozdzielczość natywną 3200 x 2000 i częstotliwość odświeżania z obsługą Advanced Optimus, ale bez G-Sync. Nasza jednostka testowa posiada pogrubioną opcję poniżej, podczas gdy wyższa konfiguracja RTX 4070 posiada opcję mini-LED.

  • 3.2K, 165 Hz, IPS, 400 nitów, 100% P3, matowy, bezdotykowy
  • 3.2K, 165 Hz, IPS, 400 nitów, 100% P3, błyszczący, dotykowy
  • 3.2K, 165 Hz, Mini-LED, 1200 nitów, 100% P3, błyszczący, dotykowy

Wrażenia wizualne między opcjami IPS i mini-LED są zaskakująco podobne, ponieważ ich zakresy kolorów i częstotliwości odświeżania są zasadniczo takie same. IPS korzysta jednak z szybszego czasu reakcji czerni i bieli oraz nie ma większych problemów z efektem halo w porównaniu do mini-LED. Różnice między nimi są natomiast większe w przypadku korzystania z treści obsługujących HDR, gdzie mini-LED naprawdę błyszczy dzięki lepszemu kontrastowi i poziomom jasności. Użytkownicy, którzy oglądają lub grają w wiele multimediów HDR, mogą zatem preferować mini-LED, podczas gdy ci, którzy chcą zaoszczędzić pieniądze lub nie mają nic przeciwko rezygnacji z HDR, mogą uzyskać bardziej tradycyjne wrażenia z IPS.

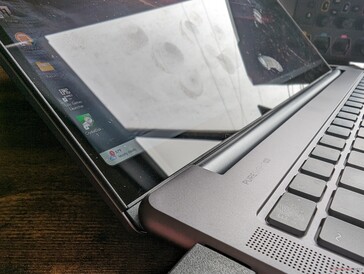
Szkło od krawędzi do krawędzi dla konfiguracji z obsługą dotykową
W tym roku nie ma opcji OLED - tylko IPS lub mini-LED
Wyraźne subpiksele RGB z minimalną ziarnistością wynikającą z błyszczącej nakładki
Brak poważnych problemów z krwawieniem podświetlenia
380.2
cd/m²
397.3
cd/m²
406.7
cd/m²
376.4
cd/m²
404.9
cd/m²
406.5
cd/m²
370.4
cd/m²
392.5
cd/m²
377.2
cd/m²
podświetlenie ekranu
LEN160-3.2K tested with X-Rite i1Pro 2
maksimum: 406.7 cd/m² (Nits) średnia: 390.2 cd/m² Minimum: 3.12 cd/m²
rozświetlenie: 91 %
na akumulatorze: 404.9 cd/m²
kontrast: 1012:1 (czerń: 0.4 cd/m²)
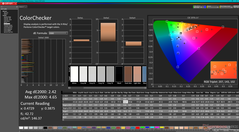
ΔE Color 2.42 | 0.5-29.43 Ø4.91, calibrated: 0.93
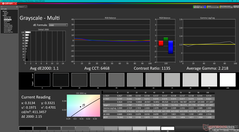
ΔE Greyscale 1.1 | 0.5-98 Ø5.2
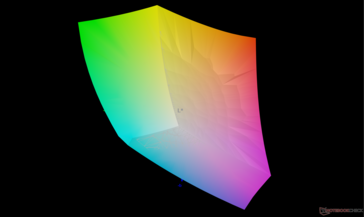
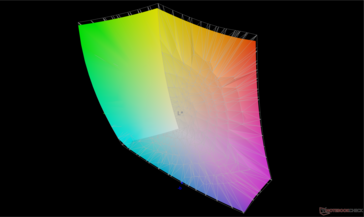
86.5% AdobeRGB 1998 (Argyll 2.2.0 3D)
99.9% sRGB (Argyll 2.2.0 3D)
95.6% Display P3 (Argyll 2.2.0 3D)
Gamma: 2.22
Lenovo Yoga Pro 9 16IMH9 RTX 4050
LEN160-3.2K, IPS, 3200x2000, 16"
Lenovo Yoga Pro 9 16IMH9
LEN160-3.2K, Mini-LED, 3200x2000, 16"
HP Envy x360 2-in-1 16-ad0097nr
Samsung SDC41A6, OLED, 2880x1800, 16"
Dell XPS 16 9640
SDC4196, OLED, 3840x2400, 16.3"
Samsung Galaxy Book4 Ultra
ATNA60CL07-0, OLED, 2880x1800, 16"
Asus VivoBook Pro 16 K6602VU
Samsung ATNA60BX01-1, OLED, 3200x2000, 16"
Display
0%
5%
2%
2%
5%
Display P3 Coverage
95.6
97
1%
99.6
4%
98.3
3%
98.6
3%
98.7
3%
sRGB Coverage
99.9
99.9
0%
100
0%
100
0%
99.9
0%
99.7
0%
AdobeRGB 1998 Coverage
86.5
86.6
0%
96.5
12%
87.8
2%
88.5
2%
96.5
12%
Response Times
-85%
92%
92%
94%
24%
Response Time Grey 50% / Grey 80% *
12.4 ?(6.3, 6.1)
22.2 ?(9.6, 12.6)
-79%
0.8 ?(0.45, 0.35)
94%
0.82 ?(0.43, 0.39)
93%
0.54 ?(0.29, 0.25)
96%
0.68 ?(0.32, 0.36)
95%
Response Time Black / White *
8.9 ?(4.8, 4.1)
17 ?(8.2, 8.8)
-91%
0.89 ?(0.42, 0.47)
90%
0.85 ?(0.46, 0.39)
90%
0.69 ?(0.39, 0.3)
92%
13.2 ?(10.8, 2.4)
-48%
PWM Frequency
4840 ?(100)
491.8 ?(100)
360 ?(90)
240 ?(100)
240 ?(100)
Screen
30%
-16%
-7%
-0%
-61%
Brightness middle
404.9
651
61%
399.4
-1%
366
-10%
390
-4%
353
-13%
Brightness
390
673
73%
405
4%
367
-6%
393
1%
354
-9%
Brightness Distribution
91
93
2%
98
8%
96
5%
98
8%
98
8%
Black Level *
0.4
0.22
45%
Contrast
1012
2959
192%
Colorchecker dE 2000 *
2.42
1.9
21%
4.05
-67%
1.3
46%
1.4
42%
4.23
-75%
Colorchecker dE 2000 max. *
4.65
4.2
10%
6.69
-44%
3.6
23%
2.7
42%
7.13
-53%
Colorchecker dE 2000 calibrated *
0.93
0.6
35%
1.02
-10%
1
-8%
2.42
-160%
Greyscale dE 2000 *
1.1
3
-173%
1.1
-0%
2.2
-100%
2.1
-91%
2.5
-127%
Gamma
2.22 99%
2.18 101%
2.27 97%
2.14 103%
2.27 97%
2.4 92%
CCT
6468 100%
6738 96%
6419 101%
6680 97%
6431 101%
6642 98%
Total Average (Program / Settings)
-18% / 7%
27% / 8%
29% / 12%
32% / 17%
-11% / -31%

* ... im mniej tym lepiej

vs. sRGB
vs. sRGB
vs. P3
vs. P3

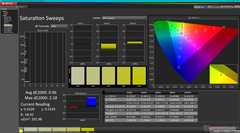
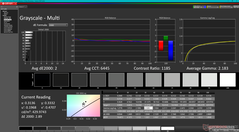
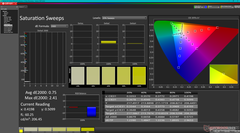
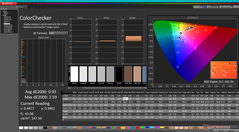
Wyświetlacz jest skalibrowany od razu po wyjęciu z pudełka zgodnie ze standardem P3 ze średnimi wartościami deltaE skali szarości i koloru wynoszącymi odpowiednio zaledwie 1,1 i 2,42. Kalibracja przez użytkownika końcowego nie jest zatem konieczna dla większości użytkowników.

Skala szarości przed kalibracją (vs. P3)
Przemiatanie nasycenia przed kalibracją (vs. P3)
ColorChecker przed kalibracją (vs. P3)
Skala szarości po kalibracji
Pomiary nasycenia po kalibracji
ColorChecker po kalibracji

Display Response Times

Display response times show how fast the screen is able to change from one color to the next. Slow response times can lead to afterimages and can cause moving objects to appear blurry (ghosting). Gamers of fast-paced 3D titles should pay special attention to fast response times.
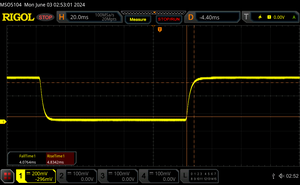
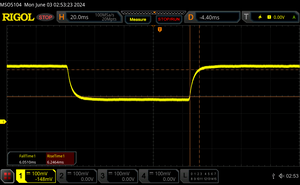
       Response Time Black to White
8.9 ms ... rise ↗ and fall ↘ combined↗ 4.8 ms rise
↘ 4.1 ms fall
The screen shows fast response rates in our tests and should be suited for gaming.
In comparison, all tested devices range from 0.1 (minimum) to 240 (maximum) ms. » 21 % of all devices are better.
This means that the measured response time is better than the average of all tested devices (20.9 ms).
       Response Time 50% Grey to 80% Grey
12.4 ms ... rise ↗ and fall ↘ combined↗ 6.3 ms rise
↘ 6.1 ms fall
The screen shows good response rates in our tests, but may be too slow for competitive gamers.
In comparison, all tested devices range from 0.165 (minimum) to 636 (maximum) ms. » 22 % of all devices are better.
This means that the measured response time is better than the average of all tested devices (32.8 ms).

Screen Flickering / PWM (Pulse-Width Modulation)

To dim the screen, some notebooks will simply cycle the backlight on and off in rapid succession - a method called Pulse Width Modulation (PWM) . This cycling frequency should ideally be undetectable to the human eye. If said frequency is too low, users with sensitive eyes may experience strain or headaches or even notice the flickering altogether.
Screen flickering / PWM not detected

In comparison: 53 % of all tested devices do not use PWM to dim the display. If PWM was detected, an average of 8702 (minimum: 5 - maximum: 343500) Hz was measured.

Na zewnątrz w świetle słonecznym
Na zewnątrz w cieniu. Odblask jest bardziej zauważalny w porównaniu do mini-LED
Na zewnątrz w świetle słonecznym
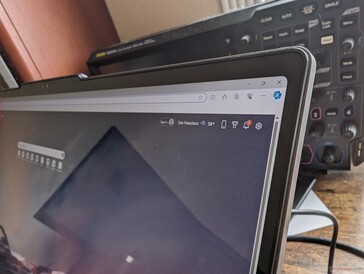
Szerokie kąty widzenia IPS. Kolory i kontrast pogarszają się łatwiej w porównaniu do mini-LED

Wydajność - wszechstronna maszyna do gier multimedialnych


Warunki testowania

Przed uruchomieniem poniższych testów porównawczych ustawiliśmy Lenovo Vantage na tryb wydajności, a Nvidię na tryb dGPU.

Proszę zauważyć, że chociaż GPU można ustawić tylko na tryb dyskretny, to w Panelu sterowania Nvidia nie ma trybu "tylko iGPU".

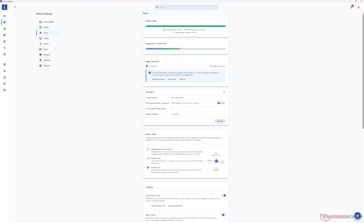
Ekran główny Vantage
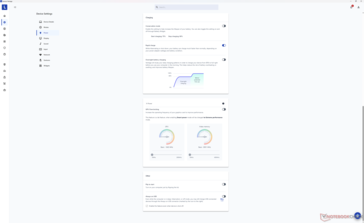
Ustawienia profilu wydajności
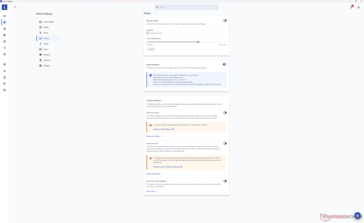
Podkręcanie GPU jest dostępne nawet dla konfiguracji RTX 4050
Ustawienia wykrywania obecności i ładowania baterii

Procesor

The Core Ultra 9 185H w naszej konfiguracji RTX 4050 osiąga wydajność w granicach 3 punktów procentowych tego samego procesora w wyższej konfiguracji RTX 4070. Oferuje on wyższą wydajność niż ustępujący Core i7-13900H jednocześnie integrując jednostkę NPU do zadań akcelerowanych przez sztuczną inteligencję. Obniżenie wersji do Core Ultra 7 155H ma wpłynąć na wydajność tylko o 5 do 10 procent w oparciu o nasz czas spędzony z Dell XPS 16 9640.

Cinebench R15 Multi Loop

01553104656207759301085124013951550170518602015217023252480263527902945Tooltip
Lenovo Yoga Pro 9 16IMH9 RTX 4050 Intel Core Ultra 9 185H: Ø2824 (2750.84-2985.74)
Lenovo Yoga Pro 9 16IMH9 Intel Core Ultra 9 185H: Ø2931 (2869.44-3004.58)
HP Envy x360 2-in-1 16-ad0097nr AMD Ryzen 7 8840HS: Ø1951 (1885.73-2044.68)
Dell XPS 16 9640 Intel Core Ultra 7 155H: Ø2707 (2643.06-2817.5)
Samsung Galaxy Book4 Ultra Intel Core Ultra 7 155H: Ø2195 (2134.59-2575.83)
Asus VivoBook Pro 16 K6602VU Intel Core i9-13900H: Ø2244 (2186.27-2513.98)
CPU Performance Rating: Percent
Cinebench R23: Multi Core | Single Core
Cinebench R20: CPU (Multi Core) | CPU (Single Core)
Cinebench R15: CPU Multi 64Bit | CPU Single 64Bit
Blender: v2.79 BMW27 CPU
7-Zip 18.03: 7z b 4 | 7z b 4 -mmt1
Geekbench 6.3: Multi-Core | Single-Core
Geekbench 5.5: Multi-Core | Single-Core
HWBOT x265 Benchmark v2.2: 4k Preset
LibreOffice : 20 Documents To PDF
R Benchmark 2.5: Overall mean
CPU Performance Rating
Lenovo Legion 9 16IRX9, RTX 4090
Intel Core i9-14900HX
80 pt
Alienware m16 R1 AMD
AMD Ryzen 9 7845HX
79.4 pt
Acer Predator Helios Neo 16 (2024)
Intel Core i7-14700HX
79.4 pt
Alienware m16 R1 Intel
Intel Core i7-13700HX
70.9 pt
Lenovo Yoga Pro 9 16IMH9
Intel Core Ultra 9 185H
69.3 pt
HP Victus 16 (2024)
Intel Core i7-14700HX
67.8 pt
Lenovo Yoga Pro 9 16IMH9 RTX 4050
Intel Core Ultra 9 185H
67.5 pt
Framework Laptop 16
AMD Ryzen 9 7940HS
65.3 pt
Lenovo Legion Slim 5 16APH8 -2!
AMD Ryzen 7 7840HS
64.5 pt
Dell XPS 16 9640
Intel Core Ultra 7 155H
64.2 pt
Average Intel Core Ultra 9 185H
 
63.4 pt
Asus ZenBook Pro 16X OLED UX7602ZM-ME115W -2!
Intel Core i9-12900H
61.4 pt
Samsung Galaxy Book4 Ultra
Intel Core Ultra 7 155H
60.6 pt
HP Pavilion Plus 16-ab0456tx
Intel Core i7-13700H
58.9 pt
Asus VivoBook Pro 16 K6602VU
Intel Core i9-13900H
57.5 pt
HP Envy x360 2-in-1 16-ad0097nr
AMD Ryzen 7 8840HS
56.3 pt
Lenovo Yoga 7 2-in-1 16IML9
Intel Core Ultra 5 125U
44.7 pt
Cinebench R23 / Multi Core
Lenovo Legion 9 16IRX9, RTX 4090
Intel Core i9-14900HX
31889 Points +66%
Alienware m16 R1 AMD
AMD Ryzen 9 7845HX
26876 (25414.3min - 26876.4max) Points +40%
HP Victus 16 (2024)
Intel Core i7-14700HX
23887 Points +24%
Acer Predator Helios Neo 16 (2024)
Intel Core i7-14700HX
23207 Points +21%
Alienware m16 R1 Intel
Intel Core i7-13700HX
21889 Points +14%
Lenovo Yoga Pro 9 16IMH9
Intel Core Ultra 9 185H
19851 Points +3%
Lenovo Yoga Pro 9 16IMH9 RTX 4050
Intel Core Ultra 9 185H
19236 (18458.9min - 19236max) Points
Dell XPS 16 9640
Intel Core Ultra 7 155H
18433 Points -4%
Average Intel Core Ultra 9 185H
  (12688 - 19851, n=19)
17767 Points -8%
Lenovo Legion Slim 5 16APH8
AMD Ryzen 7 7840HS
17088 (16600.7min - 17088.2max) Points -11%
Asus ZenBook Pro 16X OLED UX7602ZM-ME115W
Intel Core i9-12900H
16691 (16019.4min - 16691.2max) Points -13%
Framework Laptop 16
AMD Ryzen 9 7940HS
16519 (16352.4min - 16518.9max) Points -14%
Samsung Galaxy Book4 Ultra
Intel Core Ultra 7 155H
15698 Points -18%
Asus VivoBook Pro 16 K6602VU
Intel Core i9-13900H
14958 Points -22%
HP Envy x360 2-in-1 16-ad0097nr
AMD Ryzen 7 8840HS
13082 (12624.7min - 13082.1max) Points -32%
HP Pavilion Plus 16-ab0456tx
Intel Core i7-13700H
10053 Points -48%
Lenovo Yoga 7 2-in-1 16IML9
Intel Core Ultra 5 125U
9533 (8675.99min - 9532.96max) Points -50%
Cinebench R23 / Single Core
Acer Predator Helios Neo 16 (2024)
Intel Core i7-14700HX
2103 Points +17%
Alienware m16 R1 Intel
Intel Core i7-13700HX
1933 Points +8%
HP Pavilion Plus 16-ab0456tx
Intel Core i7-13700H
1914 Points +6%
Lenovo Yoga Pro 9 16IMH9
Intel Core Ultra 9 185H
1906 Points +6%
Alienware m16 R1 AMD
AMD Ryzen 9 7845HX
1852 Points +3%
Lenovo Yoga Pro 9 16IMH9 RTX 4050
Intel Core Ultra 9 185H
1798 Points
Lenovo Legion Slim 5 16APH8
AMD Ryzen 7 7840HS
1793 Points 0%
Dell XPS 16 9640
Intel Core Ultra 7 155H
1791 Points 0%
Samsung Galaxy Book4 Ultra
Intel Core Ultra 7 155H
1789 Points -1%
Average Intel Core Ultra 9 185H
  (1166 - 1912, n=19)
1787 Points -1%
HP Envy x360 2-in-1 16-ad0097nr
AMD Ryzen 7 8840HS
1745 Points -3%
Asus VivoBook Pro 16 K6602VU
Intel Core i9-13900H
1740 Points -3%
Framework Laptop 16
AMD Ryzen 9 7940HS
1733 Points -4%
Lenovo Legion 9 16IRX9, RTX 4090
Intel Core i9-14900HX
1720 Points -4%
Asus ZenBook Pro 16X OLED UX7602ZM-ME115W
Intel Core i9-12900H
1718 Points -4%
HP Victus 16 (2024)
Intel Core i7-14700HX
1702 Points -5%
Lenovo Yoga 7 2-in-1 16IML9
Intel Core Ultra 5 125U
1548 Points -14%
Cinebench R20 / CPU (Multi Core)
Lenovo Legion 9 16IRX9, RTX 4090
Intel Core i9-14900HX
11960 Points +61%
Alienware m16 R1 AMD
AMD Ryzen 9 7845HX
10492 Points +41%
HP Victus 16 (2024)
Intel Core i7-14700HX
9244 Points +25%
Acer Predator Helios Neo 16 (2024)
Intel Core i7-14700HX
8361 Points +13%
Alienware m16 R1 Intel
Intel Core i7-13700HX
8062 Points +9%
Lenovo Yoga Pro 9 16IMH9
Intel Core Ultra 9 185H
7651 Points +3%
Lenovo Yoga Pro 9 16IMH9 RTX 4050
Intel Core Ultra 9 185H
7422 Points
Dell XPS 16 9640
Intel Core Ultra 7 155H
7146 Points -4%
Average Intel Core Ultra 9 185H
  (4843 - 7651, n=19)
6862 Points -8%
Lenovo Legion Slim 5 16APH8
AMD Ryzen 7 7840HS
6674 Points -10%
Framework Laptop 16
AMD Ryzen 9 7940HS
6402 Points -14%
Samsung Galaxy Book4 Ultra
Intel Core Ultra 7 155H
6085 Points -18%
Asus ZenBook Pro 16X OLED UX7602ZM-ME115W
Intel Core i9-12900H
6060 Points -18%
HP Pavilion Plus 16-ab0456tx
Intel Core i7-13700H
5873 Points -21%
Asus VivoBook Pro 16 K6602VU
Intel Core i9-13900H
5774 Points -22%
HP Envy x360 2-in-1 16-ad0097nr
AMD Ryzen 7 8840HS
4994 Points -33%
Lenovo Yoga 7 2-in-1 16IML9
Intel Core Ultra 5 125U
3720 Points -50%
Cinebench R20 / CPU (Single Core)
Acer Predator Helios Neo 16 (2024)
Intel Core i7-14700HX
803 Points +13%
HP Pavilion Plus 16-ab0456tx
Intel Core i7-13700H
741 Points +4%
Alienware m16 R1 Intel
Intel Core i7-13700HX
738 Points +4%
Lenovo Yoga Pro 9 16IMH9
Intel Core Ultra 9 185H
735 Points +4%
Alienware m16 R1 AMD
AMD Ryzen 9 7845HX
719 Points +1%
Lenovo Yoga Pro 9 16IMH9 RTX 4050
Intel Core Ultra 9 185H
710 Points
Lenovo Legion Slim 5 16APH8
AMD Ryzen 7 7840HS
698 Points -2%
Samsung Galaxy Book4 Ultra
Intel Core Ultra 7 155H
693 Points -2%
Average Intel Core Ultra 9 185H
  (442 - 735, n=19)
689 Points -3%
Asus ZenBook Pro 16X OLED UX7602ZM-ME115W
Intel Core i9-12900H
680 Points -4%
Framework Laptop 16
AMD Ryzen 9 7940HS
680 Points -4%
Asus VivoBook Pro 16 K6602VU
Intel Core i9-13900H
673 Points -5%
Dell XPS 16 9640
Intel Core Ultra 7 155H
672 Points -5%
Lenovo Legion 9 16IRX9, RTX 4090
Intel Core i9-14900HX
657 Points -7%
HP Victus 16 (2024)
Intel Core i7-14700HX
651 Points -8%
HP Envy x360 2-in-1 16-ad0097nr
AMD Ryzen 7 8840HS
649 Points -9%
Lenovo Yoga 7 2-in-1 16IML9
Intel Core Ultra 5 125U
605 Points -15%
Cinebench R15 / CPU Multi 64Bit
Lenovo Legion 9 16IRX9, RTX 4090
Intel Core i9-14900HX
4879 (4505.52min - 4878.64max) Points +63%
Alienware m16 R1 AMD
AMD Ryzen 9 7845HX
4320 (4198.59min - 4320.12max) Points +45%
HP Victus 16 (2024)
Intel Core i7-14700HX
3812 Points +28%
Acer Predator Helios Neo 16 (2024)
Intel Core i7-14700HX
3455 Points +16%
Alienware m16 R1 Intel
Intel Core i7-13700HX
3183 Points +7%
Lenovo Yoga Pro 9 16IMH9
Intel Core Ultra 9 185H
3005 (2869.44min - 3004.58max) Points +1%
Lenovo Yoga Pro 9 16IMH9 RTX 4050
Intel Core Ultra 9 185H
2986 (2750.84min - 2985.74max) Points
Dell XPS 16 9640
Intel Core Ultra 7 155H
2818 (2643.06min - 2817.5max) Points -6%
Average Intel Core Ultra 9 185H
  (1582 - 3165, n=21)
2729 Points -9%
Lenovo Legion Slim 5 16APH8
AMD Ryzen 7 7840HS
2706 (2627.26min - 2706.36max) Points -9%
Framework Laptop 16
AMD Ryzen 9 7940HS
2653 (2587.82min - 2652.52max) Points -11%
Asus ZenBook Pro 16X OLED UX7602ZM-ME115W
Intel Core i9-12900H
2627 (2458.81min - 2626.74max) Points -12%
Samsung Galaxy Book4 Ultra
Intel Core Ultra 7 155H
2576 (2134.59min - 2575.83max) Points -14%
Asus VivoBook Pro 16 K6602VU
Intel Core i9-13900H
2514 (2186.27min - 2513.98max) Points -16%
HP Pavilion Plus 16-ab0456tx
Intel Core i7-13700H
2224 (2140.07min - 2224.08max) Points -26%
HP Envy x360 2-in-1 16-ad0097nr
AMD Ryzen 7 8840HS
2045 (1885.73min - 2044.68max) Points -32%
Lenovo Yoga 7 2-in-1 16IML9
Intel Core Ultra 5 125U
1657 (1250.47min - 1657.34max) Points -45%
Cinebench R15 / CPU Single 64Bit
Alienware m16 R1 AMD
AMD Ryzen 9 7845HX
295 Points +10%
Acer Predator Helios Neo 16 (2024)
Intel Core i7-14700HX
294 Points +10%
Lenovo Legion Slim 5 16APH8
AMD Ryzen 7 7840HS
280 Points +4%
Lenovo Yoga Pro 9 16IMH9
Intel Core Ultra 9 185H
280 Points +4%
Alienware m16 R1 Intel
Intel Core i7-13700HX
277 Points +3%
Framework Laptop 16
AMD Ryzen 9 7940HS
277 Points +3%
HP Pavilion Plus 16-ab0456tx
Intel Core i7-13700H
273 Points +2%
Lenovo Yoga Pro 9 16IMH9 RTX 4050
Intel Core Ultra 9 185H
268 Points
Asus ZenBook Pro 16X OLED UX7602ZM-ME115W
Intel Core i9-12900H
264 Points -1%
Asus ZenBook Pro 16X OLED UX7602ZM-ME115W
Intel Core i9-12900H
245 Points -9%
Average Intel Core Ultra 9 185H
  (191.9 - 281, n=19)
264 Points -1%
HP Envy x360 2-in-1 16-ad0097nr
AMD Ryzen 7 8840HS
261 Points -3%
Dell XPS 16 9640
Intel Core Ultra 7 155H
260 Points -3%
Samsung Galaxy Book4 Ultra
Intel Core Ultra 7 155H
259 Points -3%
Asus VivoBook Pro 16 K6602VU
Intel Core i9-13900H
252 Points -6%
Lenovo Legion 9 16IRX9, RTX 4090
Intel Core i9-14900HX
247 Points -8%
HP Victus 16 (2024)
Intel Core i7-14700HX
238 Points -11%
Lenovo Yoga 7 2-in-1 16IML9
Intel Core Ultra 5 125U
226 Points -16%
Blender / v2.79 BMW27 CPU
Lenovo Yoga 7 2-in-1 16IML9
Intel Core Ultra 5 125U
358 Seconds * -113%
HP Envy x360 2-in-1 16-ad0097nr
AMD Ryzen 7 8840HS
246 Seconds * -46%
Samsung Galaxy Book4 Ultra
Intel Core Ultra 7 155H
220 Seconds * -31%
HP Pavilion Plus 16-ab0456tx
Intel Core i7-13700H
217 Seconds * -29%
Asus VivoBook Pro 16 K6602VU
Intel Core i9-13900H
213 Seconds * -27%
Framework Laptop 16
AMD Ryzen 9 7940HS
195 Seconds * -16%
Average Intel Core Ultra 9 185H
  (163 - 285, n=19)
191.1 Seconds * -14%
Asus ZenBook Pro 16X OLED UX7602ZM-ME115W
Intel Core i9-12900H
185 Seconds * -10%
Lenovo Legion Slim 5 16APH8
AMD Ryzen 7 7840HS
185 Seconds * -10%
Dell XPS 16 9640
Intel Core Ultra 7 155H
179 Seconds * -7%
HP Victus 16 (2024)
Intel Core i7-14700HX
173 Seconds * -3%
Lenovo Yoga Pro 9 16IMH9 RTX 4050
Intel Core Ultra 9 185H
168 Seconds *
Lenovo Yoga Pro 9 16IMH9
Intel Core Ultra 9 185H
163 Seconds * +3%
Alienware m16 R1 Intel
Intel Core i7-13700HX
159 Seconds * +5%
Acer Predator Helios Neo 16 (2024)
Intel Core i7-14700HX
140 Seconds * +17%
Alienware m16 R1 AMD
AMD Ryzen 9 7845HX
117 Seconds * +30%
Lenovo Legion 9 16IRX9, RTX 4090
Intel Core i9-14900HX
106 Seconds * +37%
7-Zip 18.03 / 7z b 4
Lenovo Legion 9 16IRX9, RTX 4090
Intel Core i9-14900HX
125676 MIPS +67%
Alienware m16 R1 AMD
AMD Ryzen 9 7845HX
106033 MIPS +41%
Acer Predator Helios Neo 16 (2024)
Intel Core i7-14700HX
93134 MIPS +24%
HP Victus 16 (2024)
Intel Core i7-14700HX
84799 MIPS +13%
Alienware m16 R1 Intel
Intel Core i7-13700HX
83449 MIPS +11%
Lenovo Yoga Pro 9 16IMH9
Intel Core Ultra 9 185H
76331 MIPS +1%
Lenovo Yoga Pro 9 16IMH9 RTX 4050
Intel Core Ultra 9 185H
75329 MIPS
Framework Laptop 16
AMD Ryzen 9 7940HS
71464 MIPS -5%
Dell XPS 16 9640
Intel Core Ultra 7 155H
70074 MIPS -7%
Asus ZenBook Pro 16X OLED UX7602ZM-ME115W
Intel Core i9-12900H
69637 MIPS -8%
Average Intel Core Ultra 9 185H
  (51738 - 76331, n=19)
69330 MIPS -8%
Lenovo Legion Slim 5 16APH8
AMD Ryzen 7 7840HS
68815 MIPS -9%
Asus VivoBook Pro 16 K6602VU
Intel Core i9-13900H
64431 MIPS -14%
Samsung Galaxy Book4 Ultra
Intel Core Ultra 7 155H
62513 MIPS -17%
HP Pavilion Plus 16-ab0456tx
Intel Core i7-13700H
62209 MIPS -17%
HP Envy x360 2-in-1 16-ad0097nr
AMD Ryzen 7 8840HS
54768 MIPS -27%
Lenovo Yoga 7 2-in-1 16IML9
Intel Core Ultra 5 125U
39065 MIPS -48%
7-Zip 18.03 / 7z b 4 -mmt1
Alienware m16 R1 AMD
AMD Ryzen 9 7845HX
7018 MIPS +28%
Acer Predator Helios Neo 16 (2024)
Intel Core i7-14700HX
6890 MIPS +26%
Framework Laptop 16
AMD Ryzen 9 7940HS
6599 MIPS +20%
Lenovo Legion Slim 5 16APH8
AMD Ryzen 7 7840HS
6516 MIPS +19%
Alienware m16 R1 Intel
Intel Core i7-13700HX
6409 MIPS +17%
HP Pavilion Plus 16-ab0456tx
Intel Core i7-13700H
6101 MIPS +11%
HP Envy x360 2-in-1 16-ad0097nr
AMD Ryzen 7 8840HS
5912 MIPS +8%
Asus ZenBook Pro 16X OLED UX7602ZM-ME115W
Intel Core i9-12900H
5842 MIPS +6%
Lenovo Yoga Pro 9 16IMH9
Intel Core Ultra 9 185H
5781 MIPS +5%
Asus VivoBook Pro 16 K6602VU
Intel Core i9-13900H
5721 MIPS +4%
HP Victus 16 (2024)
Intel Core i7-14700HX
5641 MIPS +3%
Samsung Galaxy Book4 Ultra
Intel Core Ultra 7 155H
5540 MIPS +1%
Lenovo Yoga Pro 9 16IMH9 RTX 4050
Intel Core Ultra 9 185H
5488 MIPS
Dell XPS 16 9640
Intel Core Ultra 7 155H
5474 MIPS 0%
Lenovo Legion 9 16IRX9, RTX 4090
Intel Core i9-14900HX
5452 MIPS -1%
Average Intel Core Ultra 9 185H
  (4199 - 5781, n=19)
5427 MIPS -1%
Lenovo Yoga 7 2-in-1 16IML9
Intel Core Ultra 5 125U
4492 MIPS -18%
Geekbench 6.3 / Multi-Core
Lenovo Legion 9 16IRX9, RTX 4090
Intel Core i9-14900HX
17499 Points +24%
Acer Predator Helios Neo 16 (2024)
Intel Core i7-14700HX
17292 Points +22%
HP Victus 16 (2024)
Intel Core i7-14700HX
14807 Points +5%
Alienware m16 R1 Intel
Intel Core i7-13700HX
14402 Points +2%
Lenovo Yoga Pro 9 16IMH9 RTX 4050
Intel Core Ultra 9 185H
14122 Points
Lenovo Yoga Pro 9 16IMH9
Intel Core Ultra 9 185H
14031 Points -1%
Dell XPS 16 9640
Intel Core Ultra 7 155H
13656 Points -3%
Average Intel Core Ultra 9 185H
  (9140 - 14540, n=19)
13602 Points -4%
Framework Laptop 16
AMD Ryzen 9 7940HS
13217 Points -6%
Alienware m16 R1 AMD
AMD Ryzen 9 7845HX
12585 Points -11%
Samsung Galaxy Book4 Ultra
Intel Core Ultra 7 155H
12517 Points -11%
HP Pavilion Plus 16-ab0456tx
Intel Core i7-13700H
11936 Points -15%
Asus VivoBook Pro 16 K6602VU
Intel Core i9-13900H
11118 Points -21%
HP Envy x360 2-in-1 16-ad0097nr
AMD Ryzen 7 8840HS
11081 Points -22%
Lenovo Yoga 7 2-in-1 16IML9
Intel Core Ultra 5 125U
9601 Points -32%
Geekbench 6.3 / Single-Core
Acer Predator Helios Neo 16 (2024)
Intel Core i7-14700HX
2975 Points +19%
Alienware m16 R1 AMD
AMD Ryzen 9 7845HX
2729 Points +9%
Alienware m16 R1 Intel
Intel Core i7-13700HX
2638 Points +5%
Framework Laptop 16
AMD Ryzen 9 7940HS
2630 Points +5%
HP Pavilion Plus 16-ab0456tx
Intel Core i7-13700H
2598 Points +4%
Lenovo Yoga Pro 9 16IMH9
Intel Core Ultra 9 185H
2570 Points +3%
HP Envy x360 2-in-1 16-ad0097nr
AMD Ryzen 7 8840HS
2525 Points +1%
Lenovo Yoga Pro 9 16IMH9 RTX 4050
Intel Core Ultra 9 185H
2506 Points
Asus VivoBook Pro 16 K6602VU
Intel Core i9-13900H
2437 Points -3%
Samsung Galaxy Book4 Ultra
Intel Core Ultra 7 155H
2436 Points -3%
Average Intel Core Ultra 9 185H
  (1490 - 2573, n=19)
2430 Points -3%
Lenovo Legion 9 16IRX9, RTX 4090
Intel Core i9-14900HX
2419 Points -3%
Dell XPS 16 9640
Intel Core Ultra 7 155H
2418 Points -4%
HP Victus 16 (2024)
Intel Core i7-14700HX
2378 Points -5%
Lenovo Yoga 7 2-in-1 16IML9
Intel Core Ultra 5 125U
2148 Points -14%
Geekbench 5.5 / Multi-Core
Lenovo Legion 9 16IRX9, RTX 4090
Intel Core i9-14900HX
21642 Points +57%
Acer Predator Helios Neo 16 (2024)
Intel Core i7-14700HX
18225 Points +33%
HP Victus 16 (2024)
Intel Core i7-14700HX
16732 Points +22%
Alienware m16 R1 AMD
AMD Ryzen 9 7845HX
15068 Points +10%
Alienware m16 R1 Intel
Intel Core i7-13700HX
14448 Points +5%
Lenovo Yoga Pro 9 16IMH9
Intel Core Ultra 9 185H
13936 Points +1%
Lenovo Yoga Pro 9 16IMH9 RTX 4050
Intel Core Ultra 9 185H
13749 Points
Dell XPS 16 9640
Intel Core Ultra 7 155H
13556 Points -1%
Asus ZenBook Pro 16X OLED UX7602ZM-ME115W
Intel Core i9-12900H
13547 Points -1%
Average Intel Core Ultra 9 185H
  (9330 - 14230, n=19)
13179 Points -4%
Samsung Galaxy Book4 Ultra
Intel Core Ultra 7 155H
12463 Points -9%
Framework Laptop 16
AMD Ryzen 9 7940HS
12379 Points -10%
Lenovo Legion Slim 5 16APH8
AMD Ryzen 7 7840HS
11651 Points -15%
HP Pavilion Plus 16-ab0456tx
Intel Core i7-13700H
11405 Points -17%
Asus VivoBook Pro 16 K6602VU
Intel Core i9-13900H
10214 Points -26%
HP Envy x360 2-in-1 16-ad0097nr
AMD Ryzen 7 8840HS
9949 Points -28%
Lenovo Yoga 7 2-in-1 16IML9
Intel Core Ultra 5 125U
8355 Points -39%
Geekbench 5.5 / Single-Core
Acer Predator Helios Neo 16 (2024)
Intel Core i7-14700HX
2131 Points +14%
Alienware m16 R1 AMD
AMD Ryzen 9 7845HX
2008 Points +8%
Lenovo Legion Slim 5 16APH8
AMD Ryzen 7 7840HS
1989 Points +7%
Framework Laptop 16
AMD Ryzen 9 7940HS
1963 Points +5%
Lenovo Yoga Pro 9 16IMH9
Intel Core Ultra 9 185H
1902 Points +2%
HP Envy x360 2-in-1 16-ad0097nr
AMD Ryzen 7 8840HS
1894 Points +1%
Lenovo Yoga Pro 9 16IMH9 RTX 4050
Intel Core Ultra 9 185H
1867 Points
Alienware m16 R1 Intel
Intel Core i7-13700HX
1845 Points -1%
Samsung Galaxy Book4 Ultra
Intel Core Ultra 7 155H
1824 Points -2%
HP Pavilion Plus 16-ab0456tx
Intel Core i7-13700H
1822 Points -2%
Asus ZenBook Pro 16X OLED UX7602ZM-ME115W
Intel Core i9-12900H
1820 Points -3%
Average Intel Core Ultra 9 185H
  (986 - 1902, n=19)
1779 Points -5%
Dell XPS 16 9640
Intel Core Ultra 7 155H
1775 Points -5%
Asus VivoBook Pro 16 K6602VU
Intel Core i9-13900H
1735 Points -7%
Lenovo Legion 9 16IRX9, RTX 4090
Intel Core i9-14900HX
1729 Points -7%
HP Victus 16 (2024)
Intel Core i7-14700HX
1700 Points -9%
Lenovo Yoga 7 2-in-1 16IML9
Intel Core Ultra 5 125U
1560 Points -16%
HWBOT x265 Benchmark v2.2 / 4k Preset
Lenovo Legion 9 16IRX9, RTX 4090
Intel Core i9-14900HX
30.7 fps +38%
Alienware m16 R1 AMD
AMD Ryzen 9 7845HX
29.7 fps +33%
Acer Predator Helios Neo 16 (2024)
Intel Core i7-14700HX
24.6 fps +10%
Lenovo Yoga Pro 9 16IMH9
Intel Core Ultra 9 185H
22.7 fps +2%
Alienware m16 R1 Intel
Intel Core i7-13700HX
22.4 fps 0%
Lenovo Yoga Pro 9 16IMH9 RTX 4050
Intel Core Ultra 9 185H
22.3 fps
HP Victus 16 (2024)
Intel Core i7-14700HX
22 fps -1%
Lenovo Legion Slim 5 16APH8
AMD Ryzen 7 7840HS
21.8 fps -2%
Framework Laptop 16
AMD Ryzen 9 7940HS
21 fps -6%
Dell XPS 16 9640
Intel Core Ultra 7 155H
20.8 fps -7%
Average Intel Core Ultra 9 185H
  (14.1 - 22.7, n=19)
19.9 fps -11%
Asus ZenBook Pro 16X OLED UX7602ZM-ME115W
Intel Core i9-12900H
19.2 fps -14%
Samsung Galaxy Book4 Ultra
Intel Core Ultra 7 155H
17.1 fps -23%
Asus VivoBook Pro 16 K6602VU
Intel Core i9-13900H
16.7 fps -25%
HP Pavilion Plus 16-ab0456tx
Intel Core i7-13700H
16.3 fps -27%
HP Envy x360 2-in-1 16-ad0097nr
AMD Ryzen 7 8840HS
15.7 fps -30%
Lenovo Yoga 7 2-in-1 16IML9
Intel Core Ultra 5 125U
11.1 fps -50%
LibreOffice / 20 Documents To PDF
HP Pavilion Plus 16-ab0456tx
Intel Core i7-13700H
62.4 s * -61%
Asus VivoBook Pro 16 K6602VU
Intel Core i9-13900H
56.3 s * -45%
HP Victus 16 (2024)
Intel Core i7-14700HX
55.3 s * -43%
Lenovo Legion 9 16IRX9, RTX 4090
Intel Core i9-14900HX
53.6 s * -38%
HP Envy x360 2-in-1 16-ad0097nr
AMD Ryzen 7 8840HS
51.7 s * -33%
Lenovo Yoga 7 2-in-1 16IML9
Intel Core Ultra 5 125U
47 s * -21%
Samsung Galaxy Book4 Ultra
Intel Core Ultra 7 155H
46.6 s * -20%
Average Intel Core Ultra 9 185H
  (34.5 - 73.5, n=19)
46.1 s * -19%
Alienware m16 R1 Intel
Intel Core i7-13700HX
45.4 s * -17%
Dell XPS 16 9640
Intel Core Ultra 7 155H
44.8 s * -15%
Framework Laptop 16
AMD Ryzen 9 7940HS
43.6 s * -12%
Acer Predator Helios Neo 16 (2024)
Intel Core i7-14700HX
42.5 s * -10%
Asus ZenBook Pro 16X OLED UX7602ZM-ME115W
Intel Core i9-12900H
39.8 s * -3%
Lenovo Yoga Pro 9 16IMH9
Intel Core Ultra 9 185H
39.7 s * -2%
Alienware m16 R1 AMD
AMD Ryzen 9 7845HX
39.4 s * -2%
Lenovo Yoga Pro 9 16IMH9 RTX 4050
Intel Core Ultra 9 185H
38.8 s *
Lenovo Legion Slim 5 16APH8
AMD Ryzen 7 7840HS
38.3 s * +1%
R Benchmark 2.5 / Overall mean
Lenovo Yoga 7 2-in-1 16IML9
Intel Core Ultra 5 125U
0.533 sec * -17%
HP Victus 16 (2024)
Intel Core i7-14700HX
0.4896 sec * -7%
Lenovo Legion 9 16IRX9, RTX 4090
Intel Core i9-14900HX
0.4859 sec * -7%
Asus VivoBook Pro 16 K6602VU
Intel Core i9-13900H
0.4834 sec * -6%
Dell XPS 16 9640
Intel Core Ultra 7 155H
0.4828 sec * -6%
Average Intel Core Ultra 9 185H
  (0.4313 - 0.759, n=20)
0.47 sec * -3%
Samsung Galaxy Book4 Ultra
Intel Core Ultra 7 155H
0.4682 sec * -3%
HP Envy x360 2-in-1 16-ad0097nr
AMD Ryzen 7 8840HS
0.4638 sec * -2%
Lenovo Yoga Pro 9 16IMH9 RTX 4050
Intel Core Ultra 9 185H
0.4555 sec *
Asus ZenBook Pro 16X OLED UX7602ZM-ME115W
Intel Core i9-12900H
0.4474 sec * +2%
Framework Laptop 16
AMD Ryzen 9 7940HS
0.4467 sec * +2%
Lenovo Yoga Pro 9 16IMH9
Intel Core Ultra 9 185H
0.4457 sec * +2%
Alienware m16 R1 Intel
Intel Core i7-13700HX
0.4422 sec * +3%
HP Pavilion Plus 16-ab0456tx
Intel Core i7-13700H
0.4386 sec * +4%
Lenovo Legion Slim 5 16APH8
AMD Ryzen 7 7840HS
0.4336 sec * +5%
Alienware m16 R1 AMD
AMD Ryzen 9 7845HX
0.4255 sec * +7%
Acer Predator Helios Neo 16 (2024)
Intel Core i7-14700HX
0.3821 sec * +16%
CPU Performance Rating: Percent
Cinebench R23: Multi Core | Single Core
Cinebench R20: CPU (Multi Core) | CPU (Single Core)
Cinebench R15: CPU Multi 64Bit | CPU Single 64Bit
Blender: v2.79 BMW27 CPU
7-Zip 18.03: 7z b 4 | 7z b 4 -mmt1
Geekbench 6.3: Multi-Core | Single-Core
Geekbench 5.5: Multi-Core | Single-Core
HWBOT x265 Benchmark v2.2: 4k Preset
LibreOffice : 20 Documents To PDF
R Benchmark 2.5: Overall mean

* ... im mniej tym lepiej

Cinebench R15 CPU Multi 64Bit
2986 Points
Cinebench R15 OpenGL 64Bit
189.2 fps
Cinebench R15 Ref. Match 64Bit
99.6 %
Cinebench R15 CPU Single 64Bit
268 Points
Cinebench R20 CPU (Multi Core)
7422 Points
Cinebench R20 CPU (Single Core)
710 Points
Cinebench R23 Multi Core
19236 Points
Cinebench R23 Single Core
1798 Points
Pomoc
Performance Rating
Lenovo Yoga Pro 9 16IMH9
Intel Core Ultra 9 185H, NVIDIA GeForce RTX 4070 Laptop GPU
93.7 pt
Lenovo Yoga Pro 9 16IMH9 RTX 4050
Intel Core Ultra 9 185H, NVIDIA GeForce RTX 4050 Laptop GPU
92.4 pt
Dell XPS 16 9640
Intel Core Ultra 7 155H, NVIDIA GeForce RTX 4070 Laptop GPU
87.4 pt
HP Envy x360 2-in-1 16-ad0097nr
AMD Ryzen 7 8840HS, Radeon 780M
85.6 pt
Average Intel Core Ultra 9 185H
 
85.4 pt
Asus VivoBook Pro 16 K6602VU
Intel Core i9-13900H, NVIDIA GeForce RTX 4050 Laptop GPU
76.4 pt
Samsung Galaxy Book4 Ultra
Intel Core Ultra 7 155H, NVIDIA GeForce RTX 4050 Laptop GPU
73.8 pt
AIDA64 / FP32 Ray-Trace
HP Envy x360 2-in-1 16-ad0097nr
AMD Ryzen 7 8840HS, Radeon 780M
20007 KRay/s +8%
Lenovo Yoga Pro 9 16IMH9 RTX 4050
Intel Core Ultra 9 185H, NVIDIA GeForce RTX 4050 Laptop GPU
18561 KRay/s
Lenovo Yoga Pro 9 16IMH9
Intel Core Ultra 9 185H, NVIDIA GeForce RTX 4070 Laptop GPU
18446 KRay/s -1%
Dell XPS 16 9640
Intel Core Ultra 7 155H, NVIDIA GeForce RTX 4070 Laptop GPU
17015 KRay/s -8%
Average Intel Core Ultra 9 185H
  (9220 - 18676, n=19)
16396 KRay/s -12%
Asus VivoBook Pro 16 K6602VU
Intel Core i9-13900H, NVIDIA GeForce RTX 4050 Laptop GPU
13642 KRay/s -27%
Samsung Galaxy Book4 Ultra
Intel Core Ultra 7 155H, NVIDIA GeForce RTX 4050 Laptop GPU
13541 KRay/s -27%
AIDA64 / FPU Julia
Lenovo Yoga Pro 9 16IMH9
Intel Core Ultra 9 185H, NVIDIA GeForce RTX 4070 Laptop GPU
95213 Points +2%
Lenovo Yoga Pro 9 16IMH9 RTX 4050
Intel Core Ultra 9 185H, NVIDIA GeForce RTX 4050 Laptop GPU
93381 Points
Dell XPS 16 9640
Intel Core Ultra 7 155H, NVIDIA GeForce RTX 4070 Laptop GPU
88083 Points -6%
Average Intel Core Ultra 9 185H
  (48865 - 96463, n=19)
85141 Points -9%
HP Envy x360 2-in-1 16-ad0097nr
AMD Ryzen 7 8840HS, Radeon 780M
84591 Points -9%
Asus VivoBook Pro 16 K6602VU
Intel Core i9-13900H, NVIDIA GeForce RTX 4050 Laptop GPU
71957 Points -23%
Samsung Galaxy Book4 Ultra
Intel Core Ultra 7 155H, NVIDIA GeForce RTX 4050 Laptop GPU
71791 Points -23%
AIDA64 / CPU SHA3
Lenovo Yoga Pro 9 16IMH9 RTX 4050
Intel Core Ultra 9 185H, NVIDIA GeForce RTX 4050 Laptop GPU
4304 MB/s
Lenovo Yoga Pro 9 16IMH9
Intel Core Ultra 9 185H, NVIDIA GeForce RTX 4070 Laptop GPU
4278 MB/s -1%
Dell XPS 16 9640
Intel Core Ultra 7 155H, NVIDIA GeForce RTX 4070 Laptop GPU
4134 MB/s -4%
Average Intel Core Ultra 9 185H
  (2394 - 4534, n=19)
3982 MB/s -7%
HP Envy x360 2-in-1 16-ad0097nr
AMD Ryzen 7 8840HS, Radeon 780M
3847 MB/s -11%
Asus VivoBook Pro 16 K6602VU
Intel Core i9-13900H, NVIDIA GeForce RTX 4050 Laptop GPU
3269 MB/s -24%
Samsung Galaxy Book4 Ultra
Intel Core Ultra 7 155H, NVIDIA GeForce RTX 4050 Laptop GPU
3251 MB/s -24%
AIDA64 / CPU Queen
HP Envy x360 2-in-1 16-ad0097nr
AMD Ryzen 7 8840HS, Radeon 780M
107640 Points +13%
Lenovo Yoga Pro 9 16IMH9 RTX 4050
Intel Core Ultra 9 185H, NVIDIA GeForce RTX 4050 Laptop GPU
95241 Points
Asus VivoBook Pro 16 K6602VU
Intel Core i9-13900H, NVIDIA GeForce RTX 4050 Laptop GPU
94687 Points -1%
Lenovo Yoga Pro 9 16IMH9
Intel Core Ultra 9 185H, NVIDIA GeForce RTX 4070 Laptop GPU
94395 Points -1%
Dell XPS 16 9640
Intel Core Ultra 7 155H, NVIDIA GeForce RTX 4070 Laptop GPU
89747 Points -6%
Average Intel Core Ultra 9 185H
  (66785 - 95241, n=19)
89708 Points -6%
Samsung Galaxy Book4 Ultra
Intel Core Ultra 7 155H, NVIDIA GeForce RTX 4050 Laptop GPU
84280 Points -12%
AIDA64 / FPU SinJulia
HP Envy x360 2-in-1 16-ad0097nr
AMD Ryzen 7 8840HS, Radeon 780M
12929 Points +14%
Lenovo Yoga Pro 9 16IMH9
Intel Core Ultra 9 185H, NVIDIA GeForce RTX 4070 Laptop GPU
11392 Points 0%
Lenovo Yoga Pro 9 16IMH9 RTX 4050
Intel Core Ultra 9 185H, NVIDIA GeForce RTX 4050 Laptop GPU
11354 Points
Dell XPS 16 9640
Intel Core Ultra 7 155H, NVIDIA GeForce RTX 4070 Laptop GPU
10607 Points -7%
Average Intel Core Ultra 9 185H
  (7255 - 11392, n=19)
10546 Points -7%
Samsung Galaxy Book4 Ultra
Intel Core Ultra 7 155H, NVIDIA GeForce RTX 4050 Laptop GPU
9696 Points -15%
Asus VivoBook Pro 16 K6602VU
Intel Core i9-13900H, NVIDIA GeForce RTX 4050 Laptop GPU
8842 Points -22%
AIDA64 / FPU Mandel
Lenovo Yoga Pro 9 16IMH9
Intel Core Ultra 9 185H, NVIDIA GeForce RTX 4070 Laptop GPU
47315 Points +5%
Lenovo Yoga Pro 9 16IMH9 RTX 4050
Intel Core Ultra 9 185H, NVIDIA GeForce RTX 4050 Laptop GPU
45134 Points
HP Envy x360 2-in-1 16-ad0097nr
AMD Ryzen 7 8840HS, Radeon 780M
44969 Points 0%
Dell XPS 16 9640
Intel Core Ultra 7 155H, NVIDIA GeForce RTX 4070 Laptop GPU
43496 Points -4%
Average Intel Core Ultra 9 185H
  (24004 - 48020, n=19)
41756 Points -7%
Samsung Galaxy Book4 Ultra
Intel Core Ultra 7 155H, NVIDIA GeForce RTX 4050 Laptop GPU
34862 Points -23%
Asus VivoBook Pro 16 K6602VU
Intel Core i9-13900H, NVIDIA GeForce RTX 4050 Laptop GPU
33882 Points -25%
AIDA64 / CPU AES
Asus VivoBook Pro 16 K6602VU
Intel Core i9-13900H, NVIDIA GeForce RTX 4050 Laptop GPU
121588 MB/s +31%
Lenovo Yoga Pro 9 16IMH9
Intel Core Ultra 9 185H, NVIDIA GeForce RTX 4070 Laptop GPU
94250 MB/s +1%
Lenovo Yoga Pro 9 16IMH9 RTX 4050
Intel Core Ultra 9 185H, NVIDIA GeForce RTX 4050 Laptop GPU
93045 MB/s
Average Intel Core Ultra 9 185H
  (53116 - 154066, n=19)
91381 MB/s -2%
Dell XPS 16 9640
Intel Core Ultra 7 155H, NVIDIA GeForce RTX 4070 Laptop GPU
84332 MB/s -9%
HP Envy x360 2-in-1 16-ad0097nr
AMD Ryzen 7 8840HS, Radeon 780M
70892 MB/s -24%
Samsung Galaxy Book4 Ultra
Intel Core Ultra 7 155H, NVIDIA GeForce RTX 4050 Laptop GPU
68288 MB/s -27%
AIDA64 / CPU ZLib
Lenovo Yoga Pro 9 16IMH9
Intel Core Ultra 9 185H, NVIDIA GeForce RTX 4070 Laptop GPU
1297 MB/s +1%
Lenovo Yoga Pro 9 16IMH9 RTX 4050
Intel Core Ultra 9 185H, NVIDIA GeForce RTX 4050 Laptop GPU
1285 MB/s
Dell XPS 16 9640
Intel Core Ultra 7 155H, NVIDIA GeForce RTX 4070 Laptop GPU
1208 MB/s -6%
Average Intel Core Ultra 9 185H
  (678 - 1341, n=19)
1163 MB/s -9%
Samsung Galaxy Book4 Ultra
Intel Core Ultra 7 155H, NVIDIA GeForce RTX 4050 Laptop GPU
968 MB/s -25%
Asus VivoBook Pro 16 K6602VU
Intel Core i9-13900H, NVIDIA GeForce RTX 4050 Laptop GPU
966 MB/s -25%
HP Envy x360 2-in-1 16-ad0097nr
AMD Ryzen 7 8840HS, Radeon 780M
857 MB/s -33%
AIDA64 / FP64 Ray-Trace
HP Envy x360 2-in-1 16-ad0097nr
AMD Ryzen 7 8840HS, Radeon 780M
10571 KRay/s +15%
Lenovo Yoga Pro 9 16IMH9
Intel Core Ultra 9 185H, NVIDIA GeForce RTX 4070 Laptop GPU
9768 KRay/s +6%
Lenovo Yoga Pro 9 16IMH9 RTX 4050
Intel Core Ultra 9 185H, NVIDIA GeForce RTX 4050 Laptop GPU
9210 KRay/s
Dell XPS 16 9640
Intel Core Ultra 7 155H, NVIDIA GeForce RTX 4070 Laptop GPU
8899 KRay/s -3%
Average Intel Core Ultra 9 185H
  (4428 - 10078, n=19)
8582 KRay/s -7%
Asus VivoBook Pro 16 K6602VU
Intel Core i9-13900H, NVIDIA GeForce RTX 4050 Laptop GPU
7420 KRay/s -19%
Samsung Galaxy Book4 Ultra
Intel Core Ultra 7 155H, NVIDIA GeForce RTX 4050 Laptop GPU
7087 KRay/s -23%
AIDA64 / CPU PhotoWorxx
Lenovo Yoga Pro 9 16IMH9
Intel Core Ultra 9 185H, NVIDIA GeForce RTX 4070 Laptop GPU
53918 MPixel/s +1%
Lenovo Yoga Pro 9 16IMH9 RTX 4050
Intel Core Ultra 9 185H, NVIDIA GeForce RTX 4050 Laptop GPU
53337 MPixel/s
Dell XPS 16 9640
Intel Core Ultra 7 155H, NVIDIA GeForce RTX 4070 Laptop GPU
52123 MPixel/s -2%
Samsung Galaxy Book4 Ultra
Intel Core Ultra 7 155H, NVIDIA GeForce RTX 4050 Laptop GPU
50926 MPixel/s -5%
Average Intel Core Ultra 9 185H
  (44547 - 53918, n=19)
48798 MPixel/s -9%
Asus VivoBook Pro 16 K6602VU
Intel Core i9-13900H, NVIDIA GeForce RTX 4050 Laptop GPU
38636 MPixel/s -28%
HP Envy x360 2-in-1 16-ad0097nr
AMD Ryzen 7 8840HS, Radeon 780M
31491 MPixel/s -41%

Test warunków skrajnych

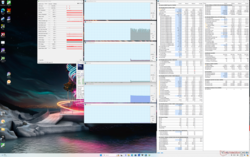
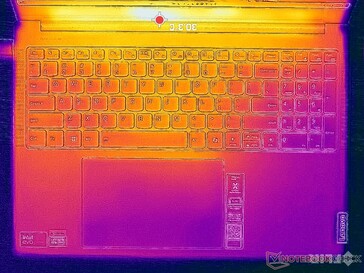
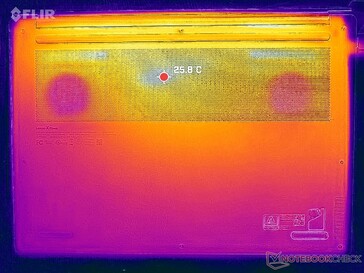
System bezczynny
System bezczynny

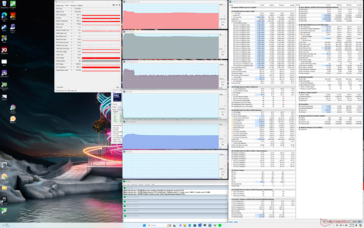
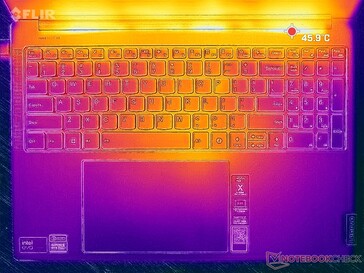
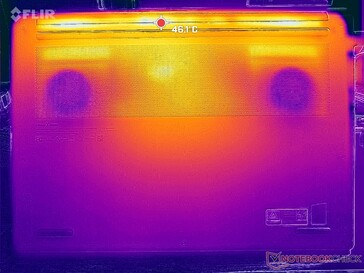
Po zainicjowaniu stresu Prime95, taktowanie procesora wzrosło do 3,6 GHz, 100 C i 120 W, po czym spadło i ustabilizowało się na poziomie 3,1 GHz, 90 C i 83 W około 70 sekund później.

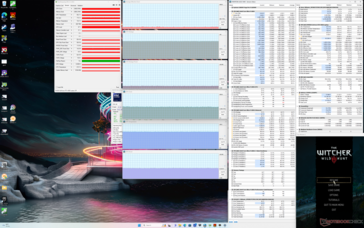
Wydajność graficzna uległa pogorszeniu w przypadku pracy w trybie zrównoważonym zamiast w trybie wydajności, co uzupełnia poniższe wyniki wydajności GPU. Procesor graficzny Nvidii utrzymywałby 2855 MHz i 78 W podczas pracy w trybie Witcher 3 w trybie wydajności w porównaniu do 2385 MHz i 63 W w trybie zrównoważonym. Temperatura GPU byłaby również wyższa w trybie wydajności.
Stres Prime95
Stres Prime95
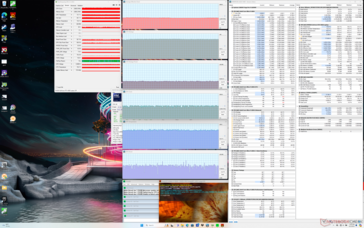
Prime95+FurMark stres
Witcher 3 naprężenie (tryb zrównoważony)
Witcher 3 stres (tryb wydajności)
Średnietaktowanie CPU (GHz) Taktowanie GPU (MHz) Średnia temperatura CPU (°C) Średnia temperatura GPU (°C)
System w stanie spoczynku -- -- 61 39
Prime95Stress 3.1 -- 87 53
Prime95+ FurMark Stress 2.2 2550 78 76
Witcher 3 Obciążenie (trybzrównoważony) 0.4 2385 70 68
Witcher 3 Obciążenie (trybwydajności) 0.7 2655 99 76

Wydajność systemu

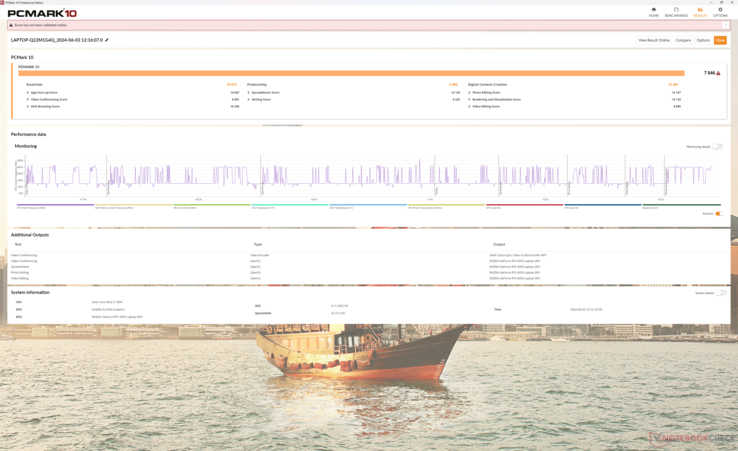
Wyniki PCMark są porównywalne z większością innych laptopów multimedialnych, co sugeruje, że Lenovo nie jest znacząco wolniejszy w większości codziennych obciążeń lub zadań edycyjnych, pomimo naszej niższej konfiguracji RTX 4050.

PCMark 10 Standard
PCMark 10 Standard
PCMark 10 / Score
Lenovo Yoga Pro 9 16IMH9 RTX 4050
NVIDIA GeForce RTX 4050 Laptop GPU, Ultra 9 185H, SK Hynix HFS001TEJ9X115N
7846 Points
Average Intel Core Ultra 9 185H, NVIDIA GeForce RTX 4050 Laptop GPU
  (7431 - 7846, n=2)
7639 Points -3%
Lenovo Yoga Pro 9 16IMH9
NVIDIA GeForce RTX 4070 Laptop GPU, Ultra 9 185H, SK Hynix HFS001TEJ9X115N
7547 Points -4%
Dell XPS 16 9640
NVIDIA GeForce RTX 4070 Laptop GPU, Ultra 7 155H, Kioxia XG8 KXG80ZNV1T02
7084 Points -10%
Asus VivoBook Pro 16 K6602VU
NVIDIA GeForce RTX 4050 Laptop GPU, i9-13900H, Micron 2400 MTFDKBA1T0QFM
7054 Points -10%
Samsung Galaxy Book4 Ultra
NVIDIA GeForce RTX 4050 Laptop GPU, Ultra 7 155H, Samsung PM9A1 MZVL2512HCJQ
6973 Points -11%
HP Envy x360 2-in-1 16-ad0097nr
Radeon 780M, R7 8840HS, KIOXIA BG5 KBG50ZNV1T02
6958 Points -11%
PCMark 10 / Essentials
Lenovo Yoga Pro 9 16IMH9
NVIDIA GeForce RTX 4070 Laptop GPU, Ultra 9 185H, SK Hynix HFS001TEJ9X115N
11133 Points +4%
Average Intel Core Ultra 9 185H, NVIDIA GeForce RTX 4050 Laptop GPU
  (10672 - 10807, n=2)
10740 Points +1%
Lenovo Yoga Pro 9 16IMH9 RTX 4050
NVIDIA GeForce RTX 4050 Laptop GPU, Ultra 9 185H, SK Hynix HFS001TEJ9X115N
10672 Points
HP Envy x360 2-in-1 16-ad0097nr
Radeon 780M, R7 8840HS, KIOXIA BG5 KBG50ZNV1T02
10503 Points -2%
Samsung Galaxy Book4 Ultra
NVIDIA GeForce RTX 4050 Laptop GPU, Ultra 7 155H, Samsung PM9A1 MZVL2512HCJQ
10446 Points -2%
Dell XPS 16 9640
NVIDIA GeForce RTX 4070 Laptop GPU, Ultra 7 155H, Kioxia XG8 KXG80ZNV1T02
10393 Points -3%
Asus VivoBook Pro 16 K6602VU
NVIDIA GeForce RTX 4050 Laptop GPU, i9-13900H, Micron 2400 MTFDKBA1T0QFM
10237 Points -4%
PCMark 10 / Productivity
Lenovo Yoga Pro 9 16IMH9 RTX 4050
NVIDIA GeForce RTX 4050 Laptop GPU, Ultra 9 185H, SK Hynix HFS001TEJ9X115N
9986 Points
HP Envy x360 2-in-1 16-ad0097nr
Radeon 780M, R7 8840HS, KIOXIA BG5 KBG50ZNV1T02
9933 Points -1%
Average Intel Core Ultra 9 185H, NVIDIA GeForce RTX 4050 Laptop GPU
  (9717 - 9986, n=2)
9852 Points -1%
Dell XPS 16 9640
NVIDIA GeForce RTX 4070 Laptop GPU, Ultra 7 155H, Kioxia XG8 KXG80ZNV1T02
9192 Points -8%
Samsung Galaxy Book4 Ultra
NVIDIA GeForce RTX 4050 Laptop GPU, Ultra 7 155H, Samsung PM9A1 MZVL2512HCJQ
9152 Points -8%
Lenovo Yoga Pro 9 16IMH9
NVIDIA GeForce RTX 4070 Laptop GPU, Ultra 9 185H, SK Hynix HFS001TEJ9X115N
9067 Points -9%
Asus VivoBook Pro 16 K6602VU
NVIDIA GeForce RTX 4050 Laptop GPU, i9-13900H, Micron 2400 MTFDKBA1T0QFM
8667 Points -13%
PCMark 10 / Digital Content Creation
Lenovo Yoga Pro 9 16IMH9 RTX 4050
NVIDIA GeForce RTX 4050 Laptop GPU, Ultra 9 185H, SK Hynix HFS001TEJ9X115N
12301 Points
Lenovo Yoga Pro 9 16IMH9
NVIDIA GeForce RTX 4070 Laptop GPU, Ultra 9 185H, SK Hynix HFS001TEJ9X115N
11554 Points -6%
Average Intel Core Ultra 9 185H, NVIDIA GeForce RTX 4050 Laptop GPU
  (10607 - 12301, n=2)
11454 Points -7%
Asus VivoBook Pro 16 K6602VU
NVIDIA GeForce RTX 4050 Laptop GPU, i9-13900H, Micron 2400 MTFDKBA1T0QFM
10737 Points -13%
Dell XPS 16 9640
NVIDIA GeForce RTX 4070 Laptop GPU, Ultra 7 155H, Kioxia XG8 KXG80ZNV1T02
10100 Points -18%
Samsung Galaxy Book4 Ultra
NVIDIA GeForce RTX 4050 Laptop GPU, Ultra 7 155H, Samsung PM9A1 MZVL2512HCJQ
9624 Points -22%
HP Envy x360 2-in-1 16-ad0097nr
Radeon 780M, R7 8840HS, KIOXIA BG5 KBG50ZNV1T02
8763 Points -29%
CrossMark / Overall
Dell XPS 16 9640
NVIDIA GeForce RTX 4070 Laptop GPU, Ultra 7 155H, Kioxia XG8 KXG80ZNV1T02
1848 Points +2%
Lenovo Yoga Pro 9 16IMH9 RTX 4050
NVIDIA GeForce RTX 4050 Laptop GPU, Ultra 9 185H, SK Hynix HFS001TEJ9X115N
1811 Points
Average Intel Core Ultra 9 185H, NVIDIA GeForce RTX 4050 Laptop GPU
  (1790 - 1811, n=2)
1801 Points -1%
Samsung Galaxy Book4 Ultra
NVIDIA GeForce RTX 4050 Laptop GPU, Ultra 7 155H, Samsung PM9A1 MZVL2512HCJQ
1740 Points -4%
Asus VivoBook Pro 16 K6602VU
NVIDIA GeForce RTX 4050 Laptop GPU, i9-13900H, Micron 2400 MTFDKBA1T0QFM
1724 Points -5%
Lenovo Yoga Pro 9 16IMH9
NVIDIA GeForce RTX 4070 Laptop GPU, Ultra 9 185H, SK Hynix HFS001TEJ9X115N
1719 Points -5%
HP Envy x360 2-in-1 16-ad0097nr
Radeon 780M, R7 8840HS, KIOXIA BG5 KBG50ZNV1T02
1643 Points -9%
CrossMark / Productivity
Dell XPS 16 9640
NVIDIA GeForce RTX 4070 Laptop GPU, Ultra 7 155H, Kioxia XG8 KXG80ZNV1T02
1750 Points +2%
Lenovo Yoga Pro 9 16IMH9 RTX 4050
NVIDIA GeForce RTX 4050 Laptop GPU, Ultra 9 185H, SK Hynix HFS001TEJ9X115N
1717 Points
Average Intel Core Ultra 9 185H, NVIDIA GeForce RTX 4050 Laptop GPU
  (1700 - 1717, n=2)
1709 Points 0%
Asus VivoBook Pro 16 K6602VU
NVIDIA GeForce RTX 4050 Laptop GPU, i9-13900H, Micron 2400 MTFDKBA1T0QFM
1666 Points -3%
Samsung Galaxy Book4 Ultra
NVIDIA GeForce RTX 4050 Laptop GPU, Ultra 7 155H, Samsung PM9A1 MZVL2512HCJQ
1659 Points -3%
Lenovo Yoga Pro 9 16IMH9
NVIDIA GeForce RTX 4070 Laptop GPU, Ultra 9 185H, SK Hynix HFS001TEJ9X115N
1611 Points -6%
HP Envy x360 2-in-1 16-ad0097nr
Radeon 780M, R7 8840HS, KIOXIA BG5 KBG50ZNV1T02
1611 Points -6%
CrossMark / Creativity
Average Intel Core Ultra 9 185H, NVIDIA GeForce RTX 4050 Laptop GPU
  (2037 - 2038, n=2)
2038 Points 0%
Lenovo Yoga Pro 9 16IMH9 RTX 4050
NVIDIA GeForce RTX 4050 Laptop GPU, Ultra 9 185H, SK Hynix HFS001TEJ9X115N
2037 Points
Dell XPS 16 9640
NVIDIA GeForce RTX 4070 Laptop GPU, Ultra 7 155H, Kioxia XG8 KXG80ZNV1T02
2014 Points -1%
Lenovo Yoga Pro 9 16IMH9
NVIDIA GeForce RTX 4070 Laptop GPU, Ultra 9 185H, SK Hynix HFS001TEJ9X115N
1993 Points -2%
Samsung Galaxy Book4 Ultra
NVIDIA GeForce RTX 4050 Laptop GPU, Ultra 7 155H, Samsung PM9A1 MZVL2512HCJQ
1930 Points -5%
Asus VivoBook Pro 16 K6602VU
NVIDIA GeForce RTX 4050 Laptop GPU, i9-13900H, Micron 2400 MTFDKBA1T0QFM
1860 Points -9%
HP Envy x360 2-in-1 16-ad0097nr
Radeon 780M, R7 8840HS, KIOXIA BG5 KBG50ZNV1T02
1790 Points -12%
CrossMark / Responsiveness
Dell XPS 16 9640
NVIDIA GeForce RTX 4070 Laptop GPU, Ultra 7 155H, Kioxia XG8 KXG80ZNV1T02
1683 Points +13%
Asus VivoBook Pro 16 K6602VU
NVIDIA GeForce RTX 4050 Laptop GPU, i9-13900H, Micron 2400 MTFDKBA1T0QFM
1524 Points +2%
Lenovo Yoga Pro 9 16IMH9 RTX 4050
NVIDIA GeForce RTX 4050 Laptop GPU, Ultra 9 185H, SK Hynix HFS001TEJ9X115N
1493 Points
Samsung Galaxy Book4 Ultra
NVIDIA GeForce RTX 4050 Laptop GPU, Ultra 7 155H, Samsung PM9A1 MZVL2512HCJQ
1467 Points -2%
Average Intel Core Ultra 9 185H, NVIDIA GeForce RTX 4050 Laptop GPU
  (1419 - 1493, n=2)
1456 Points -2%
HP Envy x360 2-in-1 16-ad0097nr
Radeon 780M, R7 8840HS, KIOXIA BG5 KBG50ZNV1T02
1347 Points -10%
Lenovo Yoga Pro 9 16IMH9
NVIDIA GeForce RTX 4070 Laptop GPU, Ultra 9 185H, SK Hynix HFS001TEJ9X115N
1338 Points -10%
WebXPRT 3 / Overall
HP Envy x360 2-in-1 16-ad0097nr
Radeon 780M, R7 8840HS, KIOXIA BG5 KBG50ZNV1T02
297 Points +1%
Average Intel Core Ultra 9 185H, NVIDIA GeForce RTX 4050 Laptop GPU
  (293 - 301, n=2)
297 Points +1%
Lenovo Yoga Pro 9 16IMH9
NVIDIA GeForce RTX 4070 Laptop GPU, Ultra 9 185H, SK Hynix HFS001TEJ9X115N
295 Points +1%
Lenovo Yoga Pro 9 16IMH9 RTX 4050
NVIDIA GeForce RTX 4050 Laptop GPU, Ultra 9 185H, SK Hynix HFS001TEJ9X115N
293 Points
Dell XPS 16 9640
NVIDIA GeForce RTX 4070 Laptop GPU, Ultra 7 155H, Kioxia XG8 KXG80ZNV1T02
283 Points -3%
Samsung Galaxy Book4 Ultra
NVIDIA GeForce RTX 4050 Laptop GPU, Ultra 7 155H, Samsung PM9A1 MZVL2512HCJQ
281 Points -4%
WebXPRT 4 / Overall
Average Intel Core Ultra 9 185H, NVIDIA GeForce RTX 4050 Laptop GPU
  (268 - 271, n=2)
270 Points +1%
Lenovo Yoga Pro 9 16IMH9
NVIDIA GeForce RTX 4070 Laptop GPU, Ultra 9 185H, SK Hynix HFS001TEJ9X115N
268 Points 0%
Lenovo Yoga Pro 9 16IMH9 RTX 4050
NVIDIA GeForce RTX 4050 Laptop GPU, Ultra 9 185H, SK Hynix HFS001TEJ9X115N
268 Points
Samsung Galaxy Book4 Ultra
NVIDIA GeForce RTX 4050 Laptop GPU, Ultra 7 155H, Samsung PM9A1 MZVL2512HCJQ
258 Points -4%
Dell XPS 16 9640
NVIDIA GeForce RTX 4070 Laptop GPU, Ultra 7 155H, Kioxia XG8 KXG80ZNV1T02
254 Points -5%
HP Envy x360 2-in-1 16-ad0097nr
Radeon 780M, R7 8840HS, KIOXIA BG5 KBG50ZNV1T02
246 Points -8%
Asus VivoBook Pro 16 K6602VU
NVIDIA GeForce RTX 4050 Laptop GPU, i9-13900H, Micron 2400 MTFDKBA1T0QFM
233 Points -13%
Mozilla Kraken 1.1 / Total
Asus VivoBook Pro 16 K6602VU
NVIDIA GeForce RTX 4050 Laptop GPU, i9-13900H, Micron 2400 MTFDKBA1T0QFM
545 ms * -6%
HP Envy x360 2-in-1 16-ad0097nr
Radeon 780M, R7 8840HS, KIOXIA BG5 KBG50ZNV1T02
538 ms * -5%
Lenovo Yoga Pro 9 16IMH9 RTX 4050
NVIDIA GeForce RTX 4050 Laptop GPU, Ultra 9 185H, SK Hynix HFS001TEJ9X115N
512 ms *
Average Intel Core Ultra 9 185H, NVIDIA GeForce RTX 4050 Laptop GPU
  (498 - 512, n=2)
505 ms * +1%
Lenovo Yoga Pro 9 16IMH9
NVIDIA GeForce RTX 4070 Laptop GPU, Ultra 9 185H, SK Hynix HFS001TEJ9X115N
494 ms * +4%
Samsung Galaxy Book4 Ultra
NVIDIA GeForce RTX 4050 Laptop GPU, Ultra 7 155H, Samsung PM9A1 MZVL2512HCJQ
416.4 ms * +19%

* ... im mniej tym lepiej

PCMark 10 Score
7846 pkt.
Pomoc
AIDA64 / Memory Copy
Lenovo Yoga Pro 9 16IMH9
Intel Core Ultra 9 185H, NVIDIA GeForce RTX 4070 Laptop GPU
94254 MB/s 0%
Lenovo Yoga Pro 9 16IMH9 RTX 4050
Intel Core Ultra 9 185H, NVIDIA GeForce RTX 4050 Laptop GPU
94222 MB/s
Dell XPS 16 9640
Intel Core Ultra 7 155H, NVIDIA GeForce RTX 4070 Laptop GPU
92745 MB/s -2%
Samsung Galaxy Book4 Ultra
Intel Core Ultra 7 155H, NVIDIA GeForce RTX 4050 Laptop GPU
90918 MB/s -4%
Average Intel Core Ultra 9 185H
  (69929 - 95718, n=19)
84413 MB/s -10%
HP Envy x360 2-in-1 16-ad0097nr
AMD Ryzen 7 8840HS, Radeon 780M
68720 MB/s -27%
Asus VivoBook Pro 16 K6602VU
Intel Core i9-13900H, NVIDIA GeForce RTX 4050 Laptop GPU
59266 MB/s -37%
AIDA64 / Memory Read
Samsung Galaxy Book4 Ultra
Intel Core Ultra 7 155H, NVIDIA GeForce RTX 4050 Laptop GPU
89474 MB/s +3%
Lenovo Yoga Pro 9 16IMH9
Intel Core Ultra 9 185H, NVIDIA GeForce RTX 4070 Laptop GPU
87768 MB/s +1%
Lenovo Yoga Pro 9 16IMH9 RTX 4050
Intel Core Ultra 9 185H, NVIDIA GeForce RTX 4050 Laptop GPU
87068 MB/s
Dell XPS 16 9640
Intel Core Ultra 7 155H, NVIDIA GeForce RTX 4070 Laptop GPU
83887 MB/s -4%
Average Intel Core Ultra 9 185H
  (64619 - 87768, n=19)
79657 MB/s -9%
Asus VivoBook Pro 16 K6602VU
Intel Core i9-13900H, NVIDIA GeForce RTX 4050 Laptop GPU
67398 MB/s -23%
HP Envy x360 2-in-1 16-ad0097nr
AMD Ryzen 7 8840HS, Radeon 780M
50273 MB/s -42%
AIDA64 / Memory Write
HP Envy x360 2-in-1 16-ad0097nr
AMD Ryzen 7 8840HS, Radeon 780M
91050 MB/s +23%
Samsung Galaxy Book4 Ultra
Intel Core Ultra 7 155H, NVIDIA GeForce RTX 4050 Laptop GPU
75813 MB/s +3%
Lenovo Yoga Pro 9 16IMH9
Intel Core Ultra 9 185H, NVIDIA GeForce RTX 4070 Laptop GPU
75773 MB/s +3%
Lenovo Yoga Pro 9 16IMH9 RTX 4050
Intel Core Ultra 9 185H, NVIDIA GeForce RTX 4050 Laptop GPU
73825 MB/s
Dell XPS 16 9640
Intel Core Ultra 7 155H, NVIDIA GeForce RTX 4070 Laptop GPU
73377 MB/s -1%
Average Intel Core Ultra 9 185H
  (51114 - 93871, n=19)
72498 MB/s -2%
Asus VivoBook Pro 16 K6602VU
Intel Core i9-13900H, NVIDIA GeForce RTX 4050 Laptop GPU
60548 MB/s -18%
AIDA64 / Memory Latency
Average Intel Core Ultra 9 185H
  (121.4 - 259, n=19)
145.5 ns * -10%
Samsung Galaxy Book4 Ultra
Intel Core Ultra 7 155H, NVIDIA GeForce RTX 4050 Laptop GPU
141.4 ns * -7%
Dell XPS 16 9640
Intel Core Ultra 7 155H, NVIDIA GeForce RTX 4070 Laptop GPU
136.6 ns * -4%
Lenovo Yoga Pro 9 16IMH9 RTX 4050
Intel Core Ultra 9 185H, NVIDIA GeForce RTX 4050 Laptop GPU
131.7 ns *
Lenovo Yoga Pro 9 16IMH9
Intel Core Ultra 9 185H, NVIDIA GeForce RTX 4070 Laptop GPU
129.6 ns * +2%
HP Envy x360 2-in-1 16-ad0097nr
AMD Ryzen 7 8840HS, Radeon 780M
121.8 ns * +8%
Asus VivoBook Pro 16 K6602VU
Intel Core i9-13900H, NVIDIA GeForce RTX 4050 Laptop GPU
93.7 ns * +29%

* ... im mniej tym lepiej

Opóźnienie DPC

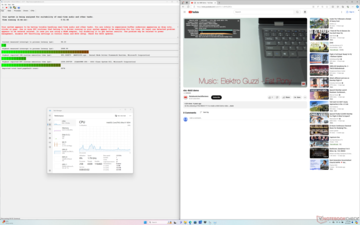
LatencyMon ujawnia więcej problemów z DPC niż konfiguracja RTX 4070 podczas otwierania wielu kart przeglądarki na naszej stronie głównej. odtwarzanie wideo 4K przy 60 FPS jest poza tym idealne i nie odnotowano żadnych spadków klatek.

LatencyMon
LatencyMon
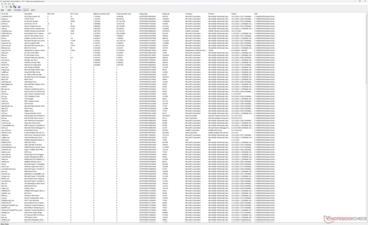
Lista kierowców
Lista kierowców
DPC Latencies / LatencyMon - interrupt to process latency (max), Web, Youtube, Prime95
Lenovo Yoga Pro 9 16IMH9 RTX 4050
NVIDIA GeForce RTX 4050 Laptop GPU, Ultra 9 185H, SK Hynix HFS001TEJ9X115N
2668.9 μs *
Asus VivoBook Pro 16 K6602VU
NVIDIA GeForce RTX 4050 Laptop GPU, i9-13900H, Micron 2400 MTFDKBA1T0QFM
1753.6 μs * +34%
HP Envy x360 2-in-1 16-ad0097nr
Radeon 780M, R7 8840HS, KIOXIA BG5 KBG50ZNV1T02
1639.8 μs * +39%
Dell XPS 16 9640
NVIDIA GeForce RTX 4070 Laptop GPU, Ultra 7 155H, Kioxia XG8 KXG80ZNV1T02
903.7 μs * +66%
Samsung Galaxy Book4 Ultra
NVIDIA GeForce RTX 4050 Laptop GPU, Ultra 7 155H, Samsung PM9A1 MZVL2512HCJQ
596.3 μs * +78%
Lenovo Yoga Pro 9 16IMH9
NVIDIA GeForce RTX 4070 Laptop GPU, Ultra 9 185H, SK Hynix HFS001TEJ9X115N
464.1 μs * +83%

* ... im mniej tym lepiej

Urządzenia pamięci masowej

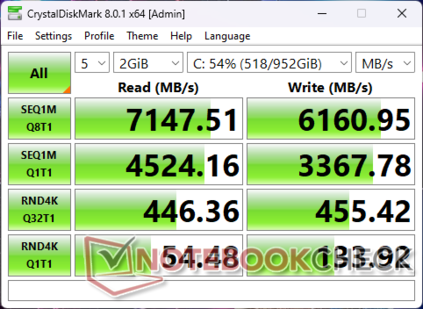
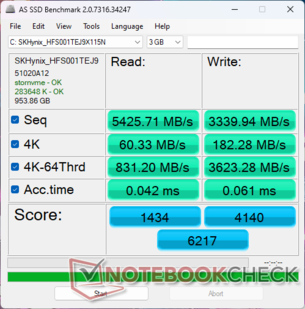
Lenovo dostarcza ten sam SK Hynix HFS001TEJ9X115N PCIe4 NVMe SSD w najniższych i najwyższych konfiguracjach RTX 4050 i RTX 4070.

CDM 8
CDM 8
AS SSD
AS SSD
SK Hynix HFS001TEJ9X115N
CDM 5/6 Read Seq Q32T1: 7061 MB/s
CDM 5/6 Write Seq Q32T1: 4774 MB/s
CDM 5/6 Read 4K Q32T1: 439.4 MB/s
CDM 5/6 Write 4K Q32T1: 470.6 MB/s
CDM 5 Read Seq: 4549 MB/s
CDM 5 Write Seq: 3077 MB/s
CDM 5/6 Read 4K: 52.38 MB/s
CDM 5/6 Write 4K: 131.3 MB/s
Drive Performance Rating - Percent
Dell XPS 16 9640
Kioxia XG8 KXG80ZNV1T02
90.3 pt
Samsung Galaxy Book4 Ultra
Samsung PM9A1 MZVL2512HCJQ
80.7 pt
Lenovo Yoga Pro 9 16IMH9 RTX 4050
SK Hynix HFS001TEJ9X115N
67.7 pt
Lenovo Yoga Pro 9 16IMH9
SK Hynix HFS001TEJ9X115N
67.3 pt
Asus VivoBook Pro 16 K6602VU
Micron 2400 MTFDKBA1T0QFM
46.4 pt
HP Envy x360 2-in-1 16-ad0097nr
KIOXIA BG5 KBG50ZNV1T02
38.3 pt
DiskSpd
seq read
Dell XPS 16 9640
Kioxia XG8 KXG80ZNV1T02
4156 (4146.28min - 4156.42max) MB/s +37%
Samsung Galaxy Book4 Ultra
Samsung PM9A1 MZVL2512HCJQ
3712 (3688.85min - 3711.75max) MB/s +23%
Lenovo Yoga Pro 9 16IMH9 RTX 4050
SK Hynix HFS001TEJ9X115N
3027 (3017.38min - 3027.45max) MB/s
Lenovo Yoga Pro 9 16IMH9
SK Hynix HFS001TEJ9X115N
2757 (2720.02min - 2757.13max) MB/s -9%
HP Envy x360 2-in-1 16-ad0097nr
KIOXIA BG5 KBG50ZNV1T02
2381 (2369.66min - 2380.54max) MB/s -21%
Asus VivoBook Pro 16 K6602VU
Micron 2400 MTFDKBA1T0QFM
1939 (1922.39min - 1939.24max) MB/s -36%
seq write
Dell XPS 16 9640
Kioxia XG8 KXG80ZNV1T02
4833 (4624.01min - 4832.66max) MB/s +49%
Samsung Galaxy Book4 Ultra
Samsung PM9A1 MZVL2512HCJQ
4152 (3343.49min - 4151.61max) MB/s +28%
Lenovo Yoga Pro 9 16IMH9
SK Hynix HFS001TEJ9X115N
3474 (3404.52min - 3474.32max) MB/s +7%
Lenovo Yoga Pro 9 16IMH9 RTX 4050
SK Hynix HFS001TEJ9X115N
3235 (3079.25min - 3234.86max) MB/s
Asus VivoBook Pro 16 K6602VU
Micron 2400 MTFDKBA1T0QFM
2433 (2278.56min - 2432.65max) MB/s -25%
HP Envy x360 2-in-1 16-ad0097nr
KIOXIA BG5 KBG50ZNV1T02
2320 (2187.12min - 2319.66max) MB/s -28%
seq q8 t1 read
Dell XPS 16 9640
Kioxia XG8 KXG80ZNV1T02
6985 (6183.66min - 6984.69max) MB/s +3%
Lenovo Yoga Pro 9 16IMH9 RTX 4050
SK Hynix HFS001TEJ9X115N
6782 (6122.14min - 6781.77max) MB/s
Lenovo Yoga Pro 9 16IMH9
SK Hynix HFS001TEJ9X115N
6257 (5307.47min - 6256.78max) MB/s -8%
Samsung Galaxy Book4 Ultra
Samsung PM9A1 MZVL2512HCJQ
5759 (4945.05min - 5758.78max) MB/s -15%
Asus VivoBook Pro 16 K6602VU
Micron 2400 MTFDKBA1T0QFM
4529 (3752.85min - 4529.22max) MB/s -33%
HP Envy x360 2-in-1 16-ad0097nr
KIOXIA BG5 KBG50ZNV1T02
2723 (2395.19min - 2722.52max) MB/s -60%
seq q8 t1 write
Lenovo Yoga Pro 9 16IMH9 RTX 4050
SK Hynix HFS001TEJ9X115N
6133 (6115.3min - 6133.12max) MB/s
Lenovo Yoga Pro 9 16IMH9
SK Hynix HFS001TEJ9X115N
6040 (5907.05min - 6040.01max) MB/s -2%
Dell XPS 16 9640
Kioxia XG8 KXG80ZNV1T02
5426 (5242.67min - 5425.96max) MB/s -12%
Samsung Galaxy Book4 Ultra
Samsung PM9A1 MZVL2512HCJQ
5032 (4977.28min - 5031.91max) MB/s -18%
Asus VivoBook Pro 16 K6602VU
Micron 2400 MTFDKBA1T0QFM
3154 (3143.42min - 3153.68max) MB/s -49%
HP Envy x360 2-in-1 16-ad0097nr
KIOXIA BG5 KBG50ZNV1T02
2939 (2905.25min - 2938.94max) MB/s -52%
4k q1 t1 read
Samsung Galaxy Book4 Ultra
Samsung PM9A1 MZVL2512HCJQ
78.3 (76.54min - 78.34max) MB/s +28%
Dell XPS 16 9640
Kioxia XG8 KXG80ZNV1T02
67.3 (66.55min - 67.32max) MB/s +10%
Lenovo Yoga Pro 9 16IMH9
SK Hynix HFS001TEJ9X115N
63.7 (63.29min - 63.65max) MB/s +4%
Lenovo Yoga Pro 9 16IMH9 RTX 4050
SK Hynix HFS001TEJ9X115N
61.3 (60.68min - 61.3max) MB/s
HP Envy x360 2-in-1 16-ad0097nr
KIOXIA BG5 KBG50ZNV1T02
52.5 (51.53min - 52.46max) MB/s -14%
Asus VivoBook Pro 16 K6602VU
Micron 2400 MTFDKBA1T0QFM
14.6 (12.18min - 14.59max) MB/s -76%
4k q1 t1 write
Dell XPS 16 9640
Kioxia XG8 KXG80ZNV1T02
214 (212.24min - 213.72max) MB/s +55%
Asus VivoBook Pro 16 K6602VU
Micron 2400 MTFDKBA1T0QFM
205 (179.98min - 205.28max) MB/s +49%
Samsung Galaxy Book4 Ultra
Samsung PM9A1 MZVL2512HCJQ
164.2 (156.89min - 164.15max) MB/s +19%
Lenovo Yoga Pro 9 16IMH9
SK Hynix HFS001TEJ9X115N
139.8 (135.84min - 139.76max) MB/s +1%
Lenovo Yoga Pro 9 16IMH9 RTX 4050
SK Hynix HFS001TEJ9X115N
137.8 (129.71min - 137.79max) MB/s
HP Envy x360 2-in-1 16-ad0097nr
KIOXIA BG5 KBG50ZNV1T02
136.5 (133.54min - 136.47max) MB/s -1%
4k q32 t16 read
Dell XPS 16 9640
Kioxia XG8 KXG80ZNV1T02
3811 (3808.17min - 3810.83max) MB/s +354%
Samsung Galaxy Book4 Ultra
Samsung PM9A1 MZVL2512HCJQ
2181 (2156.61min - 2181.46max) MB/s +160%
Asus VivoBook Pro 16 K6602VU
Micron 2400 MTFDKBA1T0QFM
1015 (955.09min - 1015.02max) MB/s +21%
Lenovo Yoga Pro 9 16IMH9
SK Hynix HFS001TEJ9X115N
859 (816.31min - 859.16max) MB/s +2%
HP Envy x360 2-in-1 16-ad0097nr
KIOXIA BG5 KBG50ZNV1T02
859 (846.09min - 858.76max) MB/s +2%
Lenovo Yoga Pro 9 16IMH9 RTX 4050
SK Hynix HFS001TEJ9X115N
839 (807.27min - 838.91max) MB/s
4k q32 t16 write
Samsung Galaxy Book4 Ultra
Samsung PM9A1 MZVL2512HCJQ
3101 (2756.05min - 3100.73max) MB/s +626%
Dell XPS 16 9640
Kioxia XG8 KXG80ZNV1T02
2682 (2675.9min - 2682.13max) MB/s +528%
Asus VivoBook Pro 16 K6602VU
Micron 2400 MTFDKBA1T0QFM
649 (615.74min - 649.21max) MB/s +52%
Lenovo Yoga Pro 9 16IMH9
SK Hynix HFS001TEJ9X115N
439 (405.1min - 438.82max) MB/s +3%
Lenovo Yoga Pro 9 16IMH9 RTX 4050
SK Hynix HFS001TEJ9X115N
427 (413.21min - 426.52max) MB/s
HP Envy x360 2-in-1 16-ad0097nr
KIOXIA BG5 KBG50ZNV1T02
384 (367.4min - 383.87max) MB/s -10%
AS SSD
Score Total
Dell XPS 16 9640
Kioxia XG8 KXG80ZNV1T02
8212 Points +32%
Samsung Galaxy Book4 Ultra
Samsung PM9A1 MZVL2512HCJQ
7043 Points +13%
Lenovo Yoga Pro 9 16IMH9 RTX 4050
SK Hynix HFS001TEJ9X115N
6217 Points
Lenovo Yoga Pro 9 16IMH9
SK Hynix HFS001TEJ9X115N
5214 Points -16%
Asus VivoBook Pro 16 K6602VU
Micron 2400 MTFDKBA1T0QFM
4175 Points -33%
HP Envy x360 2-in-1 16-ad0097nr
KIOXIA BG5 KBG50ZNV1T02
2449 Points -61%
Score Read
Dell XPS 16 9640
Kioxia XG8 KXG80ZNV1T02
3310 Points +131%
Samsung Galaxy Book4 Ultra
Samsung PM9A1 MZVL2512HCJQ
2413 Points +68%
Asus VivoBook Pro 16 K6602VU
Micron 2400 MTFDKBA1T0QFM
1675 Points +17%
Lenovo Yoga Pro 9 16IMH9 RTX 4050
SK Hynix HFS001TEJ9X115N
1434 Points
Lenovo Yoga Pro 9 16IMH9
SK Hynix HFS001TEJ9X115N
1397 Points -3%
HP Envy x360 2-in-1 16-ad0097nr
KIOXIA BG5 KBG50ZNV1T02
1151 Points -20%
Score Write
Lenovo Yoga Pro 9 16IMH9 RTX 4050
SK Hynix HFS001TEJ9X115N
4140 Points
Samsung Galaxy Book4 Ultra
Samsung PM9A1 MZVL2512HCJQ
3462 Points -16%
Dell XPS 16 9640
Kioxia XG8 KXG80ZNV1T02
3244 Points -22%
Lenovo Yoga Pro 9 16IMH9
SK Hynix HFS001TEJ9X115N
3190 Points -23%
Asus VivoBook Pro 16 K6602VU
Micron 2400 MTFDKBA1T0QFM
1707 Points -59%
HP Envy x360 2-in-1 16-ad0097nr
KIOXIA BG5 KBG50ZNV1T02
738 Points -82%
Seq Read
Dell XPS 16 9640
Kioxia XG8 KXG80ZNV1T02
5730 MB/s +6%
Lenovo Yoga Pro 9 16IMH9 RTX 4050
SK Hynix HFS001TEJ9X115N
5425.71 MB/s
Lenovo Yoga Pro 9 16IMH9
SK Hynix HFS001TEJ9X115N
5399 MB/s 0%
Samsung Galaxy Book4 Ultra
Samsung PM9A1 MZVL2512HCJQ
5351 MB/s -1%
Asus VivoBook Pro 16 K6602VU
Micron 2400 MTFDKBA1T0QFM
3615.69 MB/s -33%
HP Envy x360 2-in-1 16-ad0097nr
KIOXIA BG5 KBG50ZNV1T02
2597 MB/s -52%
Seq Write
Dell XPS 16 9640
Kioxia XG8 KXG80ZNV1T02
5175 MB/s +55%
Samsung Galaxy Book4 Ultra
Samsung PM9A1 MZVL2512HCJQ
3925 MB/s +18%
Lenovo Yoga Pro 9 16IMH9 RTX 4050
SK Hynix HFS001TEJ9X115N
3339.94 MB/s
Lenovo Yoga Pro 9 16IMH9
SK Hynix HFS001TEJ9X115N
3314 MB/s -1%
Asus VivoBook Pro 16 K6602VU
Micron 2400 MTFDKBA1T0QFM
2237.69 MB/s -33%
HP Envy x360 2-in-1 16-ad0097nr
KIOXIA BG5 KBG50ZNV1T02
1738.71 MB/s -48%
4K Read
Samsung Galaxy Book4 Ultra
Samsung PM9A1 MZVL2512HCJQ
65.3 MB/s +8%
Lenovo Yoga Pro 9 16IMH9
SK Hynix HFS001TEJ9X115N
64.2 MB/s +6%
Dell XPS 16 9640
Kioxia XG8 KXG80ZNV1T02
63.3 MB/s +5%
Lenovo Yoga Pro 9 16IMH9 RTX 4050
SK Hynix HFS001TEJ9X115N
60.33 MB/s
HP Envy x360 2-in-1 16-ad0097nr
KIOXIA BG5 KBG50ZNV1T02
52.79 MB/s -12%
Asus VivoBook Pro 16 K6602VU
Micron 2400 MTFDKBA1T0QFM
50.14 MB/s -17%
4K Write
Asus VivoBook Pro 16 K6602VU
Micron 2400 MTFDKBA1T0QFM
287.67 MB/s +58%
Dell XPS 16 9640
Kioxia XG8 KXG80ZNV1T02
191.9 MB/s +5%
Lenovo Yoga Pro 9 16IMH9
SK Hynix HFS001TEJ9X115N
183.8 MB/s +1%
Lenovo Yoga Pro 9 16IMH9 RTX 4050
SK Hynix HFS001TEJ9X115N
182.28 MB/s
HP Envy x360 2-in-1 16-ad0097nr
KIOXIA BG5 KBG50ZNV1T02
156.53 MB/s -14%
Samsung Galaxy Book4 Ultra
Samsung PM9A1 MZVL2512HCJQ
153.2 MB/s -16%
4K-64 Read
Dell XPS 16 9640
Kioxia XG8 KXG80ZNV1T02
2673 MB/s +222%
Samsung Galaxy Book4 Ultra
Samsung PM9A1 MZVL2512HCJQ
1813 MB/s +118%
Asus VivoBook Pro 16 K6602VU
Micron 2400 MTFDKBA1T0QFM
1263.15 MB/s +52%
HP Envy x360 2-in-1 16-ad0097nr
KIOXIA BG5 KBG50ZNV1T02
838.9 MB/s +1%
Lenovo Yoga Pro 9 16IMH9 RTX 4050
SK Hynix HFS001TEJ9X115N
831.2 MB/s
Lenovo Yoga Pro 9 16IMH9
SK Hynix HFS001TEJ9X115N
793 MB/s -5%
4K-64 Write
Lenovo Yoga Pro 9 16IMH9 RTX 4050
SK Hynix HFS001TEJ9X115N
3623.28 MB/s
Samsung Galaxy Book4 Ultra
Samsung PM9A1 MZVL2512HCJQ
2916 MB/s -20%
Lenovo Yoga Pro 9 16IMH9
SK Hynix HFS001TEJ9X115N
2675 MB/s -26%
Dell XPS 16 9640
Kioxia XG8 KXG80ZNV1T02
2535 MB/s -30%
Asus VivoBook Pro 16 K6602VU
Micron 2400 MTFDKBA1T0QFM
1195.4 MB/s -67%
HP Envy x360 2-in-1 16-ad0097nr
KIOXIA BG5 KBG50ZNV1T02
407.67 MB/s -89%
Access Time Read
Asus VivoBook Pro 16 K6602VU
Micron 2400 MTFDKBA1T0QFM
0.116 ms * -176%
HP Envy x360 2-in-1 16-ad0097nr
KIOXIA BG5 KBG50ZNV1T02
0.109 ms * -160%
Dell XPS 16 9640
Kioxia XG8 KXG80ZNV1T02
0.042 ms * -0%
Lenovo Yoga Pro 9 16IMH9 RTX 4050
SK Hynix HFS001TEJ9X115N
0.042 ms *
Samsung Galaxy Book4 Ultra
Samsung PM9A1 MZVL2512HCJQ
0.033 ms * +21%
Lenovo Yoga Pro 9 16IMH9
SK Hynix HFS001TEJ9X115N
0.021 ms * +50%
Access Time Write
Asus VivoBook Pro 16 K6602VU
Micron 2400 MTFDKBA1T0QFM
0.104 ms * -70%
HP Envy x360 2-in-1 16-ad0097nr
KIOXIA BG5 KBG50ZNV1T02
0.078 ms * -28%
Lenovo Yoga Pro 9 16IMH9 RTX 4050
SK Hynix HFS001TEJ9X115N
0.061 ms *
Samsung Galaxy Book4 Ultra
Samsung PM9A1 MZVL2512HCJQ
0.027 ms * +56%
Dell XPS 16 9640
Kioxia XG8 KXG80ZNV1T02
0.021 ms * +66%
Lenovo Yoga Pro 9 16IMH9
SK Hynix HFS001TEJ9X115N
0.02 ms * +67%

* ... im mniej tym lepiej

Disk Throttling: DiskSpd Read Loop, Queue Depth 8

036072010801440180021602520288032403600396043204680504054005760612064806840Tooltip
Lenovo Yoga Pro 9 16IMH9 RTX 4050; diskspd 2.0.17 f: Ø7096 (6421.43-7116.69)

Wydajność GPU

Wydajność graficzna jest lepsza niż oczekiwano, a wyniki 3DMark są o około 10 procent szybsze niż w przypadku przeciętnego laptopa w naszej bazie danych z tym samym procesorem graficznym GeForce RTX 4050. Przewagę tę można w dużej mierze przypisać wysokiemu docelowemu TGP od 75 W do 100 W w Lenovo, ponieważ większość innych laptopów z tym samym GPU ma niższe pułapy TGP. Podczas gdy panel sterowania Nvidii twierdzi, że całkowita moc grafiki wynosi 100 W dla RTX 4050, zazwyczaj stabilizuje się ona na poziomie około 75 W do 85 W podczas uruchamiania gier, czego przykładem jest nasza sekcja Stress Test powyżej.

Ogólna wydajność jest o około 25 do 30 procent wolniejsza niż w przypadku konfiguracji RTX 4070, która może osiągnąć wyższe zakresy mocy między 90 W a 100 W. Jest to ważne, aby zwrócić na to uwagę w poniższej sekcji dotyczącej zużycia energii w celu analizy wydajności w przeliczeniu na wat.

Profil zasilaniaWynik grafikiWynik fizykiŁączny wynik
Tryb wydajności228623062310234
Tryb zrównoważony21008 (-8%)29772 (-3%)8401 (-18%)
Zasilanie bateryjne20095 (-12%)30278 (-1%)7999 (-22%)

Praca w trybie zrównoważonym ma większy wpływ na wydajność GPU niż CPU, jak pokazuje nasza tabela wyników Fire Strike.

3DMark 11
3DMark 11
Steel Nomad
Steel Nomad
Speed Way
Speed Way
Time Spy
Time Spy
Port Royal
Port Royal
Fire Strike (Tryb wydajności)
3DMark Performance Rating - Percent
Lenovo Legion 9 16IRX9, RTX 4090 -2!
NVIDIA GeForce RTX 4090 Laptop GPU, Intel Core i9-14900HX
99.1 pt
Alienware m16 R1 AMD -1!
NVIDIA GeForce RTX 4080 Laptop GPU, AMD Ryzen 9 7845HX
95.6 pt
Lenovo Yoga Pro 9 16IMH9 -2!
NVIDIA GeForce RTX 4070 Laptop GPU, Intel Core Ultra 9 185H
63.9 pt
Lenovo Yoga Pro 9 16IMH9 RTX 4050
NVIDIA GeForce RTX 4050 Laptop GPU, Intel Core Ultra 9 185H
55 pt
HP Victus 16 (2024) -2!
NVIDIA GeForce RTX 4060 Laptop GPU, Intel Core i7-14700HX
54.4 pt
Average NVIDIA GeForce RTX 4050 Laptop GPU
 
53.9 pt
Dell XPS 16 9640 -2!
NVIDIA GeForce RTX 4070 Laptop GPU, Intel Core Ultra 7 155H
51 pt
Framework Laptop 16 -1!
AMD Radeon RX 7700S, AMD Ryzen 9 7940HS
50.6 pt
Asus ZenBook Pro 16X OLED UX7602ZM-ME115W -2!
NVIDIA GeForce RTX 3060 Laptop GPU, Intel Core i9-12900H
41.4 pt
Asus VivoBook Pro 16 K6602VU -1!
NVIDIA GeForce RTX 4050 Laptop GPU, Intel Core i9-13900H
40.2 pt
Samsung Galaxy Book4 Ultra -2!
NVIDIA GeForce RTX 4050 Laptop GPU, Intel Core Ultra 7 155H
33.9 pt
MSI Stealth 15M A11SEK -2!
NVIDIA GeForce RTX 2060 Max-Q, Intel Core i7-1185G7
29.2 pt
HP Pavilion Plus 16-ab0456tx -3!
NVIDIA GeForce RTX 3050 6GB Laptop GPU, Intel Core i7-13700H
26.9 pt
HP Envy x360 2-in-1 16-ad0097nr -1!
AMD Radeon 780M, AMD Ryzen 7 8840HS
13.3 pt
Lenovo Yoga 7 2-in-1 16IML9 -2!
Intel Graphics 4-Cores iGPU (Arc), Intel Core Ultra 5 125U
9.8 pt
3DMark 11 - 1280x720 Performance GPU
Lenovo Legion 9 16IRX9, RTX 4090
NVIDIA GeForce RTX 4090 Laptop GPU, Intel Core i9-14900HX
64341 Points +110%
Alienware m16 R1 AMD
NVIDIA GeForce RTX 4080 Laptop GPU, AMD Ryzen 9 7845HX
56373 Points +84%
Lenovo Yoga Pro 9 16IMH9
NVIDIA GeForce RTX 4070 Laptop GPU, Intel Core Ultra 9 185H
40646 Points +33%
Framework Laptop 16
AMD Radeon RX 7700S, AMD Ryzen 9 7940HS
37918 Points +24%
HP Victus 16 (2024)
NVIDIA GeForce RTX 4060 Laptop GPU, Intel Core i7-14700HX
35045 Points +14%
Dell XPS 16 9640
NVIDIA GeForce RTX 4070 Laptop GPU, Intel Core Ultra 7 155H
33251 Points +9%
Lenovo Yoga Pro 9 16IMH9 RTX 4050
NVIDIA GeForce RTX 4050 Laptop GPU, Intel Core Ultra 9 185H
30620 Points
Average NVIDIA GeForce RTX 4050 Laptop GPU
  (13339 - 32642, n=38)
28641 Points -6%
Asus VivoBook Pro 16 K6602VU
NVIDIA GeForce RTX 4050 Laptop GPU, Intel Core i9-13900H
27686 Points -10%
Asus ZenBook Pro 16X OLED UX7602ZM-ME115W
NVIDIA GeForce RTX 3060 Laptop GPU, Intel Core i9-12900H
27419 Points -10%
Samsung Galaxy Book4 Ultra
NVIDIA GeForce RTX 4050 Laptop GPU, Intel Core Ultra 7 155H
22216 Points -27%
MSI Stealth 15M A11SEK
NVIDIA GeForce RTX 2060 Max-Q, Intel Core i7-1185G7
18985 Points -38%
HP Pavilion Plus 16-ab0456tx
NVIDIA GeForce RTX 3050 6GB Laptop GPU, Intel Core i7-13700H
17421 Points -43%
HP Envy x360 2-in-1 16-ad0097nr
AMD Radeon 780M, AMD Ryzen 7 8840HS
12413 Points -59%
Lenovo Yoga 7 2-in-1 16IML9
Intel Graphics 4-Cores iGPU (Arc), Intel Core Ultra 5 125U
6711 Points -78%
3DMark
1920x1080 Fire Strike Graphics
Alienware m16 R1 AMD
NVIDIA GeForce RTX 4080 Laptop GPU, AMD Ryzen 9 7845HX
44782 Points +96%
Lenovo Legion 9 16IRX9, RTX 4090
NVIDIA GeForce RTX 4090 Laptop GPU, Intel Core i9-14900HX
43518 Points +90%
Lenovo Yoga Pro 9 16IMH9
NVIDIA GeForce RTX 4070 Laptop GPU, Intel Core Ultra 9 185H
30874 Points +35%
HP Victus 16 (2024)
NVIDIA GeForce RTX 4060 Laptop GPU, Intel Core i7-14700HX
26844 Points +17%
Framework Laptop 16
AMD Radeon RX 7700S, AMD Ryzen 9 7940HS
24246 Points +6%
Dell XPS 16 9640
NVIDIA GeForce RTX 4070 Laptop GPU, Intel Core Ultra 7 155H
24235 Points +6%
Lenovo Yoga Pro 9 16IMH9 RTX 4050
NVIDIA GeForce RTX 4050 Laptop GPU, Intel Core Ultra 9 185H
22862 Points
Average NVIDIA GeForce RTX 4050 Laptop GPU
  (13591 - 24007, n=36)
21155 Points -7%
Asus VivoBook Pro 16 K6602VU
NVIDIA GeForce RTX 4050 Laptop GPU, Intel Core i9-13900H
20359 Points -11%
Asus ZenBook Pro 16X OLED UX7602ZM-ME115W
NVIDIA GeForce RTX 3060 Laptop GPU, Intel Core i9-12900H
19496 Points -15%
Samsung Galaxy Book4 Ultra
NVIDIA GeForce RTX 4050 Laptop GPU, Intel Core Ultra 7 155H
16735 Points -27%
MSI Stealth 15M A11SEK
NVIDIA GeForce RTX 2060 Max-Q, Intel Core i7-1185G7
14129 Points -38%
HP Pavilion Plus 16-ab0456tx
NVIDIA GeForce RTX 3050 6GB Laptop GPU, Intel Core i7-13700H
11960 Points -48%
HP Envy x360 2-in-1 16-ad0097nr
AMD Radeon 780M, AMD Ryzen 7 8840HS
7357 Points -68%
Lenovo Yoga 7 2-in-1 16IML9
Intel Graphics 4-Cores iGPU (Arc), Intel Core Ultra 5 125U
4786 Points -79%
2560x1440 Time Spy Graphics
Lenovo Legion 9 16IRX9, RTX 4090
NVIDIA GeForce RTX 4090 Laptop GPU, Intel Core i9-14900HX
20416 Points +134%
Alienware m16 R1 AMD
NVIDIA GeForce RTX 4080 Laptop GPU, AMD Ryzen 9 7845HX
19365 Points +122%
Lenovo Yoga Pro 9 16IMH9
NVIDIA GeForce RTX 4070 Laptop GPU, Intel Core Ultra 9 185H
12181 Points +39%
Framework Laptop 16
AMD Radeon RX 7700S, AMD Ryzen 9 7940HS
10206 Points +17%
HP Victus 16 (2024)
NVIDIA GeForce RTX 4060 Laptop GPU, Intel Core i7-14700HX
9937 Points +14%
Dell XPS 16 9640
NVIDIA GeForce RTX 4070 Laptop GPU, Intel Core Ultra 7 155H
9638 Points +10%
Lenovo Yoga Pro 9 16IMH9 RTX 4050
NVIDIA GeForce RTX 4050 Laptop GPU, Intel Core Ultra 9 185H
8736 Points
Average NVIDIA GeForce RTX 4050 Laptop GPU
  (5107 - 9040, n=36)
7812 Points -11%
Asus ZenBook Pro 16X OLED UX7602ZM-ME115W
NVIDIA GeForce RTX 3060 Laptop GPU, Intel Core i9-12900H
7771 Points -11%
Asus VivoBook Pro 16 K6602VU
NVIDIA GeForce RTX 4050 Laptop GPU, Intel Core i9-13900H
7391 Points -15%
Samsung Galaxy Book4 Ultra
NVIDIA GeForce RTX 4050 Laptop GPU, Intel Core Ultra 7 155H
6073 Points -30%
MSI Stealth 15M A11SEK
NVIDIA GeForce RTX 2060 Max-Q, Intel Core i7-1185G7
5427 Points -38%
HP Envy x360 2-in-1 16-ad0097nr
AMD Radeon 780M, AMD Ryzen 7 8840HS
2591 Points -70%
Lenovo Yoga 7 2-in-1 16IML9
Intel Graphics 4-Cores iGPU (Arc), Intel Core Ultra 5 125U
1704 Points -80%
2560x1440 Speed Way Score
Alienware m16 R1 AMD
NVIDIA GeForce RTX 4080 Laptop GPU, AMD Ryzen 9 7845HX
4739 Points +190%
Average NVIDIA GeForce RTX 4050 Laptop GPU
  (1475 - 2078, n=14)
1876 Points +15%
Framework Laptop 16
AMD Radeon RX 7700S, AMD Ryzen 9 7940HS
1869 Points +14%
Asus VivoBook Pro 16 K6602VU
NVIDIA GeForce RTX 4050 Laptop GPU, Intel Core i9-13900H
1705 Points +4%
Lenovo Yoga Pro 9 16IMH9 RTX 4050
NVIDIA GeForce RTX 4050 Laptop GPU, Intel Core Ultra 9 185H
1635 Points
HP Envy x360 2-in-1 16-ad0097nr
AMD Radeon 780M, AMD Ryzen 7 8840HS
236 Points -86%
Steel Nomad Score
Average NVIDIA GeForce RTX 4050 Laptop GPU
  (1846 - 1873, n=2)
1860 Points +1%
Lenovo Yoga Pro 9 16IMH9 RTX 4050
NVIDIA GeForce RTX 4050 Laptop GPU, Intel Core Ultra 9 185H
1846 Points
3DMark 11 Performance
28139 pkt.
3DMark Fire Strike Score
21063 pkt.
3DMark Time Spy Score
9125 pkt.
3DMark Steel Nomad Score
1846 pkt.
Pomoc
Blender
v3.3 Classroom OPTIX/RTX
HP Pavilion Plus 16-ab0456tx
NVIDIA GeForce RTX 3050 6GB Laptop GPU, Intel Core i7-13700H
68 Seconds * -162%
Asus ZenBook Pro 16X OLED UX7602ZM-ME115W
NVIDIA GeForce RTX 3060 Laptop GPU, Intel Core i9-12900H
37 Seconds * -42%
Samsung Galaxy Book4 Ultra
NVIDIA GeForce RTX 4050 Laptop GPU, Intel Core Ultra 7 155H
32 Seconds * -23%
Asus VivoBook Pro 16 K6602VU
NVIDIA GeForce RTX 4050 Laptop GPU, Intel Core i9-13900H
29 Seconds * -12%
Average NVIDIA GeForce RTX 4050 Laptop GPU
  (25 - 37, n=37)
28.8 Seconds * -11%
Lenovo Yoga Pro 9 16IMH9 RTX 4050
NVIDIA GeForce RTX 4050 Laptop GPU, Intel Core Ultra 9 185H
26 Seconds *
HP Victus 16 (2024)
NVIDIA GeForce RTX 4060 Laptop GPU, Intel Core i7-14700HX
22 Seconds * +15%
Dell XPS 16 9640
NVIDIA GeForce RTX 4070 Laptop GPU, Intel Core Ultra 7 155H
21 Seconds * +19%
Lenovo Yoga Pro 9 16IMH9
NVIDIA GeForce RTX 4070 Laptop GPU, Intel Core Ultra 9 185H
19 Seconds * +27%
Alienware m16 R1 AMD
NVIDIA GeForce RTX 4080 Laptop GPU, AMD Ryzen 9 7845HX
16 Seconds * +38%
Lenovo Legion 9 16IRX9, RTX 4090
NVIDIA GeForce RTX 4090 Laptop GPU, Intel Core i9-14900HX
13 Seconds * +50%
v3.3 Classroom CUDA
HP Pavilion Plus 16-ab0456tx
NVIDIA GeForce RTX 3050 6GB Laptop GPU, Intel Core i7-13700H
107 Seconds * -118%
Asus ZenBook Pro 16X OLED UX7602ZM-ME115W
NVIDIA GeForce RTX 3060 Laptop GPU, Intel Core i9-12900H
62 Seconds * -27%
Average NVIDIA GeForce RTX 4050 Laptop GPU
  (47 - 175, n=37)
56.2 Seconds * -15%
Samsung Galaxy Book4 Ultra
NVIDIA GeForce RTX 4050 Laptop GPU, Intel Core Ultra 7 155H
56 Seconds * -14%
Asus VivoBook Pro 16 K6602VU
NVIDIA GeForce RTX 4050 Laptop GPU, Intel Core i9-13900H
53 Seconds * -8%
Lenovo Yoga Pro 9 16IMH9 RTX 4050
NVIDIA GeForce RTX 4050 Laptop GPU, Intel Core Ultra 9 185H
49 Seconds *
HP Victus 16 (2024)
NVIDIA GeForce RTX 4060 Laptop GPU, Intel Core i7-14700HX
41 Seconds * +16%
Dell XPS 16 9640
NVIDIA GeForce RTX 4070 Laptop GPU, Intel Core Ultra 7 155H
36 Seconds * +27%
Lenovo Yoga Pro 9 16IMH9
NVIDIA GeForce RTX 4070 Laptop GPU, Intel Core Ultra 9 185H
32 Seconds * +35%
Alienware m16 R1 AMD
NVIDIA GeForce RTX 4080 Laptop GPU, AMD Ryzen 9 7845HX
23 Seconds * +53%
Lenovo Legion 9 16IRX9, RTX 4090
NVIDIA GeForce RTX 4090 Laptop GPU, Intel Core i9-14900HX
18 Seconds * +63%
v3.3 Classroom CPU
Lenovo Yoga 7 2-in-1 16IML9
Intel Graphics 4-Cores iGPU (Arc), Intel Core Ultra 5 125U
648 Seconds * -124%
HP Envy x360 2-in-1 16-ad0097nr
AMD Radeon 780M, AMD Ryzen 7 8840HS
405 Seconds * -40%
Average NVIDIA GeForce RTX 4050 Laptop GPU
  (243 - 907, n=37)
395 Seconds * -37%
HP Pavilion Plus 16-ab0456tx
NVIDIA GeForce RTX 3050 6GB Laptop GPU, Intel Core i7-13700H
384 Seconds * -33%
Samsung Galaxy Book4 Ultra
NVIDIA GeForce RTX 4050 Laptop GPU, Intel Core Ultra 7 155H
380 Seconds * -31%
Asus VivoBook Pro 16 K6602VU
NVIDIA GeForce RTX 4050 Laptop GPU, Intel Core i9-13900H
377 Seconds * -30%
Asus ZenBook Pro 16X OLED UX7602ZM-ME115W
NVIDIA GeForce RTX 3060 Laptop GPU, Intel Core i9-12900H
315 Seconds * -9%
HP Victus 16 (2024)
NVIDIA GeForce RTX 4060 Laptop GPU, Intel Core i7-14700HX
312 Seconds * -8%
Framework Laptop 16
AMD Radeon RX 7700S, AMD Ryzen 9 7940HS
311 Seconds * -8%
Dell XPS 16 9640
NVIDIA GeForce RTX 4070 Laptop GPU, Intel Core Ultra 7 155H
306 Seconds * -6%
Lenovo Yoga Pro 9 16IMH9 RTX 4050
NVIDIA GeForce RTX 4050 Laptop GPU, Intel Core Ultra 9 185H
289 Seconds *
Lenovo Yoga Pro 9 16IMH9
NVIDIA GeForce RTX 4070 Laptop GPU, Intel Core Ultra 9 185H
285 Seconds * +1%
Lenovo Legion 9 16IRX9, RTX 4090
NVIDIA GeForce RTX 4090 Laptop GPU, Intel Core i9-14900HX
193 Seconds * +33%
Alienware m16 R1 AMD
NVIDIA GeForce RTX 4080 Laptop GPU, AMD Ryzen 9 7845HX
185 Seconds * +36%

* ... im mniej tym lepiej

Wydajność w grach

System jest wystarczająco wydajny, aby uruchomić wymagające gry, takie jak Cyberpunk 2077 w natywnej rozdzielczości 3200 x 2000 przy średnich lub niższych ustawieniach. Aby uzyskać najlepsze wyniki, zaleca się jednak włączenie DLSS, gdy tylko jest to możliwe, aby zwiększyć liczbę klatek na sekundę do ponad 60 FPS.

Performance Rating - Percent
Lenovo Yoga Pro 9 16IMH9
Intel Core Ultra 9 185H, NVIDIA GeForce RTX 4070 Laptop GPU
96.7 pt
Lenovo Yoga Pro 9 16IMH9 RTX 4050
Intel Core Ultra 9 185H, NVIDIA GeForce RTX 4050 Laptop GPU
80.6 pt
Asus VivoBook Pro 16 K6602VU
Intel Core i9-13900H, NVIDIA GeForce RTX 4050 Laptop GPU
77.8 pt
Dell XPS 16 9640
Intel Core Ultra 7 155H, NVIDIA GeForce RTX 4070 Laptop GPU
77.3 pt
Samsung Galaxy Book4 Ultra
Intel Core Ultra 7 155H, NVIDIA GeForce RTX 4050 Laptop GPU
63.8 pt
HP Envy x360 2-in-1 16-ad0097nr
AMD Ryzen 7 8840HS, AMD Radeon 780M
28.2 pt
The Witcher 3 - 1920x1080 Ultra Graphics & Postprocessing (HBAO+)
Lenovo Yoga Pro 9 16IMH9
Intel Core Ultra 9 185H, NVIDIA GeForce RTX 4070 Laptop GPU
107.8 (103min, 103P1) fps +29%
Dell XPS 16 9640
Intel Core Ultra 7 155H, NVIDIA GeForce RTX 4070 Laptop GPU
87.8 (77min, 83P1) fps +5%
Lenovo Yoga Pro 9 16IMH9 RTX 4050
Intel Core Ultra 9 185H, NVIDIA GeForce RTX 4050 Laptop GPU
83.7 (79min) fps
Asus VivoBook Pro 16 K6602VU
Intel Core i9-13900H, NVIDIA GeForce RTX 4050 Laptop GPU
76.6 (69min, 69.34P1) fps -8%
Samsung Galaxy Book4 Ultra
Intel Core Ultra 7 155H, NVIDIA GeForce RTX 4050 Laptop GPU
54.5 (51min, 52P1) fps -35%
HP Envy x360 2-in-1 16-ad0097nr
AMD Ryzen 7 8840HS, AMD Radeon 780M
28.8 (24min) fps -66%
Final Fantasy XV Benchmark - 1920x1080 High Quality
Lenovo Yoga Pro 9 16IMH9
Intel Core Ultra 9 185H, NVIDIA GeForce RTX 4070 Laptop GPU
115.7 fps +37%
Dell XPS 16 9640
Intel Core Ultra 7 155H, NVIDIA GeForce RTX 4070 Laptop GPU
93.1 fps +11%
Lenovo Yoga Pro 9 16IMH9 RTX 4050
Intel Core Ultra 9 185H, NVIDIA GeForce RTX 4050 Laptop GPU
84.2 fps
Asus VivoBook Pro 16 K6602VU
Intel Core i9-13900H, NVIDIA GeForce RTX 4050 Laptop GPU
75.6 fps -10%
Samsung Galaxy Book4 Ultra
Intel Core Ultra 7 155H, NVIDIA GeForce RTX 4050 Laptop GPU
56.7 fps -33%
HP Envy x360 2-in-1 16-ad0097nr
AMD Ryzen 7 8840HS, AMD Radeon 780M
25.2 fps -70%
Strange Brigade - 1920x1080 ultra AA:ultra AF:16
Lenovo Yoga Pro 9 16IMH9
Intel Core Ultra 9 185H, NVIDIA GeForce RTX 4070 Laptop GPU
213 fps +42%
Dell XPS 16 9640
Intel Core Ultra 7 155H, NVIDIA GeForce RTX 4070 Laptop GPU
175 fps +17%
Lenovo Yoga Pro 9 16IMH9 RTX 4050
Intel Core Ultra 9 185H, NVIDIA GeForce RTX 4050 Laptop GPU
150 (87.6min, 113.1P1) fps
Asus VivoBook Pro 16 K6602VU
Intel Core i9-13900H, NVIDIA GeForce RTX 4050 Laptop GPU
132 (22.5min, 102.9P1) fps -12%
Samsung Galaxy Book4 Ultra
Intel Core Ultra 7 155H, NVIDIA GeForce RTX 4050 Laptop GPU
113 fps -25%
HP Envy x360 2-in-1 16-ad0097nr
AMD Ryzen 7 8840HS, AMD Radeon 780M
42.2 (7.1min, 9.18P1) fps -72%
Dota 2 Reborn - 1920x1080 ultra (3/3) best looking
Lenovo Yoga Pro 9 16IMH9
Intel Core Ultra 9 185H, NVIDIA GeForce RTX 4070 Laptop GPU
139 (119.7min) fps 0%
Lenovo Yoga Pro 9 16IMH9 RTX 4050
Intel Core Ultra 9 185H, NVIDIA GeForce RTX 4050 Laptop GPU
138.5 (119.5min) fps
Samsung Galaxy Book4 Ultra
Intel Core Ultra 7 155H, NVIDIA GeForce RTX 4050 Laptop GPU
126.8 (108.1min) fps -8%
Asus VivoBook Pro 16 K6602VU
Intel Core i9-13900H, NVIDIA GeForce RTX 4050 Laptop GPU
126 (107.9min) fps -9%
Dell XPS 16 9640
Intel Core Ultra 7 155H, NVIDIA GeForce RTX 4070 Laptop GPU
89.7 (83.8min) fps -35%
HP Envy x360 2-in-1 16-ad0097nr
AMD Ryzen 7 8840HS, AMD Radeon 780M
65.4 (54.7min) fps -53%
X-Plane 11.11 - 1920x1080 high (fps_test=3)
Asus VivoBook Pro 16 K6602VU
Intel Core i9-13900H, NVIDIA GeForce RTX 4050 Laptop GPU
108.4 fps +21%
Lenovo Yoga Pro 9 16IMH9
Intel Core Ultra 9 185H, NVIDIA GeForce RTX 4070 Laptop GPU
90.5 fps +1%
Lenovo Yoga Pro 9 16IMH9 RTX 4050
Intel Core Ultra 9 185H, NVIDIA GeForce RTX 4050 Laptop GPU
89.4 fps
Dell XPS 16 9640
Intel Core Ultra 7 155H, NVIDIA GeForce RTX 4070 Laptop GPU
84.7 fps -5%
Dell XPS 16 9640
Intel Core Ultra 7 155H, NVIDIA GeForce RTX 4070 Laptop GPU
84.4 fps -6%
Samsung Galaxy Book4 Ultra
Intel Core Ultra 7 155H, NVIDIA GeForce RTX 4050 Laptop GPU
81.5 fps -9%
HP Envy x360 2-in-1 16-ad0097nr
AMD Ryzen 7 8840HS, AMD Radeon 780M
27.9 fps -69%
Baldur's Gate 3
1920x1080 High Preset
Lenovo Yoga Pro 9 16IMH9
Intel Core Ultra 9 185H, NVIDIA GeForce RTX 4070 Laptop GPU
119.9 fps +44%
Dell XPS 16 9640
Intel Core Ultra 7 155H, NVIDIA GeForce RTX 4070 Laptop GPU
93.5 fps +12%
Lenovo Yoga Pro 9 16IMH9 RTX 4050
Intel Core Ultra 9 185H, NVIDIA GeForce RTX 4050 Laptop GPU
83.5 fps
Framework Laptop 16
AMD Ryzen 9 7940HS, AMD Radeon RX 7700S
76.4 fps -9%
Average NVIDIA GeForce RTX 4050 Laptop GPU
  (49.8 - 83.5, n=7)
69.8 fps -16%
HP Envy x360 2-in-1 16-ad0097nr
AMD Ryzen 7 8840HS, AMD Radeon 780M
22.6 fps -73%
1920x1080 Ultra Preset
Lenovo Yoga Pro 9 16IMH9
Intel Core Ultra 9 185H, NVIDIA GeForce RTX 4070 Laptop GPU
117.7 fps +45%
Dell XPS 16 9640
Intel Core Ultra 7 155H, NVIDIA GeForce RTX 4070 Laptop GPU
91.8 fps +13%
Lenovo Yoga Pro 9 16IMH9 RTX 4050
Intel Core Ultra 9 185H, NVIDIA GeForce RTX 4050 Laptop GPU
81.3 fps
Framework Laptop 16
AMD Ryzen 9 7940HS, AMD Radeon RX 7700S
73.6 fps -9%
Average NVIDIA GeForce RTX 4050 Laptop GPU
  (48.3 - 81.3, n=7)
68.2 fps -16%
HP Envy x360 2-in-1 16-ad0097nr
AMD Ryzen 7 8840HS, AMD Radeon 780M
22.2 fps -73%
2560x1440 Ultra Preset
Lenovo Yoga Pro 9 16IMH9
Intel Core Ultra 9 185H, NVIDIA GeForce RTX 4070 Laptop GPU
79.8 fps +45%
Dell XPS 16 9640
Intel Core Ultra 7 155H, NVIDIA GeForce RTX 4070 Laptop GPU
63.8 fps +16%
Lenovo Yoga Pro 9 16IMH9 RTX 4050
Intel Core Ultra 9 185H, NVIDIA GeForce RTX 4050 Laptop GPU
55 fps
Framework Laptop 16
AMD Ryzen 9 7940HS, AMD Radeon RX 7700S
51.1 fps -7%
Average NVIDIA GeForce RTX 4050 Laptop GPU
  (32.4 - 55, n=5)
44.7 fps -19%
The Witcher 3
1920x1080 High Graphics & Postprocessing (Nvidia HairWorks Off)
Lenovo Legion 9 16IRX9, RTX 4090
Intel Core i9-14900HX, NVIDIA GeForce RTX 4090 Laptop GPU
370 fps +126%
Alienware m16 R1 AMD
AMD Ryzen 9 7845HX, NVIDIA GeForce RTX 4080 Laptop GPU
349.3 (321min) fps +113%
Lenovo Yoga Pro 9 16IMH9
Intel Core Ultra 9 185H, NVIDIA GeForce RTX 4070 Laptop GPU
242 fps +48%
Dell XPS 16 9640
Intel Core Ultra 7 155H, NVIDIA GeForce RTX 4070 Laptop GPU
195 fps +19%
HP Victus 16 (2024)
Intel Core i7-14700HX, NVIDIA GeForce RTX 4060 Laptop GPU
181.9 (147min) fps +11%
Lenovo Yoga Pro 9 16IMH9 RTX 4050
Intel Core Ultra 9 185H, NVIDIA GeForce RTX 4050 Laptop GPU
164 (156min) fps
Framework Laptop 16
AMD Ryzen 9 7940HS, AMD Radeon RX 7700S
147.1 (136min) fps -10%
Average NVIDIA GeForce RTX 4050 Laptop GPU
  (87 - 177, n=27)
146.1 fps -11%
Asus VivoBook Pro 16 K6602VU
Intel Core i9-13900H, NVIDIA GeForce RTX 4050 Laptop GPU
138.7 (123min, 123.66P1) fps -15%
Samsung Galaxy Book4 Ultra
Intel Core Ultra 7 155H, NVIDIA GeForce RTX 4050 Laptop GPU
121 fps -26%
Asus ZenBook Pro 16X OLED UX7602ZM-ME115W
Intel Core i9-12900H, NVIDIA GeForce RTX 3060 Laptop GPU
111 fps -32%
HP Pavilion Plus 16-ab0456tx
Intel Core i7-13700H, NVIDIA GeForce RTX 3050 6GB Laptop GPU
91.4 (81min, 81.66P1) fps -44%
MSI Stealth 15M A11SEK
Intel Core i7-1185G7, NVIDIA GeForce RTX 2060 Max-Q
88.9 (85min) fps -46%
HP Envy x360 2-in-1 16-ad0097nr
AMD Ryzen 7 8840HS, AMD Radeon 780M
47.6 (33min) fps -71%
Lenovo Yoga 7 2-in-1 16IML9
Intel Core Ultra 5 125U, Intel Graphics 4-Cores iGPU (Arc)
28.4 (25min) fps -83%
1920x1080 Ultra Graphics & Postprocessing (HBAO+)
Lenovo Legion 9 16IRX9, RTX 4090
Intel Core i9-14900HX, NVIDIA GeForce RTX 4090 Laptop GPU
203.4 fps +143%
Alienware m16 R1 AMD
AMD Ryzen 9 7845HX, NVIDIA GeForce RTX 4080 Laptop GPU
169.7 (161min) fps +103%
Lenovo Yoga Pro 9 16IMH9
Intel Core Ultra 9 185H, NVIDIA GeForce RTX 4070 Laptop GPU
107.8 (103min, 103P1) fps +29%
HP Victus 16 (2024)
Intel Core i7-14700HX, NVIDIA GeForce RTX 4060 Laptop GPU
99.9 (85min) fps +19%
Dell XPS 16 9640
Intel Core Ultra 7 155H, NVIDIA GeForce RTX 4070 Laptop GPU
87.8 (77min, 83P1) fps +5%
Framework Laptop 16
AMD Ryzen 9 7940HS, AMD Radeon RX 7700S
84 (79min) fps 0%
Lenovo Yoga Pro 9 16IMH9 RTX 4050
Intel Core Ultra 9 185H, NVIDIA GeForce RTX 4050 Laptop GPU
83.7 (79min) fps
Asus VivoBook Pro 16 K6602VU
Intel Core i9-13900H, NVIDIA GeForce RTX 4050 Laptop GPU
76.6 (69min, 69.34P1) fps -8%
Average NVIDIA GeForce RTX 4050 Laptop GPU
  (18.5 - 94.7, n=39)
75.4 fps -10%
Asus ZenBook Pro 16X OLED UX7602ZM-ME115W
Intel Core i9-12900H, NVIDIA GeForce RTX 3060 Laptop GPU
70 fps -16%
Samsung Galaxy Book4 Ultra
Intel Core Ultra 7 155H, NVIDIA GeForce RTX 4050 Laptop GPU
54.5 (51min, 52P1) fps -35%
MSI Stealth 15M A11SEK
Intel Core i7-1185G7, NVIDIA GeForce RTX 2060 Max-Q
51.2 (49min) fps -39%
HP Pavilion Plus 16-ab0456tx
Intel Core i7-13700H, NVIDIA GeForce RTX 3050 6GB Laptop GPU
50.1 (45min, 45P1) fps -40%
HP Envy x360 2-in-1 16-ad0097nr
AMD Ryzen 7 8840HS, AMD Radeon 780M
28.8 (24min) fps -66%
Lenovo Yoga 7 2-in-1 16IML9
Intel Core Ultra 5 125U, Intel Graphics 4-Cores iGPU (Arc)
15 (11min) fps -82%
2560x1440 Ultra Graphics & Postprocessing (HBAO+)
Lenovo Legion 9 16IRX9, RTX 4090
Intel Core i9-14900HX, NVIDIA GeForce RTX 4090 Laptop GPU
165 fps +170%
Lenovo Yoga Pro 9 16IMH9
Intel Core Ultra 9 185H, NVIDIA GeForce RTX 4070 Laptop GPU
89 fps +46%
Dell XPS 16 9640
Intel Core Ultra 7 155H, NVIDIA GeForce RTX 4070 Laptop GPU
73 fps +20%
Lenovo Yoga Pro 9 16IMH9 RTX 4050
Intel Core Ultra 9 185H, NVIDIA GeForce RTX 4050 Laptop GPU
61 (57min) fps
Asus VivoBook Pro 16 K6602VU
Intel Core i9-13900H, NVIDIA GeForce RTX 4050 Laptop GPU
56.1 (50min, 50.33P1) fps -8%
Average NVIDIA GeForce RTX 4050 Laptop GPU
  (39 - 61.3, n=7)
54.7 fps -10%
Samsung Galaxy Book4 Ultra
Intel Core Ultra 7 155H, NVIDIA GeForce RTX 4050 Laptop GPU
46 fps -25%
HP Pavilion Plus 16-ab0456tx
Intel Core i7-13700H, NVIDIA GeForce RTX 3050 6GB Laptop GPU
37 (32min, 32.33P1) fps -39%
Final Fantasy XV Benchmark
1920x1080 High Quality
Alienware m16 R1 AMD
AMD Ryzen 9 7845HX, NVIDIA GeForce RTX 4080 Laptop GPU
167.6 fps +99%
Lenovo Legion 9 16IRX9, RTX 4090
Intel Core i9-14900HX, NVIDIA GeForce RTX 4090 Laptop GPU
165.1 fps +96%
Lenovo Yoga Pro 9 16IMH9
Intel Core Ultra 9 185H, NVIDIA GeForce RTX 4070 Laptop GPU
115.7 fps +37%
HP Victus 16 (2024)
Intel Core i7-14700HX, NVIDIA GeForce RTX 4060 Laptop GPU
98.1 fps +17%
Dell XPS 16 9640
Intel Core Ultra 7 155H, NVIDIA GeForce RTX 4070 Laptop GPU
93.1 fps +11%
Lenovo Yoga Pro 9 16IMH9 RTX 4050
Intel Core Ultra 9 185H, NVIDIA GeForce RTX 4050 Laptop GPU
84.2 fps
Asus ZenBook Pro 16X OLED UX7602ZM-ME115W
Intel Core i9-12900H, NVIDIA GeForce RTX 3060 Laptop GPU
83.8 fps 0%
Average NVIDIA GeForce RTX 4050 Laptop GPU
  (15.5 - 122.3, n=36)
76.4 fps -9%
Asus VivoBook Pro 16 K6602VU
Intel Core i9-13900H, NVIDIA GeForce RTX 4050 Laptop GPU
75.6 fps -10%
Framework Laptop 16
AMD Ryzen 9 7940HS, AMD Radeon RX 7700S
74.8 fps -11%
Samsung Galaxy Book4 Ultra
Intel Core Ultra 7 155H, NVIDIA GeForce RTX 4050 Laptop GPU
56.7 fps -33%
MSI Stealth 15M A11SEK
Intel Core i7-1185G7, NVIDIA GeForce RTX 2060 Max-Q
55.7 fps -34%
HP Pavilion Plus 16-ab0456tx
Intel Core i7-13700H, NVIDIA GeForce RTX 3050 6GB Laptop GPU
52 fps -38%
HP Envy x360 2-in-1 16-ad0097nr
AMD Ryzen 7 8840HS, AMD Radeon 780M
25.2 fps -70%
Lenovo Yoga 7 2-in-1 16IML9
Intel Core Ultra 5 125U, Intel Graphics 4-Cores iGPU (Arc)
16.3 fps -81%
2560x1440 High Quality
Lenovo Legion 9 16IRX9, RTX 4090
Intel Core i9-14900HX, NVIDIA GeForce RTX 4090 Laptop GPU
142 fps +131%
Alienware m16 R1 AMD
AMD Ryzen 9 7845HX, NVIDIA GeForce RTX 4080 Laptop GPU
131.6 fps +114%
Lenovo Yoga Pro 9 16IMH9
Intel Core Ultra 9 185H, NVIDIA GeForce RTX 4070 Laptop GPU
85.6 fps +39%
Dell XPS 16 9640
Intel Core Ultra 7 155H, NVIDIA GeForce RTX 4070 Laptop GPU
70 fps +14%
Asus ZenBook Pro 16X OLED UX7602ZM-ME115W
Intel Core i9-12900H, NVIDIA GeForce RTX 3060 Laptop GPU
62.1 fps +1%
Lenovo Yoga Pro 9 16IMH9 RTX 4050
Intel Core Ultra 9 185H, NVIDIA GeForce RTX 4050 Laptop GPU
61.6 fps
Framework Laptop 16
AMD Ryzen 9 7940HS, AMD Radeon RX 7700S
54.5 fps -12%
Asus VivoBook Pro 16 K6602VU
Intel Core i9-13900H, NVIDIA GeForce RTX 4050 Laptop GPU
53.6 fps -13%
Average NVIDIA GeForce RTX 4050 Laptop GPU
  (9.85 - 62.3, n=20)
50.7 fps -18%
Samsung Galaxy Book4 Ultra
Intel Core Ultra 7 155H, NVIDIA GeForce RTX 4050 Laptop GPU
40.7 fps -34%
HP Pavilion Plus 16-ab0456tx
Intel Core i7-13700H, NVIDIA GeForce RTX 3050 6GB Laptop GPU
37.4 fps -39%
1920x1080 Standard Quality
Alienware m16 R1 AMD
AMD Ryzen 9 7845HX, NVIDIA GeForce RTX 4080 Laptop GPU
218 fps +79%
Lenovo Legion 9 16IRX9, RTX 4090
Intel Core i9-14900HX, NVIDIA GeForce RTX 4090 Laptop GPU
194.9 fps +60%
Lenovo Yoga Pro 9 16IMH9
Intel Core Ultra 9 185H, NVIDIA GeForce RTX 4070 Laptop GPU
156.2 fps +29%
HP Victus 16 (2024)
Intel Core i7-14700HX, NVIDIA GeForce RTX 4060 Laptop GPU
135.3 fps +11%
Dell XPS 16 9640
Intel Core Ultra 7 155H, NVIDIA GeForce RTX 4070 Laptop GPU
123.2 fps +1%
Lenovo Yoga Pro 9 16IMH9 RTX 4050
Intel Core Ultra 9 185H, NVIDIA GeForce RTX 4050 Laptop GPU
121.5 fps
Asus ZenBook Pro 16X OLED UX7602ZM-ME115W
Intel Core i9-12900H, NVIDIA GeForce RTX 3060 Laptop GPU
112.1 fps -8%
Asus VivoBook Pro 16 K6602VU
Intel Core i9-13900H, NVIDIA GeForce RTX 4050 Laptop GPU
107.2 fps -12%
Framework Laptop 16
AMD Ryzen 9 7940HS, AMD Radeon RX 7700S
106 fps -13%
Average NVIDIA GeForce RTX 4050 Laptop GPU
  (20 - 123.3, n=30)
105.3 fps -13%
Samsung Galaxy Book4 Ultra
Intel Core Ultra 7 155H, NVIDIA GeForce RTX 4050 Laptop GPU
77.8 fps -36%
MSI Stealth 15M A11SEK
Intel Core i7-1185G7, NVIDIA GeForce RTX 2060 Max-Q
74.1 fps -39%
HP Pavilion Plus 16-ab0456tx
Intel Core i7-13700H, NVIDIA GeForce RTX 3050 6GB Laptop GPU
70.9 fps -42%
HP Envy x360 2-in-1 16-ad0097nr
AMD Ryzen 7 8840HS, AMD Radeon 780M
34.1 fps -72%
Lenovo Yoga 7 2-in-1 16IML9
Intel Core Ultra 5 125U, Intel Graphics 4-Cores iGPU (Arc)
23 fps -81%
Dota 2 Reborn - 1920x1080 ultra (3/3) best looking
Alienware m16 R1 AMD
AMD Ryzen 9 7845HX, NVIDIA GeForce RTX 4080 Laptop GPU
164.7 (138.5min) fps +19%
Lenovo Legion 9 16IRX9, RTX 4090
Intel Core i9-14900HX, NVIDIA GeForce RTX 4090 Laptop GPU
164.5 (136min) fps +19%
HP Victus 16 (2024)
Intel Core i7-14700HX, NVIDIA GeForce RTX 4060 Laptop GPU
149.7 (130.4min) fps +8%
Lenovo Yoga Pro 9 16IMH9
Intel Core Ultra 9 185H, NVIDIA GeForce RTX 4070 Laptop GPU
139 (119.7min) fps 0%
Lenovo Yoga Pro 9 16IMH9 RTX 4050
Intel Core Ultra 9 185H, NVIDIA GeForce RTX 4050 Laptop GPU
138.5 (119.5min) fps
Framework Laptop 16
AMD Ryzen 9 7940HS, AMD Radeon RX 7700S
136.8 (116min) fps -1%
Asus ZenBook Pro 16X OLED UX7602ZM-ME115W
Intel Core i9-12900H, NVIDIA GeForce RTX 3060 Laptop GPU
135.1 (120.3min) fps -2%
Average NVIDIA GeForce RTX 4050 Laptop GPU
  (73.5 - 175.6, n=36)
131.9 fps -5%
Samsung Galaxy Book4 Ultra
Intel Core Ultra 7 155H, NVIDIA GeForce RTX 4050 Laptop GPU
126.8 (108.1min) fps -8%
Asus VivoBook Pro 16 K6602VU
Intel Core i9-13900H, NVIDIA GeForce RTX 4050 Laptop GPU
126 (107.9min) fps -9%
HP Pavilion Plus 16-ab0456tx
Intel Core i7-13700H, NVIDIA GeForce RTX 3050 6GB Laptop GPU
116.9 (102.4min) fps -16%
MSI Stealth 15M A11SEK
Intel Core i7-1185G7, NVIDIA GeForce RTX 2060 Max-Q
116 (101.7min) fps -16%
Dell XPS 16 9640
Intel Core Ultra 7 155H, NVIDIA GeForce RTX 4070 Laptop GPU
89.7 (83.8min) fps -35%
HP Envy x360 2-in-1 16-ad0097nr
AMD Ryzen 7 8840HS, AMD Radeon 780M
65.4 (54.7min) fps -53%
Lenovo Yoga 7 2-in-1 16IML9
Intel Core Ultra 5 125U, Intel Graphics 4-Cores iGPU (Arc)
57.6 (37.5min) fps -58%
X-Plane 11.11 - 1920x1080 high (fps_test=3)
Lenovo Legion 9 16IRX9, RTX 4090
Intel Core i9-14900HX, NVIDIA GeForce RTX 4090 Laptop GPU
125.6 fps +40%
Alienware m16 R1 AMD
AMD Ryzen 9 7845HX, NVIDIA GeForce RTX 4080 Laptop GPU
113.1 fps +27%
Asus VivoBook Pro 16 K6602VU
Intel Core i9-13900H, NVIDIA GeForce RTX 4050 Laptop GPU
108.4 fps +21%
HP Victus 16 (2024)
Intel Core i7-14700HX, NVIDIA GeForce RTX 4060 Laptop GPU
100.3 fps +12%
HP Pavilion Plus 16-ab0456tx
Intel Core i7-13700H, NVIDIA GeForce RTX 3050 6GB Laptop GPU
97.3 fps +9%
Asus ZenBook Pro 16X OLED UX7602ZM-ME115W
Intel Core i9-12900H, NVIDIA GeForce RTX 3060 Laptop GPU
94.7 fps +6%
Average NVIDIA GeForce RTX 4050 Laptop GPU
  (65 - 117, n=37)
92.9 fps +4%
Lenovo Yoga Pro 9 16IMH9
Intel Core Ultra 9 185H, NVIDIA GeForce RTX 4070 Laptop GPU
90.5 fps +1%
Lenovo Yoga Pro 9 16IMH9 RTX 4050
Intel Core Ultra 9 185H, NVIDIA GeForce RTX 4050 Laptop GPU
89.4 fps
Dell XPS 16 9640
Intel Core Ultra 7 155H, NVIDIA GeForce RTX 4070 Laptop GPU
84.7 fps -5%
Dell XPS 16 9640
Intel Core Ultra 7 155H, NVIDIA GeForce RTX 4070 Laptop GPU
84.4 fps -6%
Samsung Galaxy Book4 Ultra
Intel Core Ultra 7 155H, NVIDIA GeForce RTX 4050 Laptop GPU
81.5 fps -9%
MSI Stealth 15M A11SEK
Intel Core i7-1185G7, NVIDIA GeForce RTX 2060 Max-Q
75.6 fps -15%
Framework Laptop 16
AMD Ryzen 9 7940HS, AMD Radeon RX 7700S
65 fps -27%
HP Envy x360 2-in-1 16-ad0097nr
AMD Ryzen 7 8840HS, AMD Radeon 780M
27.9 fps -69%
Lenovo Yoga 7 2-in-1 16IML9
Intel Core Ultra 5 125U, Intel Graphics 4-Cores iGPU (Arc)
23.4 fps -74%
Tiny Tina's Wonderlands
1920x1080 High Preset (DX12)
Alienware m16 R1 AMD
AMD Ryzen 9 7845HX, NVIDIA GeForce RTX 4080 Laptop GPU
201.1 fps +116%
Lenovo Yoga Pro 9 16IMH9 RTX 4050
Intel Core Ultra 9 185H, NVIDIA GeForce RTX 4050 Laptop GPU
93.3 fps
Framework Laptop 16
AMD Ryzen 9 7940HS, AMD Radeon RX 7700S
92 fps -1%
Average NVIDIA GeForce RTX 4050 Laptop GPU
  (63.3 - 99.5, n=6)
86.5 fps -7%
HP Envy x360 2-in-1 16-ad0097nr
AMD Ryzen 7 8840HS, AMD Radeon 780M
24 fps -74%
Lenovo Yoga 7 2-in-1 16IML9
Intel Core Ultra 5 125U, Intel Graphics 4-Cores iGPU (Arc)
16.1 fps -83%
1920x1080 Badass Preset (DX12)
Alienware m16 R1 AMD
AMD Ryzen 9 7845HX, NVIDIA GeForce RTX 4080 Laptop GPU
160.8 fps +122%
Lenovo Yoga Pro 9 16IMH9 RTX 4050
Intel Core Ultra 9 185H, NVIDIA GeForce RTX 4050 Laptop GPU
72.3 fps
Framework Laptop 16
AMD Ryzen 9 7940HS, AMD Radeon RX 7700S
71.2 fps -2%
Average NVIDIA GeForce RTX 4050 Laptop GPU
  (49.8 - 77.3, n=6)
67.1 fps -7%
HP Envy x360 2-in-1 16-ad0097nr
AMD Ryzen 7 8840HS, AMD Radeon 780M
19.5 fps -73%
Lenovo Yoga 7 2-in-1 16IML9
Intel Core Ultra 5 125U, Intel Graphics 4-Cores iGPU (Arc)
12.7 fps -82%
2560x1440 Badass Preset (DX12)
Alienware m16 R1 AMD
AMD Ryzen 9 7845HX, NVIDIA GeForce RTX 4080 Laptop GPU
112.9 fps +128%
Lenovo Yoga Pro 9 16IMH9 RTX 4050
Intel Core Ultra 9 185H, NVIDIA GeForce RTX 4050 Laptop GPU
49.5 fps
Framework Laptop 16
AMD Ryzen 9 7940HS, AMD Radeon RX 7700S
47.3 fps -4%
Average NVIDIA GeForce RTX 4050 Laptop GPU
  (33.6 - 49.5, n=4)
42.8 fps -14%
Far Cry 5
1920x1080 High Preset AA:T
Lenovo Legion 9 16IRX9, RTX 4090
Intel Core i9-14900HX, NVIDIA GeForce RTX 4090 Laptop GPU
166 fps +37%
Alienware m16 R1 AMD
AMD Ryzen 9 7845HX, NVIDIA GeForce RTX 4080 Laptop GPU
141 (112min) fps +17%
Lenovo Yoga Pro 9 16IMH9
Intel Core Ultra 9 185H, NVIDIA GeForce RTX 4070 Laptop GPU
130 fps +7%
Framework Laptop 16
AMD Ryzen 9 7940HS, AMD Radeon RX 7700S
123 (106min) fps +2%
Dell XPS 16 9640
Intel Core Ultra 7 155H, NVIDIA GeForce RTX 4070 Laptop GPU
122 fps +1%
Lenovo Yoga Pro 9 16IMH9 RTX 4050
Intel Core Ultra 9 185H, NVIDIA GeForce RTX 4050 Laptop GPU
121 (87min) fps
Asus ZenBook Pro 16X OLED UX7602ZM-ME115W
Intel Core i9-12900H, NVIDIA GeForce RTX 3060 Laptop GPU
117 fps -3%
Average NVIDIA GeForce RTX 4050 Laptop GPU
  (51 - 135, n=23)
109.4 fps -10%
Asus VivoBook Pro 16 K6602VU
Intel Core i9-13900H, NVIDIA GeForce RTX 4050 Laptop GPU
107 (69min) fps -12%
Samsung Galaxy Book4 Ultra
Intel Core Ultra 7 155H, NVIDIA GeForce RTX 4050 Laptop GPU
88 fps -27%
HP Pavilion Plus 16-ab0456tx
Intel Core i7-13700H, NVIDIA GeForce RTX 3050 6GB Laptop GPU
82 (70min) fps -32%
HP Envy x360 2-in-1 16-ad0097nr
AMD Ryzen 7 8840HS, AMD Radeon 780M
33 (20min) fps -73%
Lenovo Yoga 7 2-in-1 16IML9
Intel Core Ultra 5 125U, Intel Graphics 4-Cores iGPU (Arc)
25 (22min) fps -79%
1920x1080 Ultra Preset AA:T
Lenovo Legion 9 16IRX9, RTX 4090
Intel Core i9-14900HX, NVIDIA GeForce RTX 4090 Laptop GPU
155 fps +37%
Alienware m16 R1 AMD
AMD Ryzen 9 7845HX, NVIDIA GeForce RTX 4080 Laptop GPU
136 (35min) fps +20%
Framework Laptop 16
AMD Ryzen 9 7940HS, AMD Radeon RX 7700S
117 (96min) fps +4%
Lenovo Yoga Pro 9 16IMH9
Intel Core Ultra 9 185H, NVIDIA GeForce RTX 4070 Laptop GPU
116 fps +3%
Dell XPS 16 9640
Intel Core Ultra 7 155H, NVIDIA GeForce RTX 4070 Laptop GPU
115 fps +2%
Lenovo Yoga Pro 9 16IMH9 RTX 4050
Intel Core Ultra 9 185H, NVIDIA GeForce RTX 4050 Laptop GPU
113 (82min) fps
Asus ZenBook Pro 16X OLED UX7602ZM-ME115W
Intel Core i9-12900H, NVIDIA GeForce RTX 3060 Laptop GPU
109 fps -4%
Asus VivoBook Pro 16 K6602VU
Intel Core i9-13900H, NVIDIA GeForce RTX 4050 Laptop GPU
104 (73min) fps -8%
Average NVIDIA GeForce RTX 4050 Laptop GPU
  (50 - 127, n=23)
102.5 fps -9%
Samsung Galaxy Book4 Ultra
Intel Core Ultra 7 155H, NVIDIA GeForce RTX 4050 Laptop GPU
80 fps -29%
HP Pavilion Plus 16-ab0456tx
Intel Core i7-13700H, NVIDIA GeForce RTX 3050 6GB Laptop GPU
76 (63min) fps -33%
HP Envy x360 2-in-1 16-ad0097nr
AMD Ryzen 7 8840HS, AMD Radeon 780M
31 (23min) fps -73%
Lenovo Yoga 7 2-in-1 16IML9
Intel Core Ultra 5 125U, Intel Graphics 4-Cores iGPU (Arc)
23 (20min) fps -80%
2560x1440 Ultra Preset AA:T
Lenovo Legion 9 16IRX9, RTX 4090
Intel Core i9-14900HX, NVIDIA GeForce RTX 4090 Laptop GPU
146 fps +70%
Alienware m16 R1 AMD
AMD Ryzen 9 7845HX, NVIDIA GeForce RTX 4080 Laptop GPU
131 (101min) fps +52%
Lenovo Yoga Pro 9 16IMH9
Intel Core Ultra 9 185H, NVIDIA GeForce RTX 4070 Laptop GPU
109 fps +27%
Dell XPS 16 9640
Intel Core Ultra 7 155H, NVIDIA GeForce RTX 4070 Laptop GPU
94 fps +9%
Lenovo Yoga Pro 9 16IMH9 RTX 4050
Intel Core Ultra 9 185H, NVIDIA GeForce RTX 4050 Laptop GPU
86 (78min) fps
Asus ZenBook Pro 16X OLED UX7602ZM-ME115W
Intel Core i9-12900H, NVIDIA GeForce RTX 3060 Laptop GPU
83 fps -3%
Framework Laptop 16
AMD Ryzen 9 7940HS, AMD Radeon RX 7700S
81 (65min) fps -6%
Average NVIDIA GeForce RTX 4050 Laptop GPU
  (47 - 88, n=14)
69.6 fps -19%
Asus VivoBook Pro 16 K6602VU
Intel Core i9-13900H, NVIDIA GeForce RTX 4050 Laptop GPU
68 (31min) fps -21%
Samsung Galaxy Book4 Ultra
Intel Core Ultra 7 155H, NVIDIA GeForce RTX 4050 Laptop GPU
58 fps -33%
HP Pavilion Plus 16-ab0456tx
Intel Core i7-13700H, NVIDIA GeForce RTX 3050 6GB Laptop GPU
52 (43min) fps -40%
Strange Brigade
1920x1080 high AA:high AF:8
Alienware m16 R1 AMD
AMD Ryzen 9 7845HX, NVIDIA GeForce RTX 4080 Laptop GPU
400 (149.3min, 286P1) fps +134%
Lenovo Legion 9 16IRX9, RTX 4090
Intel Core i9-14900HX, NVIDIA GeForce RTX 4090 Laptop GPU
387 (5min, 302P1) fps +126%
Lenovo Yoga Pro 9 16IMH9
Intel Core Ultra 9 185H, NVIDIA GeForce RTX 4070 Laptop GPU
244 fps +43%
HP Victus 16 (2024)
Intel Core i7-14700HX, NVIDIA GeForce RTX 4060 Laptop GPU
205 (68.3min, 145.6P1) fps +20%
Dell XPS 16 9640
Intel Core Ultra 7 155H, NVIDIA GeForce RTX 4070 Laptop GPU
202 fps +18%
Lenovo Yoga Pro 9 16IMH9 RTX 4050
Intel Core Ultra 9 185H, NVIDIA GeForce RTX 4050 Laptop GPU
170.9 (73.4min, 131.1P1) fps
Framework Laptop 16
AMD Ryzen 9 7940HS, AMD Radeon RX 7700S
167.4 (88.3min, 121P1) fps -2%
Asus ZenBook Pro 16X OLED UX7602ZM-ME115W
Intel Core i9-12900H, NVIDIA GeForce RTX 3060 Laptop GPU
160.9 (48min, 118P1) fps -6%
Average NVIDIA GeForce RTX 4050 Laptop GPU
  (105 - 178, n=30)
158.2 fps -7%
Asus VivoBook Pro 16 K6602VU
Intel Core i9-13900H, NVIDIA GeForce RTX 4050 Laptop GPU
151.6 (21.1min, 116.6P1) fps -11%
Samsung Galaxy Book4 Ultra
Intel Core Ultra 7 155H, NVIDIA GeForce RTX 4050 Laptop GPU
127 fps -26%
MSI Stealth 15M A11SEK
Intel Core i7-1185G7, NVIDIA GeForce RTX 2060 Max-Q
106 (59.6min, 80.8P1) fps -38%
HP Pavilion Plus 16-ab0456tx
Intel Core i7-13700H, NVIDIA GeForce RTX 3050 6GB Laptop GPU
91.9 (16.3min, 69.6P1) fps -46%
HP Envy x360 2-in-1 16-ad0097nr
AMD Ryzen 7 8840HS, AMD Radeon 780M
50.2 (8.3min, 15.8P1) fps -71%
Lenovo Yoga 7 2-in-1 16IML9
Intel Core Ultra 5 125U, Intel Graphics 4-Cores iGPU (Arc)
39.2 (10min, 24P1) fps -77%
1920x1080 ultra AA:ultra AF:16
Lenovo Legion 9 16IRX9, RTX 4090
Intel Core i9-14900HX, NVIDIA GeForce RTX 4090 Laptop GPU
369 (5min, 269P1) fps +146%
Alienware m16 R1 AMD
AMD Ryzen 9 7845HX, NVIDIA GeForce RTX 4080 Laptop GPU
357 (82.8min, 253P1) fps +138%
Lenovo Yoga Pro 9 16IMH9
Intel Core Ultra 9 185H, NVIDIA GeForce RTX 4070 Laptop GPU
213 fps +42%
HP Victus 16 (2024)
Intel Core i7-14700HX, NVIDIA GeForce RTX 4060 Laptop GPU
179 (76.4min, 130.3P1) fps +19%
Dell XPS 16 9640
Intel Core Ultra 7 155H, NVIDIA GeForce RTX 4070 Laptop GPU
175 fps +17%
Lenovo Yoga Pro 9 16IMH9 RTX 4050
Intel Core Ultra 9 185H, NVIDIA GeForce RTX 4050 Laptop GPU
150 (87.6min, 113.1P1) fps
Framework Laptop 16
AMD Ryzen 9 7940HS, AMD Radeon RX 7700S
143.9 (84.9min, 104.3P1) fps -4%
Asus ZenBook Pro 16X OLED UX7602ZM-ME115W
Intel Core i9-12900H, NVIDIA GeForce RTX 3060 Laptop GPU
139.1 (28min, 105.6P1) fps -7%
Average NVIDIA GeForce RTX 4050 Laptop GPU
  (21.2 - 156.6, n=35)
134.4 fps -10%
Asus VivoBook Pro 16 K6602VU
Intel Core i9-13900H, NVIDIA GeForce RTX 4050 Laptop GPU
132 (22.5min, 102.9P1) fps -12%
Samsung Galaxy Book4 Ultra
Intel Core Ultra 7 155H, NVIDIA GeForce RTX 4050 Laptop GPU
113 fps -25%
MSI Stealth 15M A11SEK
Intel Core i7-1185G7, NVIDIA GeForce RTX 2060 Max-Q
93.1 (26.4min, 73.6P1) fps -38%
HP Pavilion Plus 16-ab0456tx
Intel Core i7-13700H, NVIDIA GeForce RTX 3050 6GB Laptop GPU
80.5 (56.9min, 62P1) fps -46%
HP Envy x360 2-in-1 16-ad0097nr
AMD Ryzen 7 8840HS, AMD Radeon 780M
42.2 (7.1min, 9.18P1) fps -72%
Lenovo Yoga 7 2-in-1 16IML9
Intel Core Ultra 5 125U, Intel Graphics 4-Cores iGPU (Arc)
30.2 (7.6min, 10.6P1) fps -80%
2560x1440 ultra AA:ultra AF:16
Lenovo Legion 9 16IRX9, RTX 4090
Intel Core i9-14900HX, NVIDIA GeForce RTX 4090 Laptop GPU
290 (38.6min, 219P1) fps +191%
Alienware m16 R1 AMD
AMD Ryzen 9 7845HX, NVIDIA GeForce RTX 4080 Laptop GPU
248 (25.5min, 194.6P1) fps +149%
Lenovo Yoga Pro 9 16IMH9
Intel Core Ultra 9 185H, NVIDIA GeForce RTX 4070 Laptop GPU
139 fps +39%
Dell XPS 16 9640
Intel Core Ultra 7 155H, NVIDIA GeForce RTX 4070 Laptop GPU
116 fps +16%
Asus ZenBook Pro 16X OLED UX7602ZM-ME115W
Intel Core i9-12900H, NVIDIA GeForce RTX 3060 Laptop GPU
100.6 (37.1min, 79.1P1) fps +1%
Lenovo Yoga Pro 9 16IMH9 RTX 4050
Intel Core Ultra 9 185H, NVIDIA GeForce RTX 4050 Laptop GPU
99.7 (61.4min, 83.6P1) fps
Framework Laptop 16
AMD Ryzen 9 7940HS, AMD Radeon RX 7700S
91.9 (66min, 75.1P1) fps -8%
Average NVIDIA GeForce RTX 4050 Laptop GPU
  (11.7 - 100.7, n=16)
82.1 fps -18%
Samsung Galaxy Book4 Ultra
Intel Core Ultra 7 155H, NVIDIA GeForce RTX 4050 Laptop GPU
77 fps -23%
HP Pavilion Plus 16-ab0456tx
Intel Core i7-13700H, NVIDIA GeForce RTX 3050 6GB Laptop GPU
57.1 (43.7min, 46.1P1) fps -43%
F1 22
1920x1080 High Preset AA:T AF:16x
Alienware m16 R1 AMD
AMD Ryzen 9 7845HX, NVIDIA GeForce RTX 4080 Laptop GPU
285 (194min, 152P1) fps +66%
Lenovo Yoga Pro 9 16IMH9 RTX 4050
Intel Core Ultra 9 185H, NVIDIA GeForce RTX 4050 Laptop GPU
171.5 (109min, 116P1) fps
Framework Laptop 16
AMD Ryzen 9 7940HS, AMD Radeon RX 7700S
168 (142min, 123P1) fps -2%
Asus VivoBook Pro 16 K6602VU
Intel Core i9-13900H, NVIDIA GeForce RTX 4050 Laptop GPU
152.1 (101min, 92P1) fps -11%
Asus ZenBook Pro 16X OLED UX7602ZM-ME115W
Intel Core i9-12900H, NVIDIA GeForce RTX 3060 Laptop GPU
148.8 (124min, 81P1) fps -13%
Average NVIDIA GeForce RTX 4050 Laptop GPU
  (94.4 - 174.7, n=21)
145.6 fps -15%
HP Pavilion Plus 16-ab0456tx
Intel Core i7-13700H, NVIDIA GeForce RTX 3050 6GB Laptop GPU
109.5 (94min, 76P1) fps -36%
HP Envy x360 2-in-1 16-ad0097nr
AMD Ryzen 7 8840HS, AMD Radeon 780M
46 (39min, 32P1) fps -73%
1920x1080 Ultra High Preset AA:T AF:16x
Alienware m16 R1 AMD
AMD Ryzen 9 7845HX, NVIDIA GeForce RTX 4080 Laptop GPU
124.2 (106min, 80P1) fps +133%
Lenovo Yoga Pro 9 16IMH9 RTX 4050
Intel Core Ultra 9 185H, NVIDIA GeForce RTX 4050 Laptop GPU
53.4 (40min, 38P1) fps
Asus ZenBook Pro 16X OLED UX7602ZM-ME115W
Intel Core i9-12900H, NVIDIA GeForce RTX 3060 Laptop GPU
51.8 (44min, 43P1) fps -3%
Framework Laptop 16
AMD Ryzen 9 7940HS, AMD Radeon RX 7700S
47.7 (32min, 34P1) fps -11%
Average NVIDIA GeForce RTX 4050 Laptop GPU
  (10.9 - 56.4, n=23)
47.6 fps -11%
Asus VivoBook Pro 16 K6602VU
Intel Core i9-13900H, NVIDIA GeForce RTX 4050 Laptop GPU
47.5 (40min, 34P1) fps -11%
HP Pavilion Plus 16-ab0456tx
Intel Core i7-13700H, NVIDIA GeForce RTX 3050 6GB Laptop GPU
34 (29min, 24P1) fps -36%
HP Envy x360 2-in-1 16-ad0097nr
AMD Ryzen 7 8840HS, AMD Radeon 780M
12 (8min, 7P1) fps -78%
2560x1440 Ultra High Preset AA:T AF:16x
Alienware m16 R1 AMD
AMD Ryzen 9 7845HX, NVIDIA GeForce RTX 4080 Laptop GPU
78.1 (67min, 65P1) fps +130%
Lenovo Yoga Pro 9 16IMH9 RTX 4050
Intel Core Ultra 9 185H, NVIDIA GeForce RTX 4050 Laptop GPU
34 (27min, 26P1) fps
Framework Laptop 16
AMD Ryzen 9 7940HS, AMD Radeon RX 7700S
29.9 (20min, 21P1) fps -12%
Asus VivoBook Pro 16 K6602VU
Intel Core i9-13900H, NVIDIA GeForce RTX 4050 Laptop GPU
29.6 (24min, 22P1) fps -13%
Average NVIDIA GeForce RTX 4050 Laptop GPU
  (6.58 - 34, n=14)
27.9 fps -18%
HP Pavilion Plus 16-ab0456tx
Intel Core i7-13700H, NVIDIA GeForce RTX 3050 6GB Laptop GPU
20.1 (17min, 15P1) fps -41%
Asus ZenBook Pro 16X OLED UX7602ZM-ME115W
Intel Core i9-12900H, NVIDIA GeForce RTX 3060 Laptop GPU
14.4 (12min, 12P1) fps -58%
Cyberpunk 2077 2.1 Phantom Liberty
1920x1080 Medium Preset (FSR off)
Lenovo Yoga Pro 9 16IMH9
Intel Core Ultra 9 185H, NVIDIA GeForce RTX 4070 Laptop GPU
106.8 (53.2min) fps +34%
HP Victus 16 (2024)
Intel Core i7-14700HX, NVIDIA GeForce RTX 4060 Laptop GPU
90 (47.2min) fps +13%
Dell XPS 16 9640
Intel Core Ultra 7 155H, NVIDIA GeForce RTX 4070 Laptop GPU
87.6 (71.6min) fps +10%
Framework Laptop 16
AMD Ryzen 9 7940HS, AMD Radeon RX 7700S
80.5 (59.6min) fps +1%
Lenovo Yoga Pro 9 16IMH9 RTX 4050
Intel Core Ultra 9 185H, NVIDIA GeForce RTX 4050 Laptop GPU
79.6 (37.9min) fps
Average NVIDIA GeForce RTX 4050 Laptop GPU
  (50.1 - 88.6, n=6)
69.7 fps -12%
Samsung Galaxy Book4 Ultra
Intel Core Ultra 7 155H, NVIDIA GeForce RTX 4050 Laptop GPU
54.3 (46.9min) fps -32%
HP Pavilion Plus 16-ab0456tx
Intel Core i7-13700H, NVIDIA GeForce RTX 3050 6GB Laptop GPU
52.1 (27.1min) fps -35%
HP Envy x360 2-in-1 16-ad0097nr
AMD Ryzen 7 8840HS, AMD Radeon 780M
27.8 (15.3min) fps -65%
Lenovo Yoga 7 2-in-1 16IML9
Intel Core Ultra 5 125U, Intel Graphics 4-Cores iGPU (Arc)
16.9 (7.96min) fps -79%
1920x1080 High Preset (FSR off)
Lenovo Yoga Pro 9 16IMH9
Intel Core Ultra 9 185H, NVIDIA GeForce RTX 4070 Laptop GPU
90.5 (40.2min) fps +33%
HP Victus 16 (2024)
Intel Core i7-14700HX, NVIDIA GeForce RTX 4060 Laptop GPU
76.9 (24min) fps +13%
Dell XPS 16 9640
Intel Core Ultra 7 155H, NVIDIA GeForce RTX 4070 Laptop GPU
74.7 (62.9min) fps +10%
Framework Laptop 16
AMD Ryzen 9 7940HS, AMD Radeon RX 7700S
68.1 (47.8min) fps 0%
Lenovo Yoga Pro 9 16IMH9 RTX 4050
Intel Core Ultra 9 185H, NVIDIA GeForce RTX 4050 Laptop GPU
67.8 (32.7min) fps
Average NVIDIA GeForce RTX 4050 Laptop GPU
  (42.4 - 75, n=6)
59 fps -13%
Samsung Galaxy Book4 Ultra
Intel Core Ultra 7 155H, NVIDIA GeForce RTX 4050 Laptop GPU
45.7 (38.6min) fps -33%
HP Pavilion Plus 16-ab0456tx
Intel Core i7-13700H, NVIDIA GeForce RTX 3050 6GB Laptop GPU
43.2 (16.2min) fps -36%
HP Envy x360 2-in-1 16-ad0097nr
AMD Ryzen 7 8840HS, AMD Radeon 780M
22.1 (11min) fps -67%
Lenovo Yoga 7 2-in-1 16IML9
Intel Core Ultra 5 125U, Intel Graphics 4-Cores iGPU (Arc)
14.3 (3.34min) fps -79%
1920x1080 Ultra Preset (FSR off)
Lenovo Legion 9 16IRX9, RTX 4090
Intel Core i9-14900HX, NVIDIA GeForce RTX 4090 Laptop GPU
127 (70.6min) fps +118%
Lenovo Yoga Pro 9 16IMH9
Intel Core Ultra 9 185H, NVIDIA GeForce RTX 4070 Laptop GPU
76.9 (18min) fps +32%
HP Victus 16 (2024)
Intel Core i7-14700HX, NVIDIA GeForce RTX 4060 Laptop GPU
67.1 (20.8min) fps +15%
Dell XPS 16 9640
Intel Core Ultra 7 155H, NVIDIA GeForce RTX 4070 Laptop GPU
64.3 (53.3min) fps +10%
Framework Laptop 16
AMD Ryzen 9 7940HS, AMD Radeon RX 7700S
60.7 (46.5min) fps +4%
Lenovo Yoga Pro 9 16IMH9 RTX 4050
Intel Core Ultra 9 185H, NVIDIA GeForce RTX 4050 Laptop GPU
58.3 (14.6min) fps
Average NVIDIA GeForce RTX 4050 Laptop GPU
  (35.8 - 67.3, n=6)
51.1 fps -12%
Samsung Galaxy Book4 Ultra
Intel Core Ultra 7 155H, NVIDIA GeForce RTX 4050 Laptop GPU
39.4 (32.4min) fps -32%
HP Pavilion Plus 16-ab0456tx
Intel Core i7-13700H, NVIDIA GeForce RTX 3050 6GB Laptop GPU
36.9 (27.9min) fps -37%
HP Envy x360 2-in-1 16-ad0097nr
AMD Ryzen 7 8840HS, AMD Radeon 780M
19.1 (9.74min) fps -67%
Lenovo Yoga 7 2-in-1 16IML9
Intel Core Ultra 5 125U, Intel Graphics 4-Cores iGPU (Arc)
12.5 (2.72min) fps -79%
2560x1440 Ultra Preset (FSR off)
Lenovo Legion 9 16IRX9, RTX 4090
Intel Core i9-14900HX, NVIDIA GeForce RTX 4090 Laptop GPU
86 (70.4min) fps +136%
Lenovo Yoga Pro 9 16IMH9
Intel Core Ultra 9 185H, NVIDIA GeForce RTX 4070 Laptop GPU
47.8 (31.2min) fps +31%
Dell XPS 16 9640
Intel Core Ultra 7 155H, NVIDIA GeForce RTX 4070 Laptop GPU
39.6 (32.7min) fps +9%
Framework Laptop 16
AMD Ryzen 9 7940HS, AMD Radeon RX 7700S
37.3 (30.7min) fps +2%
Lenovo Yoga Pro 9 16IMH9 RTX 4050
Intel Core Ultra 9 185H, NVIDIA GeForce RTX 4050 Laptop GPU
36.4 (29.1min) fps
Average NVIDIA GeForce RTX 4050 Laptop GPU
  (20.6 - 40.6, n=5)
29.7 fps -18%
Samsung Galaxy Book4 Ultra
Intel Core Ultra 7 155H, NVIDIA GeForce RTX 4050 Laptop GPU
23.3 (19.7min) fps -36%
HP Pavilion Plus 16-ab0456tx
Intel Core i7-13700H, NVIDIA GeForce RTX 3050 6GB Laptop GPU
21.3 (16.2min) fps -41%

Witcher 3 FPS Chart

05101520253035404550556065707580Tooltip
Lenovo Yoga Pro 9 16IMH9 RTX 4050 Ultra 9 185H, NVIDIA GeForce RTX 4050 Laptop GPU: Ø75.9 (72-81)
lowmed.highultraQHD
The Witcher 3 (2015) 395.6 290.5 164 83.7 61
Dota 2 Reborn (2015) 174.6 148.7 145.1 138.5
Final Fantasy XV Benchmark (2018) 182.4 121.5 84.2 61.6
X-Plane 11.11 (2018) 134.8 117.7 89.4
Far Cry 5 (2018) 151 129 121 113 86
Strange Brigade (2018) 432 213 170.9 150 99.7
Tiny Tina's Wonderlands (2022) 181.1 141.8 93.3 72.3 49.5
F1 22 (2022) 221 219 171.5 53.4 34
Baldur's Gate 3 (2023) 112.3 91.9 83.5 81.3 55
Cyberpunk 2077 2.1 Phantom Liberty (2023) 101.9 79.6 67.8 58.3 36.4

Emisje

Hałas systemowy

Hałas wentylatorów jest niemal identyczny z tym, który zarejestrowaliśmy na wyższej konfiguracji RTX 4070, co sugeruje, że słabsza konfiguracja RTX 4050 nie jest cichsza pomimo wolniejszego GPU.

Profil hałasu wentylatora (Biały: Tło, Czerwony: System bezczynny, Niebieski: 3DMark 06, Pomarańczowy: Witcher 3, Zielony: Prime95+FurMark stress)

Hałas

luz
23.6 / 25.4 / 25.4 dB
obciążenie
44.2 / 52.6 dB
  red to green bar
 
 
30 dB
cichy
40 dB(A)
słyszalny
50 dB(A)
irytujący
 
min: dark, med: mid, max: light   Earthworks M23R, Arta (odległość 15 cm)   environment noise: 23.6 dB(A)
dB(A) 0102030405060708090Deep BassMiddle BassHigh BassLower RangeMidsHigher MidsLower HighsMid HighsUpper HighsSuper Highs2036.539.141.235.136.12528.727.229.129.527.33124.625.32725.926.44028.524.323.125.124.55025.526.421.721.627.26327.929.12422.524.48029.428.622.624.92910027.227.422.624.927.712531.830.921.121.827.916031.126.717.217.13820028.726.718.918.530.125033.126.717.315.532.331533.227.617.616.733.740033.529.317.814.636.750036.232.516.812.739.663036.932.915.710.939.480034.530.813.112.137100035.631.412.71038.7125035.431.211.89.638.9160035.931.811.79.739.3200035.231.211.810.138.9250036.131.512.910.539.8315038.133.713.110.741.7400038.133.81211.24250003935.212.311.542.5630040.433.612.111.644.5800036.12712.311.442.11000031.523.512.112.538.11250027.719.411.611.534.21600022.314.410.910.928.8SPL48.944.225.423.652.6N6.94.80.70.58.9median 35.2median 30.9median 12.9median 11.5median 38.7Delta3.12.52.32.53.3hearing rangehide median Fan NoiseLenovo Yoga Pro 9 16IMH9 RTX 4050
Lenovo Yoga Pro 9 16IMH9 RTX 4050
NVIDIA GeForce RTX 4050 Laptop GPU, Ultra 9 185H, SK Hynix HFS001TEJ9X115N
Lenovo Yoga Pro 9 16IMH9
NVIDIA GeForce RTX 4070 Laptop GPU, Ultra 9 185H, SK Hynix HFS001TEJ9X115N
HP Envy x360 2-in-1 16-ad0097nr
Radeon 780M, R7 8840HS, KIOXIA BG5 KBG50ZNV1T02
Dell XPS 16 9640
NVIDIA GeForce RTX 4070 Laptop GPU, Ultra 7 155H, Kioxia XG8 KXG80ZNV1T02
Samsung Galaxy Book4 Ultra
NVIDIA GeForce RTX 4050 Laptop GPU, Ultra 7 155H, Samsung PM9A1 MZVL2512HCJQ
Asus VivoBook Pro 16 K6602VU
NVIDIA GeForce RTX 4050 Laptop GPU, i9-13900H, Micron 2400 MTFDKBA1T0QFM
Noise
-2%
14%
0%
8%
-2%
off / environment *
23.6
24.3
-3%
22.9
3%
24.5
-4%
24.2
-3%
20.96
11%
Idle Minimum *
23.6
24.3
-3%
23
3%
24.5
-4%
24.2
-3%
25.28
-7%
Idle Average *
25.4
24.3
4%
23
9%
24.5
4%
24.2
5%
25.28
-0%
Idle Maximum *
25.4
25.8
-2%
23
9%
27.5
-8%
24.2
5%
25.28
-0%
Load Average *
44.2
48.1
-9%
23.8
46%
39.6
10%
37.9
14%
51.88
-17%
Witcher 3 ultra *
48.9
49.7
-2%
43.8
10%
49.7
-2%
41.7
15%
49
-0%
Load Maximum *
52.6
53.9
-2%
43.8
17%
49.7
6%
41.7
21%
51.8
2%

* ... im mniej tym lepiej

Temperatura

Gorące punkty mogą osiągnąć ponad 41 C podczas pracy z wymagającymi obciążeniami, co jest o kilka stopni niższe niż to, co zarejestrowaliśmy na Asus VivoBook Pro 16 z tą samą kartą graficzną RTX 4050.

Tylny układ wydechowy
Zasilacz AC osiąga ponad 56 C podczas grania
 39.8 °C41 °C39.6 °C 
 35 °C38.2 °C37.8 °C 
 29 °C29.6 °C29.2 °C 
maks. w ogóle: 41 °C
średnia: 35.5 °C
40.2 °C40.6 °C38.8 °C
30.2 °C38.4 °C31.4 °C
29.6 °C30 °C30.6 °C
maks. w ogóle: 40.6 °C
średnia: 34.4 °C
zasilacz  57.4 °C | temperatura otoczenia 20 °C | Fluke 62 Mini IR Thermometer
(±) The average temperature for the upper side under maximal load is 35.5 °C / 96 F, compared to the average of 33.9 °C / 93 F for the devices in the class Gaming.
(±) The maximum temperature on the upper side is 41 °C / 106 F, compared to the average of 40.5 °C / 105 F, ranging from 21.2 to 68.8 °C for the class Gaming.
(±) The bottom heats up to a maximum of 40.6 °C / 105 F, compared to the average of 43.2 °C / 110 F
(+) In idle usage, the average temperature for the upper side is 27.8 °C / 82 F, compared to the device average of 33.9 °C / 93 F.
(±) Playing The Witcher 3, the average temperature for the upper side is 33 °C / 91 F, compared to the device average of 33.9 °C / 93 F.
(+) The palmrests and touchpad are cooler than skin temperature with a maximum of 29.6 °C / 85.3 F and are therefore cool to the touch.
(±) The average temperature of the palmrest area of similar devices was 28.9 °C / 84 F (-0.7 °C / -1.3 F).
System bezczynny (góra)
System w stanie bezczynności (na dole)
Witcher 3 stres (góra)
Witcher 3 naprężenie (na dole)
Prime95+FurMark stres (góra)
Prime95+FurMark stress (na dole)
Lenovo Yoga Pro 9 16IMH9 RTX 4050
Intel Core Ultra 9 185H, NVIDIA GeForce RTX 4050 Laptop GPU
Lenovo Yoga Pro 9 16IMH9
Intel Core Ultra 9 185H, NVIDIA GeForce RTX 4070 Laptop GPU
HP Envy x360 2-in-1 16-ad0097nr
AMD Ryzen 7 8840HS, AMD Radeon 780M
Dell XPS 16 9640
Intel Core Ultra 7 155H, NVIDIA GeForce RTX 4070 Laptop GPU
Samsung Galaxy Book4 Ultra
Intel Core Ultra 7 155H, NVIDIA GeForce RTX 4050 Laptop GPU
Asus VivoBook Pro 16 K6602VU
Intel Core i9-13900H, NVIDIA GeForce RTX 4050 Laptop GPU
Heat
3%
-1%
8%
13%
-20%
Maximum Upper Side *
41
41.7
-2%
42.6
-4%
39.4
4%
38.5
6%
42.6
-4%
Maximum Bottom *
40.6
46.3
-14%
47.8
-18%
36.9
9%
41.2
-1%
48.4
-19%
Idle Upper Side *
30.2
26.2
13%
27.4
9%
28.2
7%
23.5
22%
39.4
-30%
Idle Bottom *
31.4
27.2
13%
27.8
11%
27.4
13%
24.1
23%
39.8
-27%

* ... im mniej tym lepiej

Głośniki

Szum różowy przy maksymalnej głośności
dB(A) 0102030405060708090Deep BassMiddle BassHigh BassLower RangeMidsHigher MidsLower HighsMid HighsUpper HighsSuper Highs2036.541.236.52527.529.127.53125.52725.54025.423.125.45041.521.741.56353.32453.38063.522.663.510067.922.667.912568.521.168.51607517.27520073.318.973.325073.317.373.331573.717.673.740075.617.875.650078.616.878.663077.515.777.580077.213.177.2100073.712.773.7125071.511.871.5160074.511.774.5200074.911.874.9250071.212.971.2315072.413.172.4400073.11273.1500069.612.369.663006812.168800069.112.369.1100006812.1681250063.411.663.41600062.410.962.4SPL85.525.485.5N740.774median 73.3median 12.9median 73.3Delta2.92.32.926.325.821.422.12624.925.127.622.532.523.448.72655.818.860.922.167.2267019.372.317.674.217.774.319.575.31571.711.871.311.27410.574.21072.710.17210.67210.97511.374.811.671.71269.71269.612.371.112.669.61270.111.269.824.784.70.666.6median 12median 71.73.42.2hearing rangehide median Pink NoiseLenovo Yoga Pro 9 16IMH9 RTX 4050Apple MacBook Pro 16 2021 M1 Pro
Frequency diagram (checkboxes can be checked and unchecked to compare devices)
Lenovo Yoga Pro 9 16IMH9 RTX 4050 audio analysis

(+) | speakers can play relatively loud (85.5 dB)
Bass 100 - 315 Hz
(+) | good bass - only 2.1% away from median
(+) | bass is linear (3.8% delta to prev. frequency)
Mids 400 - 2000 Hz
(+) | balanced mids - only 2.6% away from median
(+) | mids are linear (3.1% delta to prev. frequency)
Highs 2 - 16 kHz
(+) | balanced highs - only 3.1% away from median
(+) | highs are linear (3% delta to prev. frequency)
Overall 100 - 16.000 Hz
(+) | overall sound is linear (5.8% difference to median)
Compared to same class
» 0% of all tested devices in this class were better, 0% similar, 100% worse
» The best had a delta of 6%, average was 18%, worst was 132%
Compared to all devices tested
» 0% of all tested devices were better, 0% similar, 100% worse
» The best had a delta of 4%, average was 25%, worst was 134%

Apple MacBook Pro 16 2021 M1 Pro audio analysis

(+) | speakers can play relatively loud (84.7 dB)
Bass 100 - 315 Hz
(+) | good bass - only 3.8% away from median
(+) | bass is linear (5.2% delta to prev. frequency)
Mids 400 - 2000 Hz
(+) | balanced mids - only 1.3% away from median
(+) | mids are linear (2.1% delta to prev. frequency)
Highs 2 - 16 kHz
(+) | balanced highs - only 1.9% away from median
(+) | highs are linear (2.7% delta to prev. frequency)
Overall 100 - 16.000 Hz
(+) | overall sound is linear (4.6% difference to median)
Compared to same class
» 0% of all tested devices in this class were better, 0% similar, 100% worse
» The best had a delta of 5%, average was 18%, worst was 45%
Compared to all devices tested
» 0% of all tested devices were better, 0% similar, 100% worse
» The best had a delta of 4%, average was 25%, worst was 134%

Zarządzanie energią

Zużycie energii

Ogólny poziom zużycia energii jest bardzo zbliżony do tego, co zarejestrowaliśmy na wyższej konfiguracji Mini-LED RTX 4070. Podczas pracy Witcher 3na przykład, nasza konfiguracja z niższej półki zużywałaby średnio zaledwie 5 procent mniej, mimo że wiązałoby się to z 25-30-procentowym deficytem wydajności graficznej w porównaniu do RTX 4070. Wydajność w przeliczeniu na wat dość mocno faworyzuje zatem RTX 4070.

Użytkownicy powinni pamiętać, że zasilacz sieciowy ma moc znamionową tylko 170 W. Ponieważ gry wymagają już od 150 W do 160 W, próba ładowania laptopa podczas grania spowoduje bardzo wolne tempo ładowania.

zużycie 3DMark 06
zużycie 3DMark 06
Witcher 3 zużycie 1080p Ultra
Zużycie energii wzrosłoby do 183 W przez około 70 sekund podczas inicjowania stresu Prime95, po czym spadłoby i ustabilizowało się na poziomie 137 W ze względu na ograniczony potencjał Turbo Boost
Prime95+FurMark stres zainicjowany w 10s mark
Pobór mocy
wyłączony / stan wstrzymaniadarklight 0.07 / 1.1 W
luzdarkmidlight 9.9 / 16.6 / 29.2 W
obciążenie midlight 100.9 / 182.2 W
 color bar
Legenda: min: dark, med: mid, max: light        Metrahit Energy
Lenovo Yoga Pro 9 16IMH9 RTX 4050
Ultra 9 185H, NVIDIA GeForce RTX 4050 Laptop GPU, SK Hynix HFS001TEJ9X115N, IPS, 3200x2000, 16"
Lenovo Yoga Pro 9 16IMH9
Ultra 9 185H, NVIDIA GeForce RTX 4070 Laptop GPU, SK Hynix HFS001TEJ9X115N, Mini-LED, 3200x2000, 16"
HP Envy x360 2-in-1 16-ad0097nr
R7 8840HS, Radeon 780M, KIOXIA BG5 KBG50ZNV1T02, OLED, 2880x1800, 16"
Dell XPS 16 9640
Ultra 7 155H, NVIDIA GeForce RTX 4070 Laptop GPU, Kioxia XG8 KXG80ZNV1T02, OLED, 3840x2400, 16.3"
Samsung Galaxy Book4 Ultra
Ultra 7 155H, NVIDIA GeForce RTX 4050 Laptop GPU, Samsung PM9A1 MZVL2512HCJQ, OLED, 2880x1800, 16"
Asus VivoBook Pro 16 K6602VU
i9-13900H, NVIDIA GeForce RTX 4050 Laptop GPU, Micron 2400 MTFDKBA1T0QFM, OLED, 3200x2000, 16"
Power Consumption
-2%
57%
32%
47%
-8%
Idle Minimum *
9.9
10.3
-4%
5
49%
7.7
22%
4.8
52%
21.06
-113%
Idle Average *
16.6
21.9
-32%
6.2
63%
10.3
38%
7.5
55%
24.27
-46%
Idle Maximum *
29.2
22.4
23%
14.7
50%
10.6
64%
7.9
73%
25.12
14%
Load Average *
100.9
96.9
4%
49.9
51%
76.5
24%
79.3
21%
52.4
48%
Witcher 3 ultra *
151.8
159.6
-5%
54.5
64%
126.4
17%
79.2
48%
110.2
27%
Load Maximum *
182.2
173.8
5%
65
64%
138.5
24%
125
31%
146
20%

* ... im mniej tym lepiej

Power Consumption Witcher 3 / Stresstest

0102030405060708090100110120130140150160170180Tooltip
Lenovo Yoga Pro 9 16IMH9 RTX 4050 Ultra 9 185H, NVIDIA GeForce RTX 4050 Laptop GPU; Witcher 3 ultra: Ø151.8 (145-169.1)
Lenovo Yoga Pro 9 16IMH9 Ultra 9 185H, NVIDIA GeForce RTX 4070 Laptop GPU; Witcher 3 ultra: Ø159.6 (156.5-163.4)
Lenovo Yoga Pro 9 16IMH9 RTX 4050 Ultra 9 185H, NVIDIA GeForce RTX 4050 Laptop GPU; 1280x720 Prime95 28.10 and Furmark 1.25: Ø173.7 (157.8-182.2)
Lenovo Yoga Pro 9 16IMH9 Ultra 9 185H, NVIDIA GeForce RTX 4070 Laptop GPU; 1280x720 Prime95 28.10 and Furmark 1.25: Ø170.7 (163.8-173.8)
Lenovo Yoga Pro 9 16IMH9 RTX 4050 Ultra 9 185H, NVIDIA GeForce RTX 4050 Laptop GPU; Idle 150cd/m2: Ø11.9 (10.8-17.6)
Lenovo Yoga Pro 9 16IMH9 Ultra 9 185H, NVIDIA GeForce RTX 4070 Laptop GPU; Idle 150cd/m2: Ø14.3 (12.9-16.6)

Power Consumption external Monitor

0102030405060708090100110120130140150160170180Tooltip
Lenovo Yoga Pro 9 16IMH9 RTX 4050 Ultra 9 185H, NVIDIA GeForce RTX 4050 Laptop GPU; Prime95 V2810 Stress (external Monitor): Ø152.8 (135-182.7)
Lenovo Yoga Pro 9 16IMH9 Ultra 9 185H, NVIDIA GeForce RTX 4070 Laptop GPU; Prime95 V2810 Stress (external Monitor): Ø130.3 (112.3-166.6)
Lenovo Yoga Pro 9 16IMH9 RTX 4050 Ultra 9 185H, NVIDIA GeForce RTX 4050 Laptop GPU; Cinebench R15 Multi (external Monitor): Ø168 (159.3-174.6)
Lenovo Yoga Pro 9 16IMH9 Ultra 9 185H, NVIDIA GeForce RTX 4070 Laptop GPU; Cinebench R15 Multi (external Monitor): Ø156 (150.8-159.1)
Lenovo Yoga Pro 9 16IMH9 RTX 4050 Ultra 9 185H, NVIDIA GeForce RTX 4050 Laptop GPU; 1280x720 FurMark 1.19 GPU Stress Test (external Monitor): Ø161.1 (147-170.1)
Lenovo Yoga Pro 9 16IMH9 Ultra 9 185H, NVIDIA GeForce RTX 4070 Laptop GPU; 1280x720 FurMark 1.19 GPU Stress Test (external Monitor): Ø142.8 (135.5-155.9)
Lenovo Yoga Pro 9 16IMH9 RTX 4050 Ultra 9 185H, NVIDIA GeForce RTX 4050 Laptop GPU; 1920x1080 The Witcher 3 ultra (external Monitor): Ø148.1 (145-166.8)
Lenovo Yoga Pro 9 16IMH9 Ultra 9 185H, NVIDIA GeForce RTX 4070 Laptop GPU; 1920x1080 The Witcher 3 ultra (external Monitor): Ø149.6 (143.5-152.7)
Lenovo Yoga Pro 9 16IMH9 RTX 4050 Ultra 9 185H, NVIDIA GeForce RTX 4050 Laptop GPU; Idle 1min (external Monitor): Ø10.3 (8.95-16.1)
Lenovo Yoga Pro 9 16IMH9 Ultra 9 185H, NVIDIA GeForce RTX 4070 Laptop GPU; Idle 1min (external Monitor): Ø7.45 (3.47-11)

Żywotność baterii

Czas działania sieci WLAN w trybach Balanced i Optimus z wyświetlaczem ustawionym na 150 nitów trwałby mniej więcej tyle samo czasu, co droższa konfiguracja RTX 4070 Mini-LED. Wyniki są nieco zaskakujące, ponieważ mini-LED i GPU RTX 4070 mogą być bardziej energochłonne niż IPS i RTX 4050, ale dane mają sens, gdy weźmie się pod uwagę tryb Optimus i podobne ustawienia jasności podczas testów. 9-godzinny czas przeglądania jest nadal bardzo dobry dla 16-calowego laptopa multimedialnego z dyskretną grafiką, nawet jeśli jest nieco krótszy niż w przypadku konkurentów, takich jak Dell XPS 16 lub Samsung Galaxy Book4 Ultra.

Wydajność akumulatora
WiFi Websurfing
9h 00min
Lenovo Yoga Pro 9 16IMH9 RTX 4050
Ultra 9 185H, NVIDIA GeForce RTX 4050 Laptop GPU, 84 Wh
Lenovo Yoga Pro 9 16IMH9
Ultra 9 185H, NVIDIA GeForce RTX 4070 Laptop GPU, 84 Wh
HP Envy x360 2-in-1 16-ad0097nr
R7 8840HS, Radeon 780M, 68 Wh
Dell XPS 16 9640
Ultra 7 155H, NVIDIA GeForce RTX 4070 Laptop GPU, 99.5 Wh
Samsung Galaxy Book4 Ultra
Ultra 7 155H, NVIDIA GeForce RTX 4050 Laptop GPU, 76 Wh
Asus VivoBook Pro 16 K6602VU
i9-13900H, NVIDIA GeForce RTX 4050 Laptop GPU, 96 Wh
Czasy pracy
-3%
-15%
16%
21%
12%
WiFi v1.3
540
526
-3%
459
-15%
629
16%
656
21%
606
12%
H.264
692
988
1076
585
Load
73
116
87
78
Reader / Idle
935

Za

+ ponadprzeciętna wydajność GeForce RTX 4050
+ wysoka wydajność procesora
+ przyzwoite zintegrowane głośniki
+ łatwa do rozbudowy pamięć masowa

Przeciw

- nie jest cichsza niż konfiguracja RTX 4070
- bardzo wysokie temperatury CPU podczas grania
- droga; niska wydajność w przeliczeniu na dolara
- brak opcji G-Sync lub wyświetlacza OLED

Werdykt - jeden z najlepszych produktów Lenovo, jeśli chcą Państwo zapłacić

W recenzji: Lenovo Yoga Pro 9 16IMH9 RTX 4050

Yoga Pro 9 16IMH9 jest jak dotąd najbardziej imponującym modelem z tej serii, nawet w niższej konfiguracji bez grafiki RTX 4070 lub fantazyjnego ekranu mini-LED, aby być prawdziwą alternatywą dla XPS 16 lub MacBooka Pro 16. Jego wyświetlacz IPS, wydajność i rozmiar są konkurencyjne dla odpowiedników Dell lub Apple, a jednocześnie są łatwiejsze w serwisowaniu i mają prawdopodobnie lepszą klawiaturę niż XPS. Z pewnością możemy również docenić szerszą gamę portów, podczas gdy dwa konkurencyjne modele mają tylko USB-C.

Inne czynniki, takie jak żywotność baterii i hałas wentylatora, nie są zauważalnie dłuższe ani cichsze niż w przypadku wyższej konfiguracji RTX 4070.

Gotowy na AI Lenovo Yoga Pro 9 16IMH9 to nie tylko świetna alternatywa dla Dell XPS 16 lub MacBook Pro 16, ale także robi kilka rzeczy lepiej niż oba.

Cena detaliczna wynosząca 1700 USD za konfigurację RTX 4050 jest nieco wysoka, ponieważ laptopy do gier z tym samym GPU, takie jak MSI Thin GF63 lub Acer Nitro V można znaleźć za mniej niż 1000 USD każdy. W porównaniu do konkurencyjnych XPS 16 lub MacBook Pro 15, Lenovo jest jednak o kilkaset dolarów tańsze, aby być atrakcyjnym rozwiązaniem dla tych, którzy chcą zaoszczędzić trochę gotówki przy jednoczesnym zachowaniu najwyższej jakości wrażeń użytkownika.

Cena i dostępność

Best Buy obecnie wysyła konfigurację Lenovo Yoga Pro 9 16 w cenie 1700 USD.

Lenovo Yoga Pro 9 16IMH9 RTX 4050 - 06/06/2024 v7 (old)
Allen Ngo

Wykonanie
83 / 98 → 85%
Klawiatura
89%
Myszka
91%
Komunikacja
72 / 80 → 90%
Waga
62 / 10-66 → 93%
Akumulator
85 / 95 → 90%
Wyświetlacz
88%
Wydajność w grach
99%
Wydajność w programach użytkowych
97%
Temperatura
90 / 95 → 95%
Hałas
80 / 90 → 89%
Głośniki
98%
Kamerka
58 / 85 → 68%
Średnio
84%
92%
Gaming - Ważona średnia

Transparency

The selection of devices to be reviewed is made by our editorial team. The test sample was provided to the author as a loan by the manufacturer or retailer for the purpose of this review. The lender had no influence on this review, nor did the manufacturer receive a copy of this review before publication. There was no obligation to publish this review. We never accept compensation or payment in return for our reviews. As an independent media company, Notebookcheck is not subjected to the authority of manufacturers, retailers or publishers.

This is how Notebookcheck is testing

Every year, Notebookcheck independently reviews hundreds of laptops and smartphones using standardized procedures to ensure that all results are comparable. We have continuously developed our test methods for around 20 years and set industry standards in the process. In our test labs, high-quality measuring equipment is utilized by experienced technicians and editors. These tests involve a multi-stage validation process. Our complex rating system is based on hundreds of well-founded measurements and benchmarks, which maintains objectivity. Further information on our test methods can be found here.

Price comparison

Please share our article, every link counts!
Mail Logo
> laptopy testy i recenzje notebooki > Laptopy > Recenzja laptopa Lenovo Yoga Pro 9 16IMH9: 75 W GeForce RTX 4050 osiąga ponadprzeciętne wyniki
Allen Ngo, 2024-06-10 (Update: 2024-06-10)